hypothesis testing - mshum/stats/lect8.pdf · in hypothesis testing, you are interested in testing...
TRANSCRIPT

Hypothesis Testing
CB: chapter 8; section 10.3
���
Hypothesis: statement about an unknown population parameter
Examples: The average age of males in Sweden is 27. (statement about populationmean)The lowest time it takes to run 30 miles is 2 hours. (statement about populationmax)Stocks are more volatile than bonds. (statement about variances of stock and bondreturns)
In hypothesis testing, you are interested in testing between two mutually exclusive hy-potheses, called the null hypothesis (denoted H0) and the alternative hypothesis(denoted H1).
H0 and H1 are complementary hypotheses, in the following sense:
If the parameter being hypothesized about is θ, and the parameter space (i.e., possiblevalues for θ) is Θ, then the null and alternative hypotheses form a partition of Θ:
H0: θ ∈ Θ0 ⊂ ΘH1: θ ∈ Θc
0 (the complement of Θ0 in Θ).
Examples:
1. H0 : θ = 0 vs. H1 : θ 6= 0
2. H0 : θ ≤ 0 vs. H1 : θ > 0
1 Definitions of test statistics
A test statistic, similarly to an estimator, is just some real-valued function Tn ≡T (X1, . . . , Xn) of your data sample X1, . . . , Xn. Clearly, a test statistic is a randomvariable.
A test is a function mapping values of the test statistic into {0, 1}, where
• “0” implies that you accept the null hypothesis H0 ⇔ reject the alternativehypothesis H1.
• “1” implies that you reject the null hypothesis H0 ⇔ accept the alternativehypothesis H1.
1
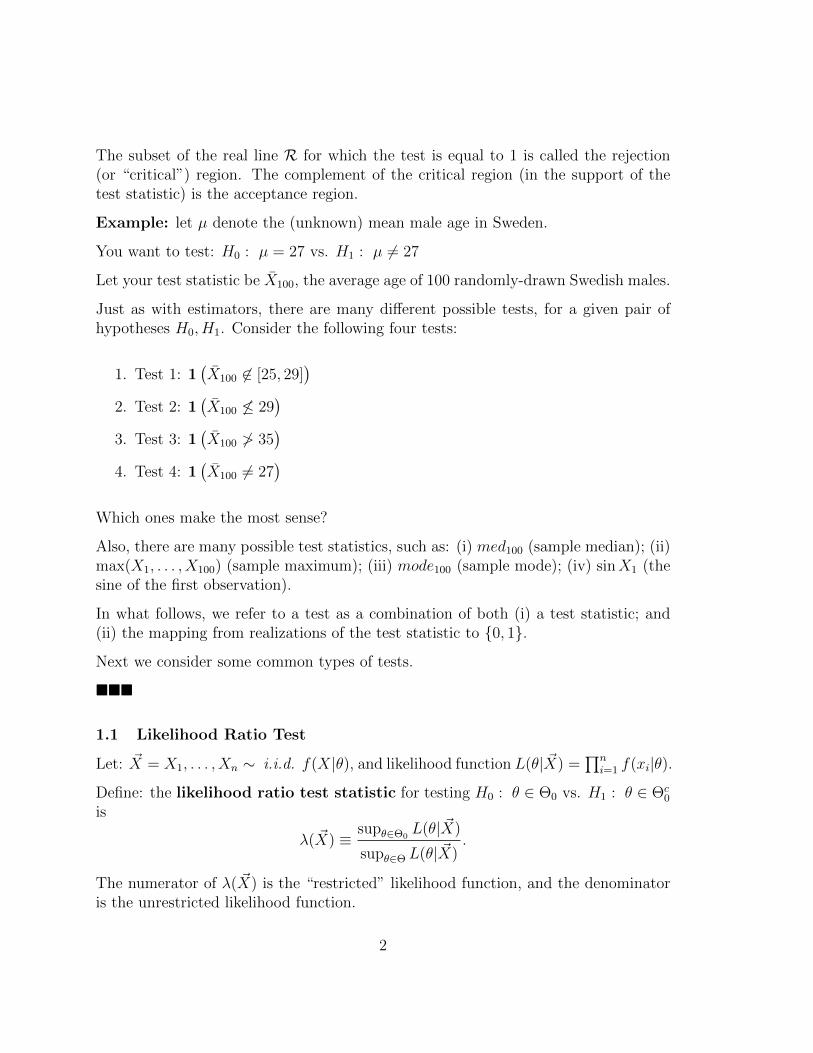
The subset of the real line R for which the test is equal to 1 is called the rejection(or “critical”) region. The complement of the critical region (in the support of thetest statistic) is the acceptance region.
Example: let µ denote the (unknown) mean male age in Sweden.
You want to test: H0 : µ = 27 vs. H1 : µ 6= 27
Let your test statistic be X̄100, the average age of 100 randomly-drawn Swedish males.
Just as with estimators, there are many different possible tests, for a given pair ofhypotheses H0, H1. Consider the following four tests:
1. Test 1: 1(X̄100 6∈ [25, 29]
)2. Test 2: 1
(X̄100 6≤ 29
)3. Test 3: 1
(X̄100 6> 35
)4. Test 4: 1
(X̄100 6= 27
)Which ones make the most sense?
Also, there are many possible test statistics, such as: (i) med100 (sample median); (ii)max(X1, . . . , X100) (sample maximum); (iii) mode100 (sample mode); (iv) sinX1 (thesine of the first observation).
In what follows, we refer to a test as a combination of both (i) a test statistic; and(ii) the mapping from realizations of the test statistic to {0, 1}.
Next we consider some common types of tests.
���
1.1 Likelihood Ratio Test
Let: ~X = X1, . . . , Xn ∼ i.i.d. f(X|θ), and likelihood function L(θ| ~X) =∏n
i=1 f(xi|θ).
Define: the likelihood ratio test statistic for testing H0 : θ ∈ Θ0 vs. H1 : θ ∈ Θc0
is
λ( ~X) ≡supθ∈Θ0
L(θ| ~X)
supθ∈Θ L(θ| ~X).
The numerator of λ( ~X) is the “restricted” likelihood function, and the denominatoris the unrestricted likelihood function.
2
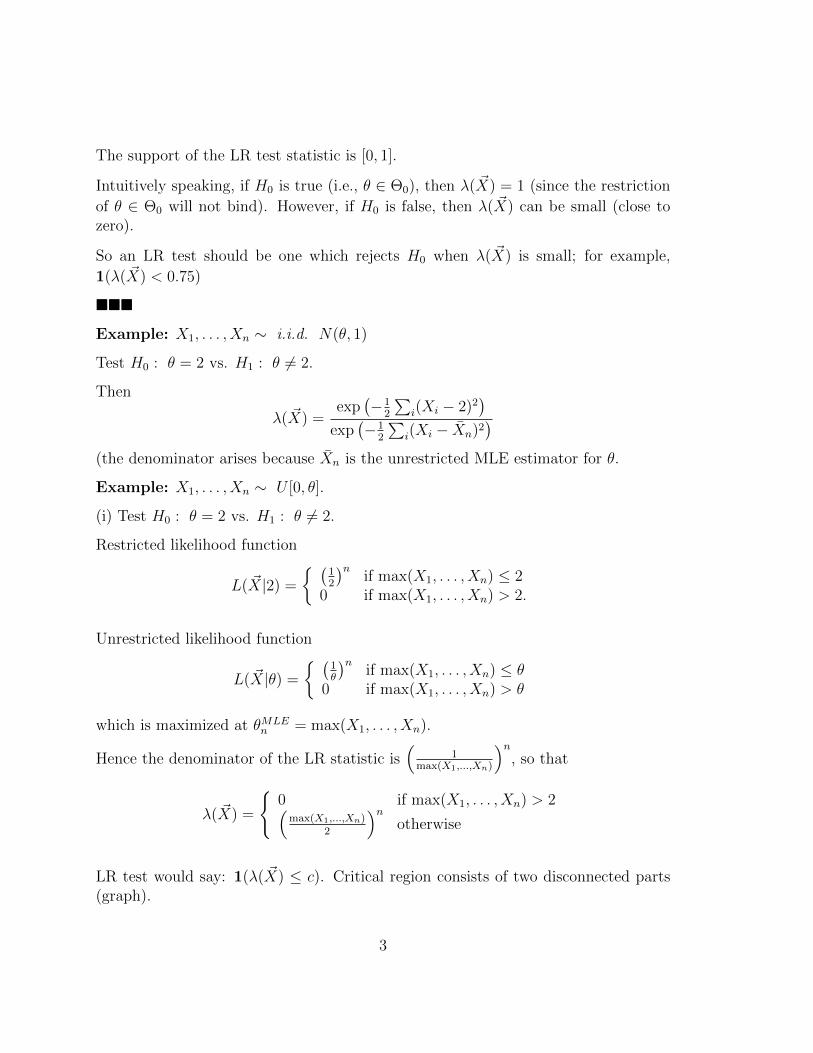
The support of the LR test statistic is [0, 1].
Intuitively speaking, if H0 is true (i.e., θ ∈ Θ0), then λ( ~X) = 1 (since the restriction
of θ ∈ Θ0 will not bind). However, if H0 is false, then λ( ~X) can be small (close tozero).
So an LR test should be one which rejects H0 when λ( ~X) is small; for example,
1(λ( ~X) < 0.75)
���
Example: X1, . . . , Xn ∼ i.i.d. N(θ, 1)
Test H0 : θ = 2 vs. H1 : θ 6= 2.
Then
λ( ~X) =exp
(−1
2
∑i(Xi − 2)2
)exp
(−1
2
∑i(Xi − X̄n)2
)(the denominator arises because X̄n is the unrestricted MLE estimator for θ.
Example: X1, . . . , Xn ∼ U [0, θ].
(i) Test H0 : θ = 2 vs. H1 : θ 6= 2.
Restricted likelihood function
L( ~X|2) =
{ (12
)nif max(X1, . . . , Xn) ≤ 2
0 if max(X1, . . . , Xn) > 2.
Unrestricted likelihood function
L( ~X|θ) =
{ (1θ
)nif max(X1, . . . , Xn) ≤ θ
0 if max(X1, . . . , Xn) > θ
which is maximized at θMLEn = max(X1, . . . , Xn).
Hence the denominator of the LR statistic is(
1max(X1,...,Xn)
)n, so that
λ( ~X) =
{0 if max(X1, . . . , Xn) > 2(
max(X1,...,Xn)2
)notherwise
LR test would say: 1(λ( ~X) ≤ c). Critical region consists of two disconnected parts(graph).
3
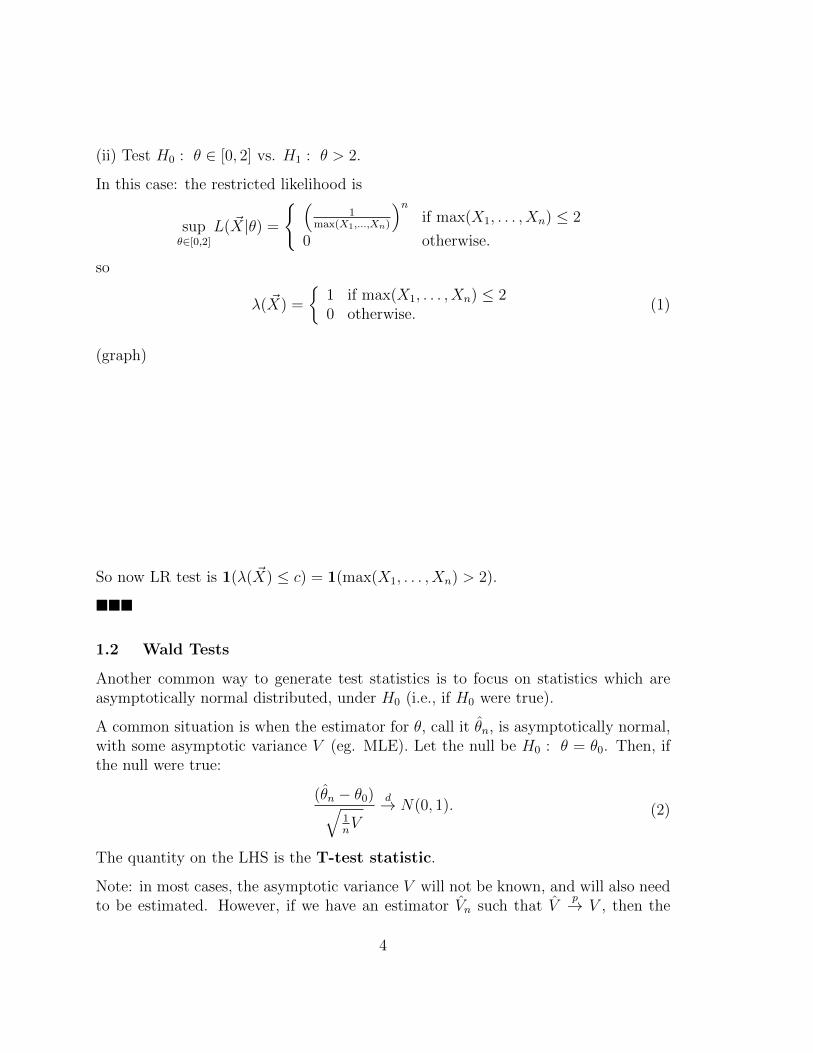
(ii) Test H0 : θ ∈ [0, 2] vs. H1 : θ > 2.
In this case: the restricted likelihood is
supθ∈[0,2]
L( ~X|θ) =
{ (1
max(X1,...,Xn)
)nif max(X1, . . . , Xn) ≤ 2
0 otherwise.
so
λ( ~X) =
{1 if max(X1, . . . , Xn) ≤ 20 otherwise.
(1)
(graph)
So now LR test is 1(λ( ~X) ≤ c) = 1(max(X1, . . . , Xn) > 2).
���
1.2 Wald Tests
Another common way to generate test statistics is to focus on statistics which areasymptotically normal distributed, under H0 (i.e., if H0 were true).
A common situation is when the estimator for θ, call it θ̂n, is asymptotically normal,with some asymptotic variance V (eg. MLE). Let the null be H0 : θ = θ0. Then, ifthe null were true:
(θ̂n − θ0)√1nV
d→ N(0, 1). (2)
The quantity on the LHS is the T-test statistic.
Note: in most cases, the asymptotic variance V will not be known, and will also needto be estimated. However, if we have an estimator V̂n such that V̂
p→ V , then the
4

statement
Zn ≡(θ̂n − θ0)√
1nV̂
d→ N(0, 1)
still holds (using the plim operator and Slutsky theorems). In what follows, therefore,we assume for simplicity that we know V .
We consider two cases:
(i) Two-sided test: H0 : θ = θ0 vs. H1 : θ 6= θ0.
Under H0: the CLT holds, and the t-stat is N(0, 1)Under H1: assume that the true value is some θ1 6= θ0. Then the t-stat can be writtenas
(θ̂n − θ0)√1nV
=(θ̂n − θ1)√
1nV
+(θ1 − θ0)√
1nV
.
The first termd→ N(0, 1), but the second (non-stochastic) term diverges to∞ or −∞,
depending on whether the true θ1 exceeds or is less than θ0. Hence the t-stat divergesto −∞ or ∞ with probability 1.
Hence, in this case, your test should be 1(|Zn| > c), where c should be some numberin the tails of the N(0, 1) distribution.
Multivariate version: θ is K-dimensional, and asymptotic normal, so that under H0,we have √
n(θn − θ0)d→ N(0,Σ).
Then we can test H0 : θ = θ0 vs. H1 : θ 6= θ0 using the quadratic form
Zn ≡ n · (θn − θ0)′Σ−1(θn − θ0)d→ χ2
k.
Test takes the form: 1(Zn > c).
(ii) One-sided test: H0 : θ ≤ θ0 vs. H1 : θ > θ0.
Here the null hypothesis specifies a whole range of true θ (Θ0 = (−∞, θ0]), whereasthe t-test statistic is evaluated at just one value of θ.
Just as for the two-sided test, the one-sided t-stat is evaluated at θ0, so that Zn =θ̂n−θ0√
1nV
.
5

Under H0 and θ < θ0: Zn diverges to −∞ with probability 1. Under H0 and θ = θ0:the CLT holds, and the t-stat is N(0, 1).Under H1: Zn diverges to ∞ with probability 1.
Hence, in this case, you will reject the null only for very large values of Zn. Corre-spondingly, your test should be 1(Zn > c), where c should be some number in theright tail of the N(0, 1) distribution.
Later, we will discuss how to choose c.
���
1.3 Score test
Consider a model with log-likelihood function logL(θ| ~X) = 1n
∑i log f(xi|θ).
Let H0 : θ = θ0. The sample score function evaluated at θ0 is
S(θ0) ≡ ∂
∂θlogL(θ| ~X)
∣∣θ=θ0
=1
n
∑i
∂
∂θlog f(xi|θ)
∣∣θ=θ0
.
Define Wi = ∂∂θ
log f(xi|θ)∣∣θ=θ0
. Under the null hypothesis, S(θ0) converges to
Eθ0Wi =
∫ ddθf(x|θ)|θ=θ0f(x|θ0)
f(x|θ0)dx
=∂
∂θ
∫f(x|θ)dx
=∂
∂θ· 1 = 0
(the information inequality). Hence,
Vθ0Wi = Eθ0W2i = Eθ0
(∂
∂θlog f(X|θ)
∣∣θ=θ0
)2
≡ V0.
(Note that 1V0
is the usual variance matrix for MLE, which is the CRLB.)
Therefore, you can apply the CLT to get that, under H0,
S(θ0)√1nV0
d→ N(0, 1).
(If we don’t know V0, we can use some consistent estimator V̂0 of it.)
6
So a test of H0 : θ = θ0 could be formulated as 1
(|
1nS(θ0)√1nV0| > c
), where c is in the
right tail of the N(0, 1) distribution.
Multivariate version: if θ is K-dimensional:
Sn ≡ nS(θ0)′V −10 S(θ0)
d→ χ2k.
���
Recall that, in the previous lecture notes, we derived the following asymptotic equalityfor the MLE:
√n(θ̂n − θ0
)a=√n− 1n
∑i∂ log f(xi|θ)
∂θ
∣∣θ=θ0
1n
∑i∂2 log f(xi|θ)
∂θ2
∣∣θ=θ0
=√nS(θ0)
V0
.
(3)
(The notationa= means that the LHS and RHS differ by some quantity which is
op(1).)
Hence, the above implies that (applying the information inequality, as we did before)
√n(θ̂n − θ0
)︸ ︷︷ ︸
(1)
a=√nS(θ0)
V0︸ ︷︷ ︸(2)
d→ N(0,1
V0
)
The Wald statistic is based on (1), while the Score statistic is based on (2). In thissense, these two tests are asymptotically equivalent. Note: the asymptotic varianceof the Wald statistic (2) equal the reciprocal of V0.
(Later, you will also see that the Likelihood Ratio Test statistic is also asymptoticallyequivalent to these two.)
���
The LR, Wald, and Score tests (the “trinity” of test statistics) require different modelsto be estimated.
• LR test requires both the restricted and unrestricted models to be estimated
• Wald test requires only the unrestricted model to be estimated.
7

• Score test requires only the restricted model to be estimated.
Applicability of each test then depends on the nature of the hypotheses. For H0 :θ = θ0, the restricted model is trivial to estimate, and so LR or Score test might bepreferred. For H0 : θ ≤ θ0, restricted model is a constrained maximization problem,so Wald test might be preferred.
���
2 Methods of evaluating tests
Consider X1, . . . , Xn ∼ i.i.d. (µ, σ2). Test statistic X̄n.
Test H0 : µ = 2 vs. H1 : µ 6= 2.
Why are the following good or bad tests?
1. 1(X̄n 6= 2)
2. 1(X̄n ≥ 1.2)
3. 1(X̄n 6∈ [1.8, 2.2])
4. 1(X̄n 6∈ [−10, 30])
Test 1 “rejects too often” (in fact, for every n, you reject with probability 1). Test 2is even worse, since it rejects even when X̄n is close to 2. Test 3 is not so bad, Test 4accepts too often.
Basically, we are worried when a test is wrong. Since the test itself is a randomvariable, we cannot guarantee that a test is never wrong, but we can characterizehow often it would be wrong.
There are two types of mistakes that we are worried about:
• Type I error: rejecting H0 when it is true. (This is the problem with tests 1and 2.)
• Type II error: Accepting H0 when it is false. (This is the problem with test4.)
8

Let Tn ≡ T (X1, . . . , Xn) denote the sample test statistic. Consider a test with rejec-tion region R (i.e., test is 1(Tn ∈ R)). Then:
P (type I error) = P (Tn ∈ R |θ ∈ Θ0)
P (type II error) = P (Tn 6∈ R |θ ∈ Θc0)
���
Example: X1, X2 ∼ i.i.d. Bernoulli, with probability p.
• Test H0 : p = 12
vs. H1 : p 6= 12.
• Consider the test 1(X1+X2
26= 1).
• Type I error: rejecting H0 when p = 12.
P(Type I error) = P(X1+X2
26= 1|p = 1
2) = P(X1+X2
2= 0|p = 1
2)+ P(X1+X2
2=
12|p = 1
2) = 1
4+ 1
2= 3
4.
• Type II error: Accepting H0 when p 6= 12.
For p 6= 12:
X1 +X2
2=
0 with prob (1− p)2
12
with prob 2(1− p)p1 with prob p2
So P(X1+X2
2= 1|p)=p2. Graph.
���
Power function
More generally, type I and type II errors are summarized in the power function.
9
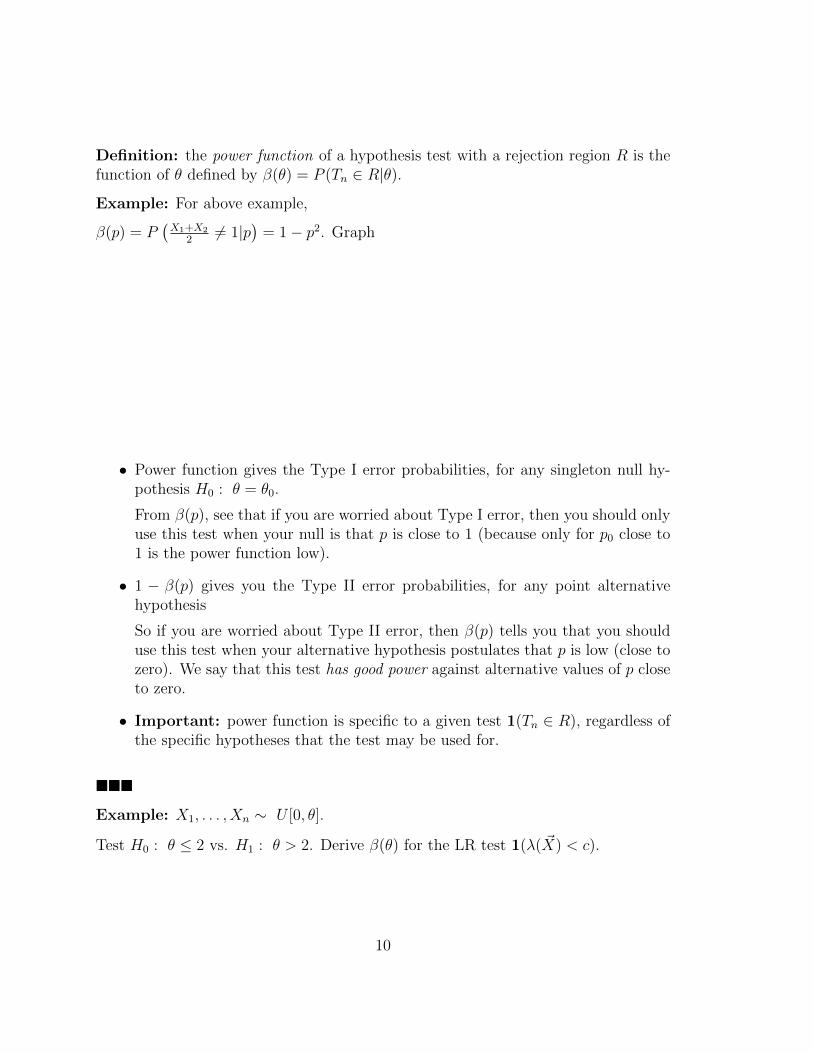
Definition: the power function of a hypothesis test with a rejection region R is thefunction of θ defined by β(θ) = P (Tn ∈ R|θ).
Example: For above example,
β(p) = P(X1+X2
26= 1|p
)= 1− p2. Graph
• Power function gives the Type I error probabilities, for any singleton null hy-pothesis H0 : θ = θ0.
From β(p), see that if you are worried about Type I error, then you should onlyuse this test when your null is that p is close to 1 (because only for p0 close to1 is the power function low).
• 1 − β(p) gives you the Type II error probabilities, for any point alternativehypothesis
So if you are worried about Type II error, then β(p) tells you that you shoulduse this test when your alternative hypothesis postulates that p is low (close tozero). We say that this test has good power against alternative values of p closeto zero.
• Important: power function is specific to a given test 1(Tn ∈ R), regardless ofthe specific hypotheses that the test may be used for.
���
Example: X1, . . . , Xn ∼ U [0, θ].
Test H0 : θ ≤ 2 vs. H1 : θ > 2. Derive β(θ) for the LR test 1(λ( ~X) < c).
10

Recall our earlier derivation of LR test in Eq. (1). Hence,
β(θ) = P (λ( ~X) < c|θ)= P (max(X1, . . . , Xn) > 2|θ)= 1− P (max(X1, . . . , Xn) < 2|θ)
=
{0 for θ ≤ 2
1−(
2θ
)nfor θ > 2.
Graph.
���
In practice, researchers often concerned about Type I error (i.e., don’t want to rejectH0 unless evidence overwhelming against it): “conservative bias”?
But if this is so, then you want a test with a power function β(θ) which is low forθ ∈ Θ0, but high elsewhere:
This motivates the definition of size and level of a test.
• For 0 ≤ α ≤ 1, a test with power function β(θ) is a size α test if supθ∈Θ0β(θ) =
α.
• For 0 ≤ α ≤ 1, a test with power function β(θ) is a level α test if supθ∈Θ0β(θ) ≤
α.
• The θ ∈ Θ0 at which the “sup” is achieved is called the “least favorable value” ofθ under the null, for this test. It is the value of θ ∈ Θ0 for which the null holds,but which is most difficult to distinguish (in the sense of having the highestrejection probability) from any alternative parameter θ 6∈ Θ0.
11

Reflecting perhaps the “conservative” bias, researcher often use tests of size α =0.05,or 0.10.
Example: X1, . . . , Xn ∼ i.i.d. N(µ, 1). Then X̄n ∼ N(µ, 1/n), and Zn(µ) ≡√n(X̄n − µ) ∼ N(0, 1).
• Consider the test 1 (Zn(2) > c), for the hypothesesH0 : µ ≤ 2 vs. H1 : µ > 2.
• The power function
β(µ) = P (√n(X̄n − 2) > c|µ)
= P (√n(X̄n − µ) > c+
√n(2− µ)|µ)
= 1− Φ(c+√n(2− µ))
where Φ(·) is the standard normal CDF. Note that β(µ) is increasing in µ.
• Size of test= supµ≤2 1 − Φ(c +√n(2 − µ)). Since β(µ) is increasing in µ, the
supremum occurs at µ = 2, so that size is β(2) = 1− Φ(c).
• Assume you want a test with size α. Then you want to set c such that
1− Φ(c) = α⇔ c = Φ−1(1− α).
Graph: c is the (1 − α)-th quantile of the standard normal distribution. Youcan get these from the usual tables.
For α = 0.025, then c∗ = 1.96. For α = 0.05, then c∗ = 1.64.
���
Now consider the above test, with c∗ = 1.96, but change the hypotheses to H0 : µ = 2vs. H1 : µ 6= 2.
12

Test still has size α = 0.05.
But there is something intuitively wrong about this test. You are less likely to rejectwhen µ < 2. So the Type II error is very high for the alternatives µ < 2.
We wish to rule out such tests
Definition: a test with power function β(θ) is unbiased if β(θ′) ≥ β(θ′′) for everypair (θ′, θ′′) where θ′ ∈ Θc
0 and θ′′ ∈ Θ0.
Clearly, the test above is biased for the stated hypotheses. What would be an unbiasedtest, with the same size α = 0.05?
Definition: Let C be a class of tests for testing H0 : θ ∈ Θ0 vs. H1 : θ ∈ Θc0. A
test in class C, with power function β(θ), is uniformly most powerful (UMP) inclass C if, for every other test in class C with power function β̃(θ)
β(θ) ≥ β̃(θ), for every θ ∈ Θc0.
Often, the classes you consider are test of a given size α. Graphically, the powerfunction for a UMP test lies above the upper envelope of power functions for all othertests in the class, for θ ∈ Θc
0:
(graph)
2.1 UMP tests in special case: two simple hypotheses
It can be difficult in general to see what form an UMP test for any given size α is.But in the simple case where both the null and alternative hypotheses are simplehypotheses, we can appeal to the following result.
Theorem 8.3.12 (Neyman-Pearson Lemma): Consider testing
H0 : θ = θ0 vs. H1 : θ = θ1
13
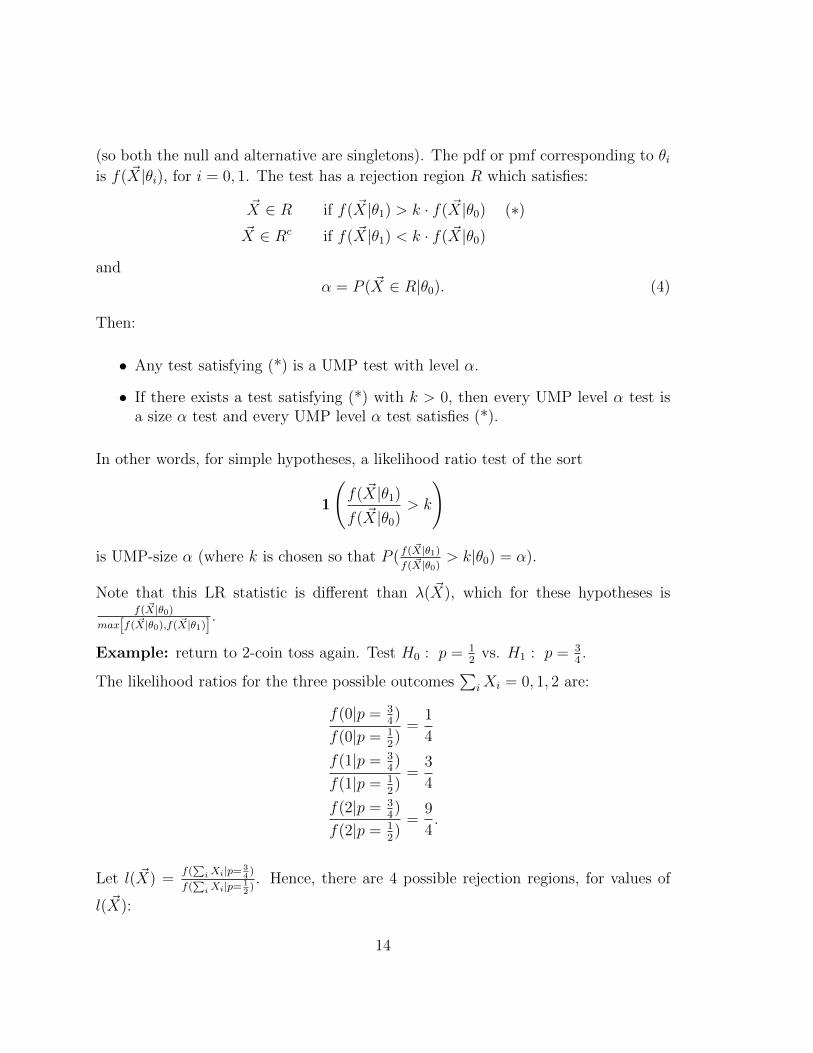
(so both the null and alternative are singletons). The pdf or pmf corresponding to θiis f( ~X|θi), for i = 0, 1. The test has a rejection region R which satisfies:
~X ∈ R if f( ~X|θ1) > k · f( ~X|θ0) (∗)~X ∈ Rc if f( ~X|θ1) < k · f( ~X|θ0)
andα = P ( ~X ∈ R|θ0). (4)
Then:
• Any test satisfying (*) is a UMP test with level α.
• If there exists a test satisfying (*) with k > 0, then every UMP level α test isa size α test and every UMP level α test satisfies (*).
In other words, for simple hypotheses, a likelihood ratio test of the sort
1
(f( ~X|θ1)
f( ~X|θ0)> k
)
is UMP-size α (where k is chosen so that P (f( ~X|θ1)
f( ~X|θ0)> k|θ0) = α).
Note that this LR statistic is different than λ( ~X), which for these hypotheses isf( ~X|θ0)
max[f( ~X|θ0),f( ~X|θ1)].
Example: return to 2-coin toss again. Test H0 : p = 12
vs. H1 : p = 34.
The likelihood ratios for the three possible outcomes∑
iXi = 0, 1, 2 are:
f(0|p = 34)
f(0|p = 12)
=1
4
f(1|p = 34)
f(1|p = 12)
=3
4
f(2|p = 34)
f(2|p = 12)
=9
4.
Let l( ~X) =f(
∑iXi|p= 3
4)
f(∑
iXi|p= 12
). Hence, there are 4 possible rejection regions, for values of
l( ~X):
14

(i) (94,+∞) (size α = 0)
(ii) (34,+∞) (size α = 1
4)
(iii) (14,+∞) (size α = 3
4)
(iv) (−∞,+∞) (size α = 1).
At all other values for α, no value of k satisfies (*) exactly, and so the test above arelevel-α tests. This is due to the discreteness of this example.
Example A: X1, . . . , Xn ∼ N(µ, 1). Test H0 : µ = µ0 vs. H1 : µ = µ1. (Assumeµ1 > µ0.)
By the NP-Lemma, the UMP test has rejection region characterized by
exp(−1
2
∑i(Xi − µ1)2
)exp
(−1
2
∑i(Xi − µ0)2
) > k.
Taking logs of both sides:
(µ1 − µ0)∑i
Xi > log k +n
2(µ1 − µ0)2
⇔ 1
n
∑i
Xi >1n
log k + 12(µ1 − µ0)2
(µ1 − µ0)≡ d.
where d is determined such that P (X̄n > d) = α, where α is the desired size. Thismakes intuitive sense: you reject the null when the sample mean is too large (becauseµ1 > µ0).
Under the null,√n(X̄n − µ0) ∼ N(0, 1), so for α = 0.05, you want to set d =
µ0 + 1.64/√n.
15

2.1.1 Discussion of NP Lemma
(From Amemiya pp. 190-192) Rather than present a proof of NP Lemma (you canfind one in CB), let’s consider some intuition for the NP test. In doing so, we willderive an interesting duality between Bayesian and classical approaches to hypothesistesting (the NP Lemma being a seminal result for the latter).
Start by considering a Bayesian approach to this testing problem. Assume thatdecisionmaker incurs loss γ1 if he mistakenly chooses H1 when H0 is true, and γ2 ifhe mistakenly chooses H0 when H1 is true. Then, given data observations ~x, he will
Reject H0 (=accept H1)⇔ γ1P (θ0|~x) < γ2P (θ1|~x) (∗)
where P (θ0|~x) denotes the posterior probability of the null hypothesis given data ~x.In other words, this Bayesian’s rejection region R0 is given by
R0 =
{~x :
P (θ1|~x)
P (θ0|~x)>γ1
γ2
}.
If we multiply and divide the ratio of posterior probabilities by f(~x), the (marginal)joint density of ~x, and use the laws of probability, we get:
R0 =
{~x :
P (θ1|~x)f(~x)
P (θ0|~x)f(~x)>γ1
γ2
}=
{~x :
L(~x|θ1)P (θ1)
L(~x|θ0)P (θ0)>γ1
γ2
}=
{~x :
L(~x|θ1)
L(~x|θ0)>γ1P (θ0)
γ2P (θ1)≡ c
}.
In the above, P (θ0) and P (θ1) denote the prior probabilities for, respectively, the nulland alternative hypotheses. This provides some intuition for the “likelihood ratio”form of the NP rejection region.
Next we show a duality between the Bayesian and classical approaches to findingthe “best” test. In the case of two simple hypotheses, a best test should be suchthat for a given size α, it should have the smallest type 2 error β (these are called“admissible” tests). For any testing scenario, the frontier (in (β, α) space) of tests isconvex. (Why?) Both the Bayesian and the classical statistician want to choose atest that is on the frontier, but they might differ in the one they choose.
First consider the Bayesian. She wishes to employ a test, equivalently, choose arejection region R, to minimize expected loss
minRφ(R) ≡ γ1P (θ0| ~X ∈ R)P ( ~X ∈ R) + γ2P (θ1| ~X ∈ R̄)P ( ~X ∈ R̄).
16

We will show that the region R0 defined above optimizes this problem. Consider anyother region R1. Recall that R0 = (R0 ∩R1) ∪ (R0 ∩ R̄1). Then we can rewrite
φ(R0) =γ1P (θ0|R0 ∩R1)P (R0 ∩R1) + γ1P (θ0|R0 ∩ R̄1)P (R0 ∩ R̄1)
+ γ2P (θ1|R̄0 ∩R1)P (R̄0 ∩R1) + γ2P (θ1|R̄0 ∩ R̄1)P (R̄0 ∩ R̄1).
φ(R1) =γ1P (θ0|R1 ∩R0)P (R1 ∩R0) + γ1P (θ0|R1 ∩ R̄0)P (R1 ∩ R̄0)
+ γ2P (θ1|R̄1 ∩R0)P (R̄1 ∩R0) + γ2P (θ1|R̄1 ∩ R̄0)P (R̄1 ∩ R̄0).
First and fourth terms of equations above are identical. From the definition of R0
above, we know that φ(R0)ii < φ(R1)iii. That is, for all ~x ∈ R0 ⊇ R0 ∩ R̄1, we knowfrom (*) that γ1P (θ0|~x) < γ2P (θ1|~x). Similarly, we know that φ(R0)iii < φ(R1)ii,implying that φ(R0) < φ(R1).
Moreover, using the laws of probability, we can re-express
φ(R) = γ1P (θ0)P (R|θ0) + γ2P (θ1)P (R̄|θ1) ≡ η0αR + η1βR
with η0 = γ1P (θ0) and η1 = γ2P (θ1). In (β, α) space, the “iso-loss” curves are parallellines with slope −η0/η1, decreasing towards the origin. Hence, the optimal test (withregion R0) lies at tangency of (α, β) frontier with a line with slope −η0/η1. Hence,the optimal Bayesian test (R0).
Now consider the classical statistician. He doesn’t want to specify priors P (θ0), P (θ1),so η0, η1 are not fixed. But he is willing to specify a desired size α∗. Hence the optimaltest is the one with a rejection region characterized by the slope of the line tangentat α∗ in the (β, α) space. This is in fact the NP test. From the above calculations,we know that this slope is equivalent to −c. That is, the NP test corresponds to anoptimal Bayesian test with η0/η1 = c.
2.2 Extension of NP Lemma: models with monotone likelihood ratio
The case covered by NP Lemma– that both null and alternative hypotheses are simple– is somewhat artificial. For instance, we may be interested in the one-sided hypothe-ses H0 : θ ≤ θ0 vs. H1 : θ ≥ θ0, where θ is scalar. It turns out UMP for one-sidedhypotheses exists under an additional assumption on the family of density functions{f( ~X|θ)
}θ:
Definition: the family of densities f( ~X|θ) has monotone likelihood ratio in T ( ~X)
is there exists a function T ( ~X) such that for any pair θ < θ′ the densities f( ~X|θ)
17
and f( ~X|θ′) are distinct and the ratio f( ~X|θ′)/f( ~X|θ) is a nondecreasing function of
T ( ~X). That is, there exists a nondecreasing function g(·) and function T ( ~X) such
that f( ~X|θ′)/f( ~X|θ) = g(T ( ~X)).
For instance: let ~X = x and T (x) = x, then MLR in x means that f(x|θ′)/f(x|θ) isnondecreasing in x. Roughly speaking: larger x’s are more “likely” under larger θ’s.
Theorem: Let θ be scalar, and let f( ~X|θ) have MLR in T ( ~X). Then:
(i) For testing H0 : θ ≤ θ0 vs. H1 : θ ≥ θ0, there exists a UMP test φ( ~X), which isgiven by
φ( ~X) =
1 when T ( ~X) > C
γ when T ( ~X) = C
0 when T ( ~X) < C
where (γ, C) are chosen to satisfy Eθ0φ( ~X) = α.
(ii) The power function β(θ) = Eθφ( ~X) is strictly increasing for all points θ for which0 < β(θ) < 1.
(iii) For all θ′, the test described in part i is UMP for testing H ′0 : θ ≤ θ′ vs.H ′1 : θ ≥ θ′ at level α = β(θ′). �
Sketch of Proof:1 Consider testing θ0 vs. θ1 > θ0. By NP Lemma, this dependson ratio f( ~X|θ1)/f( ~X|θ0). Given MLR condition, this ratio can be written g(T ( ~X))
where g(·) is nondecreasing. Then UMP test rejects when f( ~X|θ1)/f( ~X|θ0) is large,
which is when T (X) is large; this is test φ( ~X). Since this test does not depend on θ1,
φ( ~X) is also UMP-size α for testing H0 : θ0 vs. H1 : θ1 > θ0 (composite alternative).
Now since MLR holds for all (θ′, θ′′; θ
′′> θ′), the test φ( ~X) is also UMP-size Eθ′φ( ~X)
for testing θ′ vs. θ′′. Hence β(θ
′′) ≥ β(θ′), otherwise φ( ~X) cannot be UMP (why?2).
Furthermore, the distinctiveness of f( ~X|θ′′) and f( ~X|θ′) rules out β(θ
′′) = β(θ′).
Hence we get (ii).
Then since the power function is monotonic increasing in θ, the UMP-size α featureof φ( ~X) for testing θ0 vs. H1 : θ > θ0 extends to the composite null hypothesisH0 : θ ≤ θ0 vs. H1 : θ > θ0, which is (i). (iii) follows immediately.
���
Example A cont’d: From above, we see that for µ1 > µ0, the likelihood ratiosimplifies to exp
((µ1 − µ0)
∑iXi − n
2(µ2
1 − µ20))
which is increasing in X̄n. Hence,
1Lehmann and Romano, Testing Statistical Hypotheses, pg. 65.2Consider the purely random test φ( ~X) = 1 with probability α.
18
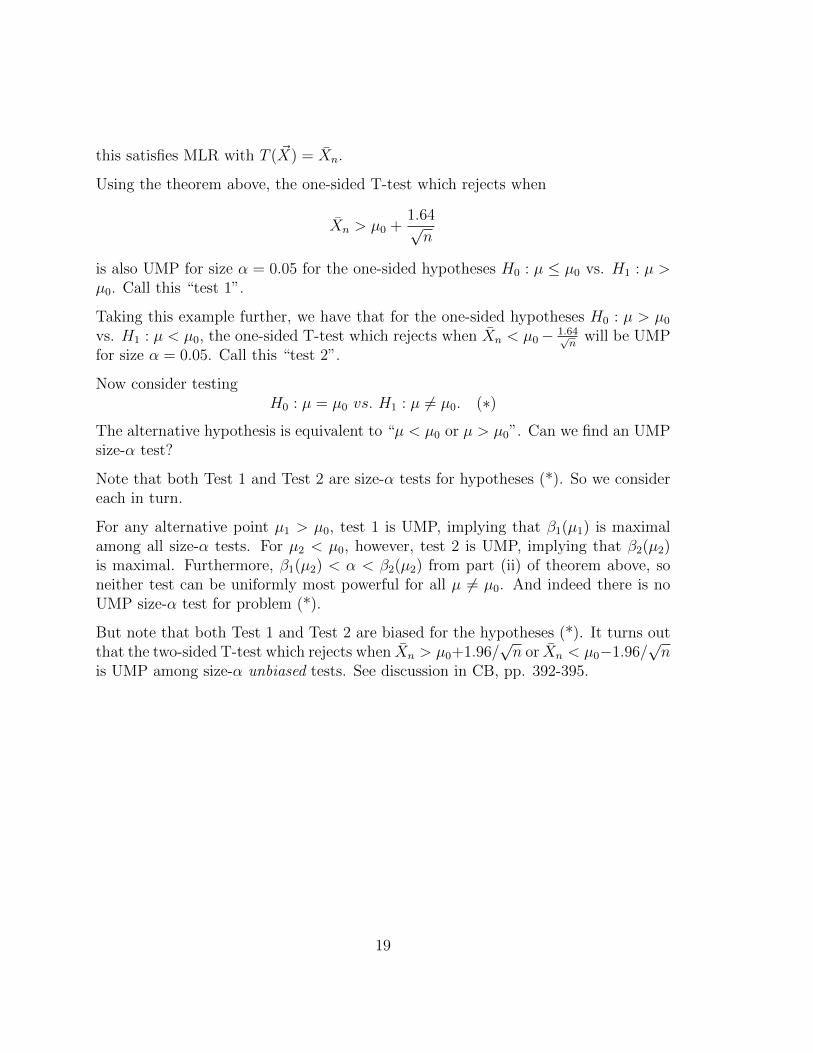
this satisfies MLR with T ( ~X) = X̄n.
Using the theorem above, the one-sided T-test which rejects when
X̄n > µ0 +1.64√n
is also UMP for size α = 0.05 for the one-sided hypotheses H0 : µ ≤ µ0 vs. H1 : µ >µ0. Call this “test 1”.
Taking this example further, we have that for the one-sided hypotheses H0 : µ > µ0
vs. H1 : µ < µ0, the one-sided T-test which rejects when X̄n < µ0− 1.64√n
will be UMPfor size α = 0.05. Call this “test 2”.
Now consider testingH0 : µ = µ0 vs. H1 : µ 6= µ0. (∗)
The alternative hypothesis is equivalent to “µ < µ0 or µ > µ0”. Can we find an UMPsize-α test?
Note that both Test 1 and Test 2 are size-α tests for hypotheses (*). So we considereach in turn.
For any alternative point µ1 > µ0, test 1 is UMP, implying that β1(µ1) is maximalamong all size-α tests. For µ2 < µ0, however, test 2 is UMP, implying that β2(µ2)is maximal. Furthermore, β1(µ2) < α < β2(µ2) from part (ii) of theorem above, soneither test can be uniformly most powerful for all µ 6= µ0. And indeed there is noUMP size-α test for problem (*).
But note that both Test 1 and Test 2 are biased for the hypotheses (*). It turns outthat the two-sided T-test which rejects when X̄n > µ0+1.96/
√n or X̄n < µ0−1.96/
√n
is UMP among size-α unbiased tests. See discussion in CB, pp. 392-395.
19

3 Large-sample properties of tests
In practice, we use large-sample theory — that is, LLN’s and CLT’s — in order todetermine the approximate critical regions for the most common test statistics.
Why? Because finite-sample properties can be difficult to determine:
Example: X1, . . . , Xn ∼ i.i.d. Bernoulli with prob. p.
Want to test H0 : p ≤ 12
vs. H1 : p > 12, using the test stat X̄n = 1
n
∑iXi.
n is finite. The exact finite-sample distribution for X̄n is the distribution of 1n
timesa B(n, p) random variable, which is:
0 with prob(n0
)(1− p)n
1n
with prob(n1
)p(1− p)n−1
2n
with prob(n2
)p2(1− p)n−2
. . . . . .1 with prob pn
Assume your test is of the following form: 1(X̄n > c), where the critical value c isto be determined such that the size supp≤ 1
2P (X̄n > c|p) = α, for some specified α.3
This equation is difficult to solve for!
On the other hand, by the CLT, we know that√n(Xn−p)√p(1−p)
d→ N(0, 1). Hence, consider
the T-test statistic Zn ≡√n(X̄n − 1
2
)/√
14
= 2√n(X̄n − 1
2
).
Under any p ≤ 12
in the null hypothesis,
P (Zn > Φ−1(1− α)) ≤ α,
for n large enough. (In fact, this equation holds with equality for p = 12, and holds
with strict inequality for p < 12.)
Corresponding to this test, you can derive the asymptotic power function, which isβa(p) ≡ limn→∞ P (Zn > c), for c = Φ−1(1− α):
(Graph)
3Indeed, the Clopper-Pearson (1934) confidence intervals for p are based on inverting this exactfinite-sample test.
20

• Note that the asymptotic power function is equal to 1 at all values under thealternative. This is the notion for consistency for a test: that it has asymptoticpower 1 under every alternative.
• Note also that asymptotic power (rejection probability) is zero under every p ofthe null, except p = 1
2.
• (skip) Accordingly, we see that asymptotic power, vs. fixed alternatives, is nota sufficiently discerning criterion for distinguishing between tests. We can dealwith this by considering local alternatives of the sort p̃ = 1
2+ h/
√n. Under ad-
ditional smoothness assumptions on the distributional convergence of√n(X̄n−p)√p(1−p)
around p = 12, we can obtain asymptotic power functions under these local
alternatives.
3.1 Likelihood Ratio Test Statistic: asymptotic distribution
Theorem 10.3.1 (Wilks Theorem): For testing H0 : θ = θ0 vs. H1 : θ 6= θ0, ifX1, . . . , Xn ∼ i.i.d. f(X|θ), and f(X|θ) satisfies the regularity conditions in Section10.6.2. Then under H0, as n→∞:
−2 log λ( ~X)d→ χ2
1.
Note: χ21 denotes a random variable from the Chi-squared distribution with 1 degree
of freedom. By Lemma 5.3.2 in CB, if Z ∼ N(0, 1), then Z2 ∼ χ21. Clearly, χ2 random
variables only have positive support.
Proof: Assume null holds. Use Taylor-series expansion of log-likelihood functionaround the MLE estimator θ̂n:∑
i
log f(xi|θ0) =∑i
log f(Xi|θ̂n) +∑i
∂
∂θlog f(Xi|θ)
∣∣θ=θ̂n· (θ0 − θ̂n)
+1
2
∑i
∂2
∂θ2log f(Xi|θ)
∣∣θ=θ̂n· (θ0 − θ̂n)2 + ...
=∑i
log f(Xi|θ̂n) +1
2
∑i
∂2
∂θ2log f(Xi|θ)
∣∣θ=θ̂n· (θ0 − θ̂n)2 + ...
(5)
where (i) the second term disappeared because the MLE θ̂n sets the first-order con-dition
∑i∂∂θ
log f(Xi|θ)∣∣θ=θ̂n
= 0; (ii) the remainder term is op(1). This is a second-order Taylor expansion.
21

Rewrite the above as:
−2∑i
log
(f(xi|θ0)
f(Xi|θ̂n)
)= − 1
n
∑i
∂2
∂θ2log f(Xi|θ)
∣∣θ=θ̂n·[√
n(θ0 − θ̂n)]2
+ op(1).
Now
− 1
n
∑i
∂2
∂θ2log f(Xi|θ)
∣∣θ=θ̂n
p→ −Eθ0∂2
∂θ2log f(Xi|θ0) =
1
V0(θ0),
where V0(θ0) denotes the asymptotic variance of the MLE estimator (and is equal tothe familiar information bound 1/I(θ0)).
Finally, we note that√n(θ̂n−θ0)√V0(θ0)
d→ N(0, 1). Hence, by the definition of the χ21 random
variable:−2 log λ( ~X)
d→ χ21.
���
In the multivariate case (θ being k-dimensional), the above says that
−2 log(λ( ~X))a= n(θ0 − θn)I(θ0)−1(θ0 − θn) ∼ χ2
k.
Hence, LR-statistic is asymptotically equivalent to Wald and Score tests.
���
Example: X1, . . . , XN ∼ i.i.d. Bernoulli with prob. p. Test H0 : p = 12
vs.H1 : p 6= 1
2. Let Yn denote the number of 1’s.
λ( ~X) =
(nyn
) (12
)yn (12
)n−yn(nyn
) (ynn
)yn (n−ynn
)n−yn .For test with asymptotic size α:
α = P (λ( ~X) ≤ c) (c < 1)
= P (−2 log λ( ~X) ≥ −2 log c)
= P (χ21 ≥ −2 log c)
= 1− Fχ21(−2 log c)
⇒c = exp
(−1
2F−1χ2x
(1− α)
).
For instance, for α = 0.05, then F−1χ2x
(1 − α) = 3.841; α = 0.10, then F−1χ2x
(1 − α) =2.706.
22