hyper-dominance in the amazonian tree flora
TRANSCRIPT

ORE Open Research Exeter
TITLE
Hyperdominance in the Amazonian tree flora
AUTHORS
ter Steege, H; Pitman, NCA; Sabatier, D; et al.
JOURNAL
Science
DEPOSITED IN ORE
08 February 2017
This version available at
http://hdl.handle.net/10871/25681
COPYRIGHT AND REUSE
Open Research Exeter makes this work available in accordance with publisher policies.
A NOTE ON VERSIONS
The version presented here may differ from the published version. If citing, you are advised to consult the published version for pagination, volume/issue and date ofpublication
Hyper-dominance in the Amazonian Tree Flora
Hans ter Steege,1,2 Nigel Pitman,3 Daniel Sabatier,4 Christopher Baraloto,5 Rafael Salomão,6 Juan Ernesto Guevara,7 Oliver Phillips,8 Carolina Castilho,9 Bill Magnusson,10 Jean-François Molino,4 Abel Monteagudo,11 Percy Núñez Vargas,12 Juan Carlos Montero,13,10 Ted Feldpausch,8 Eurídice Honorio,14,8 Tim Killeen,15 Bonifacio Mostacedo,16 Rodolfo Vasquez,11
Rafael Leandro de Assis,10,17 John Terborgh,3 Florian Wittmann,18 Ana Segalin de Andrade,19 Bill Laurance,20 Susan Laurance,20 Beatriz S. Marimon,21 Ben Hur Marimon Jr,21 Ima Vieira,22 Iêda Amaral,23 Roel Brienen,8 Hernan Castellanos,24
Dairon Cárdenas,25 Joost Duivenvoorden,26 Hugo Mogollón,27 Francisca Dionízia de Almeida Matos,10 Nallarett Dávila,28
Roosevelt García,29,30 Pablo Stevenson,31 Flávia Costa,10 Thaise Emilio,10 Carolina Levis,10 Juliana Schietti,10 Priscila Souza,10 Alfonso Alonso,32 Francisco Dallmeier,32 Alvaro Duque,33 Maria Piedade,10 Alejandro Araujo-Murakami,34 Luzmila Arroyo,34 Rogerio Gribel,35 Paul Fine,7 Carlos Peres,36 Marisol Toledo,37 Gerardo Aymard,38 Tim Baker,8 Carlos Cerón,39
Julien Engel,40 Terry Henkel,41 Paul Maas,1 Pascal Petronelli,42 Juliana Stropp,43 Charles Eugene Zartman,10 Doug Daly,44
David Neill,45 Marcos Silveira,46 Jerome Chave,47 Diógenes de Andrade Lima Filho,10 Alfredo Fuentes,48,49 Peter Møller Jørgensen,50 Jochen Schöngart,18 Fernando Cornejo Valverde,51 Anthony Di Fiore,52 Eliana M. Jimenez,53 Maria Cristina Peñuela Mora,53 Juan Fernando Phillips,54 Gonzalo Rivas,55 Tinde van Andel,1 Patricio von Hildebrand,54 Bruce Hoffman,1
Eglée Lopez-Zent,56 Yadvinder Malhi,57 Adriana Prieto,58 Agustín Rudas,58 Ademir Ruschell,59 Natalino Silva,60 Vincent Vos,61 Stanford Zent,56 Alexandre Adalardo de Oliveira,62 Angela Cano Schutz,31 Therany Gonzales,63 Marcelo Trindade Nascimento,64 Hirma Ramirez-Angulo,65 Rodrigo Sierra,66 Milton Tirado,66 María Natalia Umaña Medina,31 Geertje van der Heijden,67,68 César Vela,69 Emilio Vilanova Torre,65 Corine Vriesendorp,70 Ophelia Wang,71 Kenneth R. Young,72 Claudia Baider,62,73 Henrik Balslev,74 Cid Ferreira,10 Italo Mesones,7 Armando Torres-Lezama,75 Ligia Estela Urrego,33 Roderick Zagt,76 Miguel Alexiaides,77 Lionel Hernandez,24 Isau Huamantupa-Chuquimaco,78 William Milliken,79 Walter Palacios,80
Daniela Pauletto,81 Elvis Valderrama,82,83 Luis Valenzuela Gamarra,11 Kyle Dexter,84 Ken Feeley,85,86 Gabriela Lopez-Gonzalez,8 Miles Silman,87
*To whom correspondence should be addressed. E-mail: [email protected]
1Naturalis Biodiversity Center, Leiden, The Netherlands
2Ecology and Biodiversity Group, Utrecht University, The Netherlands
3Center for Tropical Conservation, Nicholas School of the Environment, Duke University, Durham, NC 27708, USA
4IRD, UMR AMAP, Montpellier, France.
5INRA, UMR Ecologie des Forêts de Guyane, French Guiana
6MCTI/Museu Paraense Emílio Goeldi - Cordenadoria de Botânica, Belém, Brazil
7Department of Integrative Biology, University of California, Berkeley, CA 94720-3140, USA
8School of Geography, University of Leeds, Leeds, LS2 9JT, UK
9Embrapa Roraima, Boa Vista, RR, Brazil
10Instituto Nacional de Pesquisas da Amazônia, Manaus, AM, Brazil
11Jardín Botánico de Missouri, Oxapampa, Peru
12Universidad Nacional de San Antonio Abad del Cusco, Cusco, Peru
13BOLFOR, Cuarto Anillo, esquina Av. 2 de Agosto, Casilla 6204, Santa Cruz, Bolivia
14Instituto de Investigaciones de la Amazonía Peruana, Av. José A. Quiñones km. 2.5, Iquitos, Peru
15World Wildlife Fund, Washington, DC, USA
16Universidad Autónoma Gabriel René Moreno, Facultad de Ciencias Agrícolas, Santa Cruz, Bolivia
17Dept. of Ecology and Natural Resource Management, Norwegian University of Life Sciences (UMB), Aas, Norway
18Max Planck Institute for Chemistry, Biogeochemistry, Mainz, Germany
19Instituto Nacional de Pesquisas da Amazônia, Projeto Dinâmica Biológica de Fragmentos Florestais, Manaus, AM, Brazil
20Centre for Tropical Environmental and Sustainability Science (TESS) and School of Marine and Tropical Biology, James Cook University, Cairns, Queensland, Australia

21Universidade do Estado de Mato Grosso, Nova Xavantina, MT, Brazil
22Museu Paraense Emílio Goeldi, Belém, PA, Brazil
23Projeto TEAM - Manaus, Instituto Nacional de Pesquisas da Amazônia, Manaus, AM, Brazil
24Universidad Nacional Experimental de Guayana, Puerto Ordaz, Bolivar, Venezuela
25SINCHI Herbario Amazónico Colombiano, Calle 20 No. 5, 44 Bogotá, Colombia
26Institute of Biodiversity and Ecosystem Dynamics, University of Amsterdam, Amsterdam, The Netherlands
27Endangered Species Coalition, 8530 Geren Rd., Silver Spring, MD 20901, USA
28Universidade Estadual de Campinas, Campinas, São Paulo, Brazil
29Institute of Molecular Plant Sciences, University of Edinburgh, Mayfield Rd, Edinburgh EH9 3JH, UK
30Royal Botanic Garden of Edinburgh, 20a Inverleith Row, Edinburgh EH3 5LR, UK
31Laboratorio de Ecología de Bosques Tropicales y Primatología, Universidad de los Andes, Bogotá DF, Colombia
32Smithsonian Conservation Biology Institute, National Zoological Park MRC 0705, Washington, DC, USA
33Universidad Nacional de Colombia, Departamento de Ciencias Forestales, sede Medellín, Colombia
34Museo de Historia Natural Noel Kempff Mercado, Santa Cruz, Bolivia
35Instituto de Pesquisas Jardim Botânico do Rio de Janeiro, Rio de Janeiro, RJ, Brazil
36School of Environmental Sciences, University of East Anglia, Norwich, UK
37Instituto Boliviano de Investigación Forestal, Universidad Autónoma Gabriel René Moreno, Santa Cruz, Bolivia
38UNELLEZ-Guanare, Programa de Ciencias del Agro y el Mar, Herbario Universitario (PORT), estado Portugesa, Venezuela 3350
39Herbario Alfredo Paredes (QAP), Universidad Central del Ecuador, Ap. Postal 17.01.2177, Quito.
40CNRS, UMR Ecologie des Forêts de Guyane, French Guiana
41Humboldt State University, Department of Biological Sciences, Arcata, CA 95521, USA
42CIRAD, UMR Ecofog, Kourou, French Guiana
43Joint Research Centre of the European Commission, Land Resource and Management Unit, Via Enrico Fermi 2749,TP 440, I-21027 Ispra (VA), Italy
44New York Botanical Garden, Bronx New York, NY 10458-5126, USA
45Universidad Estatal Amazónica, Puyo, Ecuador
46Museu Universitário, Universidade Federal do Acre, Rio Branco, AC, Brazil
47CNRS and Université Paul Sabatier, UMR 5174 EDB, 31000 Toulouse, France
48Herbario Nacional de Bolivia, Casilla 10077 Correo Central, La Paz, Bolivia
49Missouri Botanical Garden, P.O. Box 299, St. Louis, MO 63166-0299, USA
50Missouri Botanical Garden, P.O. Box 299, St. Louis, MO 63166-0299, USA
51Andes to Amazon Biodiversity Program, Madre de Dios, Peru
52Department of Anthropology, University of Texas at Austin, Austin, TX 78712, USA

53Grupo de Ecología de Ecosistemas Terrestres Tropicales, Universidad Nacional de Colombia Sede Amazonia, Leticia, Amazonas, Colombia
54Fundación Puerto Rastrojo, Cra 10 No. 24-76 Oficina 1201, Bogotá, Colombia
55Wildlife Ecology and Conservation & Quantitative Spatial Ecology, University of Florida, Gainesville, USA
56Laboratory of Human Ecology, Instituto Venezolano de Investigaciones Científicas, Ado 20632, Caracas 1020-A, Venezuela
57Environmental Change Institute, School of Geography and the Environment, University of Oxford, Oxford, UK
58Instituto de Ciencias Naturales, Universidad Nacional de Colombia, Bogotá, Colombia
59Embrapa Amazônia Oriental, Belém, PA, Brazil
60UFRA - Universidade Federa Rural da Amazônia, Belém, PA, Brazil
61Universidad Autónoma del Beni, Riberalta, Bolivia
62Universidade de São Paulo, Instituto de Biociências, Dept. Ecologia, Cidade Universitária, São Paulo, SP, Brazil
63ACEER Foundation, Jirón Cusco N° 370, Puerto Maldonado, Madre de Dios, Peru
64Laboratório de Ciências Ambientais, Universidade Estadual do Norte Fluminense, Campos dos Goyatacazes, RJ 28013-620, Brazil
65INDEFOR, Universidad de los Andes, Mérida, Venezuela
66GeoIS, USA - Ecuador.
67University of Wisconsin-Milwaukee, Department of Biological Sciences, Milwaukee, WI 53202, USA
68Smitsonian Tropical Research Institute, Apartado Postal 0843-03092. Panama
69Facultad de Ciencias Forestales y Medio Ambiente, Universidad Nacional de San Antonio Abad del Cusco, Jr. San Martín 451, Puerto Maldonado, Madre de Dios, Peru
70The Field Museum, 1400 S. Lake Shore Drive, Chicago, IL 60605-2496, USA
71Northern Arizona University, Flagstaff, AZ 86011, USA
72Geography and the Environment, University of Texas, Austin, TX 78712, USA
73The Mauritius Herbarium, Agricultural Services, Ministry of Agro-Industry and Food Security, Reduit, Mauritius
74University of Aarhus, Aarhus, Denmark
75Universidad de los Andes, Mérida, Venezuela
76Tropenbos International, Wageningen, The Netherlands
77School of Anthropology and Conservation, Marlowe Building, University of Kent, Canterbury, Kent CT2 7NR, UK
78Herbario CUZ, Universidad Nacional San Antonio Abad del Cusco, Cusco, Peru
79Royal Botanic Gardens, Kew, Richmond, Surrey, TW9 3AB, UK
80Universidad Técnica del Norte/Herbario Nacional del Euador
81Serviço Florestal Brasileiro, Santarém, PA, Brazil
82Department of Biology - University of Missouri - Saint Louis, R 102 Research, St. Louis, MO 63121, USA
83Facultad de Biologia - Universidad Nacional de la Amazonia Peruana, Pevas 5ta cdra, Iquitos, Peru
84School of Geosciences, University of Edinburgh, 201 Crew Building, King’s Buildings, Edinburgh, EH9 3JN, UK
85Florida International University, Department of Biological, Miami FL 33199, USA
86Fairchild Tropical Botanic Garden, Coral Gables FL 33156, USA
87Biology Department and Center for Energy, Environment and Sustainability, Wake Forest University, Winston-Salem, NC 27106, USA
The vast extent of the Amazon Basin has historically restricted the study of its tree communities to the
local and regional scales. Here we provide the first empirical data on the commonness, rarity, and
richness of lowland tree species across the entire Amazon Basin and Guiana Shield (Amazonia),
collected in 1170 tree plots in all major forest types. Extrapolations suggest that Amazonia harbors
roughly 16,000 tree species, of which just 227 (1.4%) account for half of all trees. Most of these are
habitat specialists and only dominant in 1–2 regions of the basin. We discuss some implications of the
discovery that a small group of species—less diverse than the North American tree flora—accounts
for half of the world’s most diverse tropical forest.
Much remains unknown about the Amazonian flora, the world’s richest assemblage of plant species. Here we
report some unexpected results from a uniquely wide-ranging assessment of the composition and biogeography
of Amazonian tree communities. Using species-abundance data for adult trees (defined as ≥ 10 cm in diameter-
at-breast-height) collected in individual plots and the geographical distribution of those plots across Amazonia
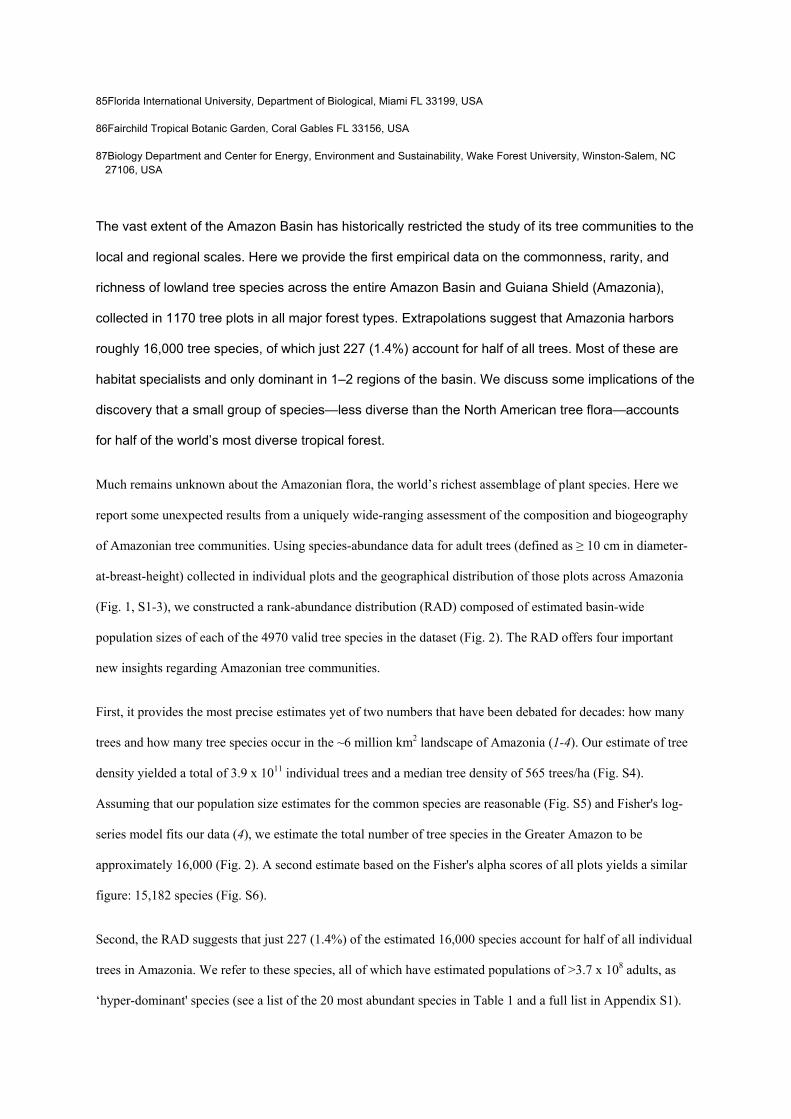
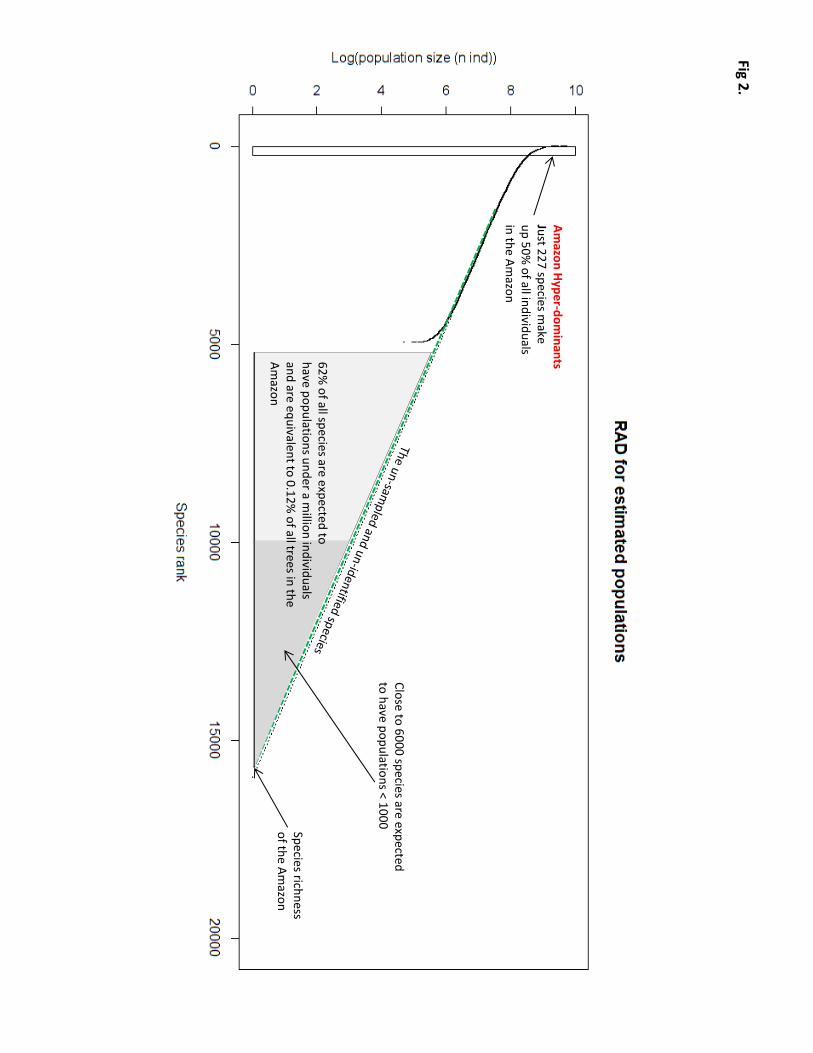
(Fig. 1, S1-3), we constructed a rank-abundance distribution (RAD) composed of estimated basin-wide
population sizes of each of the 4970 valid tree species in the dataset (Fig. 2). The RAD offers four important
new insights regarding Amazonian tree communities.
First, it provides the most precise estimates yet of two numbers that have been debated for decades: how many
trees and how many tree species occur in the ~6 million km2 landscape of Amazonia (1-4). Our estimate of tree
density yielded a total of 3.9 x 10¹¹ individual trees and a median tree density of 565 trees/ha (Fig. S4).
Assuming that our population size estimates for the common species are reasonable (Fig. S5) and Fisher's log-
series model fits our data (4), we estimate the total number of tree species in the Greater Amazon to be
approximately 16,000 (Fig. 2). A second estimate based on the Fisher's alpha scores of all plots yields a similar
figure: 15,182 species (Fig. S6).
Second, the RAD suggests that just 227 (1.4%) of the estimated 16,000 species account for half of all individual
trees in Amazonia. We refer to these species, all of which have estimated populations of >3.7 x 10⁸ adults, as
‘hyper-dominant' species (see a list of the 20 most abundant species in Table 1 and a full list in Appendix S1).

These hyper-dominant species form the backbone of the tree communities in individual plots as well, accounting
for a median of 41% of trees (range = 0-94%, Fig. S5) and 32% of species (range = 0-78%) per plot (Fig. S7).
Third, all species ranking in abundance from 5000–16,000 are very rare. These species in the tail of the RAD
have total populations of <106 individuals and together account for just 0.12% of all trees in Amazonia. While
some of these species may be 'vagrants' spilling over from extra-Amazonian biomes such as the Cerrado and
Andes, thousands must be Amazonian endemics that run a high risk of going extinct, and many before they can
even be found and described by biologists. The rarest 5800 species have estimated population sizes of <1000,
which is sufficient to classify those which are endemic as globally threatened (5). Together these rarest species
account for just 0.0003% of all trees in Amazonia. Given the extreme unlikelihood of locating a fertile
individual of one of these species, , whose flowers can be used for species-level identification, we believe that
discovering and describing the unknown portion of Amazonian biodiversity will be a long-term struggle with
steeply diminishing returns, and not an easy linear process (6). Indeed, the RAD suggests that floras of even
well-collected areas may remain half-finished for decades. For example, our data predict that ~4500 tree species
occur in the Guianas (Fig. S8), but centuries of collecting there have yielded just half that number (7). Some of
these species may be present among the unidentified species of our plots or as undescribed specimens in
herbaria (8), but the majority may yet have to be collected.
Fourth, there are strong similarities between theoretical models of tree species richness in the Amazon (4) and
our distribution of species abundances based on empirical data. For example, Hubbell et al. (4) used a log-series
distribution to predict that the most common species in the Amazon should account for 1.39% of all trees. This
is remarkably close to our estimate for the most common species in our dataset, the palm Euterpe precatoria
(1.32%). Our estimate of Fisher’s alpha for the Amazon is also extremely close to Hubbell et al.’s modeled
prediction (754 vs. 743 in (4)). Although these strong correlations between predictions and our dataset suggest
that the log-series may offer useful insights on the most poorly known tree species in the Amazon (e.g., the
number of undescribed taxa), they should not be interpreted as evidence for any one theory of how these tree
communities are structured (9).
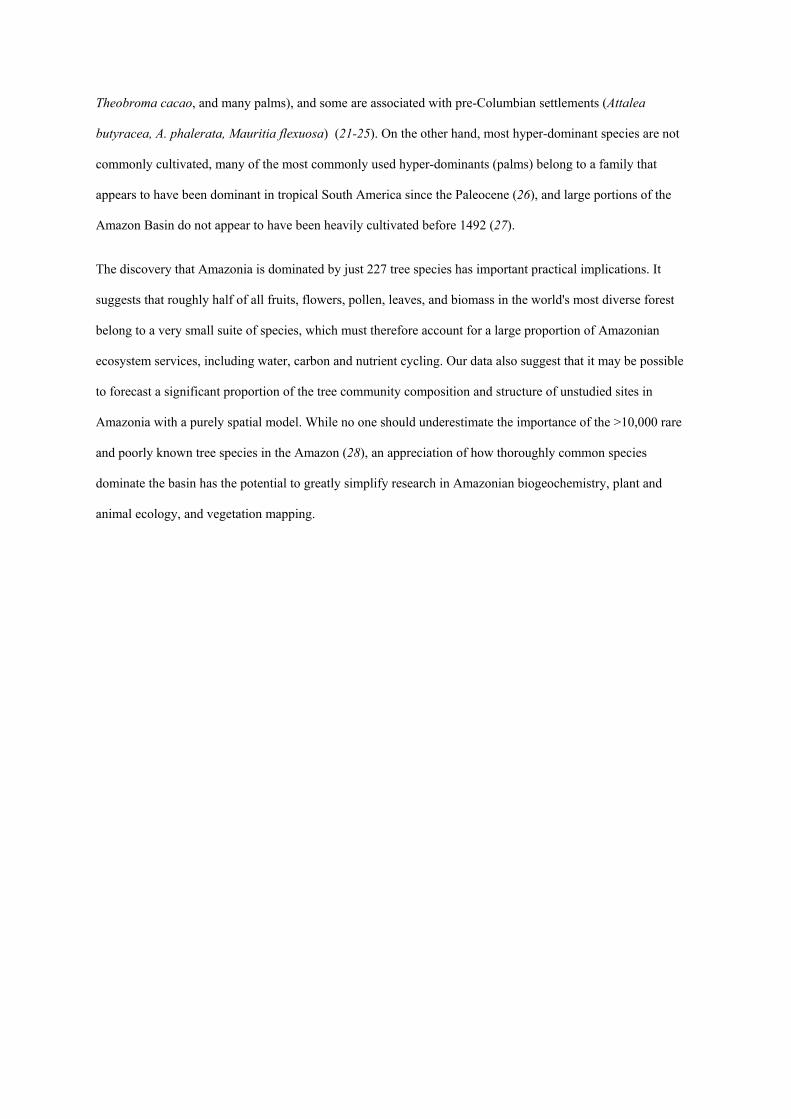
We examined species’ geographic ranges and abundances by plots, regions, and forest types to explore how
hyper-dominant species differ from other taxa, as a first step towards understanding what makes them so
successful. Hyper-dominant species have larger ranges than other taxa (Fig. 3a) and reach greater maximum
relative abundances in plots (Fig. 3b). Most hyper-dominant species (121 out of 227) are habitat specialists (Fig.

3c) (i.e., they show a strong preference for one of the five major Amazonian forest types: terra firme [53 spp.],
várzea [26], white-sand forest [16], swamps [14], and igapó [12]). Likewise, most are only dominant within one
or two forest types. When the study area was divided into six regions (Guiana Shield, NW, SW, S, E, and
Central Amazonia), most hyper-dominant species (72%) were found to be dominant within only 1 or 2 regions
(Table 2).
It is thus important to emphasize that while the Amazonian RAD is dominated by a small suite of species, most
of those species are only dominant in certain forest types and in certain regions of the basin. Just one species
qualified as dominant in all six regions (Eschweilera coriacea), no species were dominant in all five forest
types, and only four species were dominant in four forest types (Euterpe precatoria, Oenocarpus bataua,
Licania apetala, and Euterpe oleracea). Much more representative of the 227 hyper-dominant species are taxa
like Siparuna decipiens (112th largest population size overall), only dominant in terra firme forests in SW
Amazonia, and Eperua falcata (13th), only dominant in the Guiana Shield. Indeed, 59% of hyper-dominant
species qualify as both dominant in 1 or 2 regions and dominant in 1 or 2 forest types.
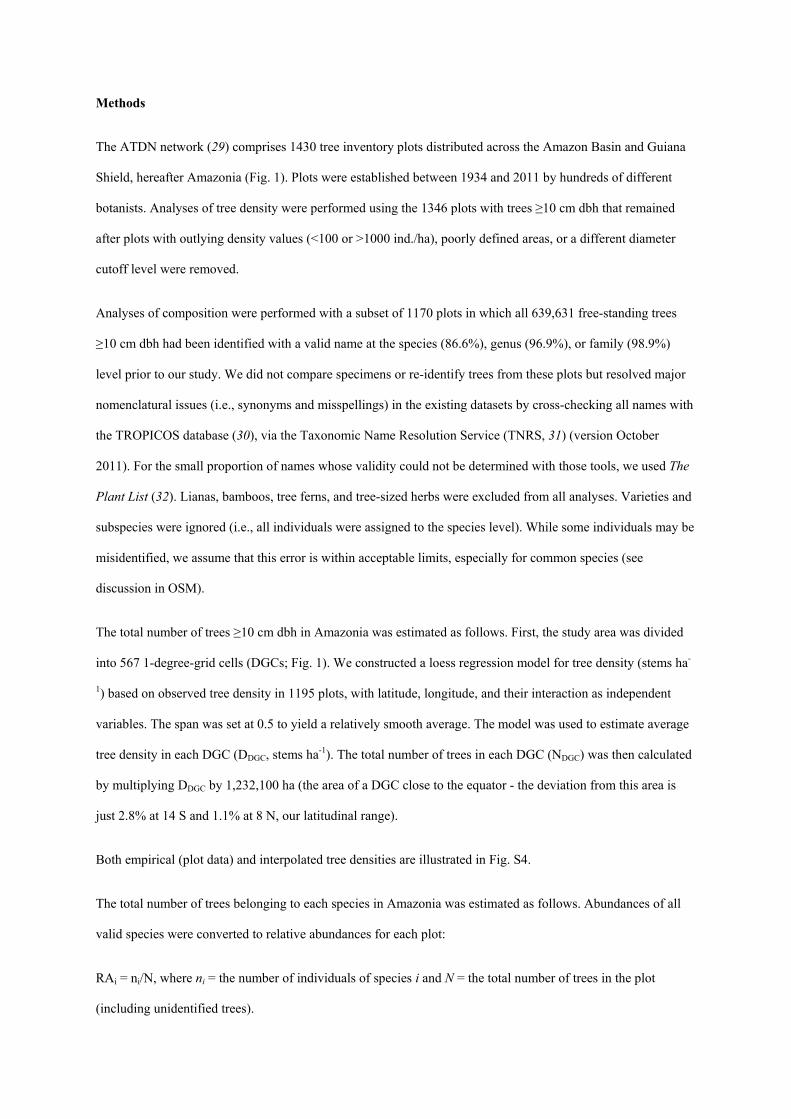
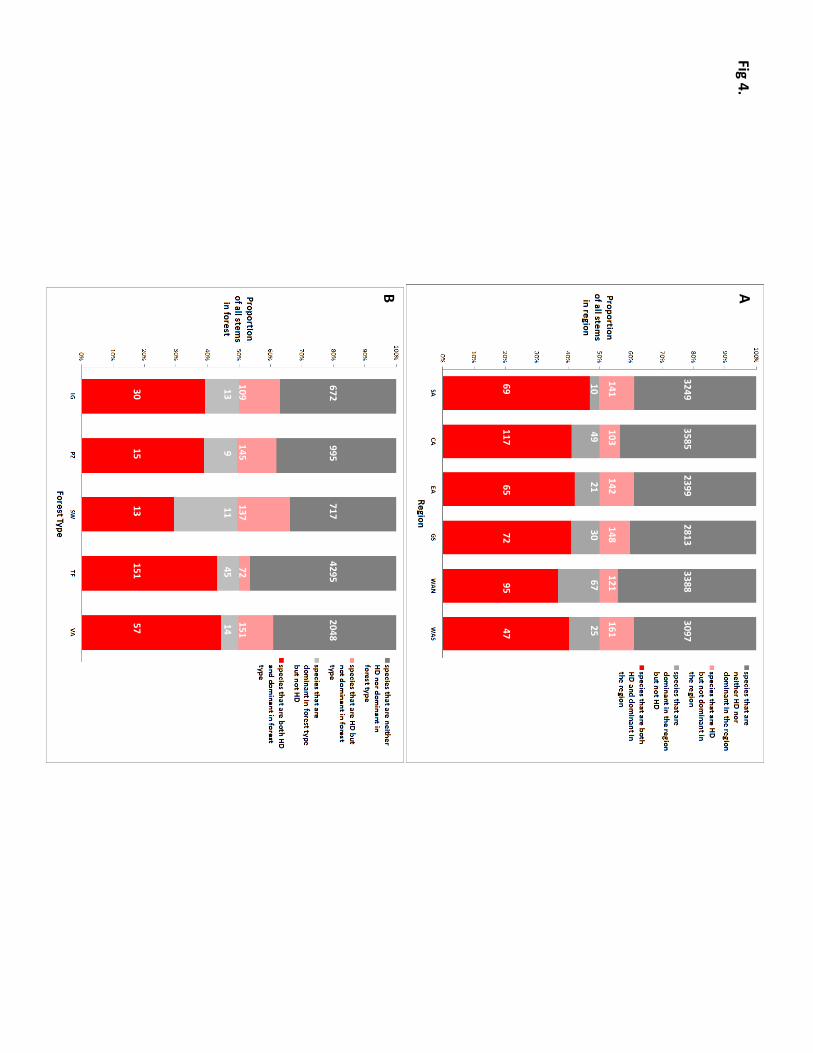
Within each region, an even smaller number of species (72–162) typically accounts for 50% of all individual
trees, and most of these regional dominants are also hyper-dominant species (Fig. 4a). For example, the data
suggest that half of all individual trees in SW Amazonia belong to just 62 species, 47 of which are also hyper-
dominant species. The same pattern holds for forest types, which are individually dominated by 24–196 species
(Fig. 4b). Half of all individual trees in white sand forest belong to just 24 species, 15 of which are also hyper-
dominant species. Because most hyper-dominant species are only dominant in 1–2 regions or forest types,
however, in any single region or forest type the majority of the 227 hyper-dominant species are not locally
dominant.
Given these results, it seems likely that the basin-wide patterns of dominance we describe here arise in part from
regional-scale patterns of dominance described previously at various sites in upper Amazonia (10, 11). There is
significant compositional overlap between Pitman et al.’s (10) ‘oligarchies’ in Peru and Ecuador and our hyper-
dominant species, even though those authors’ plots represent just 2.1% of the full ATDN dataset and only
include terra firme forests. Sixty-eight ‘oligarchs’ of (10) are on the list of 227 hyper-dominant species,
including 8 of the top 10 most common hyper-dominants. The 250 oligarchic species in (10) account for 26.9%
of all trees in Amazonia, according to the RAD in Fig. 2. These results suggest that the regional-scale and
Amazon-wide patterns derive from similar processes.

Hyper-dominant species occur across the angiosperm phylogeny, with no significant phylogenetic conservatism
for the maximum estimated population size found within each genus (Blomberg's K (12) = 0.076, p = 0.91).
Nevertheless, hyper-dominants are more frequent in some families (Appendix S2; Fig. S9). Arecaceae,
Myristicaceae, and Lecythidaceae have many (~4–5x) more hyper-dominant species than expected by chance,
while Myrtaceae, Melastomataceae, Lauraceae, Annonaceae, and Rubiaceae have fewer, probably because
many of their species are shrubs or treelets that do not reach our 10-cm diameter cutoff. In Fabaceae, the most
abundant and most diverse family in the dataset, the observed number of hyper-dominant species is not
significantly different from the expected.
We observed a negative relationship between the number of species in a genus and the frequency of hyper-
dominant species (Fig. S10). This pattern has been observed in several plant communities worldwide, and
scientists have yet to determine whether it is ecologically informative or an artifact of rank-based taxonomy
(13, 14). The 227 hyper-dominant species belong to 121 genera, and 68 of these contain more hyper-dominants
than expected by chance (Appendix S3). The highest number of hyper-dominant species is found in moderately
diverse Eschweilera (52 species overall; 2.4 hyper-dominant species expected vs. 14 observed), also the most
abundant genus in the ATDN dataset (5.2% of all stems). Given that the families and genera mentioned here
dominate Amazonian forests, it remains a key goal to determine why some achieve dominance with a large
number of mostly rare species (e.g., Inga, Sapotaceae) while others do so with a small number of common
species (palms), differences that may result from variation in speciation and extinction rates (13-16). And while
genetics data may reveal some hyper-dominant species to be species complexes, they seem unlikely to overturn
the fundamental patterns described here (17 and references therein).
We found no evidence that two key functional traits for trees, seed mass and wood density, vary consistently
with hyper-dominance. The 227 hyper-dominant species include both shade-tolerant, typically large-seeded
climax species with dense wood (e.g. Chlorocardium rodiei, Clathrotropis spp., Eperua spp.) and shade-
intolerant, small-seeded pioneers with light wood (e.g. Cecropia spp., Jacaranda copaia, Laetia procera).
Given that most hyper-dominant species attain very high local densities (>60 trees/ha) somewhere in the plot
network, we predict that they will be found to be disproportionately resistant to pathogens, specialist herbivores,
and other sources of frequency-dependent mortality (18, 19).
Widespread pre-1492 cultivation by humans is a compelling hypothesis to explain hyper-dominance (20).
Numerous hyper-dominant species are widely used by modern indigenous groups (Hevea brasiliensis,
Theobroma cacao, and many palms), and some are associated with pre-Columbian settlements (Attalea
butyracea, A. phalerata, Mauritia flexuosa) (21-25). On the other hand, most hyper-dominant species are not
commonly cultivated, many of the most commonly used hyper-dominants (palms) belong to a family that
appears to have been dominant in tropical South America since the Paleocene (26), and large portions of the
Amazon Basin do not appear to have been heavily cultivated before 1492 (27).
The discovery that Amazonia is dominated by just 227 tree species has important practical implications. It
suggests that roughly half of all fruits, flowers, pollen, leaves, and biomass in the world's most diverse forest
belong to a very small suite of species, which must therefore account for a large proportion of Amazonian
ecosystem services, including water, carbon and nutrient cycling. Our data also suggest that it may be possible
to forecast a significant proportion of the tree community composition and structure of unstudied sites in
Amazonia with a purely spatial model. While no one should underestimate the importance of the >10,000 rare
and poorly known tree species in the Amazon (28), an appreciation of how thoroughly common species
dominate the basin has the potential to greatly simplify research in Amazonian biogeochemistry, plant and
animal ecology, and vegetation mapping.
Methods
The ATDN network (29) comprises 1430 tree inventory plots distributed across the Amazon Basin and Guiana
Shield, hereafter Amazonia (Fig. 1). Plots were established between 1934 and 2011 by hundreds of different
botanists. Analyses of tree density were performed using the 1346 plots with trees ≥10 cm dbh that remained
after plots with outlying density values (<100 or >1000 ind./ha), poorly defined areas, or a different diameter
cutoff level were removed.
Analyses of composition were performed with a subset of 1170 plots in which all 639,631 free-standing trees
≥10 cm dbh had been identified with a valid name at the species (86.6%), genus (96.9%), or family (98.9%)
level prior to our study. We did not compare specimens or re-identify trees from these plots but resolved major
nomenclatural issues (i.e., synonyms and misspellings) in the existing datasets by cross-checking all names with
the TROPICOS database (30), via the Taxonomic Name Resolution Service (TNRS, 31) (version October
2011). For the small proportion of names whose validity could not be determined with those tools, we used The
Plant List (32). Lianas, bamboos, tree ferns, and tree-sized herbs were excluded from all analyses. Varieties and
subspecies were ignored (i.e., all individuals were assigned to the species level). While some individuals may be
misidentified, we assume that this error is within acceptable limits, especially for common species (see
discussion in OSM).
The total number of trees ≥10 cm dbh in Amazonia was estimated as follows. First, the study area was divided
into 567 1-degree-grid cells (DGCs; Fig. 1). We constructed a loess regression model for tree density (stems ha-
1) based on observed tree density in 1195 plots, with latitude, longitude, and their interaction as independent
variables. The span was set at 0.5 to yield a relatively smooth average. The model was used to estimate average
tree density in each DGC (DDGC, stems ha-1). The total number of trees in each DGC (NDGC) was then calculated
by multiplying DDGC by 1,232,100 ha (the area of a DGC close to the equator - the deviation from this area is
just 2.8% at 14 S and 1.1% at 8 N, our latitudinal range).
Both empirical (plot data) and interpolated tree densities are illustrated in Fig. S4.
The total number of trees belonging to each species in Amazonia was estimated as follows. Abundances of all
valid species were converted to relative abundances for each plot:
RAi = ni/N, where ni = the number of individuals of species i and N = the total number of trees in the plot
(including unidentified trees).

For each of the 4970 species with a valid name we constructed a loess model for RAi, with latitude, longitude,
and their interaction as independent variables, and a span of 0.2. We used only spatially independent variables,
since test runs including environmental variables commonly led to predictions of species occurrences in well-
sampled areas where they had never been recorded in plots. For a similar reason (i.e., to keep predictions
spatially conservative), a smaller span was used than in the tree density analysis. Negative predicted abundances
were set to 0. The loess model of a species predicted relative abundance in each DGC, yielding a map of its
predicted variation in relative abundances across Amazonia. The total population size of each species was
calculated by multiplying its relative abundance in each DGC by the total number of trees in that DGC, and then
summing these products for all DGCs.
To reduce the impact of individual plots and quantify uncertainty in the above procedure, a bootstrap exercise
was carried out. This involved randomly drawing 1000 plots from the 1170-plot dataset (with replacement), and
calculating the population sizes of all species as described above. This was repeated 500 times, and the 500
population estimates per species were used to calculate mean estimated population size and 95% confidence
intervals (i.e., mean ± 1.96 SD).
To estimate range size we used the same data and methods as (33), standardized with TNRS and updated with
specimen records from SpeciesLink (34). Species not found in this database were left out of the range size
analysis (n=842). Worldwide species diversity of genera was estimated by counting accepted species in (32).
Seed mass and wood density data were obtained from sources described in (35).
Habitat preference was analyzed by means of Indicator Species Analysis, a permutation test that calculates
indicator values for each species based on their frequency and relative abundance (36) in the five forest types
(igapó, terra firme, swamp, várzea, and white sand forest).
To analyze regional-level dominance, we divided Amazonia into six regions and created a rank-abundance
distribution (RAD) for each region by summing population sizes in the DGCs they contained. RADs were also
constructed for each forest type, by summing the individuals of each species in all plots of a given forest type
and calculating the average density of each species in that forest type. The forest type RADs are thus not based
on population estimates in DGCs but on the raw abundance data in our plots. A species was considered
dominant in a given region or forest type if it appeared in the list of species comprising the upper-50%
percentile of the respective RAD.

All analyses were carried out with the R software platform (37). For Indicator Species Analysis we used the
package labdsv. All other permutation tests were custom written.
References
1. G. A. Black, T. H. Dobzhansky, C. Pavan, Some attempts to estimate species diversity and population density of trees in Amazonian forests. Botanical Gazette 111, 413 (1950).
2. J. M. Pires, T. Dobzhansky, G. A. Black, An estimate of the number of species of trees in an Amazonian forest community. Botanical Gazette 114, 467 (1953).
3. M. J. G. Hopkins, Modelling the known and unknown plant biodiversity of the Amazon Basin. Journal of Biogeography 34, 1400 (2007).
4. S. P. Hubbell et al., How Many Tree Species Are There in the Amazon and How Many of Them Will Go Extinct? PNAS 105, 11498 (2008).
5. IUCN, IUCN Red List categories and criteria: version 3.1. (IUCN, Gland, Switzerland; Cambridge, UK, 2001).
6. M. J. Costello, R. M. May, N. E. Stork, Can we name earth's species before they go extinct? Science 339, 413 (2013).
7. P. Haripersaud, H. ter Steege, J.-J. de Granville, H. Chevillotte, M. Hoff, Species abundance, distribution and diversity in time and space after centuries of collecting in the Guianas. Taxon 59, 592 (2010).
8. D. P. Bebber et al., Herbaria are a major frontier for species discovery. Proceedings of the National Academy of Sciences 107, 22169 (2010).
9. J. C. Nekola, J. H. Brown, The wealth of species: ecological communities, complex systems and the legacy of Frank Preston. Ecology Letters 10, 188 (2007).
10. N. C. A. Pitman et al., Dominance and distribution of tree species in upper Amazonian terra firme forests. Ecology 82, 2101 (2001).
11. N. C. A. Pitman, M. R. Silman, J. W. Terborgh, Oligarchies in Amazonian tree communities: a ten-year review. Ecography 36, 114 (2012).
12. S. P. Blomberg, J. Garland, T, A. Ives, Testing for phylogenetic signal in comparative data: behavioral traits are more labile. Evolutionary Ecology Research 4, 717 (2003).
13. F. Domínguez Lozano, M. W. Schwartz, Patterns of rarity and taxonomic group size in plants. Biological Conservation 126, 146 (2005).
14. M. W. Schwartz, D. Simberloff, Taxon size predicts rates of rarity in vascular plants. Ecology Letters 4, 464 (2008).
15. J. E. Richardson, R. T. Pennington, T. D. Pennington, P. M. Hollingsworth, Rapid diversification of a species-rich genus of Neotropical rain forest trees. Science 293, 2242 (2001).
16. T. L. Couvreur, F. Forest, W. J. Baker, Origin and global diversification patterns of tropical rain forests: inferences from a complete genus-level phylogeny of palms. BMC biology 9, 44 (2011).
17. S. Cavers, C. W. Dick, Phylogeography of Neotropical trees. Journal of Biogeography 40, 615 (2013).
18. D. H. Janzen, Herbivores and the number of tree species in tropical forests. The American Naturalist 104, 501 (1970).
19. S. A. Mangan et al., Negative plant-soil feedback predicts tree-species relative abundance in a tropical forest. Nature 466, 752.
20. C. L. Erickson, in The Handbook of South American Archaeology, H. Silverman, W. H. Isbell, Eds. (Springer, New York, 2008), pp. 157-183.
21. W. Balée, D. G. Campbell, Evidence for the successional status of liana forest (Xingu river basin, Amazonian Brazil). Biotropica 22, 36 (1990).
22. C. Levis et al., Historical Human Footprint on Modern Tree Species Composition in the Purus-Madeira Interfluve, Central Amazonia. PLoS ONE 7, e48559 (2012).
23. D. A. Posey, Indigenous management of tropical forest ecosystems: the case of Kayapo´ Indians of the Brazilian Amazon. Agrofor Syst, 139 (1985).

24. C. M. Peters, in Imperfect Balance: Lanscape Transformation in the Pre-Columbian Americas, D. Lentz, Ed. (Columbia University Press, New York, 2000), pp. 203-223.
25. E. Montoya et al., Forest–savanna–morichal dynamics in relation to fire and human occupation in the southern Gran Sabana (SE Venezuela) during the last millennia. Quaternary Research 76, 335 (2011).
26. C. Gomez-Navarro, C. Jaramillo, F. Herrera, S. L. Wing, R. Callejas, Palms (Arecaceae) from a Paleocene rainforest of northern Colombia. American Journal of Botany 96, 1300 (2009).
27. C. McMichael et al., Sparse pre-Columbian human habitation in western Amazonia. Science 336, 1429 (2012).
28. D. Mouillot et al., Rare species support vulnerable functions in high-diversity ecosystems. PLoS Biol, (in press).
29. Amazon Tree Diversity Network. (ter Steege, H., http://web.science.uu.nl/Amazon/ATDN/, 2011), vol. 2012.
30. Tropicos.org. (Missouri Botanical Garden, http://www.tropicos.org, 2011), vol. 2012. 31. Taxonomic Name Resolution Service. (iPlant Collaborative, http://tnrs.iplantcollaborative.org,
2011), vol. v2.0, 2011. 32. The Plant list. (Royal Botanic Gardens, Missouri Botanical Gardens,
http://www.theplantlist.org/, 2010), vol. 2013. 33. K. J. Feeley, M. R. Silman, Extinction risks of Amazonian plant species. Proceedings of the
National Academy of Sciences 106, 12382 (2009). 34. SpeciesLink. (Centro de Referência em Informação Ambiental, http://splink.cria.org.br/, 2009). 35. H. ter Steege et al., Continental-scale patterns of canopy tree composition and function
across Amazonia. Nature 443, 444 (2006). 36. M. Dufrene, P. Legendre, Species assemblages and indicator species: the need for a flexible
asymmetrical approach. Ecological Monographs 67, 345 (1997). 37. R Development Core Team. (R Foundation for Statistical Computing, Vienna, Austria, 2011). 38. C. A. Quesada et al., Soils of Amazonia with particular reference to the RAINFOR sites.
Biogeosciences 8, 1415 (2011). 39. NASA Visible Earth. (NASA, http://visibleearth.nasa.gov/, 2005).
Acknowledgments.
This paper is the result of the work of hundreds of different scientists and research institutions in the Amazon
over the last 80 years. Without their hard work this analysis would have been impossible. We dedicate this paper
to the memory of four colleagues who contributed to and inspired this work but did not live to see Amazon-wide
analyses become possible: Alwyn Gentry, João Murça Pires, Marie-Françoise Prévost, and Samuel Soares
Almeida. This work was supported by: ALCOA Suriname; Betty and Gordon Moore to ACA/ACCA and
TEAM/INPA/Manaus; Banco de la República; CELOS Suriname; CAPES (PNPG); Conselho Nacional de
Desenvovimento Científico e Tecnológico of Brazil (CNPq) Projects PELD (558069/2009-6), PRONEX -
FAPEAM (1600/2006), Áreas Úmidas, MAUA; PELD (403792/2012-6), PPBio, CENBAM, Universal
(479599/2008-4), and Universal 307807-2009-6; FAPEAM projects DCR/2006, Hidroveg with FAPESP, and
PRONEX with CNPq; FAPESP; Colciencias; Ecopetrol; FEPIM 044/2003; Conservation International/DC
(TEAM/INPA Manuas), Gordon and Betty Moore Foundation; Guyana Forestry Commission; Investissement
d’Avenir grant of the French ANR (CEBA: ANR-10-LABX-0025); Margaret Mee Amazon Trust; Moore
Foundation to UT’s Lozano Long Institute of Latin American Studies; National Geographic Society (7754-04,

8047-06 to PMJ); Netherlands Foundation for the Advancement of Tropical Research WOTRO: grants WB85-
335, W84-581; Primate Conservation Inc.; Programme Ecosystèmes Tropicaux’ (French Ministry of Ecology
and Sustainable Development; Shell Prospecting and Development Peru; Smithsonian Institution’s Biological
Diversity of the Guiana Shield Program; The Body Shop; The Ministry of the Environment of Ecuador;
TROBIT; Tropenbos International; US National Science Foundation (NSF-0743457 & NSF-0101775 to PMJ);
USAID; Variety Woods Guyana; WWF-Brazil; WWF-Guianas; XIIéme Contrat de Plan Etat Région-Guyane
(French Government and European Union) and grants to RAINFOR from the European Union, UK Natural
Environment Research Council, the Gordon and Betty Moore Foundation, and US National Geographic Society.
OP is supported by a European Research Council Advanced Grant and a Royal Society Wolfson Research Merit
Award.
Supplementary Materials
www.sciencemag.org
Supplementary text
Figs. S1, S2, S3, S4, S5, S6, S7, S8, S9, S10, S11, S12
Tables S2, S2
Appendices S1, S2, S3
References (40-52)

Tables
Table 1. Mean estimated population sizes of the 20 most abundant tree species in Amazonia, and the empirical
abundance and frequency data on which the estimates were based. Median values for the 207 other hyper-
dominant species and for the 4743 other valid species in the dataset are provided for comparison. Data on all
species can be found in Appendix S1.
Species Mean
estimated
population
in the
Amazon
SD
estimated
population
(%)
No. trees in
dataset
% of all
plots where
present
Maximum
abundance
recorded
(trees/ha)
Euterpe precatoria 5.21E+09 9.9 5903 32.7 168
Protium altissimum 5.21E+09 18.0 5889 15.6 128
Eschweilera coriacea 5.00E+09 5.6 9047 47.9 28
Pseudolmedia laevis 4.30E+09 8.9 5285 36.1 121
Iriartea deltoidea 4.07E+09 13.1 8405 18.5 169
Euterpe oleracea 3.78E+09 17.5 8572 7.4 397
Oenocarpus bataua 3.71E+09 10.7 4767 29.9 108
Trattinnickia burserifolia 2.78E+09 29.4 3023 10 125
Socratea exorrhiza 2.68E+09 10.8 863 28.6 82
Astrocaryum murumuru 2.41E+09 11.2 5748 16.7 325
Brosimum lactescens 2.28E+09 10.0 2234 28.2 106
Protium heptaphyllum 2.13E+09 32.2 1365 11.3 169
Eperua falcata 1.95E+09 15.8 1898 10.9 266
Hevea brasiliensis 1.91E+09 15.5 6031 14.8 179
Eperua leucantha 1.84E+09 32.3 1453 1.4 282
Helicostylis tomentosa 1.79E+09 25.6 1948 36.5 89

Attalea butyracea 1.78E+09 16.2 2561 5.8 73
Rinorea guianensis 1.69E+09 18.6 1243 13.7 182
Licania heteromorpha 1.57E+09 14.4 2483 35 173
Metrodorea flavida 1.55E+09 14.7 1326 7.7 128
Median of other hyper‐
dominant species
5.79E+08 808 11.4 60
Median of non‐hyper‐
dominant species
1.11E+07 15 0.5 5

Table 2. The number of hyper-dominant species that are also dominant in individual forest types and regions.
Note that most hyper-dominants only dominate a single forest type, and most are dominant in 1-2 regions.
Colors are a visual aid to highlight the most frequent cells.
No. forest types where dominant
0 1 2 3 4 5 Total
0 2 4 0 0 0 0 6
1 17 47 9 0 0 0 73
N. regions 2 9 64 15 3 0 0 91
where dominant 3 2 17 3 2 1 0 25
4 0 12 2 4 1 0 19
5 0 5 1 4 2 0 12
6 0 0 1 0 0 0 1
Total 30 149 31 13 4 0 227

Figure captions
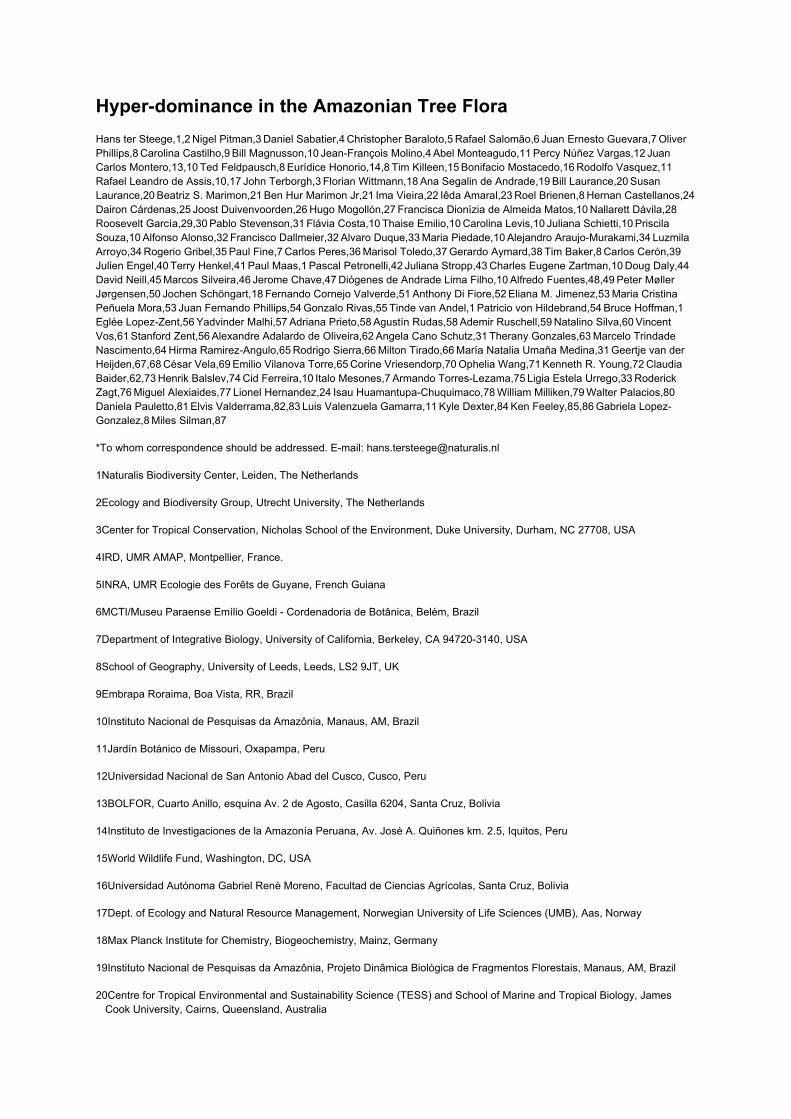
Fig 1. A map of Amazonia showing the location of the 1430 ATDN plots that contributed data to this paper. The
white polygon marks our delimitation of the study area at a 1-degree grid level (with sub-regions after (38)) and
consists of 567 1-degree grid cells (area = 6.29 million km2). Orange circles: plots on terra firme; Blue squares:
plots on seasonally or permanently flooded terrain (várzea, igapó, swamps); Yellow triangles: plots on white
sand podzols. Background ‘Visible Earth’ (39). More details are shown in Figs. S1-3.
Fig 2. A rank-abundance diagram (RAD) showing the estimated Amazon-wide population sizes of 4970 tree
species (solid line), and an extrapolation of the distribution (dotted line) used to estimate the total number of tree
species in Amazonia.
Fig 3. Characteristics of hyper-dominants. A. Hyper-dominant species (in red) have larger geographic ranges;
B. Reach higher maximum relative abundances in individual plots (middle); C. and are more likely to be habitat
specialists (right) than other species (in grey).
Fig 4. A. Proportions of the trees in each region belonging to species that are regionally dominant, hyper-
dominant, or neither. B. Proportions of the trees in each forest type belonging to species that are dominant in
that forest type, hyper-dominant, or neither. White integers show the number of species in each compartment.

Fig 1.
GS
CA
NWA
SWA
SA
EA
Species rich
ness
of th
e Amazo
n
Amazo
n Hyper‐d
ominan
tsJust 2
27 sp
ecies make
up 50% of all in
divid
uals
in th
e Amazo
n
62% of all sp
ecies are expected
to
have p
opulatio
ns u
nder a m
illion individ
uals
and are eq
uivalen
t to 0.12% of all trees in
the
Amazo
n
Close to
6000 sp
ecies are expected
to have p
opulatio
ns < 1
000
Fig 2.

Fig 3. A
BC
3249 3
585 2
399 2
813 3
388 3
097
141 1
03 1
42 1
48 1
21 1
61
10 4
9 2
1 3
0 6
7 2
5
69 1
17 6
5 7
2 9
5 4
7
672 9
95 7
17 4
295 2
048
109 1
45 1
37 7
2 1
51
13 9
11 4
5 1
4
30 1
5 1
3 1
51 5
7
Fig 4.
AB
Online supplementary material
Hyper-dominance in the Amazonian Tree Flora
ter Steege et al. 2013
This document includes:
A short description of our data (Table S1)
Maps of plot locations (Figs. S1-3)
Estimates of tree density across Amazonia (Fig. S4)
Confidence intervals for population estimates (Fig. S5)
Estimating species richness with Fisher’s alpha (Fig. S6)
Hyper-dominant species by plot (Fig. S7)
Species richness by country (Fig. S8)
Hyper-dominant species by family and in the APG tree (Table S2, Fig. S9)
Hyper-dominant species and size of genus world-wide (Fig. S10)
Testing the validity of the model predictions (Figs. S11,12)
Additional references for the online supplementary material
Appendices S1-S3 (Excel file)

A short description of our data
The 1170 tree plots used for compositional analyses were distributed among regions and forest types as shown in Figure 1 and Table S1 (see also Figs. S1-S3). Most plots (852) measured 1 ha, 253 were smaller, 61 were larger, and 4 were plotless samples (point centered quarter) for which the sampled area was unknown but the number of trees was equivalent to that typically found in 0.5-1 ha.
Table S1. The number of tree plots with compositional data in each of the five forest types and six regions used in the study.
The proportions of tree plots in the ATDN dataset that sample the five forest types are roughly equivalent to the proportions of Amazonia covered by those forest types. Várzea and igapó together cover 10% of Amazonia (38, 40) and account for 19% of our plots. Podzols and arenosols cover 4.6% of Amazonia (38) and account for 6% of our plots. Swamps account for 1.8% of our plots, and peatlands are believed to account for approximately 1.7% of the study area (41).
We found a total of 4970 valid species, 817 genera, and 122 families in the 1170 tree plots used for compositional analyses. Fabaceae, not surprisingly, is the most abundant family, with almost 100,000 individual trees and 119 genera, followed by Arecaceae (52,507; 25), Lecythidaceae (46,322; 10), Sapotaceae (40,429; 17), Malvaceae (29,424; 36), Burseraceae (28,762; 7), Chrysobalanaceae (28,597; 7), Moraceae (28,069; 19), Euphorbiaceae (25,955; 42), and Annonaceae (22,378; 27). Fabaceae are also the most species-rich family, with 795 species, followed by Lauraceae (311), Annonaceae (289), Rubiaceae (278), Sapotaceae (207), Chrysobalanaceae (195), Myrtaceae (176), Malvaceae (168), Melastomataceae (168), and Euphorbiaceae (143). Note that Fabaceae has more than twice as many species as the second most diverse family.
The genera with the largest numbers of individuals were Eschweilera (31,495), Protium (26,131), Pouteria (21,852), Licania (21,321), Euterpe (14,802), Inga (14,791), Eperua (10,951), Virola (10,283), Astrocaryum (8973), and Lecythis (8505).
The most species-rich genus was Inga with 134 species, followed by Pouteria (117), Licania (105), Ocotea (93), Miconia (92), Guatteria (85), Eugenia (76), Protium (69), Swartzia (67), Ficus (59), and Eschweilera (52).
We made two adjustments to the names given in TROPICOS (methods). Rollinia was merged with Annona, because phylogenetic analysis has revealed it to be nested inside that genus (42). Similarly, Crepidospermum and Tetragastris are nested in Protium (Fine & Daly in prep.) and were merged into that genus.
Region IG PZ SW TF VA Total
CA 13 5 4 213 48 283
EA 3 71 30 104
GS 7 47 5 222 8 289
NWA 21 19 4 140 40 224
SA 2 71 18 91
SWA 3 7 133 36 179
Total 47 71 22 850 180 1170

Figure S1. Map of all plots in terra firme forest. Amazonian regions delimited in red after (after 38).

Figure S2. Map of all plots in podzol forest, with the extent of white sand Podzol (Pz) and very poor Arenosol (Ar) soils in yellow according to (38, 43). Amazonian regions delimited in red after (after 38).
Figure S3. Map of all plots in várzea, igapó, and swamp forests, with the extent of floodplain soils (Gleysoils (Gl), Fluvisols (Fl) and Histosols (Hs)) in blue according to (38, 43). Amazonian regions delimited in red after (1).
Estimates of tree density across Amazonia
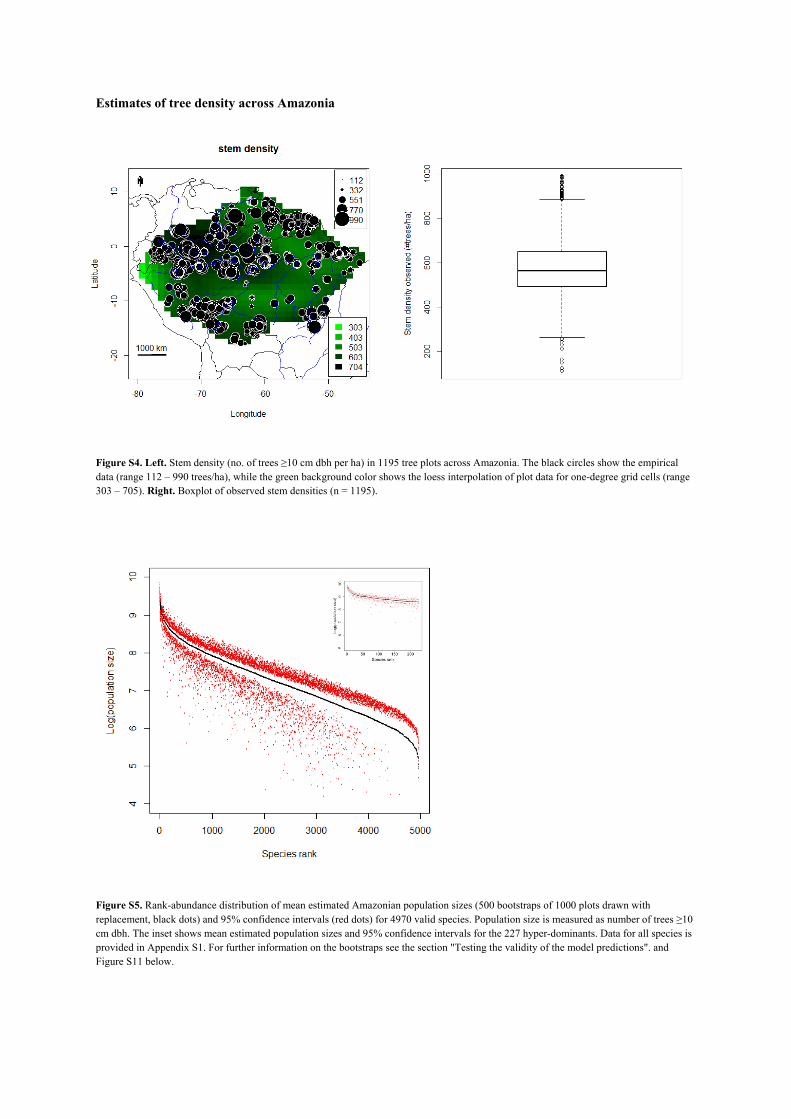
Figure S4. Left. Stem density (no. of trees ≥10 cm dbh per ha) in 1195 tree plots across Amazonia. The black circles show the empirical data (range 112 – 990 trees/ha), while the green background color shows the loess interpolation of plot data for one-degree grid cells (range 303 – 705). Right. Boxplot of observed stem densities (n = 1195).
Figure S5. Rank-abundance distribution of mean estimated Amazonian population sizes (500 bootstraps of 1000 plots drawn with replacement, black dots) and 95% confidence intervals (red dots) for 4970 valid species. Population size is measured as number of trees ≥10 cm dbh. The inset shows mean estimated population sizes and 95% confidence intervals for the 227 hyper-dominants. Data for all species is provided in Appendix S1. For further information on the bootstraps see the section "Testing the validity of the model predictions". and Figure S11 below.
Estimating species richness with Fisher’s alpha
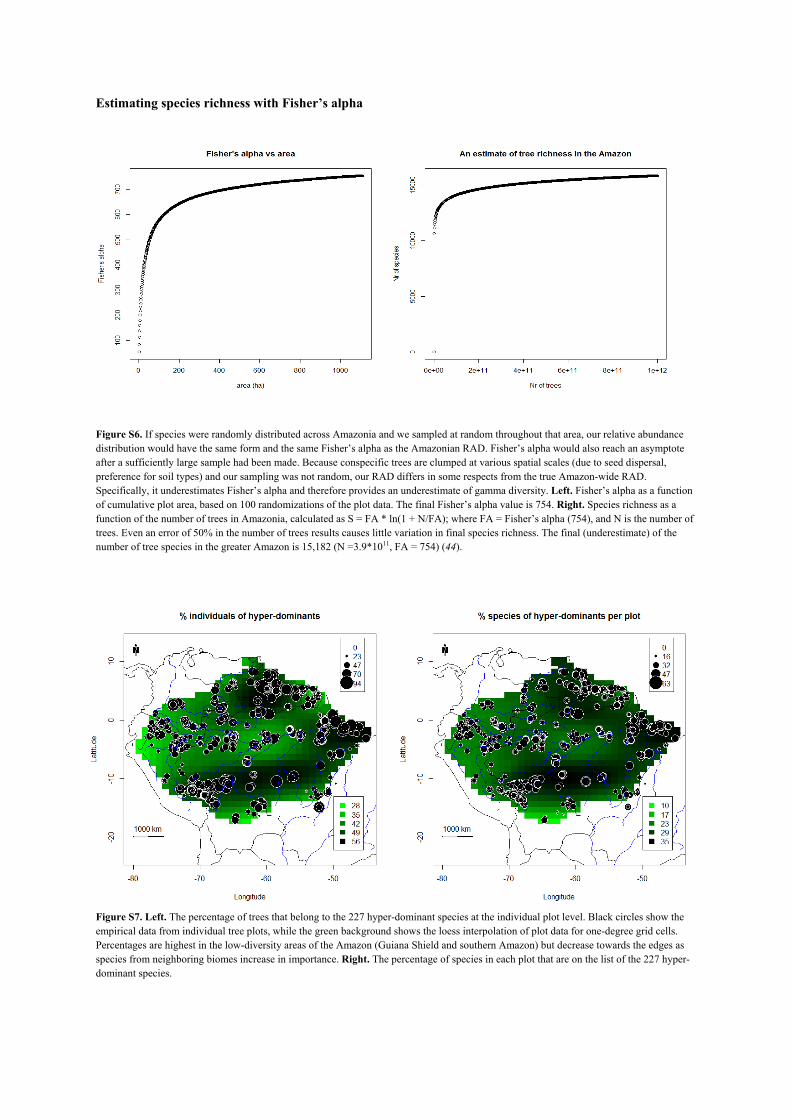
Figure S6. If species were randomly distributed across Amazonia and we sampled at random throughout that area, our relative abundance distribution would have the same form and the same Fisher’s alpha as the Amazonian RAD. Fisher’s alpha would also reach an asymptote after a sufficiently large sample had been made. Because conspecific trees are clumped at various spatial scales (due to seed dispersal, preference for soil types) and our sampling was not random, our RAD differs in some respects from the true Amazon-wide RAD. Specifically, it underestimates Fisher’s alpha and therefore provides an underestimate of gamma diversity. Left. Fisher’s alpha as a function of cumulative plot area, based on 100 randomizations of the plot data. The final Fisher’s alpha value is 754. Right. Species richness as a function of the number of trees in Amazonia, calculated as S = FA * ln(1 + N/FA); where FA = Fisher’s alpha (754), and N is the number of trees. Even an error of 50% in the number of trees results causes little variation in final species richness. The final (underestimate) of the number of tree species in the greater Amazon is 15,182 (N =3.9*1011, FA = 754) (44).
Figure S7. Left. The percentage of trees that belong to the 227 hyper-dominant species at the individual plot level. Black circles show the empirical data from individual tree plots, while the green background shows the loess interpolation of plot data for one-degree grid cells. Percentages are highest in the low-diversity areas of the Amazon (Guiana Shield and southern Amazon) but decrease towards the edges as species from neighboring biomes increase in importance. Right. The percentage of species in each plot that are on the list of the 227 hyper-dominant species.

Species r
Our data Amazoniwere pooconstructcountry. grids cell
Figure S8. Amazoniancountry (se
richness by co
provide estimian portions ooled for this exting a Rank-APopulation sizls whose centr
Rank-Abundancn and/or Guianan ee text for explana
ountry
mates of the nuf Bolivia, Braxercise; and in
Abundance Diszes were estimroids were in t
ce Distributions foportions of their
ation). Estimates
umber of tree azil, Colombian the Guianan stribution of thmated by summthat country.
or countries in theterritories, and libased on one run
species occura, Ecuador, ann and Amazonihe estimated pming the num
e greater Amazoninear extrapolation of the full datas
rring in each cnd Peru; in theian portions opopulations of
mber of trees of
n, constructed froons that yield the et for 1170 plots.
ountry in the three Guiananf Venezuela; f all species prf each species
om estimated popuestimated number
study area (i.ean countries, wsee Fig. 1) byredicted to ocs in all the 1-d
ulation sizes in ther of tree species i
e., in the which y cur in a
degree
he in each

Table S2. Families with significantly more (hi) or significantly fewer (lo) hyper‐dominant species than expected by chance are few. Palms (Arecaceae) have nearly five times more hyper‐dominant species than expected by chance. Some very large and well-known families of the Amazon (Fabaceae, Sapotaceae and Chrysobalanaceae) have as many hyper‐dominant species as expected by chance (Appendix S2). Family: name according to Tropicos (13), N ind: Number of individuals in 1170 plots used, N species: Number of species in 1170 plots used, HyperDom: Number of hyper-dominant species in family/genus observed, HypDomExp: Number of hyper-dominant species in family/genus expected (based on 1000 randomizations), ci.lo: lower 95% confidence limit for expected number of hyper-dominant species (based on 1000 randomizations), ci.hi: higher 95% confidence limit for expected number of hyper-dominant species (based on 1000 randomizations), hilo: significant deviation from expected number of hyper-dominants.
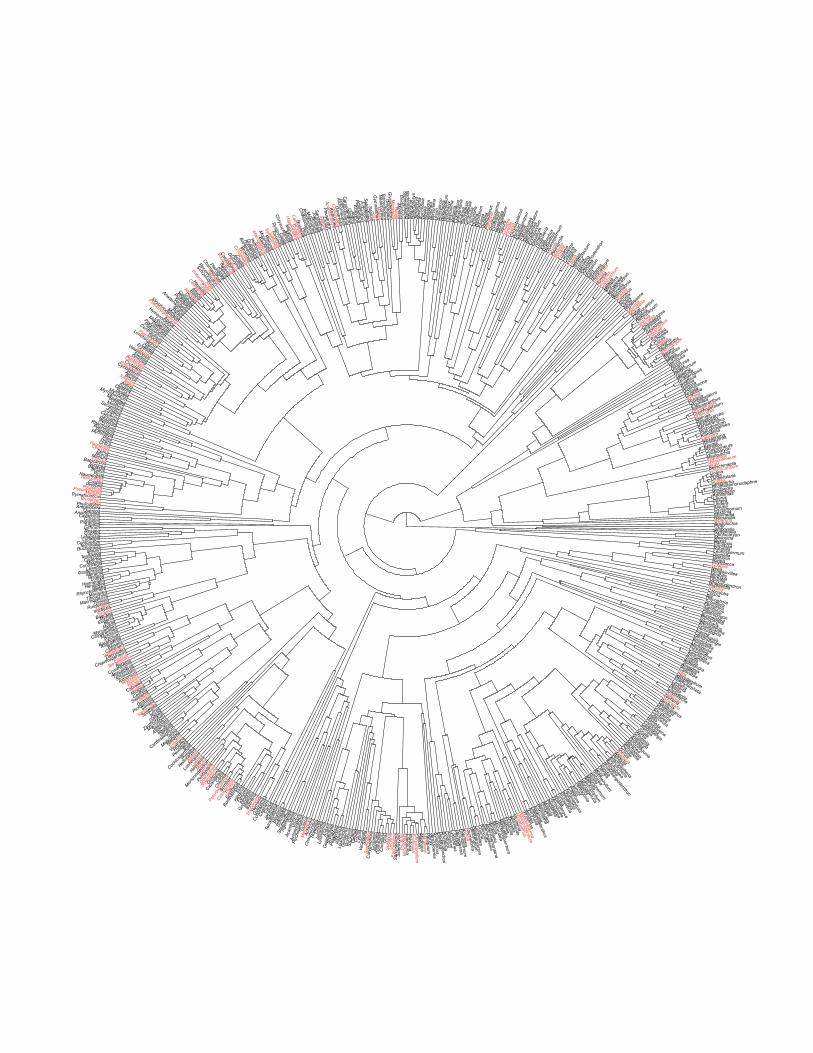
Figure S9 (next page). An illustration of phylogenetic convergence in hyper-dominance among Amazonian tree genera. Radial phylogeny is based on two plastid markers and represents the maximum clade credibility topology from Bayesian MCMC analysis (Dexter et al., unpubl. Data (45)). Genera in red host at least one HD species. Some genera from our plot database were not available for this illustration.
Family N ind N species HyperDom HypDomExp ci.lo ci.hi hilo
Arecaceae 52507 70 15 3.196 ‐0.183 6.575 hi
Lecythidaceae 46332 107 19 4.846 0.698 8.994 hi
Malvaceae 29424 168 15 7.743 2.619 12.867 hi
Burseraceae 28762 94 11 4.186 0.215 8.157 hi
Moraceae 28069 135 11 6.194 1.542 10.846 hi
Euphorbiaceae 25955 143 14 6.496 1.650 11.342 hi
Myristicaceae 21648 57 11 2.564 ‐0.420 5.548 hi
Meliaceae 14134 71 8 3.261 ‐0.269 6.791 hi
Urticaceae 11869 67 7 3.205 ‐0.096 6.506 hi
Violaceae 10814 35 5 1.664 ‐0.816 4.144 hi
Goupiaceae 1670 1 1 0.037 ‐0.333 0.407 hi
Annonaceae 22378 289 4 13.21 6.424 19.996 lo
Lauraceae 18629 311 4 14.26 7.367 21.153 lo
Rubiaceae 11490 277 1 12.678 6.217 19.139 lo
Melastomataceae 8225 168 7.662 2.650 12.674 lo
Myrtaceae 7912 176 8.049 2.717 13.381 lo
PiperAristolochiaSiparunaHernandiaMollinediaSextoniaCinnamomumAioueaLinderaPerseaLaurusApolloniasEndlicheriaNectandraRhodostemonodaphne
GoeppertiaOcoteaUmbellulariaAnibaLicariaChlorocardiumBeilschmiediaVirolaOsteophloeumIryantheraMauloutchiaCoelocaryon
CompsoneuraMyristicaKnemaAnaxagorea
MosannonaOxandraKlarobeliaPseudomalmea
RuizodendronEphedranthusDesmopsisPseudoxandraMalmeaUnonopsis
Onychopetalum
Bocageopsis
Tetrameranthus
TrigynaeaCymbopetalum
PorceliaXylopiaDuguetiaFusaeaDiclinannona
AnnonaRolliniaGuatteria
Guatteriopsis
MagnoliaTalauma
Hedyosmum
SmilaxDioscorea
YuccaBambusa
Phytelephas
ElaeisAiphanes
Bactris
Astroca
ryum
Reinhardtia
Syagrus
Attalea
Cocos
Scheelea
Prestoea
Euterpe
Oenocarp
us
Geonoma
Roysto
nea
Chamaedorea
Socratea
Iriarte
aDict
yoca
ryum
Wet
tinia
Chelyo
carp
us
Sabal
Mau
ritiel
la
Mau
ritia
Hyper
baen
a
Abuta
Oxalis
Roure
a
Conna
rus
Sloan
ea
Wei
nman
nia
Brune
llia
Ruptili
ocar
pon
Zino
wiewia
May
tenu
s
Salac
ia
Che
ilocl
iniu
m
Dry
pete
s
Hum
iria
Saco
glot
tis
Hum
irias
trum
Vant
anea
Salix
Hom
aliu
m
Xylo
sma
Pleu
rant
hode
ndro
n
Has
selti
a
Vism
ia
Tetra
thyl
aciu
m
Luna
nia
Laet
ia
Zuel
ania
Cas
earia
Laci
stem
a
Loza
nia
Gou
pia
Rin
orea
Payp
ayro
la
Leon
ia
Glo
eosp
erm
um
Hyb
anth
us
Am
phirr
hox
Vio
laLi
ndac
keria
Turn
era
Pas
siflo
ra
Ery
thro
xylu
m
Rhi
zoph
ora
Ste
rigm
apet
alum
Cas
sipo
urea
Trig
onia
Exe
llode
ndro
n
Par
inar
i
Chr
ysob
alan
us
Lica
nia
Hir
tella
Cou
epia
Tapu
raD
icha
peta
lum
Ixon
anth
es
Cyr
illop
sis
Och
thoc
osm
us
Car
yoca
r
Ant
hodi
scus
Our
atea
Elv
asia
Dip
orid
ium
Qui
ina
Lacu
naria
Tour
oulia
Ces
pede
sia
Sau
vage
sia
Am
anoa
Mar
gari
tari
a
Phy
llant
hus
Ric
heri
aH
eyro
nim
aP
odoc
alyx
Heb
epet
alum
Rou
cher
iaS
cler
olin
onLi
num
Byr
soni
ma
Spa
chea
Pte
rand
raH
iraea
Bun
chos
iaM
asca
gnia
Tetr
apte
rys
Het
erop
tery
sM
alpi
ghia
Ban
iste
riop
sisS
tigmaphyllon
Cnidoscolus
ManihotH
eveaM
icrandraG
lycydendronO
mphalea
TetrorchidiumN
ealchorneaM
abeaG
ymnanthes
Hura
Sapium
SebastianiaE
uphorbiaC
ubanthusP
edilanthusA
calyphaA
deliaC
leidion
Caryodendron
Dalecham
pia
Alchorneopsis
Gavarretia
Conceveiba
Alchornea
Aparisthm
ium
Pausandra
Croton
Sagotia
Sandw
ithia
Joannesia
Jatropha
Maprounea
Pogonophora
Chaetocarpus
Pera
Bonnetia
Calophyllum
Caraipa
Haploclathra
Mahurea
Marila
Chrysochlam
ys
Clusia
Dystovom
ita
Tovomita
Garcinia
Sym
phonia
Platonia
Moronobea
Bauhinia
Macrolobium
Eperua
Peltogyne
Guibourtia
Hym
enaea
Brow
neopsis
Brow
nea
Dicym
be
Cynom
etra
Crudia
Apuleia
Dicorynia
Dialium
Caesalpinia
Vouacapoua
Batesia
Senna
Cassia
Pterogyne
Cham
aecrista
Tachigali
Recordoxylon
SchizolobiumInga
Enterolobium
Zygia
Havardia
Cedrelinga
Albizia
Balizia
Abarema
Cojoba
Calliandra
Poeppigia
Piptadenia
Vachellia
AnadenantheraAcacia
Parkia
Mim
osa
Stryphnodendron
PseudopiptadeniaAndira
Hymenolobium
Lecointea
Machaerium
Dalbergia
Platymiscium
Platypodium
CentrolobiumDioclea
Pterocarpus
LonchocarpusDerris
Clitoria
ErythrinaVatairea
VataireopsisSweetia
Ormosia
Acosmium
DiplotropisCrotalaria
Poecilanthe
CyclolobiumAteleiaBocoaSwartziaAlexaAldinaDussia
DipteryxTaraleaMyroxylon
MyrospermumMoutabeaPolygala
MonninaSecuridacaPrunus
ZiziphusColubrinaGouania
RhamnusReynosia
RhamnidiumBoehmeriaParietaria
MyriocarpaPileaUreraUrticaPouroumaCecropiaTremaMorusMacluraClarisiaBatocarpusSoroceaBagassaTrophisFicusNaucleopsisHelicostylisCastillaPerebeaPoulseniaPseudolmediaMaquiraTrymatococcusBrosimumCeltisPhyllostylonAmpeloceraQuercusAnisophylleaCayaponiaGurania
PicramniaTurpiniaLythrumNesaeaCuphea
LafoensiaLudwigia
CombretumTerminalia
BuchenaviaMouririTococa
TetrazygiaClidemiaMiconia
ConostegiaLeandra
GraffenriedaMerianiaBellucia
Loreya
HenriettellaHenriettea
Blakea
Rhynchanthera
Macairea
Tibouchina
MacrocentrumTriolena
RuizteraniaQualea
VochysiaErisma
BaeckeaMyrtus
EugeniaPlinia
Myrcia
Myrcianthes
Calyptranthes
Myrciaria
Psidium
Backhousia
Angophora
Beiselia
Canarium
Trattinnickia
Dacryodes
Crepidospermum
Protium
Tetragastris
Bursera
Commiphora
Anacardium
Thyrsodium
Schinopsis
Astronium
Spondias
Tapirira
Trichilia
Cabralea
Guarea
Ruagea
Cedrela
Swietenia
Carapa
Quassia
Picrolemma
Simaba
Simarouba
Spathelia
Citrus
Hortia
Galipea
Zanthoxylu
m
Macrosty
lis
Sapindus
Allophy
lus
Paullinia
Serjania
Cardiosp
ermum
Talis
ia
Melico
ccus
Mat
ayba
Cupan
ia
Vouar
ana
Huerte
a
Perro
ttetia
Bixa
Cochlo
sper
mum
Pimel
ea
Helio
carp
usApe
iba
Lueh
eops
isLu
ehea
Helict
eres
Mat
isia
Mor
toni
oden
dron
Sterc
ulia
Pent
apla
ris
Qua
rarib
ea
Scle
rone
ma
Och
rom
a
Cav
anille
sia
Cei
baC
horis
ia
Pseu
dobo
mba
xBo
mba
x
Cat
oste
mm
aPa
chira
Erio
thec
a
Bom
baco
psis
Sid
aH
ibis
cus
Pavo
nia
Abu
tilon
Gos
sypi
umH
ampe
aB
yttn
eria
Theo
brom
aH
erra
nia
Gua
zum
a
Con
ocar
pus
Cap
paris
Car
ica
Jaca
ratia
Tetra
cera
Tetra
styl
idiu
mH
eist
eria
Cat
hedr
aS
choe
pfia
Str
utha
nthu
sA
gona
ndra
Opi
liaA
cant
hosy
risV
iscu
mA
chat
ocar
pus
Pty
chop
etal
umD
ulac
iaM
inqu
artia
Apt
andr
aC
haun
ochi
ton
Nor
ante
aC
lavi
jaJa
cqui
nia
Lysi
mac
hia
Ard
isia
Gei
ssan
thus
Sty
logy
neP
arat
hesi
sM
yrsi
neR
apan
eaLi
ssoc
arpa
Dio
spyr
osG
ordo
nia
Sau
raui
aC
leth
raC
yrill
aLy
onia
Vac
cini
umS
atyr
iaB
erth
olle
tiaC
oryt
hoph
ora
Cou
rata
riA
llant
oma
Cou
roup
itaC
arin
iana
Gri
asG
usta
via
Lecy
this
Esc
hwei
lera
Sar
cosp
erm
aS
ider
oxyl
onP
oute
ria
Mic
roph
olis
Elaeolum
aP
radosiaE
cclinusaC
hrysophyllumD
iploonM
adhucaM
anilkaraP
alaquiumS
tyraxTernstroem
iaS
ymplocos
Ipomoea
Duckeodendron
Brunfelsia
Cestrum
Solanum
LycianthesP
hysalisTrichodesm
aLithosperm
umB
ourreriaC
ordiaTournefortiaH
eliotropiumP
arahancorniaLacm
elleaC
ouma
Rauvolfia
Stem
madenia
Tabernaemontana
Am
belaniaM
ucoaM
acoubeaTrachelosperm
um
Malouetia
Matelea
Prestonia
Thevetia
Allam
andaP
lumeria
Him
atanthusG
eissospermum
Aspidosperm
a
Strychnos
Antonia
Bonyunia
Dialypetalanthus
Faramea
Psychotria
Palicourea
Rudgea
Morinda
Pagamea
Coussarea
Hem
idiodia
Sperm
acoce
Diodia
Posoqueria
Pinckneya
Chim
arrhis
Ferdinandusa
Capirona
Alseis
Sim
iraPentagonia
Hippotis
Warszew
iczia
Calycophyllum
BathysaM
acrocnemum
Rustia
SabiceaR
etiniphyllum
IxoraG
enipaR
andiaRosenbergiodendron
Tocoyena
Kutchubaea
Botryarrhena
Stachyarrhena
Borojoa
Alibertia
Amaioua
DuroiaChione
Rondeletia
Machaonia
Malanea
Gonzalagunia
Antirhea
Guettarda
Chomelia
Isertia
Joosia
Remijia
Ladenbergia
Cinchona
Cosmibuena
Hamelia
Hillia
Chiococca
Coutarea
Exostema
Hydrolea
Drymonia
Gasteranthus
Besleria
Jacaranda
Zeyheria
Tabebuia
Amphitecna
Crescentia
Petrea
Verbena
Lantana
Stachytarpheta
Aegiphila
Clerodendrum
Vitex
Callicarpa
Buddleja
Avicennia
Aphelandra
Justicia
Ruellia
Trichanthera
Sanchezia
Chionanthus
Forestiera
Metteniusa
Poraqueiba
Emmotum
Dendrobangia
Cassinopsis
Icacina
Sarcostigma
Pyrenacantha
Stenopadus
Baccharis
Piptocarpha
Burmeistera
Centropogon
Viburnum
Sambucus
Pennantia
Schefflera
Discophora
IlexCissusCoccoloba
TriplarisRuprechtiaRhabdodendron
OpuntiaPereskiaMirabilisBougainvilleaNeeaGuapiraPhytolaccaRivinaPetiveriaDiastellaLeucospermumRoupalaEuplassaPanopsisBuxusMeliosmaOphiocaryonNymphaeaAmborella

Figure S10. Hyper-dominant species are found more often (101 times) in genera that have few (20) species worldwide than expected by chance (59 times, p < 0.001). Hyper‐dominants in red. NB: this figure does not correct for phylogeny nor account for the different ages of each genus.

Testing t
A fundamwere reasdataset israndomlyenvironmrespond tdifficult tAmazoni
We addre
Addressin
To test hoof hyper-dominantthe total)dominantruns show
Figure S11Median ranline : y=x
In bootstrqualified 275, and provide sstable an
The medi40.7% (raforest 43species wevenly di20 hyper50.0%, v
the validity o
mental assumpsonably accurs very small coy across the st
mental data wato environmento test: 5) the ian tree specie
essed these sh
ng problems 1
ow sampling i-dominant spet in the 500 ru qualified as hts in more thawed high stab
1. Most hyper-domnk (B) and mean r
rap runs for wd as rare. The l
hyper-dominastrong evidencd predictable
ian percentagange = 0-93.9.6%, swamp 3
was 32 per ploistributed acro-dominants. F
várzea 42.8%.
of the model p
ption of our anrate for the moompared to thtudy area; 3) tras used by thental heterogenfact that a bas
es, which prec
hortcomings by
1 and 2: the si
intensity and tecies, we recoruns of the boohyper-dominaan half of runsility.
minant species qurank (C) were bot
which a given lowest medianant species nece that the idewith varying
e of individua9%, Fig. S7). C35.9%, várzeaot (range = 0-7oss AmazoniaFor the other f
predictions
nalyses is thatost abundant she community rees were idenmodel, even t
neity in the stusin-wide popucludes a comp
y quantifying
ize of the data
the geographirded the frequtstrap exercise
ants in 90-100% (Fig. S10a). M
ualified as hyper-th close to the spe
hyper-dominan rank observeever ranked lontities and estlevels of samp
als that belongComparable fia 34.7%, and t78. The 438 pl
but not acrosforest types the
t the populatiospecies. This a
to which it wntified by manthough many
udy area. A fifulation size haarison betwee
the error that
aset and the cl
ic distributionuency with whe described in% of runs, whMedian (Fig.
-dominant speciesecies' final rank b
ant species dided for a hyper
ower than 1000timated populpling intensity
g to hyper-domfigures for the terra firme 30.lots containingss forest type. e percentage i
on size estimatassumption is
was extrapolateny different respecies in the
fth problem mas not been emen projected an
t each could in
lumped distrib
n of plots affechich the 227 hn the methods hile 207 specieS10b) and me
s (ranks 1 - 227) based on mean es
d not qualify ar-dominant spe0th (i.e., ranksation sizes of y and geograp
minant speciesfive forest typ.1%. The medg fewer than 2Only 15.1% ois: igapó 76.6%
tes generated disputable for
ed; 2) tree plotesearch teams;e ATDN datas
makes the assummpirically dete
nd observed v
ntroduce into o
bution of plots
cted the estimayper-dominansection. Most
es (91.2%) quean (Fig. S10c
in most of the 50timated populatio
among the topecies in the 50s 1000-4790). the hyper-domhic bias.
s within an indpes are: igapó dian number of20 hyper-domof all terra firm%, white sand
by the loess mr a few reasonts were not di; and 4) no set are known mption especi
ermined for anvalues.
our results.
s
ated populationts qualified at species (137
ualified as hypc) ranks for th
00 bootstrap runs on size. B and C:
p 227 species, 00 bootstrap ru These analysminant specie
dividual plot w 32.9%, whitef hyper-domin
minant species me plots have d forest 78.9%
model ns: 1) the istributed
to ially
ny
on sizes as hyper-, 60% of
per-e 500
(A). straight
it rarely uns was ses s remain
was e sand nant were less than
%, swamp

Addressing problem 3: taxonomic and identification problems
Taxonomic and identification problems are widespread in Amazonian tree inventories. However, two independent lines of evidence suggest that resolving these problems will not fundamentally alter the patterns described for hyper-dominant species.
First, we observed a consistent relationship in the ATDN dataset between the abundance of a species and the likelihood that it had been identified with a valid name. The percentage of identified species in individual plots was significantly higher than that of unidentified species-level taxa (87.0 vs. 13% stems/ha, FS = 22,774, p << 0.001). Furthermore, very common morpho-species are very infrequent in the ATDN dataset. Only 48 of the 1170 ATDN plots contained a morpho-species that accounted for >10% of all individuals and only 10 plots contained a morpho-species that reached >20%. Given that all 227 hyper-dominants reach high local relative abundances (Fig. 3b), these numbers suggest that very few currently unidentified species will eventually qualify as hyper-dominant species.
Second, we see strong evidence that taxonomic and identification problems are less severe in hyper-dominant species than in other species, in the form of a strong positive correlation between the abundance of a species in the field, the number of specimens in herbaria, and the number of fertile specimens (i.e., specimens with flowers or fruits) collected during field work. Common species are better represented in herbaria than rare species, because individual collectors are more likely to encounter them (46). Common species are also more likely than rare species to be collected fertile during the establishment of tree plots. For example, in 25 ATDN plots established in eastern Ecuador (47), we found that hyper-dominant species were more likely than other species to be collected fertile (27.8 vs. 17.7%). Botanists trying to identify a hyper-dominant species thus have both a higher likelihood of matching their field specimens with museum specimens and a broader range of morphological features to facilitate identification.
Addressing problem 4: no use of environmental data
The model we used to estimate population sizes was a loess function, parameterized exclusively with plot location and observed species abundances in plots. This is a very different approach from the most commonly used class of species distribution modeling: maximum entropy modeling, or Maxent (48, 49). Maxent uses presence-only data fitted to environmental variables of confirmed locations to produce a map of habitat suitability. In a Maxent model, a species known to occur under a given set of environmental conditions is predicted to occur in all environmentally similar areas, even when those areas are outside of the species' known range. Because Amazonian tree species are known to respond strongly to environmental variation, an earlier version of our model included climatic data. That version, however, routinely predicted significant populations of species in regions of the Amazon where a large number of ATDN plots and other plant collection efforts had consistently failed to record those species (i.e., Type I errors were common). Modeling with only latitude and longitude as predictive variables is a more conservative option, because it ensures that such errors will be made at a much lower frequency and that species will never be predicted far from confirmed records. For the same reason we used a span of 0.2; at higher span values species ranges extended too far into areas with no known occurrence. Varying span values from 0.2 to 0.5 did not strongly affect population size estimates. Fig. S11 shows three examples of modeled ranges with a span value of 0.2.
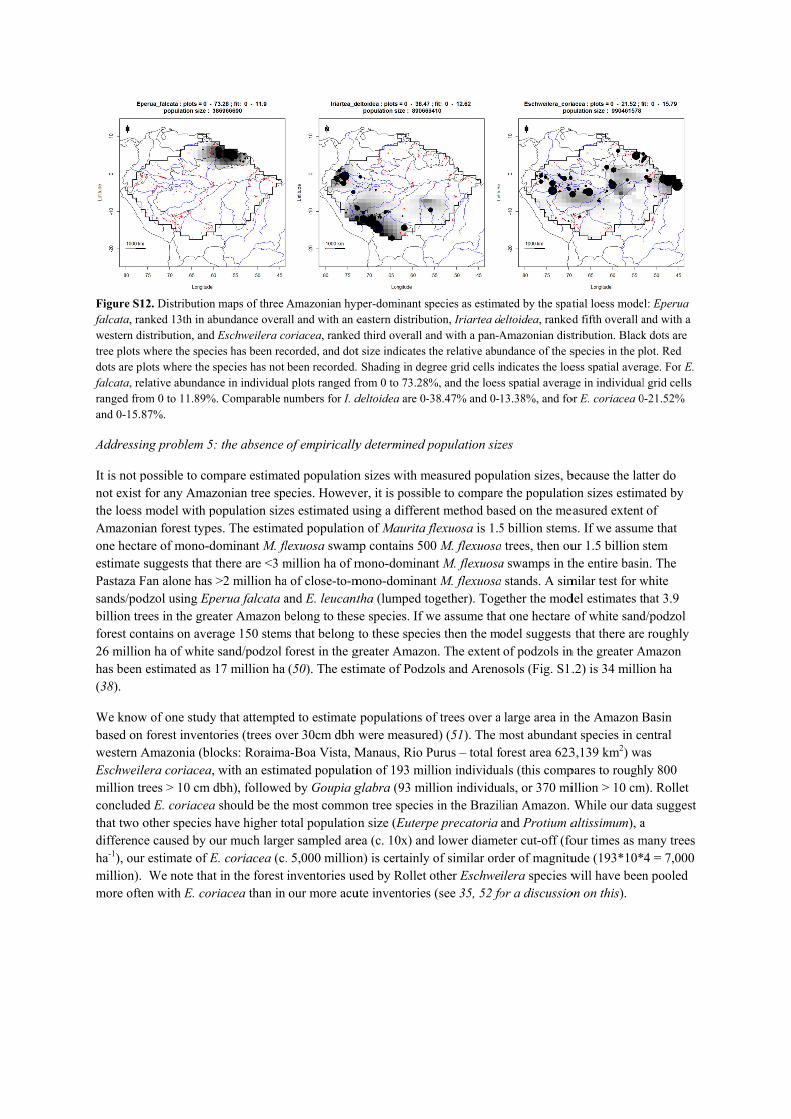
Figure S1falcata, rawestern ditree plots wdots are plfalcata, reranged froand 0-15.8
Addressin
It is not pnot exist the loess Amazonione hectaestimate Pastaza Fsands/podbillion treforest con26 milliohas been (38).
We knowbased on western AEschweilmillion trconcludethat two odifferencha-1), ourmillion). more ofte
12. Distributionanked 13th in abistribution, andwhere the speclots where the s
elative abundanom 0 to 11.89%87%.
ng problem 5:
possible to comfor any Amazmodel with p
ian forest typeare of mono-dsuggests that
Fan alone has dzol using Epees in the greantains on aver
on ha of white estimated as
w of one studyforest invento
Amazonia (blolera coriacea,rees > 10 cm ded E. coriaceaother species
ce caused by or estimate of E We note that
en with E. cor
n maps of three bundance overa
d Eschweilera coies has been recspecies has not
nce in individua%. Comparable n
: the absence
mpare estimatzonian tree sppopulation sizees. The estimadominant M. flthere are <3 m>2 million ha
perua falcata aater Amazon brage 150 stemsand/podzol f
17 million ha
y that attempteories (trees ovocks: Roraima with an estimdbh), followed
a should be thehave higher to
our much largeE. coriacea (c.t in the forest riacea than in
Amazonian hypall and with an eoriacea, rankedcorded, and dotbeen recorded.l plots ranged fnumbers for I. d
of empirically
ted populationecies. Howeves estimated uated populationflexuosa swammillion ha of ma of close-to-mand E. leucantbelong to thes
ms that belong forest in the g(50). The esti
ed to estimate ver 30cm dbh a-Boa Vista, M
mated populatid by Goupia ge most commootal populationer sampled are. 5,000 millioninventories usour more acu
per-dominant speastern distribud third overall at size indicates t Shading in deg
from 0 to 73.28deltoidea are 0-
y determined p
n sizes with mer, it is possib
using a differen of Maurita f
mp contains 50mono-dominamono-dominantha (lumped tose species. If wto these speci
greater Amazoimate of Podz
populations owere measure
Manaus, Rio Pion of 193 milglabra (93 milon tree specien size (Euterpea (c. 10x) andn) is certainlysed by Rollet
ute inventories
pecies as estimution, Iriartea dand with a pan-Athe relative abugree grid cells i%, and the loes-38.47% and 0-
population siz
measured popuble to compareent method basflexuosa is 1.5
00 M. flexuosant M. flexuosant M. flexuosaogether). Togwe assume thaies then the mon. The extent zols and Areno
of trees over aed) (51). The mPurus – total fllion individuallion individus in the Brazilpe precatoriad lower diame
y of similar ordother Eschwe
s (see 35, 52 fo
ated by the spatdeltoidea, rankedAmazonian distundance of the sndicates the loe
ss spatial averag13.38%, and fo
zes
lation sizes, be the populatiosed on the me5 billion stemsa trees, then oua swamps in tha stands. A simether the mod
at one hectare odel suggests of podzols in
osols (Fig. S1.
large area in most abundanforest area 623als (this compals, or 370 milian Amazon. and Protium aeter cut-off (foder of magnituilera species w
for a discussio
atial loess moded fifth overall atribution. Blackspecies in the pess spatial average in individualor E. coriacea 0
because the laton sizes estim
easured extent ms. If we assum
ur 1.5 billion he entire basin
milar test for wdel estimates th
of white sandthat there are
n the greater A.2) is 34 milli
the Amazon Bnt species in ce3,139 km2) wapares to roughillion > 10 cmWhile our daaltissimum), aour times as mude (193*10*will have been
on on this).
l: Eperua and with a k dots are lot. Red age. For E. l grid cells
0-21.52%
tter do mated by
of me that stem n. The
white hat 3.9
d/podzol e roughly Amazon
on ha
Basin entral as ly 800
m). Rollet ta suggest
a many trees 4 = 7,000 n pooled

Additional references
40. W. J. Junk et al., A classification of major naturally-occurring Amazonian lowland wetlands. Wetlands 31, 623 (2011).
41. S. E. Page, J. O. Rieley, C. J. Banks, Global and regional importance of the tropical peatland carbon pool. Global Change Biology 17, 798 (2011).
42. P. J. M. Maas, L. Y. T. Westra, H. Rainer, A. Q. Lobão, R. H. J. Erkens, An updated index to genera, species, and infraspecific taxa of Neotropical Annonaceae. Nordic Journal of Botany 29, 257 (2011).
43. J. A. Dijkshoorn, J. R. M. Huting, P. Tempel, “Update of the 1:5 million Soil and Terrain Database for Latin America and the Caribbean (SOTERLAC; version 2.0)” (ISRIC - World Soil Information, Wageningen, 2005).
44. R. A. Fisher, A. S. Corbet, C. B. Williams, The relation between the number of species and the number of individuals in a random sample of an animal population. Journal of Animal Ecology 12, 42 (1943).
45. K. G. Dexter, J. Chave, Phylogenetic signal for range size and extinction risk in Amazonian trees. PNAS, (In review).
46. H. ter Steege, P. P. Haripersaud, O. S. Bánki, F. Schieving, A model of botanical collectors' behavior in the field: Never the same species twice. American Journal of Botany 98, 31 (2011).
47. N. C. A. Pitman, Ph.D. dissertation, Duke University (2000). 48. S. J. Phillips, R. P. Anderson, R. E. Schapire, Maximum entropy modeling of species
geographic distributions. Ecological Modelling 190, 231 (2006). 49. S. J. Phillips, M. Dudik, Modeling of species distributions with Maxent: new extensions and a
comprehensive evaluation. Ecography 31, 161 (2008). 50. J. M. Adeney, Duke University (2009). 51. B. Rollet, Tree populations in natural tropical forests. A case study: Brazilian Amazonia. Bois
et Forêts des Tropiques 236, 43 (1993). 52. P. M. Fearnside, Wood density for estimating forest biomass in Brazilian Amazonia. Forest
Ecology and Management 90, 59 (1997).

Herbaria contributing tropical plant collection records for use in estimating species’ range extents.
Data were accessed through the Global Biodiversity Information Facility (http://www.gbif.org/) and SpeciesLink (http://splink.cria.org.br) in March 2009.
GBIF:
1. AIMS - Bioresources Library (OBIS Australia) (http://data.gbif.org/datasets/resource/396)
2. Andes to Amazon Biodiversity Program (http://data.gbif.org/datasets/resource/56)
3. Arizona State University (http://data.gbif.org/datasets/resource/1294)
4. Arizona State University Vascular Plant Herbarium (http://data.gbif.org/datasets/resource/676)
5. Australian National Herbarium (CANB) (http://data.gbif.org/datasets/resource/47)
6. Belo Horizonte, Herbario (http://data.gbif.org/datasets/resource/1318)
7. BioCentro-UNELLEZ (http://data.gbif.org/datasets/resource/1310)
8. Biologiezentrum Linz (http://data.gbif.org/datasets/resource/1104)
9. Bishop Museum Natural History Specimen Data (http://data.gbif.org/datasets/resource/54)
10. BoGART (http://data.gbif.org/datasets/resource/1087)
11. Botanische Staatssammlung Munchen (http://data.gbif.org/datasets/resource/1289)
12. Botanischer Garten und Botanisches Museum Berlin-Dahlem, Zentraleinrichtung der Freien Universitat Berlin
(http://data.gbif.org/datasets/resource/1309)
13. CABI Bioscience Genetic Resource Collection (http://data.gbif.org/datasets/resource/166)
14. California Academy of Sciences (http://data.gbif.org/datasets/resource/1352)
15. California State University, Chico (http://data.gbif.org/datasets/resource/737)
16. Canadian Museum of Nature Herbarium (http://data.gbif.org/datasets/resource/123)
17. Centre for Plant Biodiversity Research (http://data.gbif.org/datasets/resource/1340)
18. CGN-PGR (http://data.gbif.org/datasets/resource/1102)
19. CIBIO, Alicante:ABH-GBIF (http://data.gbif.org/datasets/resource/251)
20. CSIRO (http://data.gbif.org/datasets/resource/1283)
21. DAO Herbarium Type Specimens (http://data.gbif.org/datasets/resource/527)
22. Database Schema for UC Davis [Herbarium Labels] (http://data.gbif.org/datasets/resource/734)
23. Database Schema for UC Davis [TGRC] (http://data.gbif.org/datasets/resource/735)
24. Department of Botany and Microbiology, Ohio Wesleyan University, Delaware, Ohio
(http://data.gbif.org/datasets/resource/1274)
25. Desmidiaceae Engels (http://data.gbif.org/datasets/resource/1089)
26. EASIANET (http://data.gbif.org/datasets/resource/206)
27. EMBRAPA (http://data.gbif.org/datasets/resource/1262)
28. Embrapa Amazonia Oriental (http://data.gbif.org/datasets/resource/1288)
29. EMBRAPA Recursos Geneticos e Biotecnologia - CENARGEN (http://data.gbif.org/datasets/resource/1279)
30. EURISCO (http://data.gbif.org/datasets/resource/1396)
31. EURISCO, The European Genetic Resources Search Catalogue (http://data.gbif.org/datasets/resource/1905)
32. Fairchild Tropical Botanic Garden Virtual Herbarium Darwin Core format
(http://data.gbif.org/datasets/resource/202)
33. Field Museum of Natural History (http://data.gbif.org/datasets/resource/1190)
34. Flora of Japan Specimen Database (http://data.gbif.org/datasets/resource/586)
35. Florida Atlantic University (http://data.gbif.org/datasets/resource/1320)
36. Forschungsinstitut Senckenberg (http://data.gbif.org/datasets/resource/1130)

37. Friedrich-Schiller-Universitat Jena (http://data.gbif.org/datasets/resource/1247)
38. Fruit and seed collection database (http://data.gbif.org/datasets/resource/1093)
39. Fundacio CETEC (http://data.gbif.org/datasets/resource/1312)
40. Gent University (http://data.gbif.org/datasets/resource/1292)
41. Goteborg University (http://data.gbif.org/datasets/resource/1282)
42. Gothenburg Herbarium - Types (GBIF:IH:GB:Herbarium) (http://data.gbif.org/datasets/resource/1766)
43. Harvard University Herbaria (http://data.gbif.org/datasets/resource/1827)
44. HerbarImages (http://data.gbif.org/datasets/resource/1095)
45. Herbario (http://data.gbif.org/datasets/resource/566)
46. Herbario del Instituto de Ecolog¡a, A.C., M‚xico (IE-XAL) (http://data.gbif.org/datasets/resource/1597)
47. Herbario Nacional de Bolivia (http://data.gbif.org/datasets/resource/1313)
48. Herbario Universidad de M laga: MGC-Corm¢fitos (http://data.gbif.org/datasets/resource/259)
49. Herbarium (UNA) (http://data.gbif.org/datasets/resource/775)
50. Herbarium Barroso (http://data.gbif.org/datasets/resource/1281)
51. Herbarium Descoigns (http://data.gbif.org/datasets/resource/1299)
52. Herbarium Fromm-Trinta (http://data.gbif.org/datasets/resource/1354)
53. Herbarium hermogenes (http://data.gbif.org/datasets/resource/1297)
54. Herbarium Pederson (http://data.gbif.org/datasets/resource/1270)
55. Herbarium S.C.H. Barrett (http://data.gbif.org/datasets/resource/1334)
56. Herbarium Sigrid Liede (http://data.gbif.org/datasets/resource/1277)
57. Herbarium Specimens of Museum of Nature and Human Activities, Hyogo Pref., Japan
(http://data.gbif.org/datasets/resource/1798)
58. Herbarium Stace (http://data.gbif.org/datasets/resource/1302)
59. Herbarium Taylor (http://data.gbif.org/datasets/resource/1355)
60. Herbarium Universitat Ulm (http://data.gbif.org/datasets/resource/1224)
61. Herbarium Webster (http://data.gbif.org/datasets/resource/1346)
62. Herbier de la Guyane (http://data.gbif.org/datasets/resource/1436)
63. Ilha Solteira, Herbario (http://data.gbif.org/datasets/resource/1266)
64. Institut Botanic de Barcelona, BC (http://data.gbif.org/datasets/resource/299)
65. Institut de Recherche pour le Developpement (IRD) (http://data.gbif.org/datasets/resource/1265)
66. Institut fur Allgemeine Botanik (http://data.gbif.org/datasets/resource/1263)
67. Instituto de Botanica (http://data.gbif.org/datasets/resource/1252)
68. Instituto de Botanica Darwinion (http://data.gbif.org/datasets/resource/1295)
69. Instituto de Botanica del Nordeste (http://data.gbif.org/datasets/resource/1287)
70. Instituto de Pesquisas Cientificas e Tecnologicas do Estado do Amapa (http://data.gbif.org/datasets/resource/1246)
71. Instituto Nacional de Pesquisas da Amazonia (http://data.gbif.org/datasets/resource/1141)
72. Internation Botanical Collections (S) (http://data.gbif.org/datasets/resource/1983)
73. IPK Genebank (http://data.gbif.org/datasets/resource/1851)
74. Jardi Botanic de Valencia: VAL (http://data.gbif.org/datasets/resource/238)
75. Jardim Botanico do Rio de Janeiro (http://data.gbif.org/datasets/resource/1273)
76. Johannes Gutenberg-Universitat (http://data.gbif.org/datasets/resource/1301)
77. Lichen Herbarium Berlin (http://data.gbif.org/datasets/resource/1097)
78. Lichen herbarium, Oslo (O) (http://data.gbif.org/datasets/resource/1067)
79. LPT (http://data.gbif.org/datasets/resource/1306)
80. Ludwig-Maximilians-Universitat (http://data.gbif.org/datasets/resource/1291)
81. Lund Botanical Museum (LD) (http://data.gbif.org/datasets/resource/1028)
82. Manaus, Herbario da Universidade do Amazonas (http://data.gbif.org/datasets/resource/1249)
83. MEXU/Plantas Vasculares (http://data.gbif.org/datasets/resource/780)
84. Missouri Botanical Garden (http://data.gbif.org/datasets/resource/621)
85. Museo Ecuatoriano de Ciencias Naturales (http://data.gbif.org/datasets/resource/1268)
86. Museu Botanico Municipal (http://data.gbif.org/datasets/resource/1239)
87. Museu Paraense Emilio Goeldi (http://data.gbif.org/datasets/resource/1235)
88. Museum National d'Histoire Naturelle, Paris (http://data.gbif.org/datasets/resource/1146)
89. Nationaal Herbarium Nederland (http://data.gbif.org/datasets/resource/1211)
90. Nationaal Herbarium Nederland, Leiden University branch (http://data.gbif.org/datasets/resource/1275)
91. Nationaal Herbarium Nederland, Utrecht University branch (http://data.gbif.org/datasets/resource/1242)
92. National Botanic Garden Belgium - Albertian Rift Rubiaceae (ENBI wp13)
(http://data.gbif.org/datasets/resource/90)
93. National Botanic Garden Belgium - Myxomycetes (http://data.gbif.org/datasets/resource/88)
94. National Museum in Prague (http://data.gbif.org/datasets/resource/1324)
95. Naturhistorisches Museum Wien (http://data.gbif.org/datasets/resource/1157)
96. NSW herbarium collection (http://data.gbif.org/datasets/resource/968)
97. Old Dominion University (http://data.gbif.org/datasets/resource/1296)
98. Online Zoological Collections of Australian Museums (http://data.gbif.org/datasets/resource/623)
99. Orchid Herbarium Collection (http://data.gbif.org/datasets/resource/1495)
100. Paleobiology Database (http://data.gbif.org/datasets/resource/563)
101. Phanerogamie (http://data.gbif.org/datasets/resource/1506)
102. Planetary Biodiversity Inventory Eumycetozoan Databank (http://data.gbif.org/datasets/resource/1515)
103. Plants of Papua New Guinea (http://data.gbif.org/datasets/resource/969)
104. Pontificia Universidad Catolica del Ecuador (http://data.gbif.org/datasets/resource/1258)
105. Pontificia Universidad Catolica Madre y Maestra (http://data.gbif.org/datasets/resource/1341)
106. Real Jardin Botanico (Madrid), Vascular Plant Herbarium (MA) (http://data.gbif.org/datasets/resource/240)
107. Royal Botanic Gardens, Kew (http://data.gbif.org/datasets/resource/629)
108. Royal Ontario Museum (http://data.gbif.org/datasets/resource/1348)
109. Ruhr-Universitat Bochum (http://data.gbif.org/datasets/resource/1317)
110. SANT herbarium vascular plant collection (http://data.gbif.org/datasets/resource/222)
111. SERNEC - University of North Carolina at Chapel Hill - Plants (http://data.gbif.org/datasets/resource/895)
112. Smithsonian Institution (http://data.gbif.org/datasets/resource/1250)
113. Species of Eastern Brazil Vascular Plant Specimens (http://data.gbif.org/datasets/resource/729)
114. SysTax (http://data.gbif.org/datasets/resource/1875)
115. Systematic Botany and Mycology Laboratory, USDA/ARS (http://data.gbif.org/datasets/resource/1264)
116. The AAU Herbarium Database (http://data.gbif.org/datasets/resource/224)
117. The Deaver Herbarium, Northern Arizona University (http://data.gbif.org/datasets/resource/678)
118. The Myxomycetes Collections at the Botanische Staatssammlung Munchen - Collection of Hermann Neubert
(http://data.gbif.org/datasets/resource/1443)
119. The Natural History Museum (http://data.gbif.org/datasets/resource/1172)
120. The System-wide Information Network for Genetic Resources (SINGER)
(http://data.gbif.org/datasets/resource/1430)
121. The University of Hong Kong Herbarium (http://data.gbif.org/datasets/resource/724)
122. Type herbarium, Gottingen (GOET) (http://data.gbif.org/datasets/resource/1494)

123. UCD Botanical Conservatory (http://data.gbif.org/datasets/resource/739)
124. ULNM (http://data.gbif.org/datasets/resource/1300)
125. United States National Herbarium (http://data.gbif.org/datasets/resource/1248)
126. United States National Plant Germplasm System Collection (http://data.gbif.org/datasets/resource/1429)
127. Universidad de Buenos Aires (http://data.gbif.org/datasets/resource/1345)
128. Universidad de Costa Rica (http://data.gbif.org/datasets/resource/1184)
129. Universidad de M laga: MGC-Algae (http://data.gbif.org/datasets/resource/1864)
130. Universidad de Murcia, Dpto. Biolog¡a Vegetal (Bot nica), Murcia: MUB-HEPATICAE
(http://data.gbif.org/datasets/resource/1522)
131. Universidad de Oviedo. Departamento de Biolog¡a de Organismos y Sistemas: FCO
(http://data.gbif.org/datasets/resource/245)
132. Universidad Nacional Autonoma de Mexico (http://data.gbif.org/datasets/resource/1322)
133. Universidad Nacional de Colombia (http://data.gbif.org/datasets/resource/1290)
134. Universidad Nacional de Loja (http://data.gbif.org/datasets/resource/1284)
135. Universidad Polit‚cnica de Madrid, Dpto. Biolog¡a Vegetal, Banco de Germoplasma
(http://data.gbif.org/datasets/resource/1521)
136. Universidade de Brasilia (http://data.gbif.org/datasets/resource/1272)
137. Universidade de Sao Paulo (http://data.gbif.org/datasets/resource/1311)
138. Universidade Estadual de Campinas (http://data.gbif.org/datasets/resource/1255)
139. Universidade Federal de Juiz de Fora (http://data.gbif.org/datasets/resource/1260)
140. Universidade Federal de Mato Grosso (http://data.gbif.org/datasets/resource/1254)
141. Universidade Federal de Santa Catarina (http://data.gbif.org/datasets/resource/1335)
142. Universidade Federal do Maranhao (http://data.gbif.org/datasets/resource/1305)
143. Universidade Federal do Parana (http://data.gbif.org/datasets/resource/1337)
144. Universidade Federal do Rio Grande do Sul (http://data.gbif.org/datasets/resource/1280)
145. Universitat Wien (http://data.gbif.org/datasets/resource/1286)
146. Universitat Zurich (http://data.gbif.org/datasets/resource/1276)
147. University of Aarhus (http://data.gbif.org/datasets/resource/1349)
148. University of Alabama (http://data.gbif.org/datasets/resource/1316)
149. University of Calicut (http://data.gbif.org/datasets/resource/1343)
150. University of California (http://data.gbif.org/datasets/resource/1245)
151. University of California Botanical Garden DiGIR provider (http://data.gbif.org/datasets/resource/1412)
152. University of Michigan (http://data.gbif.org/datasets/resource/1285)
153. University of Texas at Austin (http://data.gbif.org/datasets/resource/1243)
154. University of Victoria (http://data.gbif.org/datasets/resource/1261)
155. University of Wisconsin Oshkosh (http://data.gbif.org/datasets/resource/1293)
156. USDA (http://data.gbif.org/datasets/resource/1342)
157. Vanderbilt University (http://data.gbif.org/datasets/resource/1241)
158. Vascular Plant Collection - University of Washington Herbarium (WTU)
(http://data.gbif.org/datasets/resource/126)
159. Vascular Plant Type Specimens (http://data.gbif.org/datasets/resource/731)
160. Wageningen University (http://data.gbif.org/datasets/resource/1267)
161. Westfalische Wilhelms-Universitat (http://data.gbif.org/datasets/resource/1271)

SpeciesLink:
1. Banco de DNA do Jardim Botânico do Rio de Janeiro Carpoteca UFP
2. Coleção de Fanerógamas do Herbário do Estado "Maria Eneyda P. Kaufmann Fidalgo"
3. Coleção de plantas medicinais e aromáticas
4. Herbário - IPA Dárdano de Andrade Lima
5. Herbário "Irina Delanova Gemtchújnicov"
6. Herbário Central da Universidade Federal do Espírito Santo VIES
7. Herbário da Escola Superior de Agricultura Luiz de Queiroz
8. Herbário da Universidade Estadual de Campinas
9. Herbário da Universidade Estadual de Londrina
10. Herbário da Universidade Estadual de Ponta Grossa
11. Herbário da Universidade Federal de Sergipe
12. Herbário Dárdano de Andrade Lima
13. Herbário de Ilha Solteira
14. Herbário de São José do Rio Preto
15. Herbário Dimitri Sucre Benjamin
16. Herbário do Departamento de Botânica, SPF-IB/USP
17. Herbário do Instituto Agronômico de Campinas
18. Herbário do Museu Botânico Municipal
19. Herbário Dom Bento Pickel
20. Herbário Dr. Roberto Miguel Klein
21. Herbário Graziela Barroso
22. Herbário Jaime Coelho de Moraes
23. Herbário Lauro Pires Xavier
24. Herbário Mogiense
25. Herbário Pe. Camille Torrand
26. Herbário Prisco Bezerra
27. Herbário Professor Vasconcelos Sobrinho
28. Herbário Rioclarense
29. Herbário Sérgio Tavares
30. Herbário UEM
31. Herbário UFP - Geraldo Mariz
32. Herbário UFRN
33. INPA - Coleção de Madeiras - Xiloteca
34. INPA-Carpoteca - Carpoteca
35. INPA-Herbario - Herbário
36. MBML-Herbario
37. SPFw - Xiloteca do Instituto de Biociências da Universidade de São Paulo
38. UPCB - Herbário do Departamento de Botânica
39. Xiloteca "Profa. Dra. Maria Aparecida Mourão Brasil"
40. Xiloteca Calvino Mainieri
41. Xiloteca do Jardim Botânico do Rio de Janeiro

Appendices
S1 species.data
Basic information for all 4970 valid species.
Accepted_family: Family according to Tropicos (30)
Accepted_genus: Genus according to Tropicos (30)
Accepted_species: Species according to Tropicos (30)
n.ind: Number of individuals in ATDN database for 1170 plots
n.plots: Nr of plots (of 1170) in which the species is present
maxabund: Nr of individuals per ha in the plot where the species has it highest abundance
est.ind: Population size based on 1 run with all 1170 plots
population.mean: Mean population size of 500 runs with 1000 plots (with replacement)
population.sd: SD of population size of 500 runs with 1000 plots (with replacement)
species.relmax: Fraction of individuals in the plot where the species has it highest dominance
IV.maxcls: Forest type in which species has highest IV-value (1 = igapó, 2 = podzol, 3 = swamp, 4 = terra firme, 5 = várzea)
IV.indcls: IV value
IV.pval: p value for IV value
S2/S3 Families/Genera
Family/Genus: name according to Tropicos (30)
N ind: Number of individuals in 1170 plots used
N species: Number of species in 1170 plots used
HyperDom: Number of hyper-dominant species in family/genus observed
HypDomExp: Number of hyper-dominant species in family/genus expected (based on 1000 randomizations)
ci.lo: lower 95% confidence limit for expected number of hyper-dominant species (based on 1000 randomizations)
ci.hi: higher 95% confidence limit for expected number of hyper-dominant species (based on 1000 randomizations)
hilo: significant deviation from expected number of hyper-dominants