hydrophobic interactions and dewetting between plates with ...hydrophobic interactions and dewetting...
TRANSCRIPT

Hydrophobic Interactions and Dewetting between Plates with Hydrophobic and HydrophilicDomains
Lan Hua, Ronen Zangi,† and B. J. Berne*Department of Chemistry, Columbia UniVersity, 3000 Broadway, New York, New York 10027
ReceiVed: October 7, 2008; ReVised Manuscript ReceiVed: January 27, 2009
We study by molecular dynamics simulations the wetting/dewetting transition and the dependence of the freeenergy on the distance between plates that contain both hydrophobic and hydrophilic particles. We show thatdewetting is very sensitive to the distribution of hydrophobic and hydrophilic domains. In particular, we findthat plates characterized by a large domain of hydrophobic sites induce a dewetting transition and an attractivesolvent-induced interaction. On the other hand, a homogeneous distribution of the hydrophobic and hydrophilicparticles on the plates prevents the dewetting transition and produces a repulsive solvent-induced interaction.We also present results for a system resembling a “Janus interface” in which one plate consists of hydrophobicparticles and the other consists of hydrophilic particles showing that the interplate gap remains wet untilsteric constraints at small separations eject the water molecules. Our results indicate that the Cassie equation,for the contact angle of a heterogeneous plate, can not be used to predict the critical distance of dewetting.These results indicate that hydrophobic interactions between nanoscale surfaces with strong large length-scale hydrophobicity can be highly cooperative and thus they argue against additivity of the hydrophobicinteractions between different surface domains in these cases. These findings are pertinent to certainprotein-protein interactions where additivity is commonly assumed.
I. Introduction
The hydrophobic interaction is one of the major drivingforces in various self-assembly processes such as proteinfolding, the formation of membranes and micelles, molecularrecognition and surfactant aggregation.1-5 The nature of thehydrophobic effect is length-scale dependent. While hydro-phobicity at small length scales is associated with smalldistortions of the hydrogen bond connectivity between thewater molecules, large-scale hydrophobicity is driven by asignificant disruption of the hydrogen bonds network ofinterfacial waters.6-14 The crossover from small to large-scalebehavior occurs when the radius of the hydrophobe is about1 nm. One of the signatures of large-scale hydrophobicity isthe existence of a dewetting (drying) transition; on bringingtwo large hydrophobic plates from far apart into contact, acritical distance exists below which the water confinedbetween the two plates is unstable in its liquid state andevaporates. The dewetting transition has been predictedtheoretically9,11,14-16 andobserved incomputer simulations.11,17-29
In a recent experiment using interfacial-force microscopy,30
a nanoscale bubble was directly observed between superhy-drophobic surfaces. Nevertheless, the drying transition issensitive to the magnitude of the solute-solvent interaction.This was demonstrated by showing that a small change ofthe attraction between the wall of a nonpolar carbon nanotubeand the water molecules can induce a wetting transition.22
In this case, the transition point is characterized by a two-state model; in one state the channel is filled with water,and in the other it is empty.21 As the solute-solvent attractiveinteraction increases, the dewetting transition becomes lesspronounced and eventually disappears.11,14,27,31 In some cases,
the kinetic pathway for dewetting in the cavitation transitionhas been studied using the powerful transition path samplingmethod19 and the string method.26 The hydrophobicity of asurface is related to the value of the contact angle of a waterdroplet on that surface. Based on Young’s equation, a surfacewith a contact angle larger than 90° is defined as hydrophobic.It is interesting to point out that, a hydroxylated silica surfacewith its partial atomic charges scaled by a factor of less than0.4 was found to be macroscopically hydrophobic.32 Inaddition, it has been argued that the mechanism for attractivemean forces between the plates is very different dependingon the nature of the solute-solvent interaction.33
Both morphology and structure of the interacting hydrophobicsurfaces are important to the existence and kinetics ofdewetting.32,34-36 In general, the surface of proteins is nonho-mogeneous with respect to hydrophobicity, roughness, andtopology. For example, simulations indicate that protein surfacescan be characterized by hydrophobic regions that are hetero-geneously “small” or “large” on the basis of the length-scaledependence of hydrophobic hydration..37 Thus, it is verychallenging to predict the existence of the drying transition anddetermine its role in protein folding from the properties of theprotein interface alone. In a recent study, we found that a simplehydrophobic scoring function, based on aligned hydrophobicsurface areas, is not sufficient to predict whether the assemblyof protein units will exhibit dewetting or not.24 Further improve-ment of the scoring function should, therefore, include contribu-tions from factors which were not taken into account, such assurface roughness and heterogeneity.
A macroscopic theory relates the critical distance of thedewetting transition to the value of the contact angle of a waterdroplet on the surface,11
* Corresponding author.† Present address: Department of Organic Chemistry I, University of the
Basque Country, Avenida de Tolosa 72, 20018 San Sebastian, Spain.
J. Phys. Chem. C 2009, 113, 5244–52535244
10.1021/jp8088758 CCC: $40.75 2009 American Chemical SocietyPublished on Web 03/09/2009
Dow
nloa
ded
by C
OL
UM
BIA
UN
IV o
n Ju
ly 1
3, 2
009
Publ
ishe
d on
Mar
ch 9
, 200
9 on
http
://pu
bs.a
cs.o
rg |
doi:
10.1
021/
jp80
8875
8

where γlV is the liquid/vapor surface tension for water, θc is thecontact angle of water on the hydrophobic plate, P is the pressureof the liquid (water), PV is the vapor pressure of water, and Rm
is the radius of the plates. For plates of nanoscale size, the termin the denominator (P - PV) is much smaller than 2γlV/Rm andcan be ignored, yielding,
Thus, a knowledge of the contact angle of a heterogeneoussurface is enough to predict the critical distance for dewetting.The contact angle θ on a heterogeneous solid surface can beapproximately predicted by the Cassie equation.38,39 For a two-component surface,
where, fi is the fractional area of the surface with a contact angleof θi. Simulations of droplets on heterogeneous patternedsurfaces indicate that the Cassie equation holds for domainsthat are sufficiently small relative to the droplet. On the otherhand, when the size of the heterogeneous domains is much largerthan that of the droplet, there is a breakdown of the Cassieequation.40-42 In the current work, we are interested in cases inwhich the size of the domains is small compared with the sizeof a typical macroscopic droplet. For example, under whatconditions is the Cassie equation obeyed and how does thedistribution of hydrophobic and hydrophilic domains (in termsof size and shape) determine the averaged contact angle θ fora given fi?
Recent studies on hydrophobic hydration and hydrophobicinteractions between hybrid polar/nonpolar nanoassemblies43-45
show that the pattern of nonpolar-site distribution is veryimportant for the dewetting transitions to occur.44 Hydrophilicborders surrounding a nanoscale hydrophobic patch reduceconsiderably the patch’s ability to repel water from the firsthydration layer. In fact, even a single hydrophilic site at thecenter of the surfaces prevents complete drying of the confinedregion.45 In addition, it was found that an increase in the pressureof the bulk water blurs the difference between interfacial waterdensity next to hydrophilic and hydrophobic surfaces.45 How-ever, none of these studies quantitatively addressed the cor-relation between the distribution of hydrophobic sites and thedewetting as well as the strength of hydrophobic interactions.The related problem of how water behaves next to singleheterogeneous surfaces has been addressed in a recent studyusing coarse grained modeling of the interace between waterand heterogeneous surfaces.36
It is also of great interest to investigate the extreme case whereone plate is highly hydrophobic and the other hydrophilic. Inan intriguing experiment Granick and co-workers investigatedjust such a system. They studied a Janus interface in which awater slab is trapped between a hydrophobic wall on one sideand a hydrophilic wall on the other46 and found that it preventsany macroscopic drying or cavitation of the liquid, which inany case would be strongly affected even by relatively weakvan der Waals forces.
Much work has been done on the nonadditivity of hydro-phobic interactions through calculations of PMF between simple
small hydrophobic solutes in dilute solution.47-60 It has beensuggested that long-range hydrophobic interactions caused bythe many-body character of the PMF61 is relevant for theenergetics within62-64 or between62 distinct “hot regions” ofinteracting protein surfaces. This is very important for theprediction and modulation of protein-protein interactions.Although the nonadditive effect was found to be insensitive tothe strength of the solute-solvent van der Waals interaction,50
it was shown to increase with the size of the hydrophobicsolutes.50,59 The neglect of the length-scale dependence ofhydrophobic solvation results in the failure to predict cooper-ativity for three-body hydrophobic association in current surfacearea based nonpolar models.65 Previous studies of nonadditivitywere performed for simple hydrophobic solutes like methane,where the sizes of the clusters that form are small. Since proteinssurfaces are heterogeneous with mixed “small” and “large”hydrophobic regions, it is of interest to study the nonadditiveeffect in the association of nanoscale hydrophobic assembliesin a heterogeneous context.
Our aim in this paper is to determine how the distribution ofthe constituent hydrophobic and hydrophilic particles determinesthe hydrophobic interaction between such amphiphilic surfaces.We perform systematic molecular dynamics simulations ofdifferent surfaces characterized by the same size and samenumber of hydrophobic and hydrophilic particles, which aredistributed in different patterns. Our results show that thebehavior of water confined between two identical amphiphilicplates greatly depends on the distribution of the hydrophobicand hydrophilic particles on the plates. This effect is manifestedby the existence or absence of a dewetting transition as well asby attractive or repulsive solvent induced interactions betweenthe plates. We propose a parameter, the average number ofhydrophobic nearest neighbors of a hydrophobic particle, todescribe the degree of clustering of the hydrophobic particleson the surface, and show that the behavior of confined water(dewetting or cavitation) is correlated with the value of thisparameter. We also observe that for drying to occur theminimum area for clustered hydrophobic particles on the surfaceis (1.04 × 1.04) nm2, and we call this the critical area for thedrying transition. These results demonstrate a strong cooperat-ivity in the hydrophobic interaction between surface hydrophobicdomains of varied length scale. In addition, our results showthat it is not possible to predict the critical distance for dewettingbetween heterogeneous surfaces by using the contact angleobtained by the Cassie equation (eq 3) in eq 1. We also carriedout simulations of water confined to a Janus interface (whereone plate is hydrophobic and the other is hydrophilic). In thesesimulations, we find that the gap between these plates remainswet if the partial charges on the hydrophilic plates are suf-ficiently large. However, for small partial charges a dryingtransition is observed. In this case, the critical distance fordewetting can be obtained from the average of the criticaldistance for the pure hydrophobic system (where the two platesare hydrophobic) and that for the pure hydrophilic system.
II. Methods
We studied the thermodynamics of the association processof two identical large amphiphilic plates composed of hydro-phobic and hydrophilic particles. Each surface is representedby a single-layered plate of 49 atoms arranged in a 7 × 7 squarelattice with a bond length of 0.32 nm. Each plate has 25hydrophobic atoms and 24 hydrophilic atoms. The Lennard-Jones (LJ) parameters for the interaction between plate atomson different plates are σplt ) 0.40 nm and εplt ) 0.50 kJ/mol,
Dc )-2γlV cos θc
(P - PV) + 2γlV/Rm(1)
Dc ≈ -Rm cos θc (2)
cos θ ) f1 cos θ1 + f2 cos θ2 (3)
Hydrophobic Interactions and Dewetting J. Phys. Chem. C, Vol. 113, No. 13, 2009 5245
Dow
nloa
ded
by C
OL
UM
BIA
UN
IV o
n Ju
ly 1
3, 2
009
Publ
ishe
d on
Mar
ch 9
, 200
9 on
http
://pu
bs.a
cs.o
rg |
doi:
10.1
021/
jp80
8875
8

values lying in the same range as in our previous work.29,66 Werepresent hydrophilic atoms in two ways. In the first approach,the hydrophilic particles are represented by the same LJparameters as for hydrophobic particles; however, they havenonzero partial charges. Since all the surfaces we generated areelectrically neutral, the numbers of positive and negativeparticles are the same. In one set of simulations, we studiedhydrophilic particles with partial charges of Q ) ( 0.4 e, andin another set with partial charges of Q ) ( 0.8 e. In the secondapproach, we represented hydrophilic particles with a large well-depth of the LJ potential (εplt
phil ) 1.30-2.0 kJ/mol), which isconsiderably larger than that for the hydrophobic particles (εplt
phob
) 0.5-1.0 kJ/mol). Nevertheless, the LJ diameter was taken tobe the same as that for the hydrophobic particles, σplt ) 0.40nm. We investigated five different patterns of hydrophobic/hydrophilic particle distributions on the plates (pattern I-V;see Figure 1a).
The two plates were solvated in 1147 water molecules. Wechose the SPC/E model67 of water and used combination rules(arithmetic average for σ and geometric average for ε) tocalculate the water-plate interactions. Analysis of the waterdensity profile next to the plates suggests that the strength ofthe attraction between the water molecules and these plates isvery similar to that of water and a hydrocarbon monolayerdescribed at atomic level.68 In addition, recent simulations69
investigating the contact angle of water on the most hydrophobicsurface studied here, εplt
phob ) 0.5 kJ/mol, find its value to be
119°. This value is similar to the values obtained for self-assembled octadecanethiol monolayer on silver70 (117°) and ongold71 (105°) surfaces.
During simulations, the positions of the plate atoms are heldfixed, interactions between atoms on the same plate areexcluded, and the orientation of the two plates with respect toeach other is parallel and in-registry. The alignment of thesurface patterns with respect to each other is such thathydrophobic particles on one plate are superimposed onhydrophobic particles on the other plate. For hydrophilicparticles, positive charged particles on one plate are superim-posed on negative charged particles on the other plate.
We used the molecular dynamics (MD) package GROMACSversion 3.1.472 to perform the computer simulations, with a timestep of 0.002 ps. The bond distances and angle of the watermolecules were constrained using the SETTLE algorithm.73 Thesystem was maintained at a constant temperature of 300 K andpressure of 1.0 bar using the Berendsen thermostat.74 Theelectrostatic forces were evaluated by the particle-mesh Ewaldmethod (with grid spacing of 0.12 nm and quadratic interpola-tion) and the LJ forces by a cutoff of 1.0 nm.
The potential of mean force (PMF) between the two plateswas computed from the mean force acting on each of theplates.75,76 Then the mean force acting between the plates alongtheir axis of separation was integrated as a function of thedistance between the plates, d, to yield the free energy profile.As the PMF represents only relative values, it was shifted such
Figure 1. (a) Hybrid hydrophobic/hydrophilic plates with five different patterns of particle distribution, pattern I-V. (b) Janus faced plates: plate1 and plate 2. The sphere in cyan represents hydrophobic particle, blue represent positive charged particle, red represent negative charged particle.
5246 J. Phys. Chem. C, Vol. 113, No. 13, 2009 Hua et al.
Dow
nloa
ded
by C
OL
UM
BIA
UN
IV o
n Ju
ly 1
3, 2
009
Publ
ishe
d on
Mar
ch 9
, 200
9 on
http
://pu
bs.a
cs.o
rg |
doi:
10.1
021/
jp80
8875
8

that the free energy of the state at the largest separationcorresponds to zero. For each pattern (I-V), we performed 46simulations with different values of plate separation, d, rangingfrom 0.36 to 2.0 nm. At each value of d, the system wasequilibrated for 2.0 ns, and data was collected for 4.0 ns. Atpoints where the force converged slowly (around the wetting/drying transition), the data collection stage was extended foran additional 5.0 ns. In the analysis of the hydration of the platesat each d for each pattern, the error in the quantities obtainedfrom the simulations was estimated using the block averagingmethod.77
III. Results
A. Dependence of Solvation on the Distribution of Hy-drophobic Particles. The behavior of water molecules betweentwo amphiphilic plates depends on the distance between theplates, the distribution of hydrophobic particles on the surface,and the nature and strength of the interaction between theparticles (hydrophilic and hydrophobic) and the water.31 First,we study plates in which the hydrophilic sites are chargedspheres with either |Q| ) 0.4 e or |Q| ) 0.8 e to represent weakand strong hydrophilic particles, respectively.
Figure 2a shows the density of water between two plates forthe five different distribution patterns (shown in Figure 1a) asa function of the interplate distance when the magnitude of thepartial charge of the hydrophilic particles is equal to 0.4 e.Dewetting transition was observed in the interplate region forall the patterns except for pattern V, which is characterized bya uniform distribution of hydrophobic and hydrophilic particles.An absence of a drying transition for a uniform distribution of
polar and nonpolar sites was reported by Koishi et al.44 In patternV, the sharp decrease of water density near d ) 0.72 nm is dueto steric effects; that is, at d ) 0.72 nm, a layer of water cannotfit between the two plates. Note that d is the distance betweenthe center of mass of the particles on each plate along the zaxis. Thus, the available space between the plates is, ap-proximately, d - σplt. Interestingly, pattern IV with chargedparticles arranged in the center of the plates can dewet when|Q| ) 0.4 e. Dewetting in this pattern might be due to surfacedipoles of small magnitude formed by charged particles in whichthe distance between neighboring positive and negative chargedparticles is small. This is in agreement with the finding that asilica surface, with partial charges scaled by 0.4, is macroscopi-cally hydrophobic.32 The critical distance, Dc, for dewetting foreach pattern is listed in Table 1.
In order to correlate the geometrical pattern of each platewith its critical distance, we propose a parameter, the averagenumber of hydrophobic nearest neighbors (Nnn), to characterizeeach pattern. We define Nnn as follows:
where Ni is the number of nearest hydrophobic neighbors ofhydrophobic particle i, which has the maximum value of 4, andM ) 25 is the number of hydrophobic particles. We assumethat the closer the hydrophobic cluster is to the center of theplate the larger will be the critical distance Dc for dewetting,but due to the small size of the plates in our system, Dc mightnot be sensitive to the distance between a hydrophobic particleand the center of the plate. Based on eq 4, we find a stronglinear correlation between Dc and Nnn with the correlationcoefficient r of 0.999 (see Figure 2b). Thus, as a measure ofthe degree of clustering for the assembly of hydrophobicparticles on the plate, Nnn is capable of discriminating betweenthe different patterns with respect to the solvation between twoplates.
When the magnitude of the charge of the hydrophilic particleis Q ) 0.8 e, a similar trend was found for the effect of thedistributions of hydrophobic particles on the solvation of theinterplate region as in the case for Q ) 0.4 e. However, adewetting transition is suppressed in most patterns. Waterdepletion was found in patterns I-III, and the extent of depletionis linearly proportional to Nnn for each pattern at the sameplate-plate separation. Patterns IV-V stay hydrated until wateris expelled because of steric effects. Note that water moleculesare trapped more tightly in pattern V than in pattern IV, leadingto a higher density of confined water than in the former, whichis also consistent with their relative values of Nnn (see Figure3). For all of the patterns, water density does not decrease tozero at d < 0.72 nm as in the case of Q ) 0.4 e; that is due tothe strong electrostatic attractive interaction between the waterand the charged particles which reduces the distance for stericexpulsion.
Figure 2. (a) Density of water in the interplate region for pattern I-Vas a function of interplate distance when Q ) 0.4 e for hydrophilicparticles. (b) The critical distance of dewetting transition as a functionof the average number of hydrophobic nearest neighbors for eachpattern. The red line is a linear fitting to the curve with correlationcoefficient r of 0.999.
TABLE 1: Critical Distance, Dc, of Dewetting Transition forEach Pattern and Its Corresponding Average Number ofHydrophobic Nearest Neighbor, Nnn (See eq 4)
pattern Nnn Dc
I 3.20 1.06 (1.04-1.08)II 2.88 1.02 (1.00-1.04)III 2.24 0.96 (0.92-1.00)IV 1.96 0.92 (0.88-0.96)V 0.00 0.68 (0.64-0.72)
Nnn ) 1M ∑
i)1
M
Ni, (4)
Hydrophobic Interactions and Dewetting J. Phys. Chem. C, Vol. 113, No. 13, 2009 5247
Dow
nloa
ded
by C
OL
UM
BIA
UN
IV o
n Ju
ly 1
3, 2
009
Publ
ishe
d on
Mar
ch 9
, 200
9 on
http
://pu
bs.a
cs.o
rg |
doi:
10.1
021/
jp80
8875
8

Although we did not observe dewetting transitions for mostpatterns when Q ) 0.8 e, we did observe stepwise cavitationsfor pattern II and pattern III. These patterns are characterizedby multiple hydrophobic domains of different size distributedon the plate surfaces. Pattern II, which has the second largestNnn, contains two hydrophobic domains arranged in 4 × 4 (1.36× 1.36 nm2) and 3 × 3 (1.04 × 1.04 nm2) square latticedomains. During the association of two plates, a big cavity isfirst formed between the larger hydrophobic domains (see Figure3b when d ) 0.84 nm). This is followed by the formation of a
second cavity between the smaller hydrophobic domains at asmaller plate-plate distance (see Figure 3b when d ) 0.68 nm).For d < 0.68 nm, the hydrophobic domains are dry, and thewater molecules between the hydrophilic domains are finallysqueezed out into the bulk. It is interesting to point out that wedid not find any stepwise cavitation for this pattern for weakhydrophilic particles (Q ) 0.4 e). Instead, a large cavity formswithout preference for the particles’ hydrophobicity, coveringhydrophobic and hydrophilic regions at the same time (seeFigure 3b when d ) 0.84 nm). The stepwise cavitation we
Figure 3. (a) Density of water in the interplate region for pattern I-V as a function of interplate distance when Q ) 0.8 e for hydrophilic particles.(b) The view of a slab of water between two plates for pattern II. The water molecules are superimposed for 150 frames and are classified bydifferent color based on their location. Water between opposite hydrophobic domains are represented in green; water between charged domains arein red and blue; water in the bulk are in silver. (c) the same as (b) except for pattern III. (d) the same as (b) except for the system of two plates,each of which is composed of 9 hydrophobic particles arranged in 3 × 3 square lattice with a bond length of 0.32 nm.
5248 J. Phys. Chem. C, Vol. 113, No. 13, 2009 Hua et al.
Dow
nloa
ded
by C
OL
UM
BIA
UN
IV o
n Ju
ly 1
3, 2
009
Publ
ishe
d on
Mar
ch 9
, 200
9 on
http
://pu
bs.a
cs.o
rg |
doi:
10.1
021/
jp80
8875
8
observe for pattern II is also observed for pattern III when Q )0.8 e. However, in this case, the cavities appear at smallerplate-plate distances, which almost can not contain more thanone layer of water, compared with that for pattern II (see Figure3c). Thus, strongly hydrophilic particles restrain cavities locallyto regions between hydrophobic domains and the cavities occurone after another based on the size of hydrophobic domainswhen bringing two plates from far apart into contact. Theseobserved stepwise cavitations might be related to the sizedependence of the amplitude of interfacial capillary-wavefluctuations as well as the probability of tube formation bridgingvapor-film interfaces involved in the dewetting dynamics inthe confined region.15 The smallest hydrophobic domain areacapable of inducing a cavity between the two plates is found tobe 1.04 × 1.04 nm2 (see Figure 3d), which is consistent withthe first cavitation in pattern III (Figure 3c when d ) 0.68 nm).Comparing the distances at which each cavity is formed duringthe association of the two plates for pattern II and pattern III,we find that stepwise cavitation for each pattern occurs atinterplate distances which are linearly correlated with Nnn. Thus,the larger the value of Nnn for the entire pattern, the larger willbe the gap distances of the stepwise cavitation.
In order to investigate the sensitivity of these results tothe nature of the particle’s hydrophilicity, we repeated thesesimulations, for the case where the hydrophilic particles wereuncharged (neutral LJ particles) but with a larger attractiveinteraction, εplt, than for hydrophobic particles. In order toprobe which values of εplt can be regarded as hydrophilicand which hydrophobic, we performed additional simulationswhere all of the particles were taken to be the same and foundthat the threshold value of εplt below which a drying transitionis observed is 1.0 kJ/mol. Thus, we define particles with εplt
< 1.0 kJ/mol as hydrophobic and particles with εplt > 1.0 kJ/mol as hydrophilic. Returning to the studies on heterogeneoussurfaces, we performed simulations with εplt
phil ) 2.0 kJ/molfor hydrophilic particles and εplt
phob ) 0.75 kJ/mol forhydrophobic particles. Figure 4 shows the results for the twoextreme cases of the distribution of hydrophobic/hydrophilicparticles. We find that when hydrophobic particles are placedat the center of the plates as in pattern I, a strong dewettingtransition is observed in the interplate region (red); whereasthe interplate region remains hydrated if the distribution isuniform as in pattern V (green). These results are qualitativelythe same as the case where the hydrophilic particles arerepresented as charged particles.
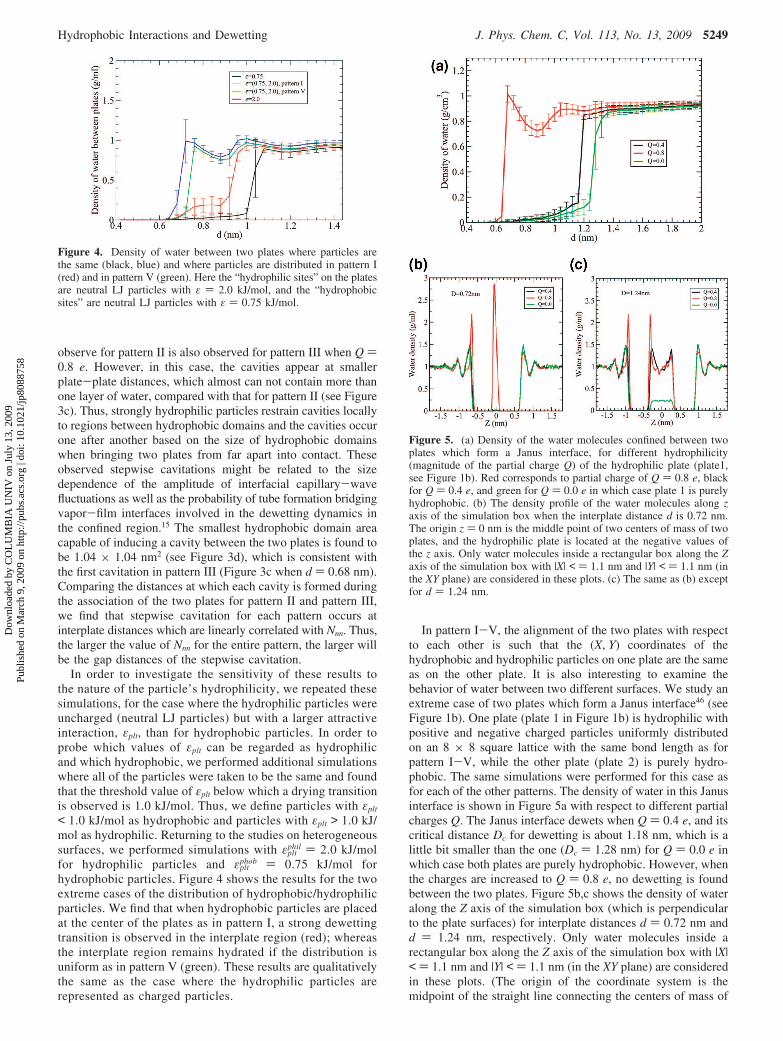
In pattern I-V, the alignment of the two plates with respectto each other is such that the (X, Y) coordinates of thehydrophobic and hydrophilic particles on one plate are the sameas on the other plate. It is also interesting to examine thebehavior of water between two different surfaces. We study anextreme case of two plates which form a Janus interface46 (seeFigure 1b). One plate (plate 1 in Figure 1b) is hydrophilic withpositive and negative charged particles uniformly distributedon an 8 × 8 square lattice with the same bond length as forpattern I-V, while the other plate (plate 2) is purely hydro-phobic. The same simulations were performed for this case asfor each of the other patterns. The density of water in this Janusinterface is shown in Figure 5a with respect to different partialcharges Q. The Janus interface dewets when Q ) 0.4 e, and itscritical distance Dc for dewetting is about 1.18 nm, which is alittle bit smaller than the one (Dc ) 1.28 nm) for Q ) 0.0 e inwhich case both plates are purely hydrophobic. However, whenthe charges are increased to Q ) 0.8 e, no dewetting is foundbetween the two plates. Figure 5b,c shows the density of wateralong the Z axis of the simulation box (which is perpendicularto the plate surfaces) for interplate distances d ) 0.72 nm andd ) 1.24 nm, respectively. Only water molecules inside arectangular box along the Z axis of the simulation box with |X|< ) 1.1 nm and |Y| < ) 1.1 nm (in the XY plane) are consideredin these plots. (The origin of the coordinate system is themidpoint of the straight line connecting the centers of mass of
Figure 4. Density of water between two plates where particles arethe same (black, blue) and where particles are distributed in pattern I(red) and in pattern V (green). Here the “hydrophilic sites” on the platesare neutral LJ particles with ε ) 2.0 kJ/mol, and the “hydrophobicsites” are neutral LJ particles with ε ) 0.75 kJ/mol.
Figure 5. (a) Density of the water molecules confined between twoplates which form a Janus interface, for different hydrophilicity(magnitude of the partial charge Q) of the hydrophilic plate (plate1,see Figure 1b). Red corresponds to partial charge of Q ) 0.8 e, blackfor Q ) 0.4 e, and green for Q ) 0.0 e in which case plate 1 is purelyhydrophobic. (b) The density profile of the water molecules along zaxis of the simulation box when the interplate distance d is 0.72 nm.The origin z ) 0 nm is the middle point of two centers of mass of twoplates, and the hydrophilic plate is located at the negative values ofthe z axis. Only water molecules inside a rectangular box along the Zaxis of the simulation box with |X| < ) 1.1 nm and |Y| < ) 1.1 nm (inthe XY plane) are considered in these plots. (c) The same as (b) exceptfor d ) 1.24 nm.
Hydrophobic Interactions and Dewetting J. Phys. Chem. C, Vol. 113, No. 13, 2009 5249
Dow
nloa
ded
by C
OL
UM
BIA
UN
IV o
n Ju
ly 1
3, 2
009
Publ
ishe
d on
Mar
ch 9
, 200
9 on
http
://pu
bs.a
cs.o
rg |
doi:
10.1
021/
jp80
8875
8

the two plates. The hydrophilic plate is placed at the negativevalues of the z axis.) These distributions indicate that in thepresence of one purely hydrophobic surface, the strong hydro-philic surface (Q ) 0.8 e) attracts water into the gap even whenit would be geometrically impossible for this gap to accom-modate one layer of water for Q ) 0.4 or 0.0 e (see the sharppeak in red around z ) 0 nm in Figure 5b). When Q ) 0.4 e,the density of water near the outside surface (toward solvent)of the weak hydrophilic plate is similar to that near hydrophobicsurface with Q ) 0.0 e (see the peaks in black and green withsimilar magnitude near z ) -0.7 nm for d ) 0.72 nm and thosenear z ) - 1.0 nm for d ) 1.24 nm). However, the density ofwater in the gap region increases for Q ) 0.4 e compared withQ ) 0.0 e for the plate-plate distance of 1.24 nm. These resultsare consistent with the observation of dewetting in pattern IVcorresponding to Q ) 0.4 e with hydrophilic particles distributedat the centers of the plates and hydrophobic particles on theirborders. It also indicates that the weak hydrophilic plate withQ ) 0.4 e is macroscopically hydrophobic. Thus, the behaviorof water in the Janus interface depends on the polarity of thehydrophilic surface, that is, the strength of the interactionsbetween hydrophilic particles and water.
On the basis of the simple macroscopic theory (see eq 1),the average of ∆γ (∆γ ) - γlV cos θc) should be used in thecalculation of Dc for the two different plates in the Janusinterface. To predict Dc for the Janus case with Q ) 0.4 e basedon this simple theory, we repeated simulations for two identical,purely hydrophilic plates with partial charge Q ) 0.4 e (sameas plate 1 in Figure 1(b)). A dewetting transition was observedbetween these two plates and the critical distance Dc fordewetting was found to be in the neighborhood of 1.10 nm.We then determined the critical distance for the Janus case withQ ) 0.4 e from the average of Dc for the pure hydrophilic plates(Dc ) 1.10 nm) with Q ) 0.4 e and for the pure hydrophobicplates (Dc ) 1.28 nm). The average is 1.19 nm, essentially equalto the value (Dc ) 1.18 nm) obtained from simulation of theJanus interface, indicating that the critical distance of dewettingin Janus interfaces can be predicted from the given Dc for purehydrophilic plates (same to plate1 in Figure 1b) and for purehydrophobic plates (same as plate 2 in Figure 1b).
B. Potentials of Mean Force. Figure 6a,b shows the waterinduced PMF of the amphiphilic plates for the different patterns(I-V), as a function of the plate-plate distance. For Q ) 0.4 e(see Figure 6a), the water induced force between two plates isattractive for pattern I-IV, while repulsive for pattern V, whichhas the smallest value of Nnn among all five patterns and is theonly one that does not display a dewetting transition. Thedifference in the water induced PMF for bringing the two platesfrom far apart to contact (d ) 0.40 nm) between the differentpatterns is very large; it is about 230 kJ/mol between pattern Iand pattern V. While patterns III and IV display free energybarriers for dewetting, patterns I and II do not. At smalldistances, the water induced PMF is less negative for pattern Ithan for pattern II, probably because the water molecules liketo stay in the gap because of their strong electrostatic interactionwith charged particles on the edges of plates in pattern Icompared with that in pattern II. When the partial charge ofthe hydrophilic particles is increased to Q ) 0.8 e, the waterinduced PMF is positive for almost all of the patterns exceptfor pattern I and pattern II in which the water induced force isattractive in a small range of interplate distance with a minimumat about d ) 0.64 nm (see Figure 6b). This corresponds to thecavitation or partial dewetting when two plates approach towardeach other. The water induced repulsive force in the gap region
for pattern V is very large in comparison with that for the caseof Q ) 0.4 e. This means that it is very hard to remove watermolecules from the interplate region with strong hydrophilicparticles.
The solvent induced free energy of interaction (or the solventinduced part of the PMF) between two plates in the Janus interfaceas a function of their separation is shown in Figure 6c for differentpartial charges on the hydrophilic plate. For both partial charges(Q ) 0.8 or 0.4 e), the water induced interactions between theplates are attractive even though the Janus interface with Q ) 0.8e does not exhibit dewetting while the interface with Q ) 0.4 edoes. Nevertheless, for Q ) 0.8 e the magnitude of the attractiveinteraction, as well as the shape of the curve which exhibits asolvent separated minimum and a barrier to remove this solvent
Figure 6. (a) Water induced PMF of two hybrid plates for patternI-V as a function of interplate distance when Q ) 0.4 e for hydrophilicparticles. (b) The same as (a) except that the charge of hydrophilicparticles is Q ) 0.8 e (c) The water induced PMF of two plates whichform Janus interfaces as a function of interplate distance with respectto different partial charge Q of the charged particles on plate1 (seeFigure 1b). Black is for partial charge Q ) 0.4 e, red is for Q ) 0.8 e,and green is for Q ) 0.0 e in which case plate1 is purely hydrophobicand identical to plate 2.
5250 J. Phys. Chem. C, Vol. 113, No. 13, 2009 Hua et al.
Dow
nloa
ded
by C
OL
UM
BIA
UN
IV o
n Ju
ly 1
3, 2
009
Publ
ishe
d on
Mar
ch 9
, 200
9 on
http
://pu
bs.a
cs.o
rg |
doi:
10.1
021/
jp80
8875
8

layer, corresponds to an absence of dewetting. The difference inthe solvent induced PMF for the Janus case and for the case withpurely hydrophobic plates (Q ) 0.0 e, which also shows dewetting)increases significantly as the partial charge on the hydrophilic plateincreases. This difference can be as large as 240 kJ/mol when Qis 0.8 e relative to that for Q ) 0.0 e.
IV. Discussion and Conclusions
Our previous studies of proteins24 indicated that, althoughlarge matched and connected hydrophobic areas are correlatedwith a dewetting transition between two domains or oligomers,they are not sufficient to predict it. In this work, we aimed todetermine a relationship between the magnitude of surfacehydrophobicity and the spatial distribution of hydrophobic andhydrophilic domains on the surface. We determined the potentialof mean force and through it the strength of the solvent inducedinteraction between two parallel identical amphiphilic plates,which should be regarded as an idealized model that might serveas a metaphor for protein interdomain or interoligomer interac-tions. The incorporation of hydrophilic particles in our modelsystem was performed to mimic the effect of charged and polarside chains on the properties of the interface. We representedhydrophilic particles in two ways. The first is as particles withnonzero partial charges ((Q), and the second is by LJ particleswith a large well-depth (ε), significantly larger than that for thehydrophobic particles. Since the number of hydrophobic andhydrophilic particles is constant (and the alignment of thedifferent type of particles on the two opposing surfaces is in-registry, see section II), the differences in the behavior of waterin the gap must arise from the different spatial distributions ofthe hydrophobic and hydrophilic particles on the plates (at thegiven strength of water-particle interactions).
We examined five different hydrophobic/hydrophilic par-ticle distributions on the amphiphilic plates. Our results showthat there are qualitative and quantitative differences in thebehavior of the water for these different distributions. Thisis manifested by the existence or absence of a dewettingtransition and by attractive or repulsive solvent inducedinteractions. Since the existence of a dewetting transition issensitive to the strength of the solute-solvent attractions,31
we also studied how weak and strong hydrophilic particlesaffect the solvation of the interplate region for different platepatterns. In the case of weak hydrophilic particles (Q ) 0.4e), most patterns exhibit a dewetting transition and theobserved critical distance for dewetting, Dc, varies fordifferent patterns. The simulation results show a linearcorrelation between Dc and a proposed order parameter thatdescribes the spatial arrangement of the particles on theplates. This order parameter, the average number of hydro-phobic nearest neighbors (Nnn), is a measure for the degreeof cooperativity for an assembly of hydrophobic particleson a surface. For example, for a pattern with a large clusterof hydrophobic particles at the center of the plates (patternI), Nnn and Dc are both larger than for any other pattern. Onthe other hand, for a pattern where the hydrophobic/hydrophilic particles are uniformly distributed (pattern V),Nnn and Dc are both found to be smaller than for any otherpattern. In this case, no dewetting transition occurs. Ourproposed parameter, Nnn, seems to be able to discriminatebetween the different patterns and correlates highly with thecritical distance for dewetting. For amphiphilic plates withstrongly hydrophilic particles (Q ) 0.8 e), the dewettingtransition is suppressed in most patterns. However, the extentof water depletion in each pattern at the same plate-plate
distance is linearly proportional to Nnn. Thus, Nnn is a goodestimation of overall surface hydrophobicity. In addition,stepwise cavitations are found in systems with large hydro-phobic domains in regions defined by the clustered hydro-phobic domains. We found that the minimum area of thehydrophobic domain necessary to induce an adjacent cavityis 1.04 × 1.04 nm2. Of course, the differences in the hydrationof the interplate region corresponding to different patternsmight lessen or disappear entirely if the hydrophilicity ismade stronger. We did not investigate how the dewettingtransition responds to misaligning the plates, but we expectit to be sensitive to their relative orientations. However wedid investigate the behavior of water between two platesforming a Janus interface46 consisting of one hydrophobicand one hydrophilic plate and found that the result dependson the polarity of the hydrophilic plate with the criticaldistance for dewetting being inversely correlated with thestrength of hydrophilicity of the plate. The drying transitiondisappears entirely when the charges on the hydrophilic plateare sufficiently large (Q ) 0.8 e). Our observation isconsistent with an intriguing experiment performed byGranick and co-workers who investigated the hydrophobicityof a Janus interface.46 They found that the hydrophobicsurface prevents macroscopic drying or cavitation of theliquid. This allowed them to focus on more intrinsic localproperties of interfacial water near extended hydrophobic andhydrophilic surfaces and to compare and contrast waterbehavior in the different regions. Shear deformations pro-duced by moving the hydrophobic surface resulted in verylarge noisy fluctuations consistent with the picture of dampedcapillary waves at the hydrophobic surface arising frompartial dewetting. Film-spanning fluctuations that might leadto macroscopic dewetting between hydrophobic surfaces weresuppressed by pinning of water at the hydrophilic wall. Oursimulations give evidence that the critical distance Dc ofdewetting for the Janus interface can be predicted on the basisof the simple macroscopic theory according to which it isthe average of Dc’s for two pure hydrophobic plates (sameas the hydrophobic plate in the Janus interface) and two purehydrophilic plates (same as the hydrophilic plate in the Janusinterface).
In addition, we also investigated the effect of the differentpatterns on the strength of the interplate interaction. This wasdone by calculating the PMF between the plates. In analogy tosolvent induced interactions between hydrophobic particles, wefound that, for a pattern with a large hydrophobic cluster, theinterplate water-induced interaction is attractive (qualitatively,similar to the solvent induced interactions between homogeneoushydrophobic particles). However, for a pattern where thehydrophobic/hydrophilic particles are uniformly distributed, thesolvent induced interaction is repulsive. This effect is substantial;the difference in the free energy change for the associationprocess between these two patterns can be as large as ∼230kJ/mol. Physically, this qualitative difference in the inducedpotential of mean force can be attributed to the fact that, forone pattern, it is easier, (negative induced PMF), on average,to strip off a water molecule from the plate interface than fromaround another water molecule in the bulk, while for anotherpattern it is harder (positive induced PMF). The solvent inducedinteraction between two plates which form a Janus interface isattractive (but less so for larger partial charges) even when thepartial charges on the hydrophilic plate are large enough tosuppress dewetting between plates. The free energy barrier fordewetting for the strong hydrophilic system (Q ) 0.8 e) reflects
Hydrophobic Interactions and Dewetting J. Phys. Chem. C, Vol. 113, No. 13, 2009 5251
Dow
nloa
ded
by C
OL
UM
BIA
UN
IV o
n Ju
ly 1
3, 2
009
Publ
ishe
d on
Mar
ch 9
, 200
9 on
http
://pu
bs.a
cs.o
rg |
doi:
10.1
021/
jp80
8875
8

the free energy cost of stripping out the layer of water boundto the strongly hydrophilic surface as the plates approach eachother. The PMFs of the Janus interface which display dewetting(Q ) 0.4 e) is qualitatively similar to other systems that exhibitdrying. However, for the Janus interface with Q ) 0.8 e, wherethe drying transition is absent, the curve of the PMF is differentin shape and displays a minimum and a barrier that areassociated with a solvent-separated layer.
It is known that, in order to describe stable native structureof known protein folds in a united (amino acid) residuedescription, pairwise additive interactions are insufficient.78,79
It has been shown80-83 that only by including information aboutthe many-body interactions can one predict protein collapse orfolding, similar to what is found in experiments. This cooper-ativity can arise from many groups in the protein. In this paper,we demonstrated the importance of cooperativity for hydro-phobic particles. Since nonadditivity is likely to arise in systemswith a strong solvent-induced effect, it is possible that the many-body effect found in proteins originates from the hydrophobicside-chain residues.
In summary, we used molecular dynamics to study thethermodynamics of water confined between two amphiphilicplates and found that different distributions of hydrophobicand hydrophilic particles on the plates give rise to qualita-tively different large-scale water structures and water inducedplate-plate forces. The results are sensitive to how stronglyhydrophobic and hydrophilic the particles are. Our qualitativeconclusions seem to be insensitive to whether the hydrophilicplates consist of particles which have coulomb interactionsthrough partial charges or consist of particles that have strongLJ attractions with the solvent. Since for all patterns involvedin the study of identical plates the number of hydrophobicand hydrophilic plate particles is the same, the results pointto the breakdown of the Cassie equation and demonstratethat the hydrophobic interactions are strongly cooperative.We also investigated plate-plate interactions and the inter-plate large-scale water structure in the Janus interfacebetween a hydrophobic plate and a hydrophilic plate andfound that when one of the plates is sufficiently hydrophilicit pins water molecules, eliminating the fluctuations that leadto drying.
Acknowledgment. This research was supported by theNational Science Foundation via Grant NSF-CHE-13401.
References and Notes
(1) Ball, P. Nature 2003, 423, 25–26.(2) Scheraga, H. J. Biomol. Struct. Dyn. 1998, 16, 447–460.(3) Fersht, A. R. Structure and Mechanism in Protein Science; W. H.
Freeman and Company: New York, 1999.(4) Hummer, G.; Garde, S.; Garcia, A. E.; Pratt, L. R. Chem. Phys.
2000, 258, 349–370.(5) Chandler, D. Nature 2005, 437, 640–647.(6) Stillinger, F. H. J. Solution Chem. 1973, 2, 141.(7) Wallqvist, A.; Berne, B. J. J. Phys. Chem. 1995, 99, 2893–2899.(8) Lee, C.; McCammon, J.; Rossky, P. J. Chem. Phys. 1984, 80, 4448–
4454.(9) Lum, K.; Chandler, D.; Weeks, J. D. J. Phys. Chem. B 1999, 103,
4570–4577.(10) Leung, K.; Luzar, A.; Bratko, D. Phys. ReV. Lett. 2003, 90,
65502(1-4).(11) Huang, X.; Margulis, C. J.; Berne, B. J. Proc. Natl. Acad. Sci. 2003,
100, 11953–11958.(12) Mountain, R. D.; Thirumalai, D. J. Am. Chem. Soc. 2003, 125,
1950–1957.(13) Huang, D.; Chandler, D. Proc. Natl. Acad. Sci. U.S.A. 2000, 97,
8324–8327.(14) Huang, D.; Chandler, D. J. Phys. Chem. B 2002, 106, 2047–2053.(15) Lum, K.; Chandler, D Int. J. Thermophysics 1998, 19, 845–855.
(16) Ashbaugh, H.; Pratt, L. ReV. Mod. Phys. 2006, 78, 159.(17) Lum, K.; Luzar, A. Phys. ReV. E 1997, 56 (6), R6283-R6286.(18) Wallqvist, A.; Berne, B. J. Phys. Chem. 1995, 99, 2893–2899.(19) Bolhuis, P. G.; Chandler, D. J. Chem. Phys. 2000, 113, 8154–8160.(20) TenWolde, P.; Chandler, D. Proc. Natl. Acad. Sci. U.S.A. 2002,
99, 6539–6543.(21) Maibaum, L.; Chandler, D. J. Phys. Chem. B 2003, 107, 1189–
1193.(22) Hummer, G.; Rasaiah, J. R.; Noworyta, J. P. Nature 2001, 414,
188–190.(23) Li, X.; Li, J.; Eleftheriou, M.; Zhou, R. J. Am. Chem. Soc. 2006,
128, 12439–47.(24) Hua, L.; Huang, X.; Liu, P.; Zhou, R.; Berne, B. J. Phys. Chem. B
2007, 111, 9069–9077.(25) Liu, P.; Huang, X.; Zhou, R.; Berne, B. Nature 2005, 437, 159–
162.(26) Miller, T.; Vanden-Eijnden, E.; Chandler, D. Proc. Natl Acad. Sci.
U.S.A. 2007, 104, 14559–14564.(27) Maibaum, L.; Chandler, D. J. Phys. Chem. B 2007, 111, 9025–
9030.(28) Willard, A.; Chandler, D. J. Phys. Chem. B 2008, 112, 6187–6192.(29) Zangi, R.; Hagen, M.; Berne, B. J. Am. Chem. Soc. 2007, 129,
4678–4686.(30) Singh, S.; Houston, J.; Swol, F. V.; Brinker, C. J. Nature 2006,
442, 526.(31) Zhou, R.; Huang, X.; Margulis, C.; Berne, B. Science 2004, 305,
1605–1609.(32) Giovambattista, N.; Debenedetti, P. G.; Rossky, P. J. Phys. Chem.
B 2007, 111, 9581–9587.(33) Choudhury, N.; Pettitt, B. M. JACS 2005, 127 (10), 3556–3567.(34) Luzar, A.; Leung, K. J. Chem. Phys. 2000, 113, 5836–5844.(35) Christenson, H.; Claesson, P. AdV. Colloid Interface Sci. 2001, 91,
391–436.(36) Willard, A.; Chandler, D. Faraday Discuss. 2009, 141, 209–220.(37) Cheng, Y.; Rossky, P. Nature 1998, 392, 696–699.(38) Cassie, A. Discuss Faraday Soc. 1948, 3, 11.(39) Cassie, A. Discuss Faraday Soc. 1952, 75, 5041.(40) Lundgren, M.; Allan, N.; Cosgrov, T. Langmuir 2007, 23, 1187–
1194.(41) Brandon, S.; Haimovich, N.; Yeger, E.; Marmur, A. J. Colloid
Interface Sci. 2003, 263, 237.(42) Padday, J. Wetting, Spreading and Adhesion; Academic Press: New
York, 1978.(43) Koshi, T.; Yasuoka, K.; Zeng, X.; Narumi, T.; Susukita, R.; Kawai,
A.; Furusawa, H.; Suenaga, A.; Okimoto, N.; Futatsugi, N.; Ebisuzaki, T.Phys. ReV. Lett. 2004, 93, 185701–1,4.
(44) Koshi, T.; Yasuoka, K.; Ebisuzaki, T.; Yoo, S.; Zeng, X. J. Chem.Phys. 2005, 123, 204707.
(45) Giovambattista, N.; Debenedetti, P.; Rossky, P. J. Phys. Chem. C2007, 111, 1323–1332.
(46) Zhang, X.; Zhu, Y.; Granick, S. Science 2002, 295, 663–666.(47) Rank, J.; Baker, D. Protein Sci. 1997, 6, 347–354.(48) Czaplewski, C.; Rozdiewicz-Motowidlo, S.; Liwo, A.; Ripoll, D.;
Wawak, R.; Scheraga, H. Protein Sci. 2000, 9, 1235–1245.(49) Czaplewski, C.; Rozdiewicz-Motowidlo, S.; Liwo, A.; Ripoll, D.;
Wawak, R.; Scheraga, H. J. Chem. Phys. 2002, 116, 2665–2667.(50) Czaplewski, C.; Ripoll, D.; Liwo, A.; Rozdiewicz-Motowidlo, S.;
Wawak, R.; Scheraga, H. Int. J. Quantum Chem. 2002, 88, 41–55.(51) Czaplewski, C.; Rozdiewicz-Motowidlo, S.; Dabal, M.; Liwo, A.;
Ripoll, D.; Scheraga, H. Biophys. Chem. 2003, 105, 339–359.(52) Shimizu, S.; Chan, H. J. Chem. Phys. 2001, 115, 1414–1421.(53) Shimizu, S.; Chan, H. Proteins 2002, 49, 560–566.(54) Moghaddam, M.; Shimizu, S.; Chan, H. J. Am. Chem. Soc. 2005,
127, 303–316.(55) Bruge, F.; Fornili, S.; Malenkov, G.; Palma-Vittorelli, M.; Palma,
M. Chem. Phys. Lett. 1996, 254, 283–291.(56) San Biagio, P.; Bulone, D.; Martorana, V.; Palma-Vittorelli, M.;
Palma, M. Eur. Biophys. J. 1998, 27, 183–196.(57) Tsai, J.; Gerstein, M.; Levitt, M. Protein Sci. 1997, 6, 2606–2616.(58) Raschke, T.; Tsai, J.; Levitt, M. Proc. Natl. Acad. Sci. U.S.A. 2001,
989, 5965–5969.(59) Ghosh, T.; Garcia, A.; Garde, S. J. Phys. Chem. B 2003, 107, 612–
617.(60) Hummer, G. J. Am. Chem. Soc. 1999, 121, 6299.(61) Martorana, V.; Bulone, D.; San Biagio, P.; Palma-Vittorelli, M.;
Palma, M. Biophy. J. 1997, 73, 31–37.(62) Moza, B.; Buonpane, R.; Zhu, P.; Herfst, C.; Nur-ur Rahman, A.;
McCormick, J.; Kranz, D.; Sundberg, E. Proc. Natl. Acad. Sci. U.S.A. 2006,103, 9867.
(63) Keskin, O.; Ma, B.; Nussinov, R. J. Mol. Biol. 2005, 345, 1281–1294.
(64) Reichmann, D.; Rahat, O.; Albeck, S.; Meged, R.; Dym, O.;Schreiber, G. Proc. Natl. Acad. Sci. U.S.A. 2005, 102, 57–62.
5252 J. Phys. Chem. C, Vol. 113, No. 13, 2009 Hua et al.
Dow
nloa
ded
by C
OL
UM
BIA
UN
IV o
n Ju
ly 1
3, 2
009
Publ
ishe
d on
Mar
ch 9
, 200
9 on
http
://pu
bs.a
cs.o
rg |
doi:
10.1
021/
jp80
8875
8

(65) Chen, J.; Brooks, C. I. Phys. Chem. Chem. Phys. 2008, 10, 471–481.
(66) Zangi, R.; Berne, B. J. J. Phys. Chem. B 2006, 110, 22736–22741.(67) Berendsen, H. J. C.; Grigera, J. R.; Straatsma, T. P. J. Phys. Chem.
1987, 91, 6269–6271.(68) Li, X.; Li, J.; Eleftheriou, M.; Zhou, R. J. Am. Chem. Soc. 2006,
128 (38), 12439–12447.(69) Zangi, R.; Berne, B. J. J. Phys. Chem. B 2008, 112, 8634–8644.(70) Zhu, Y.; Granick, S. Phys. ReV. Lett. 2002, 88, 106102.(71) Plant, A. L.; Brighamburke, M.; Petrella, E. C.; Oshannessy, D. J.
Anal. Biochem. 1995, 226, 342–348.(72) Lindahl, E.; Hess, B.; van der Spoel, D. J. Mol. Mod. 2001, 7,
306–317.(73) Miyamoto, S.; Kollman, P. A. J. Comput. Chem. 1992, 13, 952–
962.(74) Berendsen, H. J. C.; Postma, J. P. M.; van Gunsteren, W. F.; Haak,
J. J. Chem. Phys. 1984, 81, 3684.
(75) Pangali, C. S.; Rao, M.; Berne, B. J. In Computer Modeling ofMatter; Lykos, P., Ed.; ACS Symp. Ser. No. 86; ACS: Washington DC,1978; p 29.
(76) Watanabe, K.; Andersen, H. C. J. Phys. Chem. 1986, 90, 795–802.
(77) Flyvbjerg, H.; Petersen, H. G. J. Chem. Phys. 1989, 91, 461–466.(78) Vendruscolo, M.; Najmanovich, R.; Domany, E. Proteins: Struct.,
Funct., Genet. 2000, 38, 134–148.(79) Tobi, D.; Elber, R. Proteins: Struct., Funct., Genet. 2000, 41, 40–
46.(80) Chan, H. Proteins: Struct., Funct., Genet. 2000, 40, 543.(81) Sorenson, J.; Head-Gordon, T. Folding Des. 1998, 3, 523.(82) Plotkin, S.; Wang, J.; Wolynes, P. J. Chem. Phys. 1997, 106, 2932.(83) Dill, K. J. Biol. Chem. 1997, 272, 701.
JP8088758
Hydrophobic Interactions and Dewetting J. Phys. Chem. C, Vol. 113, No. 13, 2009 5253
Dow
nloa
ded
by C
OL
UM
BIA
UN
IV o
n Ju
ly 1
3, 2
009
Publ
ishe
d on
Mar
ch 9
, 200
9 on
http
://pu
bs.a
cs.o
rg |
doi:
10.1
021/
jp80
8875
8