hydrology of mountainous areas in the upper indus basin ... indus...hydrology of mountainous areas...
TRANSCRIPT
Hydrology of mountainous areas in the upper Indus Basin,Northern Pakistan with the perspective of climate change
Zulfiqar Ahmad & Mohsin Hafeez &
Iftikhar Ahmad
Received: 10 October 2010 /Accepted: 29 August 2011 /Published online: 23 November 2011# Springer Science+Business Media B.V. 2011
Abstract Mountainous areas in the northern Pakistanare blessed by numerous rivers that have greatpotential in water resources and hydropowerproduction. Many of these rivers are unexploitedfor their water resource potential. If the potentialof these rivers are explored, hydropower produc-tion and water supplies in these areas may beimproved. The Indus is the main river originatingfrom mountainous area of the Himalayas ofBaltistan, Pakistan in which most of the smallerstreams drain. In this paper, the hydrology of themountainous areas in northern Pakistan is studiedto estimate flow pattern, long-term trend in riverflows, characteristics of the watersheds, and vari-ability in flow and water resource due to impact of
climate change. Eight watersheds including Gilgit,Hunza, Shigar, Shyok, Astore, Jhelum, Swat, andChitral, Pakistan have been studied from 1960 to2005 to monitor hydrological changes in relationto variability in precipitation, temperature andmean monthly flows, trend of snow melt runoff,analysis of daily hydrographs, water yield and runoffrelationship, and flow duration curves. Precipitationfrom ten meteorological stations in mountainous areaof northern Pakistan showed variability in the winterand summer rains and did not indicate a uniformdistribution of rains. Review of mean monthlytemperature of ten stations suggested that the UpperIndus Basin can be categorized into three hydrolog-ical regimes, i.e., high-altitude catchments with largeglacierized parts, middle-altitude catchments south ofKarakoram, and foothill catchments. Analysis ofdaily runoff data (1960–2005) of eight watershedsindicated nearly a uniform pattern with much of therunoff in summer (June–August). Impact of climatechange on long-term recorded annual runoff of eightwatersheds showed fair water flows at the Hunza andJhelum Rivers while rest of the rivers indicatedincreased trends in runoff volumes. The study of thewater yield availability indicated a minimum trend inShyok River at Yogo and a maximum trend in SwatRiver at Kalam. Long-term recorded data used toestimate flow duration curves have shown a uniformtrend and are important for hydropower generation forPakistan which is seriously facing power crisis in last5 years.
Environ Monit Assess (2012) 184:5255–5274DOI 10.1007/s10661-011-2337-7
Z. Ahmad (*)Department of Earth Sciences,Quaid-i-Azam University Islamabad,Islamabad 45320, Pakistane-mail: [email protected]
M. HafeezInternational Centre of water for food security (IC Water),Charles Sturt University,Wagga Wagga, NSW, Australiae-mail: [email protected]
I. AhmadCollege of Earth and Environmental Sciences,Punjab University,Lahore, Pakistane-mail: [email protected]

Keywords Eight watersheds . Climate change .
Himalayan Regions . Hunza . Shyok . Astore . Recentfloods . The Indus River
Introduction
Northern Pakistan is comprised of mountainous areas,which are covered by snow, glacial lakes, and glaciers.Numerous streams originate from these mountains andcarry appreciable glaciers melt water that is ultimatelyused for the sustainable development of the country. Themain river in which most of the smaller streams drain isthe longest Indus River originating from mountainousareas of Himalayas of Baltistan, Pakistan. The IndusRiver provides a major source of water for agricultureand hydropower in Pakistan. Hydrology ofmountainousareas in Northern Pakistan is studied to estimate flowpattern, long-term trend in river flows, and othercharacteristics of the watersheds.
Location of study area
The Indus River originates from the Karakoram,Hindukush, and Himalayan regions in north and flowstoward south with an annual average volume of 178billion m3 which is to be discharged into the IndusPlains while remaining flow drains into the ArabianSea. A major part of the runoff for the sustainabledevelopment of food production in Pakistan is contrib-uted from northern area. Location of study area isshown in Fig. 1.
Research Objectives
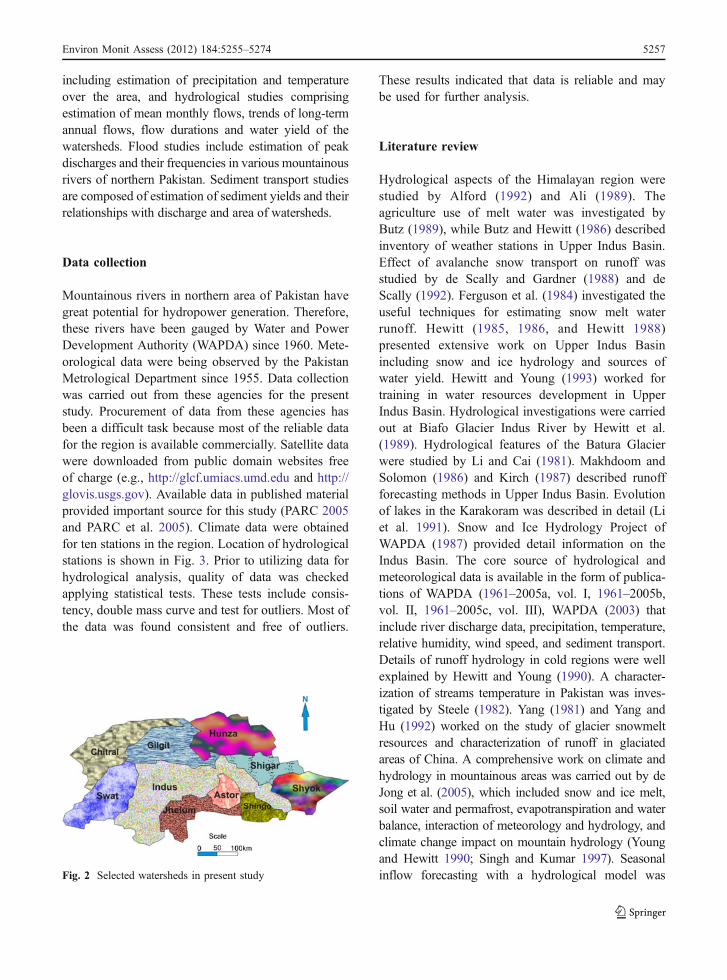
The main objective of the study includes investigationof hydrology of the mountainous areas of northernPakistan over the period of 1960–2005. The watershedshave been identified to investigate the characteristics ofthese mountains (Fig. 2), hydrometeorological studies
Fig. 1 Location map of study area
5256 Environ Monit Assess (2012) 184:5255–5274
including estimation of precipitation and temperatureover the area, and hydrological studies comprisingestimation of mean monthly flows, trends of long-termannual flows, flow durations and water yield of thewatersheds. Flood studies include estimation of peakdischarges and their frequencies in various mountainousrivers of northern Pakistan. Sediment transport studiesare composed of estimation of sediment yields and theirrelationships with discharge and area of watersheds.
Data collection
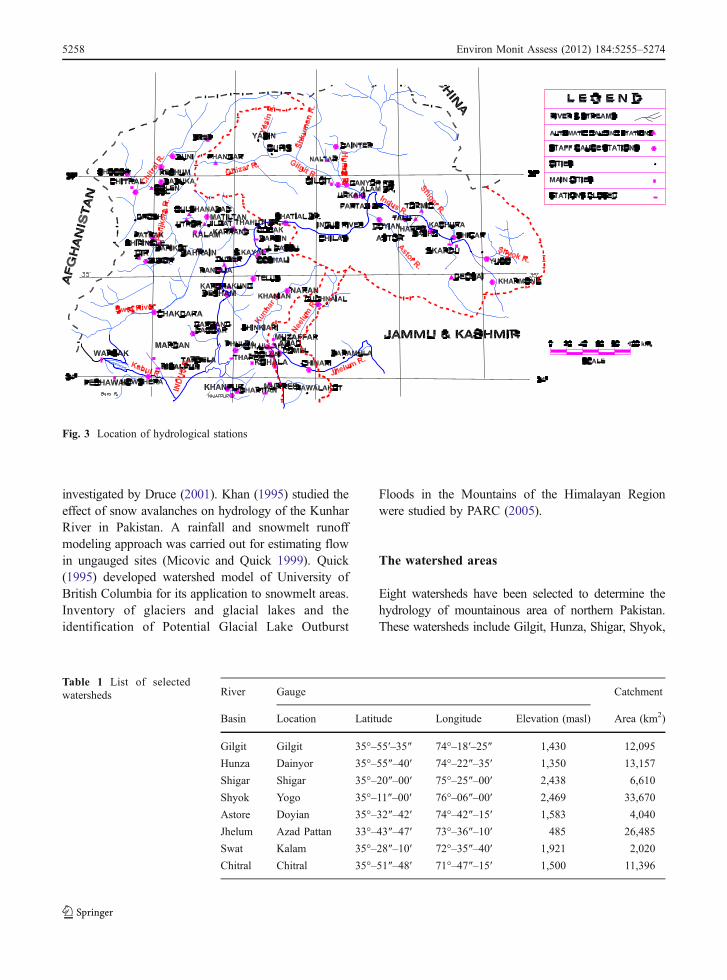
Mountainous rivers in northern area of Pakistan havegreat potential for hydropower generation. Therefore,these rivers have been gauged by Water and PowerDevelopment Authority (WAPDA) since 1960. Mete-orological data were being observed by the PakistanMetrological Department since 1955. Data collectionwas carried out from these agencies for the presentstudy. Procurement of data from these agencies hasbeen a difficult task because most of the reliable datafor the region is available commercially. Satellite datawere downloaded from public domain websites freeof charge (e.g., http://glcf.umiacs.umd.edu and http://glovis.usgs.gov). Available data in published materialprovided important source for this study (PARC 2005and PARC et al. 2005). Climate data were obtainedfor ten stations in the region. Location of hydrologicalstations is shown in Fig. 3. Prior to utilizing data forhydrological analysis, quality of data was checkedapplying statistical tests. These tests include consis-tency, double mass curve and test for outliers. Most ofthe data was found consistent and free of outliers.
These results indicated that data is reliable and maybe used for further analysis.
Literature review
Hydrological aspects of the Himalayan region werestudied by Alford (1992) and Ali (1989). Theagriculture use of melt water was investigated byButz (1989), while Butz and Hewitt (1986) describedinventory of weather stations in Upper Indus Basin.Effect of avalanche snow transport on runoff wasstudied by de Scally and Gardner (1988) and deScally (1992). Ferguson et al. (1984) investigated theuseful techniques for estimating snow melt waterrunoff. Hewitt (1985, 1986, and Hewitt 1988)presented extensive work on Upper Indus Basinincluding snow and ice hydrology and sources ofwater yield. Hewitt and Young (1993) worked fortraining in water resources development in UpperIndus Basin. Hydrological investigations were carriedout at Biafo Glacier Indus River by Hewitt et al.(1989). Hydrological features of the Batura Glacierwere studied by Li and Cai (1981). Makhdoom andSolomon (1986) and Kirch (1987) described runoffforecasting methods in Upper Indus Basin. Evolutionof lakes in the Karakoram was described in detail (Liet al. 1991). Snow and Ice Hydrology Project ofWAPDA (1987) provided detail information on theIndus Basin. The core source of hydrological andmeteorological data is available in the form of publica-tions of WAPDA (1961–2005a, vol. I, 1961–2005b,vol. II, 1961–2005c, vol. III), WAPDA (2003) thatinclude river discharge data, precipitation, temperature,relative humidity, wind speed, and sediment transport.Details of runoff hydrology in cold regions were wellexplained by Hewitt and Young (1990). A character-ization of streams temperature in Pakistan was inves-tigated by Steele (1982). Yang (1981) and Yang andHu (1992) worked on the study of glacier snowmeltresources and characterization of runoff in glaciatedareas of China. A comprehensive work on climate andhydrology in mountainous areas was carried out by deJong et al. (2005), which included snow and ice melt,soil water and permafrost, evapotranspiration and waterbalance, interaction of meteorology and hydrology, andclimate change impact on mountain hydrology (Youngand Hewitt 1990; Singh and Kumar 1997). Seasonalinflow forecasting with a hydrological model wasFig. 2 Selected watersheds in present study
Environ Monit Assess (2012) 184:5255–5274 5257
investigated by Druce (2001). Khan (1995) studied theeffect of snow avalanches on hydrology of the KunharRiver in Pakistan. A rainfall and snowmelt runoffmodeling approach was carried out for estimating flowin ungauged sites (Micovic and Quick 1999). Quick(1995) developed watershed model of University ofBritish Columbia for its application to snowmelt areas.Inventory of glaciers and glacial lakes and theidentification of Potential Glacial Lake Outburst
Floods in the Mountains of the Himalayan Regionwere studied by PARC (2005).
The watershed areas
Eight watersheds have been selected to determine thehydrology of mountainous area of northern Pakistan.These watersheds include Gilgit, Hunza, Shigar, Shyok,
Fig. 3 Location of hydrological stations
River Gauge Catchment
Basin Location Latitude Longitude Elevation (masl) Area (km2)
Gilgit Gilgit 35°–55′–35″ 74°–18′–25″ 1,430 12,095
Hunza Dainyor 35°–55″–40′ 74°–22″–35′ 1,350 13,157
Shigar Shigar 35°–20″–00′ 75°–25″–00′ 2,438 6,610
Shyok Yogo 35°–11″–00′ 76°–06″–00′ 2,469 33,670
Astore Doyian 35°–32″–42′ 74°–42″–15′ 1,583 4,040
Jhelum Azad Pattan 33°–43″–47′ 73°–36″–10′ 485 26,485
Swat Kalam 35°–28″–10′ 72°–35″–40′ 1,921 2,020
Chitral Chitral 35°–51″–48′ 71°–47″–15′ 1,500 11,396
Table 1 List of selectedwatersheds
5258 Environ Monit Assess (2012) 184:5255–5274
Astore, Jhelum, Swat, and Chitral as shown in Fig. 2.Some physical features of these watersheds weregathered from the available topographic data andpresented in Table 1.
Precipitation
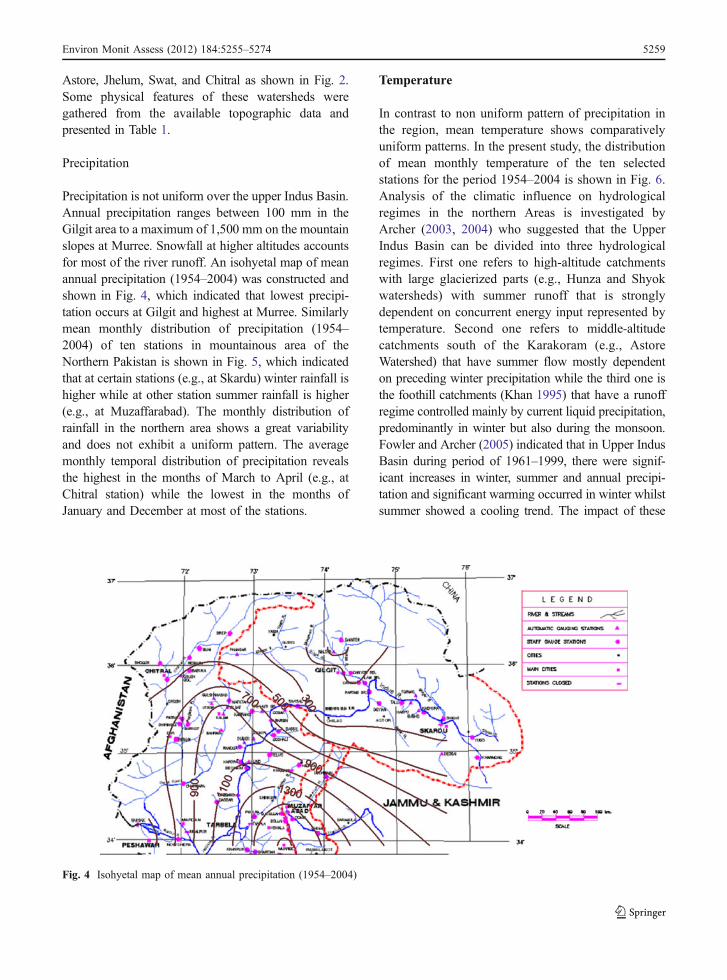
Precipitation is not uniform over the upper Indus Basin.Annual precipitation ranges between 100 mm in theGilgit area to a maximum of 1,500 mm on the mountainslopes at Murree. Snowfall at higher altitudes accountsfor most of the river runoff. An isohyetal map of meanannual precipitation (1954–2004) was constructed andshown in Fig. 4, which indicated that lowest precipi-tation occurs at Gilgit and highest at Murree. Similarlymean monthly distribution of precipitation (1954–2004) of ten stations in mountainous area of theNorthern Pakistan is shown in Fig. 5, which indicatedthat at certain stations (e.g., at Skardu) winter rainfall ishigher while at other station summer rainfall is higher(e.g., at Muzaffarabad). The monthly distribution ofrainfall in the northern area shows a great variabilityand does not exhibit a uniform pattern. The averagemonthly temporal distribution of precipitation revealsthe highest in the months of March to April (e.g., atChitral station) while the lowest in the months ofJanuary and December at most of the stations.
Temperature
In contrast to non uniform pattern of precipitation inthe region, mean temperature shows comparativelyuniform patterns. In the present study, the distributionof mean monthly temperature of the ten selectedstations for the period 1954–2004 is shown in Fig. 6.Analysis of the climatic influence on hydrologicalregimes in the northern Areas is investigated byArcher (2003, 2004) who suggested that the UpperIndus Basin can be divided into three hydrologicalregimes. First one refers to high-altitude catchmentswith large glacierized parts (e.g., Hunza and Shyokwatersheds) with summer runoff that is stronglydependent on concurrent energy input represented bytemperature. Second one refers to middle-altitudecatchments south of the Karakoram (e.g., AstoreWatershed) that have summer flow mostly dependenton preceding winter precipitation while the third one isthe foothill catchments (Khan 1995) that have a runoffregime controlled mainly by current liquid precipitation,predominantly in winter but also during the monsoon.Fowler and Archer (2005) indicated that in Upper IndusBasin during period of 1961–1999, there were signif-icant increases in winter, summer and annual precipi-tation and significant warming occurred in winter whilstsummer showed a cooling trend. The impact of these
Fig. 4 Isohyetal map of mean annual precipitation (1954–2004)
Environ Monit Assess (2012) 184:5255–5274 5259

climate changes will directly bear upon water resourceavailability.
Runoff
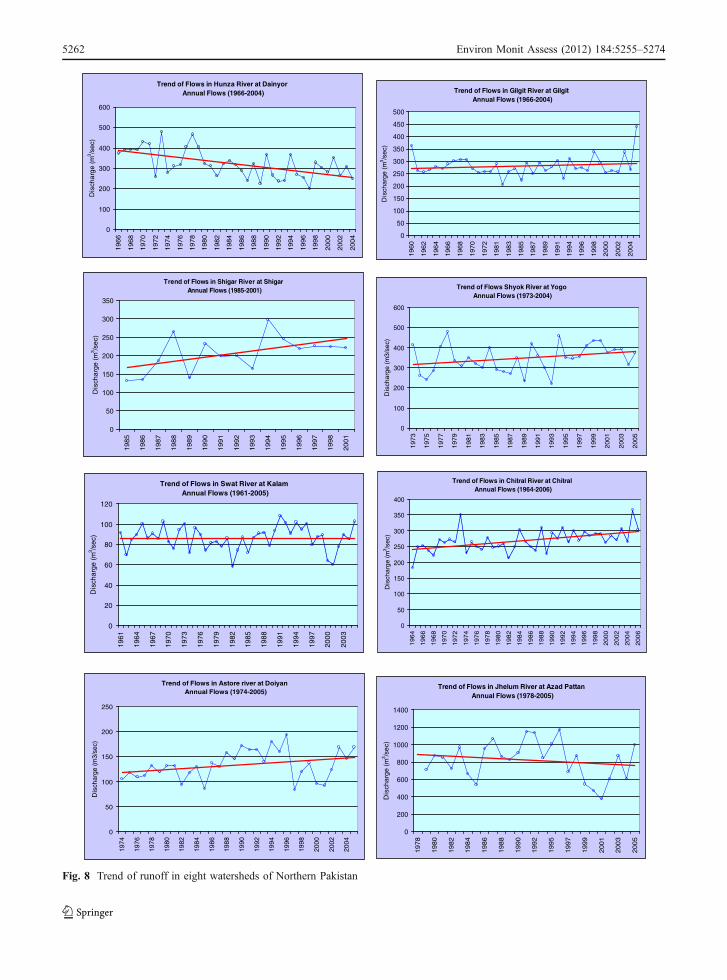
Recorded daily runoff data (1960–2005) for eightwatersheds have been processed to determine themonthly distribution of flows in the region. At certainlocations the data collected was of shorter duration asthe gauging stations were installed in later period(Fig. 7). In contrast to precipitation, these graphsshowed nearly a uniform pattern indicating much ofthe runoff in summer (June–August) except Jhelum atAzad Pattan which showed to be early riser. Theeffect of climate change has been investigated pickingup simple trend lines on long-term recorded annualrunoff in the selected eight watersheds (Fig. 8).
Except Hunza and Jhelum rivers, rest of the riversshowed increased trends in runoff volumes. Archer(2003) mentioned that summer runoff on the high-altitude glacier-fed catchments is positively correlatedwith summer temperatures. He suggested a 17%increase in summer runoff for Shyok for 1°C tempera-ture rise. However, runoff and temperature are nega-tively correlated onmiddle-altitude snow-fed catchments.He demonstrated that in such a variety of runoffresponses to changes in the climatic variables means thatit would be complicated to predict runoff response toclimate change.
Variation in daily discharges
Daily recorded data of selected stations wereanalyzed to determine any significant variations in
Jan
Feb
Mar
Apr
May
Jun
Jul
Aug
Sep
Oct
Nov
Dec
GilgitGupis
BunjiSkardu
ChitralAstor
NaltarKalam
MuzaffarabadMurree
-10
10
30
Tem
pera
tute
(Deg
ree
C)
Fig. 6 Mean monthlytemperatures (1954–2004)
Jan
Feb
Mar
Apr
May
Jun
Jul
Aug
Sep
Oct
Nov
Dec
Gilgit
Gupis
Bunji
Skardu
Chitral
Astor
Naltar
Kalam
Muzaffarabad
Murree
0
50
100
Pre
cipi
tatio
n(m
m)
Fig. 5 Mean monthlyprecipitations (1954–2004)
5260 Environ Monit Assess (2012) 184:5255–5274

Fig. 7 Variability of mean monthly discharge in eight watersheds of Northern Pakistan
Environ Monit Assess (2012) 184:5255–5274 5261
Trend of Flows in Hunza River at Dainyor Annual Flows (1966-2004)
0
100
200
300
400
500
600
1966
1968
1970
1972
1974
1976
1978
1980
1982
1984
1986
1988
1990
1992
1994
1996
1998
2000
2002
2004
Dis
char
ge (
m3 /s
ec)
Trend of Flows in Shigar River at Shigar Annual Flows (1985-2001)
0
50
100
150
200
250
300
350
19
85
19
86
19
87
19
88
19
89
19
90
19
91
19
92
19
93
19
94
19
95
19
96
19
97
19
98
20
01
Dis
cha
rge
(m
3 /se
c)Trend of Flows in Gilgit River at Gilgit
Annual Flows (1966-2004)
19
60
19
62
19
64
19
66
19
68
19
70
19
72
19
81
19
83
19
85
19
87
19
89
19
91
19
94
19
96
19
98
20
00
20
02
20
04
Dis
cha
rge
(m
3 /se
c)
Trend of Flows Shyok River at Yogo Annual Flows (1973-2004)
0
100
200
300
400
500
600
19
73
19
75
19
77
19
79
19
81
19
83
19
85
19
87
19
89
19
91
19
93
19
95
19
97
19
99
20
01
20
03
20
05
Dis
cha
rge
(m
3/s
ec)
Trend of Flows in Swat River at Kalam Annual Flows (1961-2005)
0
20
40
60
80
100
120
1961
1964
1967
1970
1973
1976
1979
1982
1985
1988
1991
1994
1997
2000
2003
Dis
char
ge (m
3 /sec
)
Trend of Flows in Chitral River at Chitral Annual Flows (1964-2006)
0
50
100
150
200
250
300
350
400
19
64
19
66
19
68
19
70
19
72
19
74
19
76
19
78
19
80
19
82
19
84
19
86
19
88
19
90
19
92
19
94
19
96
19
98
20
00
20
02
20
04
20
06
Dis
cha
rge
(m
3 /se
c)
Trend of Flows in Astore river at Doiyan Annual Flows (1974-2005)
0
50
100
150
200
250
1974
1976
1978
1980
1982
1984
1986
1988
1990
1992
1994
1996
1998
2000
2002
2004
Dis
char
ge (m
3/se
c)
Trend of Flows in Jhelum River at Azad Pattan Annual Flows (1978-2005)
0
200
400
600
800
1000
1200
1400
0
200
150
100
50
250
300
350
400
450
500
19
78
19
80
19
82
19
84
19
86
19
88
19
90
19
92
19
95
19
97
19
99
20
01
20
03
20
05
Dis
cha
rge
(m
3 /se
c)
Fig. 8 Trend of runoff in eight watersheds of Northern Pakistan
5262 Environ Monit Assess (2012) 184:5255–5274
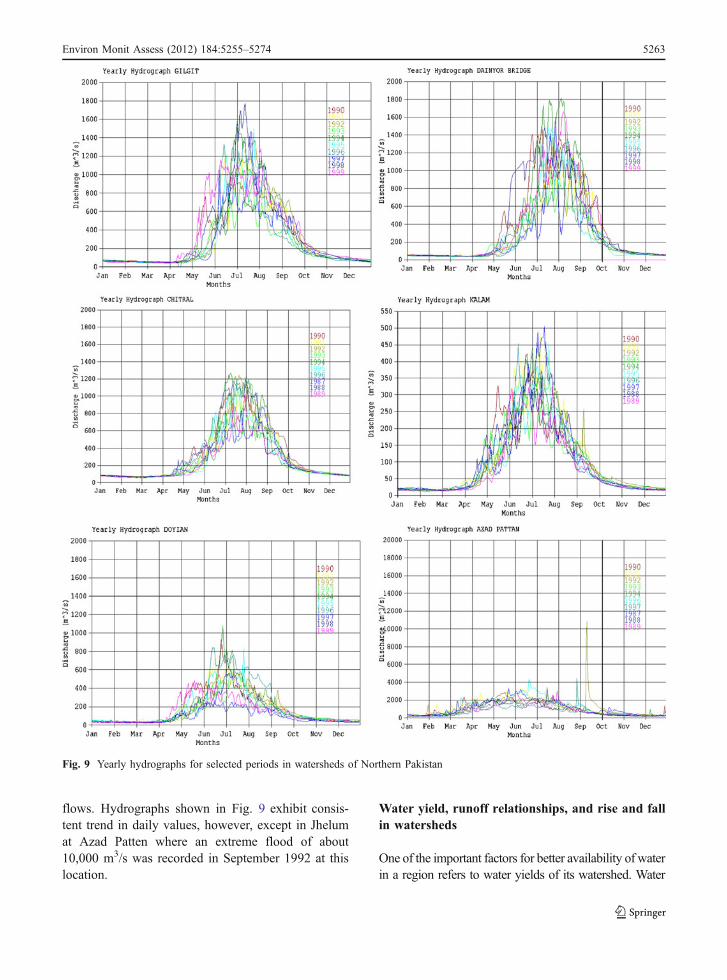
flows. Hydrographs shown in Fig. 9 exhibit consis-tent trend in daily values, however, except in Jhelumat Azad Patten where an extreme flood of about10,000 m3/s was recorded in September 1992 at thislocation.
Water yield, runoff relationships, and rise and fallin watersheds
One of the important factors for better availability of waterin a region refers to water yields of its watershed. Water
Fig. 9 Yearly hydrographs for selected periods in watersheds of Northern Pakistan
Environ Monit Assess (2012) 184:5255–5274 5263
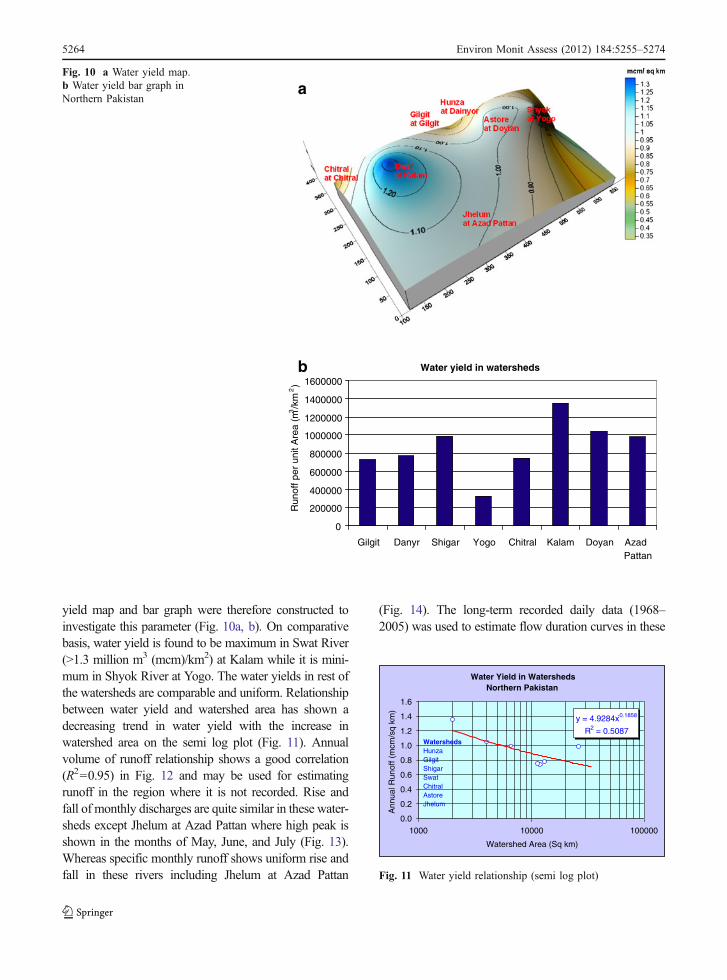
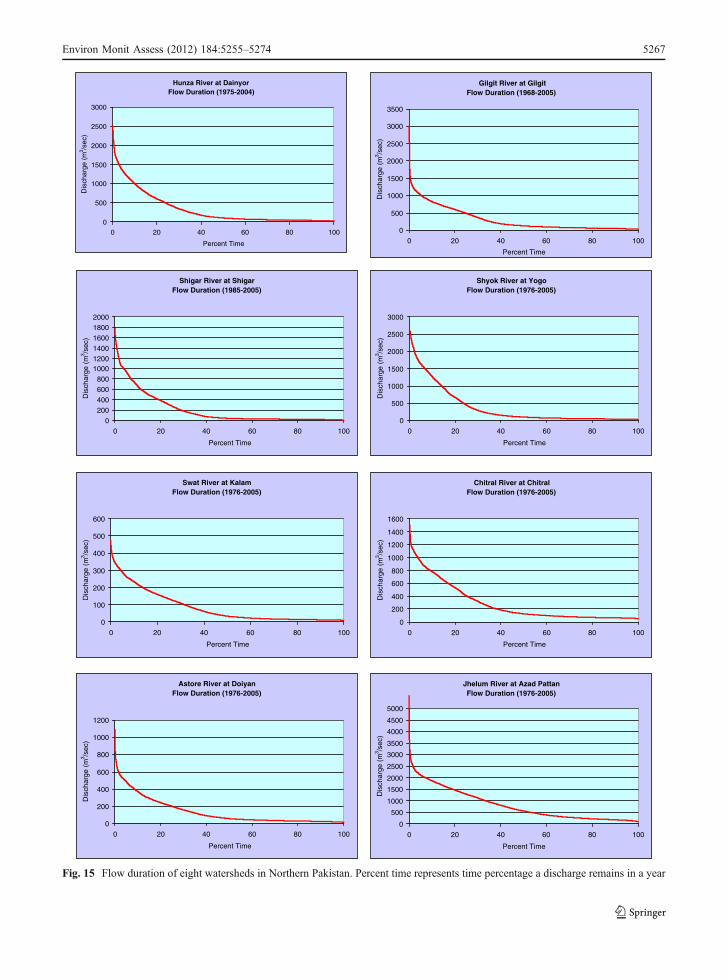
yield map and bar graph were therefore constructed toinvestigate this parameter (Fig. 10a, b). On comparativebasis, water yield is found to be maximum in Swat River(>1.3 million m3 (mcm)/km2) at Kalam while it is mini-mum in Shyok River at Yogo. The water yields in rest ofthe watersheds are comparable and uniform. Relationshipbetween water yield and watershed area has shown adecreasing trend in water yield with the increase inwatershed area on the semi log plot (Fig. 11). Annualvolume of runoff relationship shows a good correlation(R2=0.95) in Fig. 12 and may be used for estimatingrunoff in the region where it is not recorded. Rise andfall of monthly discharges are quite similar in these water-sheds except Jhelum at Azad Pattan where high peak isshown in the months of May, June, and July (Fig. 13).Whereas specific monthly runoff shows uniform rise andfall in these rivers including Jhelum at Azad Pattan
(Fig. 14). The long-term recorded daily data (1968–2005) was used to estimate flow duration curves in these
Water Yield in WatershedsNorthern Pakistan
y = 4.9284x-0.1858
R2 = 0.5087
0.0
0.2
0.4
0.6
0.8
1.0
1.2
1.4
1.6
1000 10000 100000
Watershed Area (Sq km)
Ann
ual R
unof
f (m
cm/s
q km
)
WatershedsHunzaGilgitShigarSwatChitralAstoreJhelum
Fig. 11 Water yield relationship (semi log plot)
Water yield in watersheds
0
200000
400000
600000
800000
1000000
1200000
1400000
1600000
Gilgit Danyr Shigar Yogo Chitral Kalam Doyan AzadPattan
Run
off p
er u
nit A
rea
(m3/k
m2)
a
b
Fig. 10 a Water yield map.b Water yield bar graph inNorthern Pakistan
5264 Environ Monit Assess (2012) 184:5255–5274
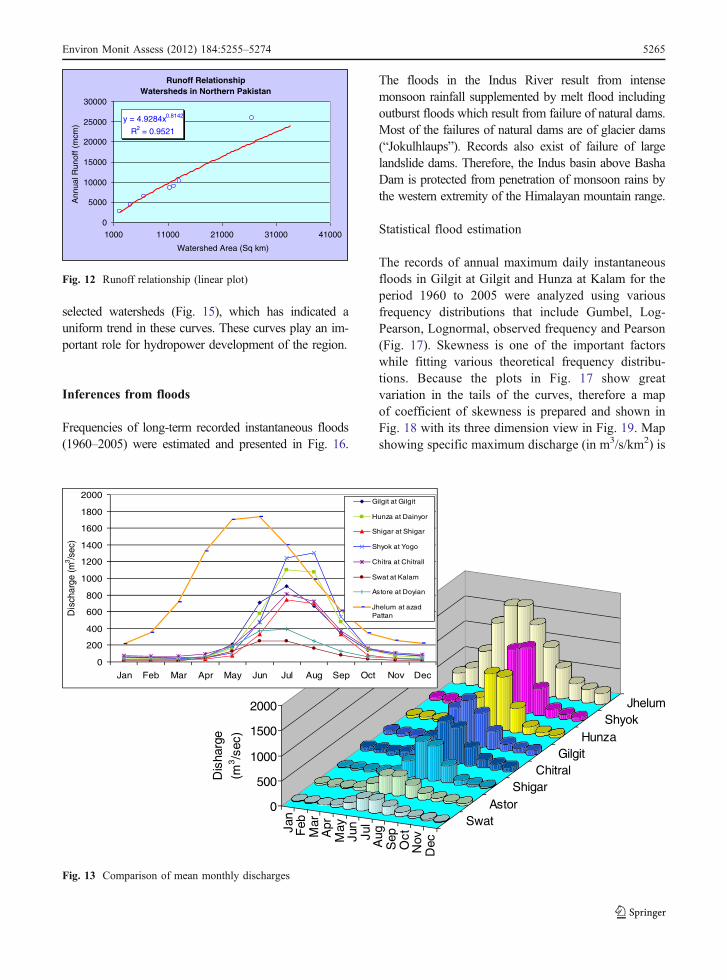
selected watersheds (Fig. 15), which has indicated auniform trend in these curves. These curves play an im-portant role for hydropower development of the region.
Inferences from floods
Frequencies of long-term recorded instantaneous floods(1960–2005) were estimated and presented in Fig. 16.
The floods in the Indus River result from intensemonsoon rainfall supplemented by melt flood includingoutburst floods which result from failure of natural dams.Most of the failures of natural dams are of glacier dams(“Jokulhlaups”). Records also exist of failure of largelandslide dams. Therefore, the Indus basin above BashaDam is protected from penetration of monsoon rains bythe western extremity of the Himalayan mountain range.
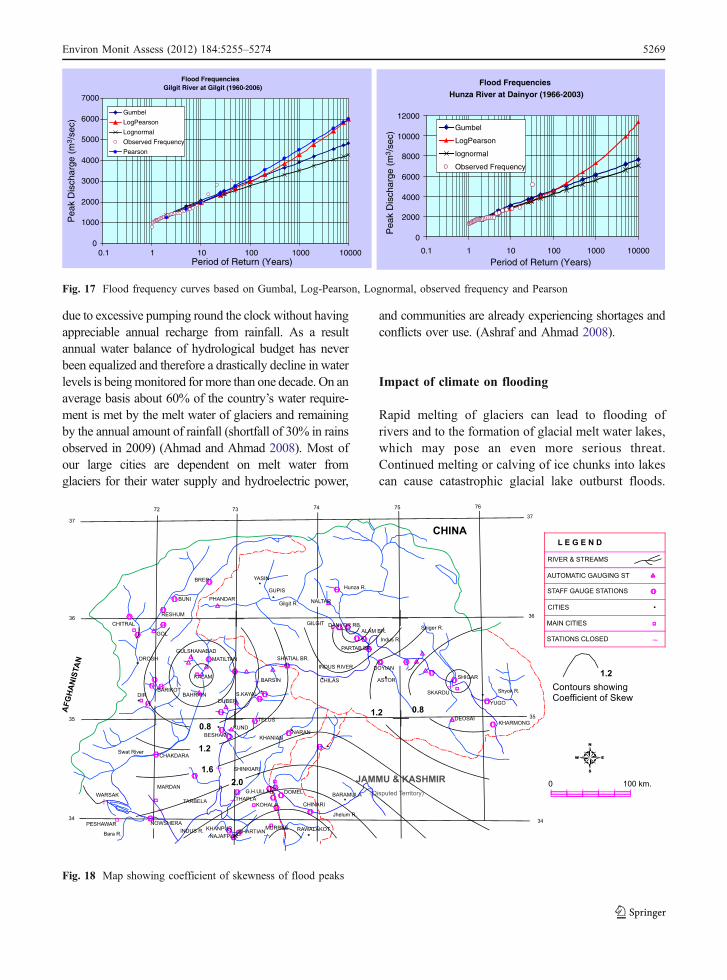
Statistical flood estimation
The records of annual maximum daily instantaneousfloods in Gilgit at Gilgit and Hunza at Kalam for theperiod 1960 to 2005 were analyzed using variousfrequency distributions that include Gumbel, Log-Pearson, Lognormal, observed frequency and Pearson(Fig. 17). Skewness is one of the important factorswhile fitting various theoretical frequency distribu-tions. Because the plots in Fig. 17 show greatvariation in the tails of the curves, therefore a mapof coefficient of skewness is prepared and shown inFig. 18 with its three dimension view in Fig. 19. Mapshowing specific maximum discharge (in m3/s/km2) is
Jan
Feb
Mar
Apr
May
Jun
Jul
Aug
Sep
Oct
Nov
Dec
SwatAstor
ShigarChitral
GilgitHunza
ShyokJhelum
0
500
1000
1500
2000
Dis
harg
e
(m3/s
ec)
0
200
400
600
800
1000
1200
1400
1600
1800
2000
Jan Feb Mar Apr May Jun Jul Aug Sep Oct Nov Dec
Dis
char
ge (m
3 /sec
)
Gilgit at Gilgit
Hunza at Dainyor
Shigar at Shigar
Shyok at Yogo
Chitra at Chitrall
Swat at Kalam
Astore at Doyian
Jhelum at azadPattan
Fig. 13 Comparison of mean monthly discharges
Runoff RelationshipWatersheds in Northern Pakistan
y = 4.9284x0.8142
R2 = 0.9521
0
5000
10000
15000
20000
25000
30000
1000 11000 21000 31000 41000
Watershed Area (Sq km)
Ann
ual R
unof
f (m
cm)
Fig. 12 Runoff relationship (linear plot)
Environ Monit Assess (2012) 184:5255–5274 5265

also constructed to identify the variation in thequantum of floods in the region. Specific maximumdischarge tends to decrease in north of the region asshown in Fig. 20 with its three dimension view inFig. 21.
Satellite image
A wide range of remote sensing data is available inpublished material (PARC 2005). The mosaic ofLandsat-7 images covering the glaciated region ofPakistan shown in Fig. 22 is obtained from previouslypublished material (PARC et al. 2005).
Glaciers
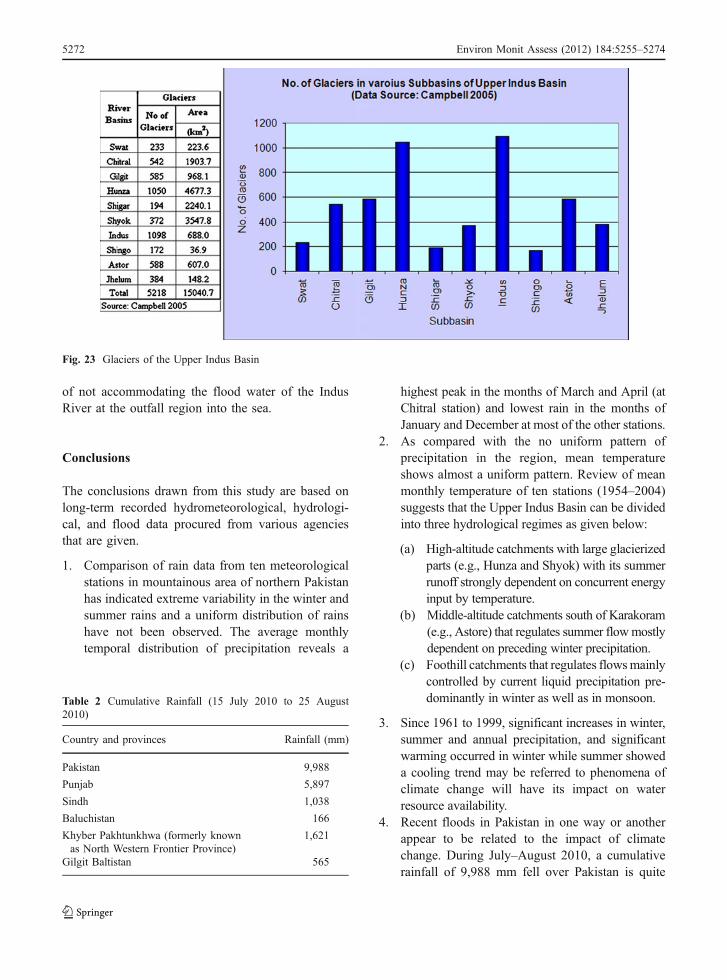
In the upper Indus Basin of northern Pakistan 5,218glaciers with their total area coverage of about15,040 km2 were identified and mapped by Campbell(2005) (Fig. 23). Occurrences of glaciers in eachRiver Basin are variable but the areal coverage by theHunza River Basin (4,677 km2) is the largest amongothers.
Climate change and water shortages
Akhtar et al. (2008) presents estimates of water resourceschanges in three river basins in the Hindukush–Karakorum–Himalaya region associated with climatechange. Generally, temperature and precipitation wouldshow an increase towards the end of the twenty-firstcentury, and their results indicated higher risk of floodproblems due to climate change.
The findings of the present study have also indicatedincrease in runoff in rivers of the Upper Indus Basin,Northern Pakistan, which may be attributed to apreliminary evidence of the climate change in Pakistan.
Approximately 70% of the freshwater are frozen inglaciers in Pakistan, which buffer ecosystems againstclimate variability by releasing water during dry seasonsor years. In tropical areas, glaciers contributing to streamflow often provide the only source of water for humansand wildlife during dry parts of the year. Freshwater isalready a limiting resource in Pakistan and in the next25 years population growth is likely to far exceed thanany potential increases in available water.
Aquifers of the Lower Indus Basin (federal capital ofIslamabad and Rawalpindi cities) are rapidly depleting
Jan
Feb
Mar
Apr
May
Jun
Jul
Aug
Sep
Oct
Nov
Dec
ShyokChitral
HunzaGilgit
JhelumAstor
ShigarSwat
0
100000
200000
300000
400000
Run
off p
er u
nit
area
(m
3/k
m2)
0
50000
100000
150000
200000
250000
300000
350000
Jan Feb Mar Apr May Jun Jul Aug Sep Oct Nov Dec
Ru
no
ff p
er u
nit
Are
a (m
3/km
2)
Gilgit at Gilgit
Hunza at Dainyor
Shigar at Shigar
Shyok at Yogo
Chitra at Chitrall
Swat at Kalam
Astore at Doyian
Jhelum at azadPattan
Fig. 14 Comparison of specific monthly runoff in the watersheds
5266 Environ Monit Assess (2012) 184:5255–5274
Hunza River at DainyorFlow Duration (1975-2004)
0
500
1000
1500
2000
2500
3000
0 20 40 60 80 100
Percent Time
Dis
char
ge (
m3 /s
ec)
Gilgit River at GilgitFlow Duration (1968-2005)
0
500
1000
1500
2000
2500
3000
3500
0 20 40 60 80 100
Percent Time
Dis
char
ge (
m3 /s
ec)
Swat River at KalamFlow Duration (1976-2005)
0
100
200
300
400
500
600
0 20 40 60 80 100
Percent Time
Dis
char
ge (
m3 /s
ec)
Shyok River at YogoFlow Duration (1976-2005)
0
500
1000
1500
2000
2500
3000
0 20 40 60 80 100
Percent Time
Dis
char
ge (
m3 /s
ec)
Shigar River at ShigarFlow Duration (1985-2005)
0200400600800
100012001400160018002000
0 20 40 60 80 100
Percent Time
Dis
char
ge (
m3 /s
ec)
Chitral River at ChitralFlow Duration (1976-2005)
0
200
400
600
800
1000
1200
1400
1600
0 20 40 60 80 100
Percent Time
Dis
char
ge (
m3 /s
ec)
Astore River at DoiyanFlow Duration (1976-2005)
0
200
400
600
800
1000
1200
0 20 40 60 80 100
Percent Time
Dis
char
ge (
m3 /s
ec)
Jhelum River at Azad PattanFlow Duration (1976-2005)
0
500
1000
1500
2000
2500
3000
3500
4000
4500
5000
0 20 40 60 80 100
Percent Time
Dis
char
ge (
m3 /s
ec)
Fig. 15 Flow duration of eight watersheds in Northern Pakistan. Percent time represents time percentage a discharge remains in a year
Environ Monit Assess (2012) 184:5255–5274 5267

2000.001800.001600.001400.001200.001000.00800.00600.00
Shigar
4
3
2
1
0
Fre
qu
ency
2000.001750.001500.001250.001000.00750.00
Chitral
12
10
8
6
4
2
0
Fre
qu
ency
3500.003000.002500.002000.001500.001000.00500.00
Gilgit
14
12
10
8
6
4
2
0
Fre
qu
ency
6000.005000.004000.003000.002000.001000.00
Dainyor
25
20
15
10
5
0
Fre
qu
ency
4000.003500.003000.002500.002000.001500.001000.00
Yogo
8
6
4
2
0
Fre
qu
ency
600.00500.00400.00300.00200.00100.00
Kalam
10
8
6
4
2
0
Fre
qu
ency
Fig. 16 Frequency of instantaneous floods in the watersheds. All floods values along x-axes are given in m3/s
5268 Environ Monit Assess (2012) 184:5255–5274
due to excessive pumping round the clock without havingappreciable annual recharge from rainfall. As a resultannual water balance of hydrological budget has neverbeen equalized and therefore a drastically decline in waterlevels is beingmonitored for more than one decade. On anaverage basis about 60% of the country’s water require-ment is met by the melt water of glaciers and remainingby the annual amount of rainfall (shortfall of 30% in rainsobserved in 2009) (Ahmad and Ahmad 2008). Most ofour large cities are dependent on melt water fromglaciers for their water supply and hydroelectric power,
and communities are already experiencing shortages andconflicts over use. (Ashraf and Ahmad 2008).
Impact of climate on flooding
Rapid melting of glaciers can lead to flooding ofrivers and to the formation of glacial melt water lakes,which may pose an even more serious threat.Continued melting or calving of ice chunks into lakescan cause catastrophic glacial lake outburst floods.
Fig. 18 Map showing coefficient of skewness of flood peaks
Flood Frequencies Gilgit River at Gilgit (1960-2006)
0
1000
2000
3000
4000
5000
6000
7000
0.1 1 10 100 1000 10000Period of Return (Years)
Pea
k D
isch
arge
(m
3 /se
c)
Gumbel
LogPearson
Lognormal
Observed Frequency
Pearson
Flood Frequencies Hunza River at Dainyor (1966-2003)
0
2000
4000
6000
8000
10000
12000
0.1 1 10 100 1000 10000
Period of Return (Years)
Gumbel
LogPearson
lognormal
Observed Frequency
Pea
k D
isch
arge
(m
3 /se
c)
Fig. 17 Flood frequency curves based on Gumbal, Log-Pearson, Lognormal, observed frequency and Pearson
Environ Monit Assess (2012) 184:5255–5274 5269

Recent rainfall in Pakistan in the months of July–August, 2010, which delivered unprecedented cumu-lative rainfall of 9,988 mm in Pakistan, has set aunique example leading to the impact of climatechange. Floods killed several people and destroyedbridges, houses, and arable land. Fertile lands in thecities of Sawat and Nowhera have completedundulated with the deposition of layers of trans-ported debris as much as that owners are unable to
even recognize their lands. About 20.5 millionpeople have been affected by flooding acrossPakistan as per estimates of the European Commis-sion’s Aid and Civil Protection Unit (ECHO). Whilethe floods in Pakistan cannot be attributed entirely toclimate change, the intensity of this disaster isconsistent with predictions that global warming willincrease the severity and frequency of extremeweather events.
Fig. 20 Map showing specific maximum discharge (m3/s/km2)
-0.200.20.40.60.811.21.41.61.822.22.42.62.833.23.4
Coefficient of Skew
Fig. 19 Three dimensionview of coefficient ofskewness of flood peaks
5270 Environ Monit Assess (2012) 184:5255–5274

The devastating floods in Pakistan highlight thestark reality of the world’s changing climatic patternsand the impact of this will have on vulnerablepopulations. Most recent rainfall data of 15 July2010 to 25 August 2010 is shown in Table 2. Risingsea level is one of the most widely discussed andpotentially significant problems associated with glob-al warming. Not only does a large proportion of theglobal population live in areas likely to be affected bysea-level rise, but the long adjustment time of the
world’s oceans means that, in principle, the processwill be difficult to reverse (Khan et al. 2002).
Sea-level changes at the shoreline due to tidal motiontake place over a period of hours; those changes that aredue to movements of continental plates take place overmillennia. Between these two extremes, the timescale onwhich rises in sea-level attributed to climate change arelikely to occur will be decades to centuries.
In August 2010, tidal rise in sea level at the shoresof Arabian Sea, Karachi which posed a bigger threat
Fig. 21 Three-dimensionalview of specific maximumdischarge (m3/s/km2)
Fig. 22 Mosaic of Landsat-7 ETM+ images of thenorthern glaciated regionof Pakistan (PARCet al. 2005)
Environ Monit Assess (2012) 184:5255–5274 5271
of not accommodating the flood water of the IndusRiver at the outfall region into the sea.
Conclusions
The conclusions drawn from this study are based onlong-term recorded hydrometeorological, hydrologi-cal, and flood data procured from various agenciesthat are given.
1. Comparison of rain data from ten meteorologicalstations in mountainous area of northern Pakistanhas indicated extreme variability in the winter andsummer rains and a uniform distribution of rainshave not been observed. The average monthlytemporal distribution of precipitation reveals a
highest peak in the months of March and April (atChitral station) and lowest rain in the months ofJanuary and December at most of the other stations.
2. As compared with the no uniform pattern ofprecipitation in the region, mean temperatureshows almost a uniform pattern. Review of meanmonthly temperature of ten stations (1954–2004)suggests that the Upper Indus Basin can be dividedinto three hydrological regimes as given below:
(a) High-altitude catchments with large glacierizedparts (e.g., Hunza and Shyok) with its summerrunoff strongly dependent on concurrent energyinput by temperature.
(b) Middle-altitude catchments south of Karakoram(e.g., Astore) that regulates summer flowmostlydependent on preceding winter precipitation.
(c) Foothill catchments that regulates flowsmainlycontrolled by current liquid precipitation pre-dominantly in winter as well as in monsoon.
3. Since 1961 to 1999, significant increases in winter,summer and annual precipitation, and significantwarming occurred in winter while summer showeda cooling trend may be referred to phenomena ofclimate change will have its impact on waterresource availability.
4. Recent floods in Pakistan in one way or anotherappear to be related to the impact of climatechange. During July–August 2010, a cumulativerainfall of 9,988 mm fell over Pakistan is quite
Fig. 23 Glaciers of the Upper Indus Basin
Table 2 Cumulative Rainfall (15 July 2010 to 25 August2010)
Country and provinces Rainfall (mm)
Pakistan 9,988
Punjab 5,897
Sindh 1,038
Baluchistan 166
Khyber Pakhtunkhwa (formerly knownas North Western Frontier Province)
1,621
Gilgit Baltistan 565
5272 Environ Monit Assess (2012) 184:5255–5274
unique and has caused humongous damages tostructures and mankinds.
5. Analysis of daily runoff data (1960–2005) for theeight selected watersheds indicated nearly a uni-form pattern with much of the runoff in summer(June–August) except Jhelum at Azad Pattan thathas shown an early rise in the runoff commencingfrom April.
6. Impact of climate change has been studied byvisual examination of trend lines on long-termrecorded annual runoff (1960–2005) of eightwatersheds. Except the Hunza and Jhelum Riv-ers, rest of the rivers showed increased trends inrunoff volumes. However, runoff and tempera-ture are negatively correlated on middle-altitudesnow-fed catchments. As a matter of fact, due tovariety of runoff responses to changes in theclimatic variables it is complicated to predictrunoff to climatic change.
7. The study of the water yield availability indicated aminimum trend in Shyok River at Yogo and amaximum trend in Swat River at Kalam. The wateryields in rest of the watersheds are comparable anduniform.
8. Long-term recorded data (1960–2005) used toestimate flow duration curves for the eightwatersheds has shown a uniform trend and areimportant for hydropower generation of Pakistan.
Acknowledgments The authors gratefully acknowledge Aus-training International and the Department of Education,Employment and Workplace Relations (DEEWR) for providingpost-selection support services and funding the research underthe executive Endeavour Award 2010. We also acknowledgeLauren Fyfe—case manager of Austraining—and Sue Kendallof the International Centre of water for food security (ICWater), Charles Sturt University, Wagga Wagga, for timelysupport and provision of the essentials of research. Water andDevelopment Authority, Pakistan Meteorology Development,Department of Earth Sciences, Quaid-i-Azam University, andCollege of Earth and Environmental Sciences, Punjab Universityare highly acknowledged for providing access to reliable data towork on and to publish valuable information.
References
Ahmad, Z., & Ahmad, I. (2008). Groundwater modeling studyof the Potowar area, Rawalpindi using Visual Modflowmodel, Rawalpindi environmental improvement project(REIP) of Water and Sanitation Agency (WASA), unpub-lished report (by Asian Development Bank)
Akhtar, M., Ahmad, N., & Booij, M. J. (2008). The impact ofclimate change on the water resources of Hindukush–Karakorum–Himalaya region under different glacier coveragescenarios. Journal of Hydrology, 355(1–4), 148–163.
Alford, D. (1992). Hydrological Aspects of the HimalayanRegion. ICIMOD Occasional Paper, no. 18. Kathmandu.
Ali, G. (1989). Some Hydrological Aspects of snowmelt runoffunder summer conditions in the Barpu Glacier Basin,Central Karakoram, Himalaya, Northern Pakistan. Unpub-lished M.A. thesis. Waterloo: Wilfrid Laurier University.
Archer, D. R. (2003). Contrasting hydrological regimes in theupper Indus Basin. Journal of Hydrology, 274(198–2), 10.
Archer, D. R. (2004). Hydrological implications of spatial andaltitudinal variation in temperature in the Upper IndusBasin. Nordic Hydrology, 35(3), 213–227.
Ashraf, A., & Ahmad, Z. (2008). Regional groundwaterflowmodeling of upper Chaj Doab, Indus Basin. GeophysicalJournal International (GJI), 173, 17–24. doi:10.1111/j.1365-246X.2007.03708.x.
Butz, D. A. O. (1989). The agricultural use of meltwater inHopar settlement, Pakistan. Annals of Glaciology, 13, 35–39.
Butz, D. A. O., & Hewitt, K. (1986). A note in the Upper IndusBasin Weather Stations. In K. Hewitt (Ed.), Snow and icehydrology project: annual report (pp. 64–76). Waterloo:Wilfrid Laurier University.
Campbell, J. G. (2005) Inventory of Glaciers, Glacial Lakesand the Identification of Potential Glacial Lake OutburstFloods (GLOFs) Affected by Global Warming in theMountains of India, Pakistan and China/Tibet. Interna-tional Centre for Integrated Mountain Development, G. P.O. Box 3226, Kathmandu
De Jong, C, Collins, D., & Ranzi, R. (2005) (Eds) Climate andhydrology in mountain areas. Wiley, Chichester.
de Scally, F. A. (1992). Influence of avalanche snow transport onsnowmelt runoff. Journal of Hydrology, 137(1–4), 73–97.
de Scally, F. A., & Gardner, J. S. (1988) The hydrologicalimportance of avalanche snow, Kaghan Valley, Himalayanmountains, Pakistan. In Proceedings of the InternationalSnow Science Workshop, pp. 277–283. Vancouver: CanadianAvalanche Association
Druce, D. J. (2001). Insights from a history of seasonal inflowforecasting with a conceptual hydrologic model. Journalof Hydrology, 249, 102–112.
Ferguson, R. I., Collins, D. N., & Whalley, W. B. (1984).Techniques for investigating meltwater runoff and erosion.In K. J. Miller (Ed.), The International Karakoram Project(pp. 374–382). Great Britain: Cambridge University Press.
Fowler, H. J., & Archer, D. R. (2005). Hydro-climatologicalvariability in the Upper Indus Basin and implications forwater resources. In Regional Hydrological Impacts ofClimatic Change—Impact Assessment and Decision Making(Proceedings of symposium S6 held during the SeventhIAHS Scientific Assembly at Foz do Iguaçu, Brazil,April 2005). IAHS Publ. 295
Hewitt, K. (1985) Snow and ice hydrology in remote, highmountain basins: the Himalayan sources of the RiverIndus. In Snow and Ice Hydrology Project Working PaperNo. 1. Waterloo: Wilfrid Laurier University
Hewitt, K. (1986). The Upper Indus snow belts: SNOWFALLand sources of water yield. In K. Hewitt (Ed.), Snow and
Environ Monit Assess (2012) 184:5255–5274 5273
ice hydrology project: annual report 1985 (pp. 58–63).Waterloo: Wilfrid Laurier University.
Hewitt, K. (1988). The snow and ice hydrology project:research and training for water resource development inthe Upper Indus basin. Journal of Canada—PakistanCooperation, 2(1), 63–72.
Hewitt, K., Young, G. J. (1990) Snow and ice hydrology project:handbook of snow and ice hydrology IV: runoff hydrology.Waterloo: Cold Regions Research Centre, Wilfrid LaurierUniversity
Hewitt, K., Young, G. J. (1993). The Snow and Ice HydrologyProject: a Pakistan-Canada research and training programme.In: Young, G. J. (ed.), Snow and Glacier Hydrology.International Symposium, Kathmandu, Nepal, 16–21November 1992. Proceedings. International Associationof Hydrological Sciences. IAHS/AISH Publication, no.218: 49–58.
Hewitt, K., Wake, C., Young, G. J., & David, C. (1989).Hydrological investigations at Biafo Glacier, KarakoramHimalaya, Pakistan: an important source of water for theIndus River. Annals of Glaciology, 13, 103–108.
Khan, M. I. (1995) The effects of snow avalanches on thehydrologic regime of the Kunhar river, Western Himalayan,Pakistan: analysis and application to river flow forecasting.M.A.Sc. Thesis, Department of Civil Engineering, Universityof British Columbia, Vancouver, p. 148.
Khan, T. M. A., Razzaq, D. A., Chaudhry, Q., Quadir, D. A.,Kabir, A., & Sarker, M. A. (2002). Sea level variations andgeomorphological changes in the coastal belt of Pakistan.Marine Geodesy, 25(1), 159–174. 1521-060X.
Kirch, J. (1987) Upper Indus Basin, Snow and Ice RunoffForecasting Project. Project Identification Mission Report,714/0014720 to C.I.D.A
Li, N., & Cai, X. (1981). Discussion on some hydrologicalfeatures of the Batura Glacier, Karakoram. Journal ofGlaciology and Cryopedology, 3(2), 7–12.
Li, B., Zharng, Q., & Wang, F. (1991). Evolution of lakes in theKarakoram-west Kunlun mountains. Quaternary Sciences,1, 64–71.
Makhdoom, M. T. A., & Solomon, S. I. (1986). Attemptingflow forecasts of the Indus River, Pakistan using remotelysensed snow cover data. Nordic Hydrology, 17, 171–184.
Micovic, Z., & Quick, M. C. (1999). A rainfall and snowmeltrunoff modeling approach to flow estimation at ungaugedsites in British Columbia. Journal of Hydrology, 226, 101–120.
Pakistan Water and Power Development Authority (WAPDA)(1987) Snow and Ice Hydrology Project Annual Report 1985,1986, 1987. Lahore: Hydrology and Research Directorate.
Pakistan Water and Power Development Authority (WAPDA).Hydrology and System Analysis Organization (1961–2005)
Annual Report of River and Climatological Data ofPakistan: Vol. I: River Discharge, Sediment and QualityData. Lahore: Surface Water Hydrology Project.
Pakistan Water and Power Development Authority (WAPDA).Hydrology and System Analysis Organization (1961–2005)Annual Report of River and Climatological Data ofPakistan: Vol. II: Daily and Hourly Precipitation Data.Lahore: Surface Water Hydrology Project.
Pakistan Water and Power Development Authority (WAPDA).Hydrology and System Analysis Organization. (1961–2005) Annual Report of River and Climatological Dataof Pakistan: Vol. III: Precipitation, Evaporation, Temper-atures, Relative Humidity, Solar Radiation and WindMovement Data. Lahore: Surface Water HydrologyProject.
Pakistan Water and Power Development Authority (WAPDA).Hydrology and System Analysis Organization. (2003).Sediment appraisal of Pakistan rivers 1960–1990. Lahore:Surface Water Hydrology Project.
PARC (2005). Inventory of Glaciers and Glacial Lakes and theIdentification of Potential Glacial Lake Outburst Floods(GLOFs) Affected by Global Warming in the Mountainsof Himalayan Region, Pakistan Agricultural ResearchCouncil Islamabad.
PARC, APN, UNEP, START, and ICIMOD (2005) Inventory ofGlaciers and Glacial Lakes and the Identification of PotentialGlacial Lake Outburst Floods (glofs) Affected by GlobalWarming in the Mountains of Himalayan Region
Quick, M. C. (1995). U.B.C. Watershed Model Manual-Version4. Vancouver: Department of Civil Engineering Universityof British Columbia.
Singh, P., & Kumar, N. (1997). Impact assessment of climatechange on the hydrological response of a snow and glaciermelt runoff dominated Himalayan river. Journal ofHydrology, 193, 316–350.
Steele, T. D. (1982). A characterization of streams temperaturesin Pakistan using harmonic analysis. Hydrological SciencesJournal, 27(4), 451–467.
Yang, Z. (1981). Basic characteristics of runoff in contemporaryglaciated areas of China. Scientia Sinica, 24(10), 1418–1430.
Yang, Z, & Hu, X. (1992). Study of glacier meltwater resourcesin China. In Hooke RL (ed.), Symposium on MountainGlaciology, Lanzhou, Gansu Province, China, 26–30August 1991. Proceedings. Annals of Glaciology, vol. 16.pp. 141–145.)
Young GJ, Hewitt K (1990) Hydrology research in the upperIndus basin, Karakoram Himalaya, Pakistan. InternationalAssociation Hydrological Sciences. International Associa-tion of Hydrological Sciences. IAHS Publication No. 190,139–152
5274 Environ Monit Assess (2012) 184:5255–5274