hydrologic investigation .' of the ,i north … is a hydrologic investigation of the north...
TRANSCRIPT

.',i•.
litkI,l.· I
ti.
,II"
HYDROLOGIC INVESTIGATIONOF THE
NORTH CANADIAN RIVER BASIN
OKLAHOMA WATER RESOURCES BOARD,{~_._---~-
ii
4AHyd
, PROPERTY OFOKLAHOMA WATER RESOURCES BOARD
"'.
HYDROLOGIC INVESTIGATION
OF THE
NORTH CANADIAN,RIVER BASIN
Publication No. 103
By
Tesfai Ghermazien, Ph.D.
and
R. A. Zi pser
STREAM WATER DIVISIONOKLAHO~1A WATER RESOURCES BOARD
May 1980
PROPERTY OFOKLAHOMA WATER RESOURCES BOARD
..
ERRATA SHEET
FOR PUB. #103
HYDROLOGIC INVESTIGATIONOF THE
NORTH CANADIAN RIVER BASIN.
Page 14
1) 3rd Paragraph 2nd line "Figure 8" should read "Figure 9"
2) Equation 3 "P(X x)" should read "P(X 2: x)"
Page 21
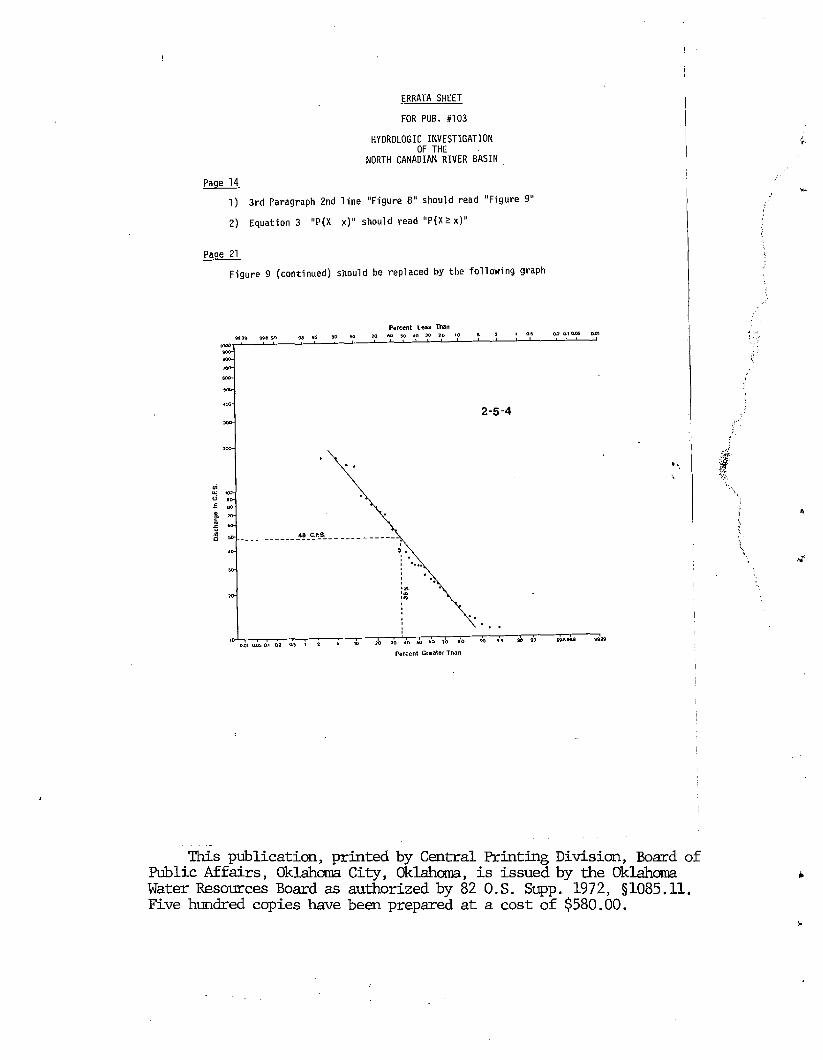
Figure 9 (continued) should be replaced by the following graph
f.,cent less Than9.a 115 !iO f>O 20 60 !>O -to 3Q 20 10
. .
___ ~!_c::':.s. .. __ :
~ .: .I ••••.,,' ..'"'",
'.
2-5-4
..<,,'
"
\...
D.\ll om. -0,1 0.2 0.5 I '2
Percent G(I!II!l~er Tl1an
This publication, printed by Central Printing Division, Board ofPublic Affairs, Oklahoma City, Oklahoma, is issued by the Oklahoma.Water Resources Board as authorized by 82 O.S. Supp. 1972, §l085.ll.Five hundred copies have been prepared at a cost of $580.00.

INTROOUCTION
TABLE OF CONTENTS
PAGE1
BASIN DESCRIPTION •••••••••••••••••••••••••••••••••••••••••••••••
CLIMATOLOGICAL DATA ••••••••••••••••••••••••••••••••••••••••••••• 3
Cl imati c Zones ••.••••••..•.•...........•.••.••......••..... 3Preci pitaton .............................•....•............ 3Pan Evaporation............................................ 8
MUNICIPAL AND INDUSTRIAL USE DISTRIBUTION ••••••••••••••••••••••• 12
DETERMINATION OF IRRIGATION REQUIREMENT ••••••••••••••••••••••••• 13
STREAM WATER FLOW ••••••••••••••••••••••••••••••••••••••••••••••• 14
Sub-Stream System 2-5-1Sub-Stream System 2-5-2Sub-Stream System 2-5-3Sub-Stream System 2-5-4
•••••••••••••••••••••••••••••••••••• 14141515
APPROPRIATED WATERS ••••••••••••••••••••••••••••••••••••••••••••• 22
MAJOR LAKES AND AMOUNT OF WATERAPPROPRIATED FROM THEM •••••••••••••••••••••••••••••••••••••••••• 23
UNAPPROPRIATED WATER •••••••••••••••••••••••••••••••••••••••••••• 24
Sub-Stream System 2-5-1Sub-Stream System 2-5-2Sub-Stream System 2-5-3Sub-Stream System 2-5-4
•••••••••••••••••••••••••••••••••••• 24242424
SUMMARY AND CONCLUSIONS ••••••••••••••••••••••••••••••••••••••••• 25
RECOMMENDATIONS ••••• ~ ••••••••••••••••••••••••••••••••••••••••••• 25
REFERENCES •••••••••••••••••••••••••••••••••••••••••••••••••••••• 26
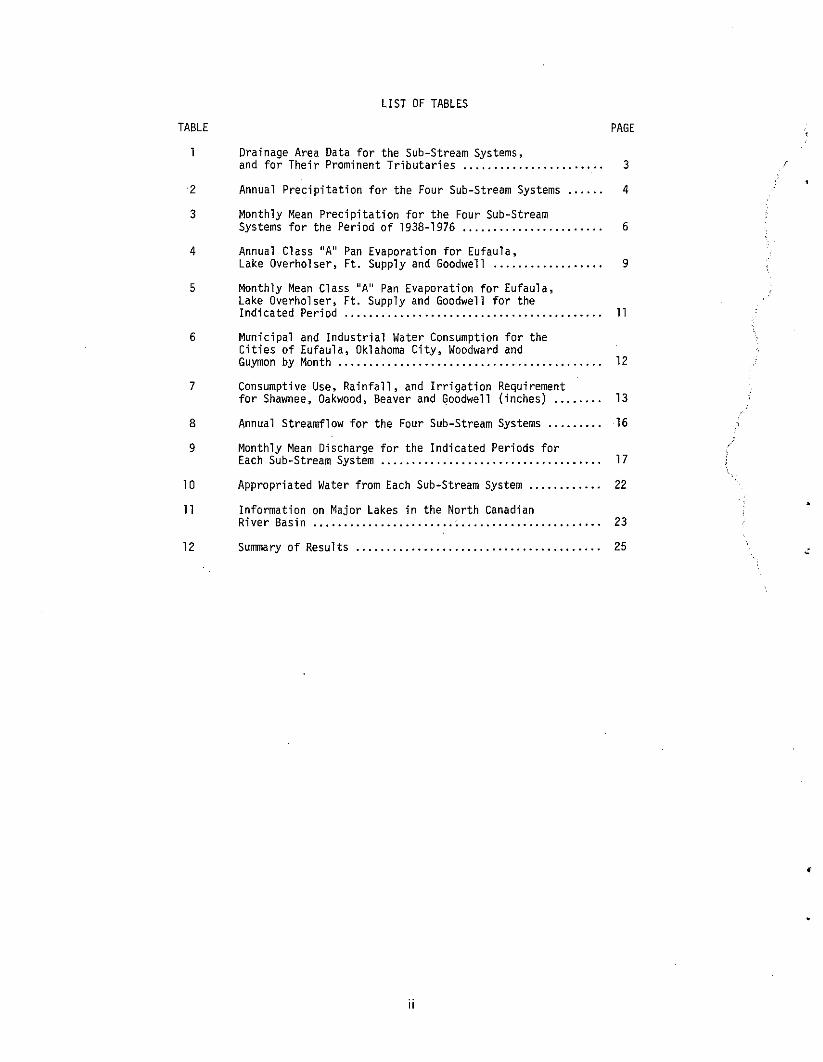
LIST OF TABLES
TABLE PAGE
Drainage Area Data for the Sub-Stream Systems,and for Their Prominent Tributaries 3
2 Annual Precipitation for the Four Sub-Stream Systems 4
3 Monthly Mean Precipitation for the Four Sub-StreamSystems for the Period of 1938-1976 .•...... 6
4 Annual Class lIA" Pan Evaporation for Eufaula,Lake Overholser, Ft. Supply and Goodwell.................. 9
5 Monthly Mean Class "A" Pan Evaporation for Eufaula,Lake Overholser, Ft. Supply and Goodwell for theIndicated Period.......................................... 11
6 Municipal and Industrial Water Consumption for theCities of Eufaula, Oklahoma City, Woodward andGuymon by Month........................................... 12
7 Consumptive Use, Rainfall, and Irrigation Requirementfor Shawnee, Oakwood, Beaver and Goodwell (inches) 13
8 Annual Streamflow for the Four Sub-Stream Systems......... 16
9 Monthly Mean Discharge for the Indicated Periods forEach Sub-Stream System 17
10 Appropriated Water from Each Sub-Stream System ..........•. 22
11 Information on Major Lakes in the North CanadianRiver Basin............................................... 23
12 Summa ry of Resu lts 25
ii
•

i·i' FIGURE
LIST OF FIGURES
PAGE
North Canadian River Basin 2
2
3
4
5
6
7
8
8
9
9
Climatic Zones of the North Canadian River Basin
Monthly Average Precipitation Over the 1938-1976Period .............................••............•.•.
Annual Precipitation for the Sub-Stream Systemsfor the Period of 1938-1976 ..•••.....•..•............
Annual Pan Evaporation for EUfaula, Lake Overholser,Ft. Supply and Goodwell for the Indicated Period
Monthly Average Pan Evaporation over theIndicated Period for Eufaula, Lake Overholser,Ft. Supply, and Goodwell •...................•...•....
Monthly Mean Discharge for the Indicated RecordPeriod for All Four Sub-Stream Systems ..........•....
Yearly Mean Discharge for Sub-Stream Systems2-5-1, 2-5-2 .........••...•......••..........••••••.
(continued) Yearly Mean Discharge for Sub-StreamSystems 2-5-3, 2-5-4 ......•...••..•.••.•...........•
Lognormal Probability Plot for Sub-StreamSystems 2-5-1, 2-5-3 ........•.....••.•.........•.....
(continued) Lognormal Probability Plot forSub-Stream System 2-5-4 ....•......•..••••.•...........
iii
5
6
7
10
11
17
18
19
20
21
INTRODUCTION
This is a hydrologic investigation of the North Canadian stream system. Itsmain purpose is to search for answers to the questions that arise in the day-today management of stream water by the Oklahoma Water Resources Board.
The increasing demand for water by cities, towns, irrigators and industriesrequires a more efficient management of our water resources. To acquire this goala great deal of attention must be devoted to more refined hydrologic studies. Thisstudy gives a hydrologic appraisal of surface water resources in the North CanadianRiver stream system. This study could be indicative of the basic req~irement forplanning, designing, constucting and operating reservoirs, but its main objectiveis to determine the source, extent and dependability of water supply for fourdifferent segments of the stream.
This study was based on existing data. For streamflow, gages of the U.s.Geological Survey were used. Precipitation and Class A pan evaporation wereobtained from publications of climatological data, U. S. Department of Commerce.Other data was obtained from previous reports, water departments of cities andfrom records of the Oklahoma Water Resources Board.
The content of the study includes a general description of the North CanadianRiver basin and its sub-basins, climatological data, streamflow, appropriated andunappropriated water, monthly water consumption, and determination of the irrigation requirement for the four sub-basins of the North Canadian River.
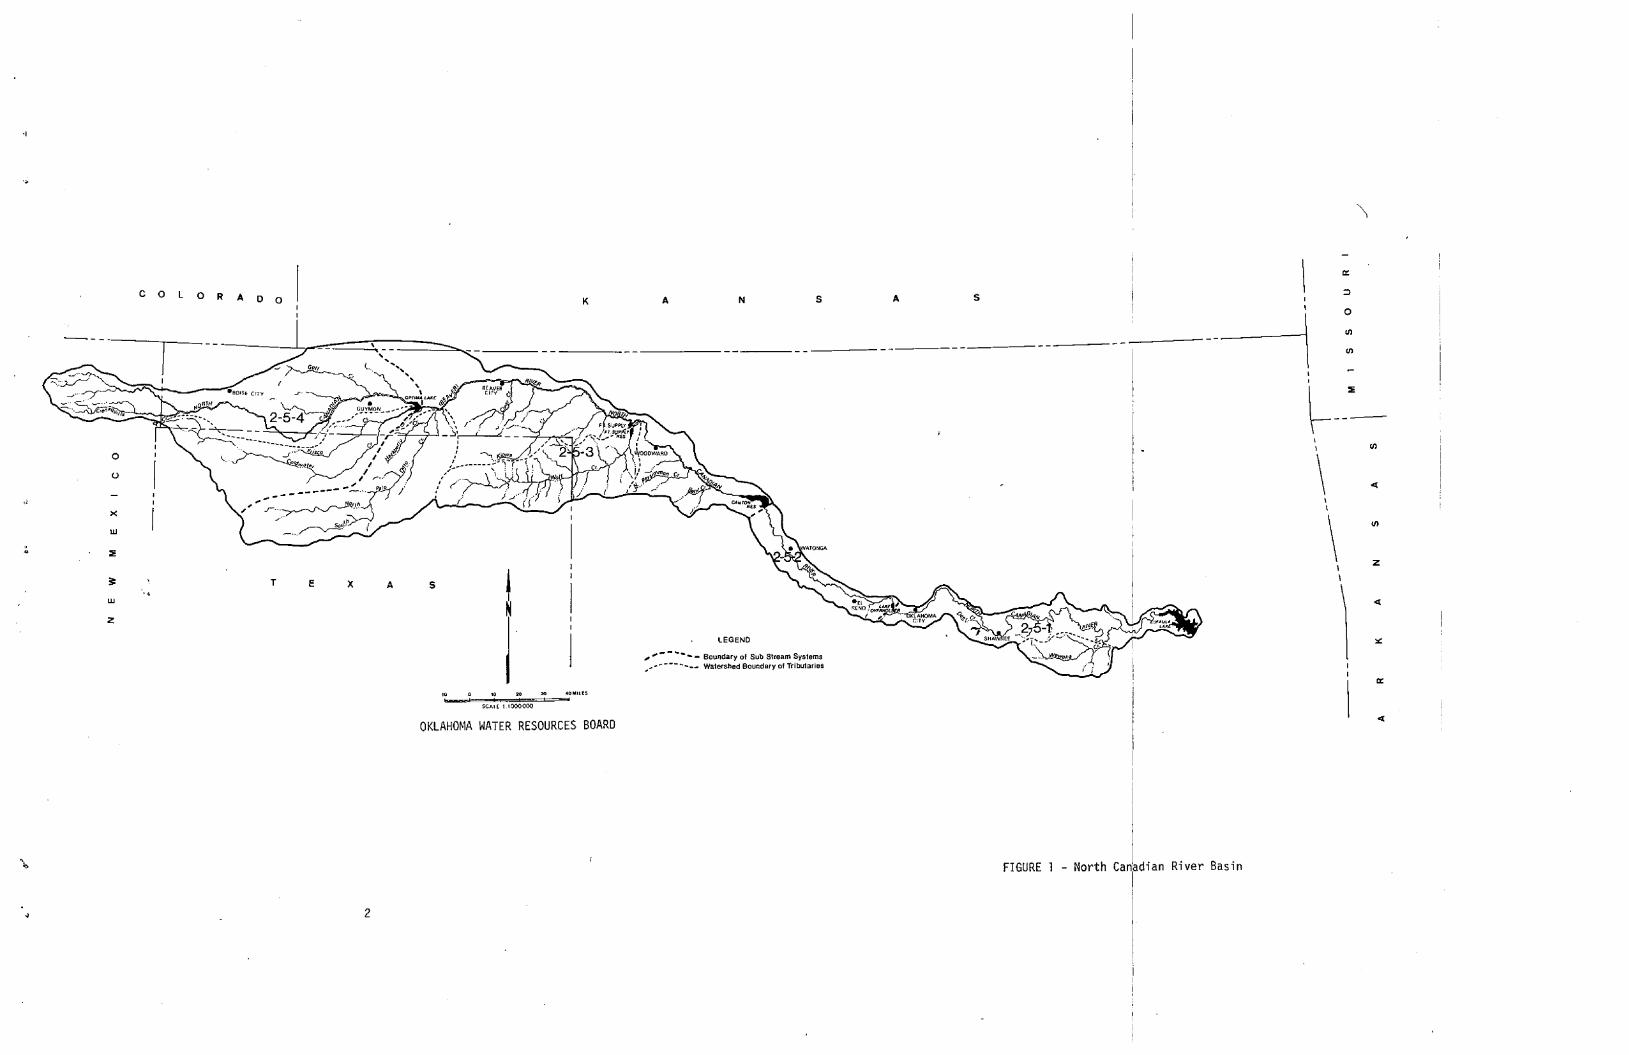
BASIN DESCRIPTION
The North Canadian River stretches through the states of New Mexico, Texasand Oklahoma as shown in Figure 1. The total drainage area is 15,212 squaremiles, of which 4,899 square miles is noncontributing. Approximately 61.3% of thedrainage area is situated in the State of Oklahoma, 33.2% in the State of Texasand 5.5% in New Mexico.
The topography of the North Canadian River Basin varies from gentle slopingplains to rough hills and high plains. In New Mexico it is composed of plateaus,mesas, and hills, and in Texas it is composed of High Plains. In Oklahoma itranges from plains of gentle slope in the Panhandle area to rough and rollinghills in the eastern part of the basin.
Vegetation cover varies from grasses to oak forests. Vegetation cover in theStates of New Mexico and Texas is essentially similar, primarily grasslands withtrees like hackberry and cottonwood along watercourse banks. In Oklahoma, in thewatershed area west of Oklahoma City, the prevailing vegetation cover consists ofblackjack, postoak, plum, sage, skunk brush and grasses, while along the watercourses, hackberry, elm, cottonwood and chittamwood trees are plentiful. East ofOklahoma City the area is predominantly covered by oak forests and cleared cattleranges.
The Oklahoma Water Resources Board recently divided some of the previouslyexisting stream systems into sub-stream systems. The purpose of diViding thebasins into sub-stream systems is an attempt to assist surface water resourcesmanagement in general, and hydrologic investigations in particular. The NorthCanadian River Basin is one of the stream systems which was divided.
The four sub-basins of the North Canadian in Oklahoma are designated as 2-51, 2-5-2, 2-5-3 and 2-5-4 (Figure 1). Sub-basin 2-5-1 is the watershed of theNorth Canadian River that contributes runoff to the Eufaula Lake below LakeOverholser. Sub-basin 2-5-2 is the drainage area between Canton and Lake Overholser dams, 2-5-3 is the drainage area between Optima and Canton Dams, and subbasin 2-5-4 is that part of the basin up stream from Optima Dam. Table 1 showsthe respective drainage area data and the prominent tributaries of the NorthCanadian River in each sub-basin-. In this same Table, the column of "Actual Areaof Sub-basins ll refers to the isolated area of each sub-basin, whereas "DrainageArea ll includes all drainage areas that theoretically would be expected to contribute water to the outlet of each sub-basin.
•
\
COL a R A 0 a
, ,; - - .. - - - Boundary of Sub Stream Systems........... --- ... oa __ Watershed Boundary of Tributaries
II
~--~
D::
z
o
\\
\
\
\
I
\
1,
----lsA5N
LEGEND
AK
IsAxET
0
u
x
w
::E
:!::• <
w
Z
"
...._"""=..;;,.:....=*"=~="....;;40MnIl!S$CAI[ 1,1000,000
OKLAHOMA WATER RESOURCES BOARD
FIGURE 1 - North Canadian River Basin
2
.'
TABLE 1
DRAINAGE AREA DATA FOR THE SUB-STREAM SYSTEMS, AND FOR THEIR PROMINENT TRIBUTARIES
SUB-STREA~l
SYSTEMPROMINENT DRAINAGE AREA SQ. MI.
TRIBUTARIES CONTRIB. NON.CONTRIB. TOTAL
ACTUALAREA OF
SUB-BASINSSQ. MI.
RIVERMILE
ABOVEMOUTH
2-5-1
2-5-22-5-3
2-5-4
Wewoka Creek
Palo Duro CreekKiowa CreekWolf Creek
Coldwater CreekCienequilla Creek
10,313472
8,3237,605
849463
1,5022,341
781188
4,899
4,8994,883
93173
2412,6881,200
105
15,212472
13,22212,4881,780
5361,7435,0291,981
293
1,990
7347,459
5,029
82.1
611.8528.1487.7
623.0766.6
;
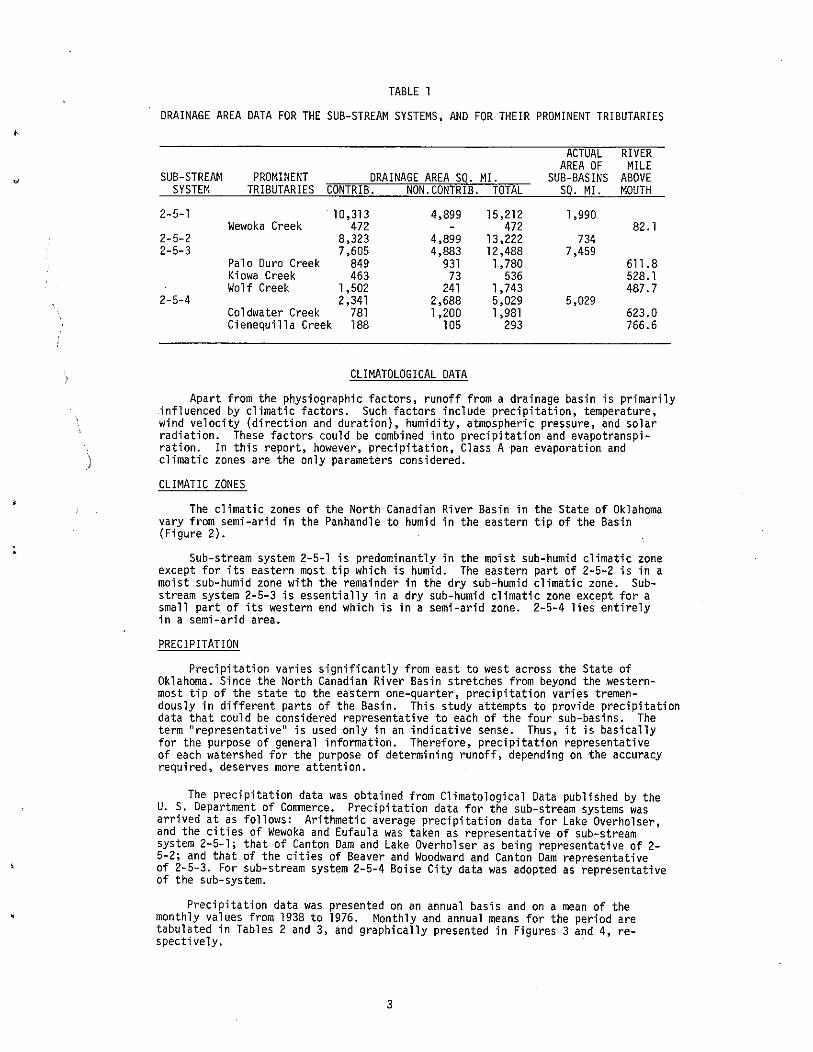
CLIMATOLOGICAL DATA
Apart from the physiographic factors, runoff from a drainage basin is primarilyinfluenced by climatic factors. Such factors include precipitation, temperature,wind velocity (direction and duration), humidity, atmospheric pressure, and solarradiation. These factors could be combined into precipitation and evapotranspiration. In this report, however, precipitation, Class A pan evaporation andclimatic zones are the only parameters considered.
CLIMATIC ZONES
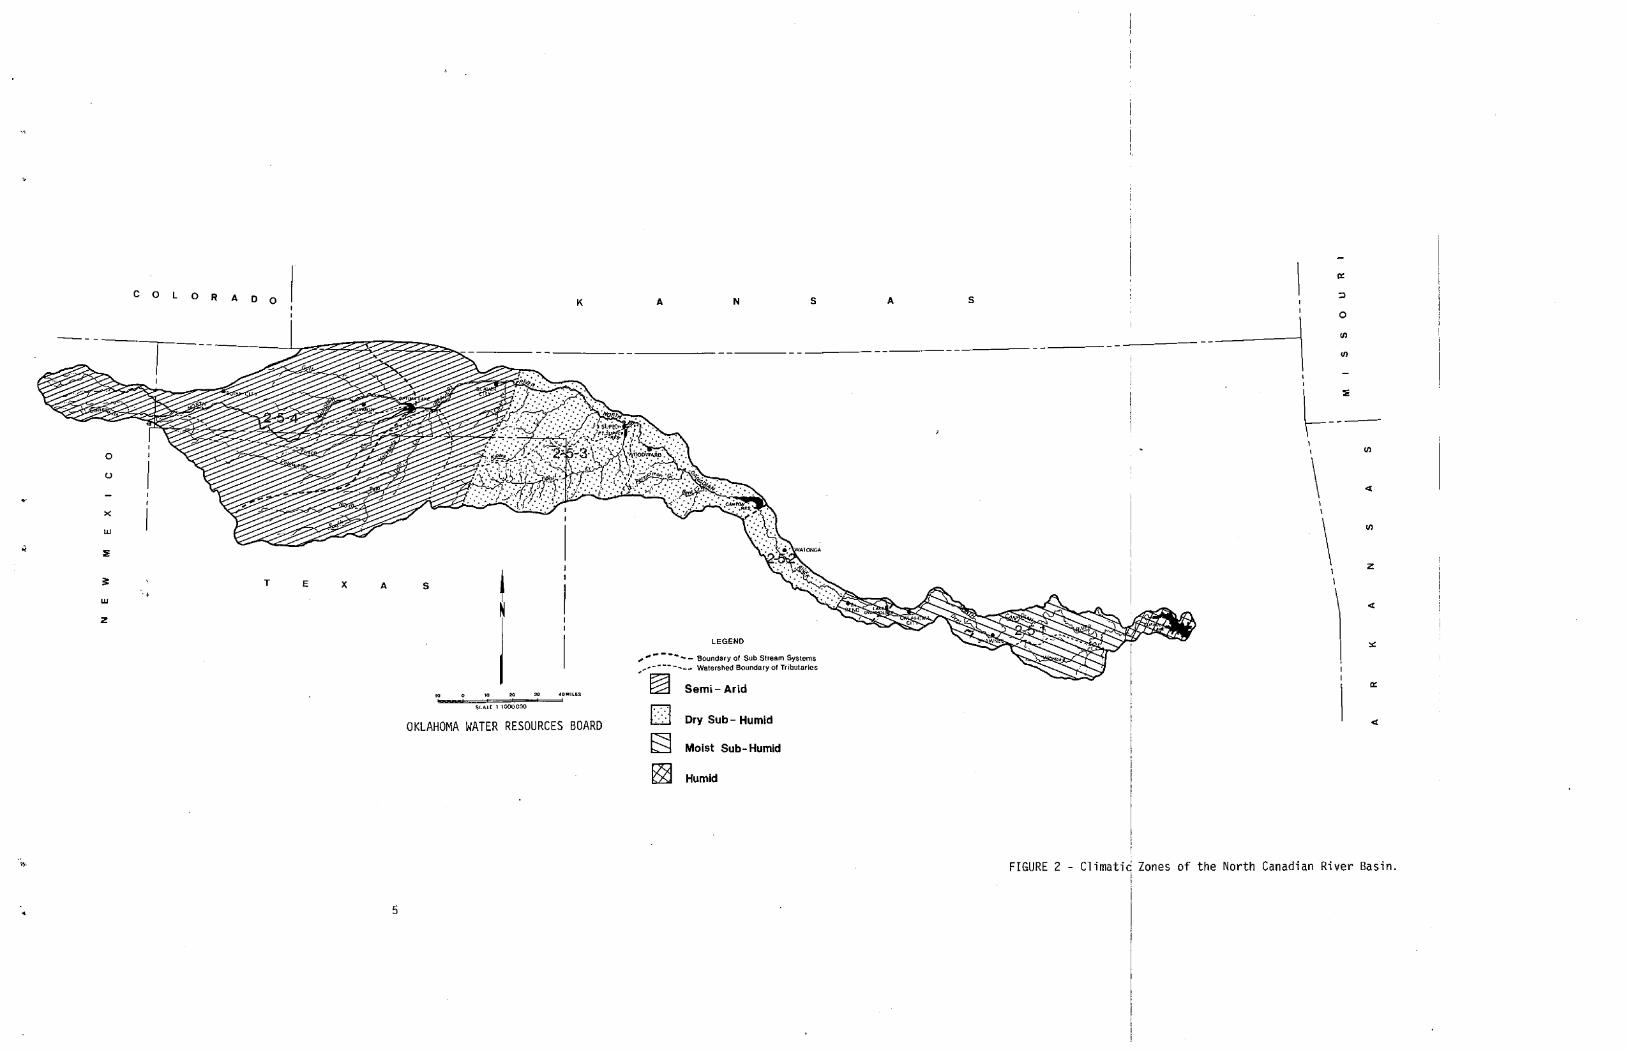
The climatic zones of the North Canadian River 8asin in the State of Oklahomavary from semi-arid in the Panhandle to humid in the eastern tip of the Basin(Figure 2).
Sub-stream system 2-5-1 is predominantly in the moist sub-humid climatic zoneexcept for its eastern most tip which is humid. The eastern part of 2-5-2 is in amoist sub-humid zone with the remainder in the dry sub-humid climatic zone. Substream system 2-5-3 is essentially in a dry sub-humid climatic zone except for asmall part of its western end which is in a semi-arid zone. 2-5-4 lies entirelyin a semi-arid area.
PRECIPITATION
Precipitation varies significantly from east to west across the State ofOklahoma. Since the North Canadian River Basin stretches from beyond the westernmost tip of the state to the eastern one-quarter, precipitation varies tremen-dously in different parts of the Basin. This study attempts to provide precipitationdata that could be considered representative to each of the four sub-basins. Theterm "representativelt is used only in an indicative sense. Thus, it is basicallyfor the purpose of general information. Therefore, precipitation representativeof each watershed for the purpose of determining runoff, depending on the accuracyrequired, deserves more attention.
The precipitation data was obtained from Climatological Data published by theU. S. Department of Commerce. Precipitation data for the sub-stream systems wasarrived at as follows: Arithmetic average precipitation data for Lake Overholser,and the cities of Wewoka and Eufaula was taken as representative of sub-streamsystem 2-5-1; that of Canton Dam and Lake Overholser as being representative of 25-2; and that of the cities of Beaver and Woodward and Canton Dam representativeof 2-5-3. For sub-stream system 2-5-4 Boise City data was adopted as representativeof the sub-system.
Precipitation data was presented on an annual basis and on a mean of themonthly values from 1938 to 1976. Monthly and annual means for the period aretabulated in Tables 2 and 3, and graphically presented in Figures 3 and 4, respectively.
3
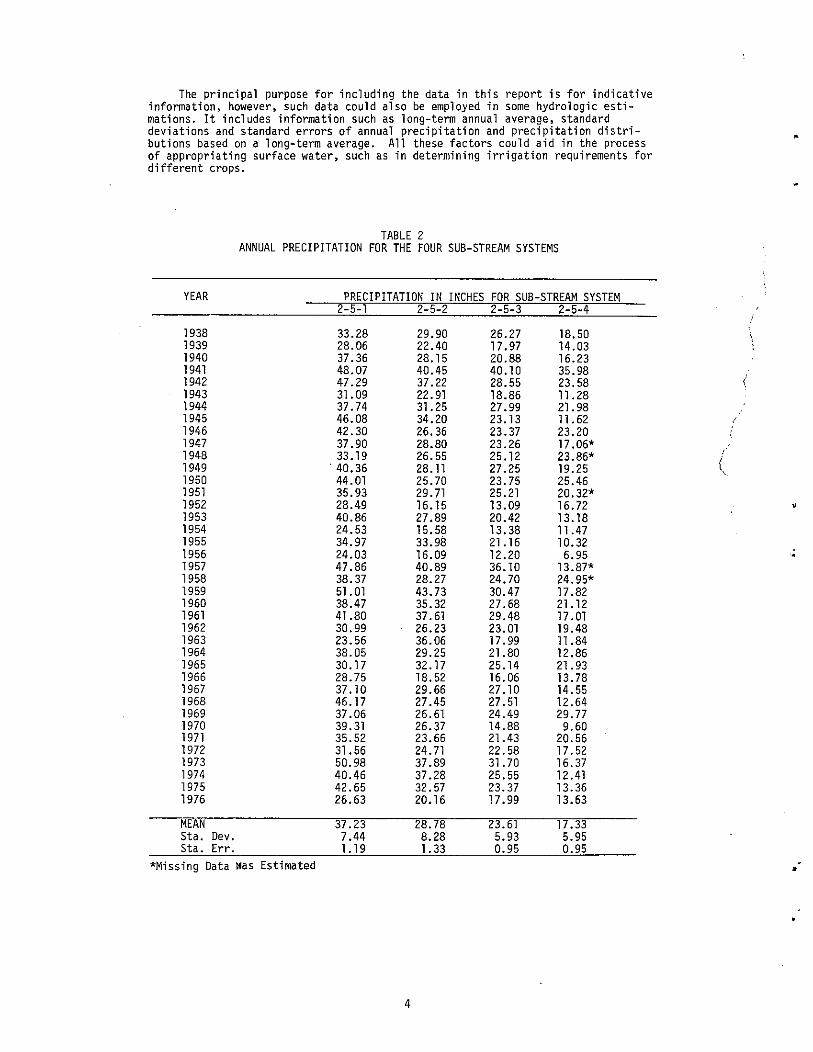
The principal purpose for including the data in this report is for indicativeinformation, however, such data could also be employed in some hydrologic estimations. It includes information such as long-term annual average, standarddeviations and standard errors of annual precipitation and precipitation distributions based on a 10n9-term average. All these factors could aid in the processof appropriating surface water, such as in determining irrigation requirements fordifferent crops.
TABLE 2ANNUAL PRECIPITATION FOR THE FOUR SUB-STREAM SYSTEMS
YEAR PRECIPITATION IN INCHES FOR SUB-STREAM SYSTEM2-5-1 2-5-2 2-5-3 2-5-4
1938 33.28 29.90 26.27 18.501939 28.06 22.40 17.97 14.031940 37.36 28.15 20.B8 16.231941 48.07 40.45 40.10 35.981942 47.29 37.22 28.55 23.581943 31.09 22.91 18.86 11.2B1944 37.74 31.25 27.99 21.981945 46.0B 34.20 23.13 11.621946 42.30 26.36 23.37 23.201947 37.90 28.BO 23.26 17.06*194B 33.19 26.55 25.12 23.86*
,1949 . 40.36 28.11 27.25 19.25 (1950 44.01 25.70 23.75 25.461951 35.93 29.71 25.21 20.32*1952 2B.49 16.15 13.09 16.721953 40.86 27.89 20.42 13.181954 24.53 15.58 13.38 11.471955 34.97 33.98 21.16 10.321956 24.03 16.09 12.20 6.95 .1957 47.86 40.B9 36.10 13.87*195B 38.37 28.27 24.70 24.95*1959 51.01 43.73 30.47 17.821960 38.47 35.32 27.68 21.121961 41.80 37.61 29.48 17.011962 30.99 26.23 23.01 19.481963 23.56 36.06 17.99 11.841964 38.05 29.25 21.80 12.861965 30.17 32.17 25.14 21.931966 28.75 18.52 16.06 13.781967 37.10 29.66 27.10 14.551968 46.17 27.45 27.51 12.641969 37.06 26.61 24.49 29.771970 39.31 26.37 14.88 9.601971 35.52 23.66 21.43 20.561972 31.56 24.71 22.58 17.521973 50.98 37.89 31. 70 16.371974 40.46 37.28 25.55 12.411975 42.65 32.57 23.37 13.361976 26.63 20.16 17.99 13.63
MEAN 37.23 28.78 23.61 17.33Sta. Oev. 7.44 8.28 5.93 5.95Sta. Err. 1.19 1.33 0.95 0.95
*Missing Data Kas Estimated •
4
OKLAHOMA WATER RESOURCES BOARD
,,; - - - - Boundary of Sub Stream Systems.......~- _ ... Watershed Boundary of Tributaries
E:::;2:I Semi-Arid
o Dry Sub - Humid
~ Moist Sub- Humid
E2j Humid
<C
<C
z
o
\\
I\
\,
\
------lsAsN
LEGEND
AK
IS<../I,l[ 1 1000,000
,.-
5AxET.,
COL 0 R ADO
ou
UJ
UJ
z
5
FIGURE 2 - Climatic Zones of the North Canadian River Basin.IiI
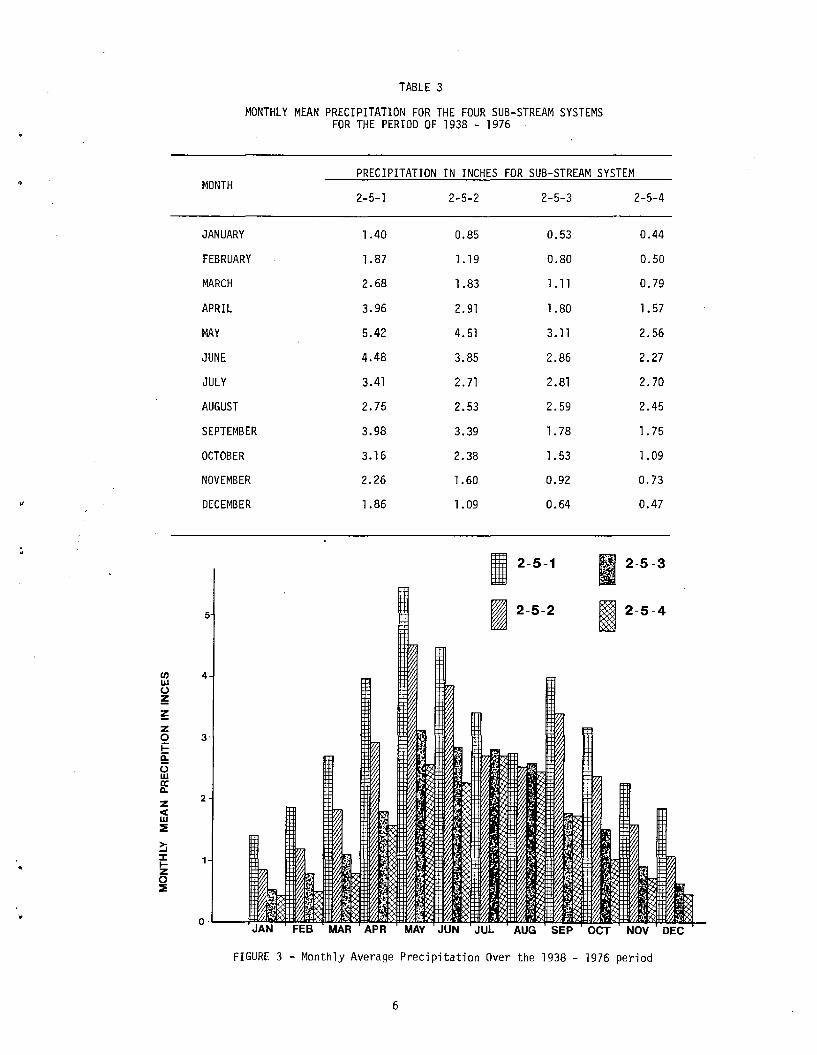
TABLE 3
MONTHLY MEAN PRECIPITATION FOR THE FOUR SUB-STREAM SYSTEMSFOR THE PERIOD OF 1938 - 1976
PRECIPITATION IN INCHES FOR SUB-STREAM SYSTEMMONTH
2,.5-1 2-5-2 2-5-3 2-5-4
JANUARY 1.40 0.85 0.53 0.44
FEBRUARY 1.87 1.19 0.80 0.50
MARCH 2.68 1.83 1.11 0.79
APRIL 3.96 2.91 1.80 1.57
MAY 5.42 4.51 3.11 2.56
JUNE 4.48 3.85 2.86 2.27
JULY 3.41 2.71 2.81 2.70
AUGUST 2.75 2.53 2.59 2.45
SEPTEMBER 3.98 3.39 1. 78 1. 75
OCTOBER 3.16 2.38 1. 53 1.09
NOVEMBER 2.26 1.60 0.92 0.73
DECEMBER 1.86 1.09 0.64 0.47
AUG SEP OCT NOV DECQ-L.-_..jI=
I 2-5-1 [I 2-5-3
5 I 2-5-2 m2-5-4
(J) 4ILl()
~
~
Z0 3i=e;()ILl
~Z
2.q;w:::E
~J:
"I-Z0:::E
FIGURE 3 - Monthly Average Precipitation Over the 1938 - 1976 period
6

2- 5-3
2-5-2
2-5-4
25
30
35
10
5
40
35
30
35
20
CJ) 15UJ;J:()
10~
~ 45
Z0 40~!::
35Q.
UUJa:: 30Q.
..J001:
25;::)ZZ001:
20
15
50
45
40
35
30
25
I i I i I i I i i ,I
,1940 1950 1960 1970
"YEAR
FIGURE 4 - Annual Precipitation for the Sub-Stream Systemsfor the Period of 1938 - 1976
; t ~;
7

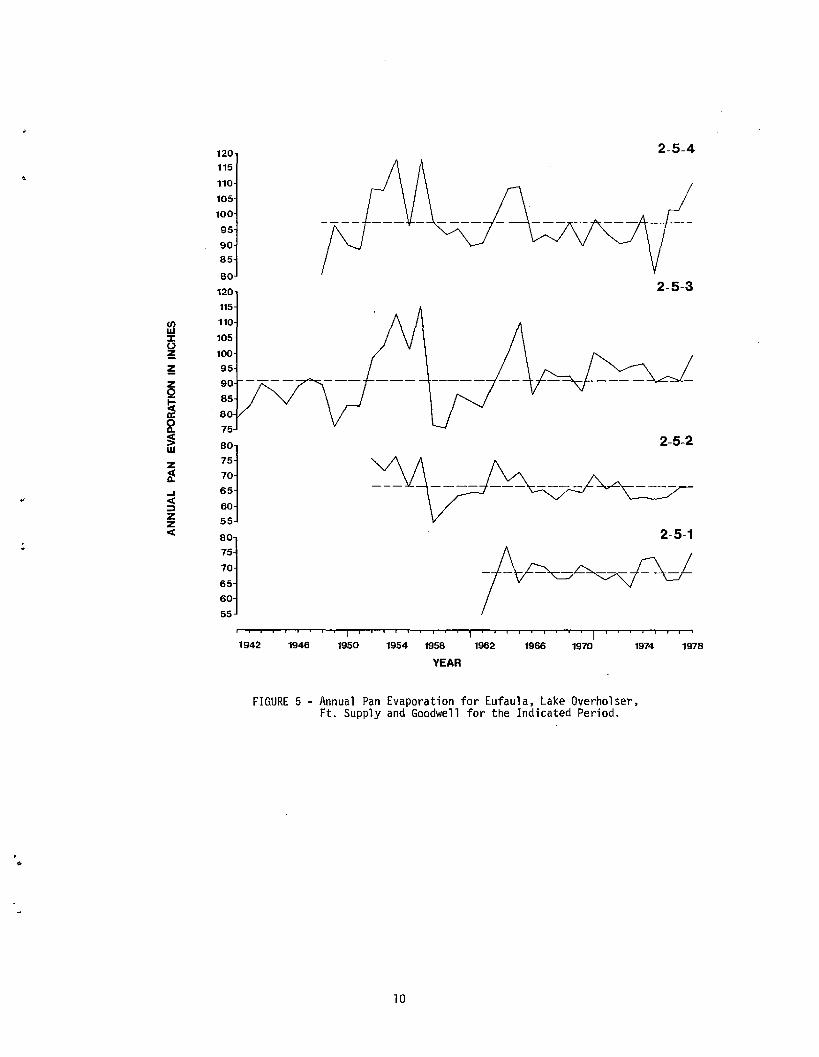
PAN EVAPORATION
Pan evaporation data presented in this report is for the cities of Eufaula andGoodwell, Lake Overholser and Ft. Supply, i.e., one in each sub-system and wasobtained from publications of Climatological Data, U.S. Department of Commerce. Thedata presented includes both annual values and mean monthly values over their respective periods. Table 4 and Figure 5 show the annual values, and Table 5 andFigure 6 show the monthly distribution of pan evaporation based on the mean of theirrespective periods.
Unlike the precipitation data, some monthly pan evaporation values were missing.The missing values were estimated in thre~ different manners. The method of estimation and the relative quantity of missing data are discussed below.
The recorded period for Eufaula ran from 1961 to 1978. The months of December,January, and February of the recorded period had, on the average, 54% of the datamissing. Data missing for other months was virtually insignificant. Nevertheless,missing values were estimated as the average value of the available data of the particular month for the recorded period, multiplied by the ratio of the annual totalof the year of which the data is missing to the annual average of the recordedperiod.
Lake Overholser's pan evaporation recorded period was from 1952 to 1978. ForDecember, January, February and March of the recorded period there was no data atall, whereas, for the combined November periods approximately 70% of the data wasmissing. The relatively small amount of missing data for each April through October,was estimated using the same method employed in the Eufaula case. For the Novembermonths the a-year average was adopted as an estimate. Missing data for January,February, March and December were estimated using Equation 1.
monthly mean pan evaporation for the record periodfor Lake Overholser.
Where
y
y
0.01 + 0.83 X ..... . Equati on 1
x = corresponding average of the monthly mean pan evaporationfor the record period for Eufaula and Ft. Supply.
The limitation of Equation 1 is the fact that it is arrived at usin9 values ofApril through November to estimate values for the rest of the months.
Table 4 indicates that Lake Overholser1s pan evaporation values are lower thanexpected. The National Weather Service was contacted and a9reed that the recordedvalues do not appear accurate, but were not aware of the reason for such apparentinaccuracy.
Ft. Supply data (1941 - 1978) was the most complete of all. Missin9 data wassubstituted by data from the City of Woodward, Canton Dam, and such data as was notcovered by these other locations was estimated as described in the case of Eufaula.
Pan evaporation for Goodwell is available for the period of 1948 to 1978.However, almost all of the values for the months of January, February, March, April,November and December were missing. For April and November, the mean of the available recorded data was adopted, and for May through October the method in theEufaula case was used. Missing data for January, February, March, and December wascomputed using Equation 2.
monthly mean pan evaporation for the record periodfor Goodwe 11 •
Where
zz
0.07 + 1.08 W.... . . Equation 2
W = corresponding monthly mean pan evaporation for therecord period for Ft. Supply.
It should be noted that limitation previously described for Equation 1 also holdsture for Equation 2.
8
PROPERTY OFOKLAHOMA WATER RESOURCES BOARD
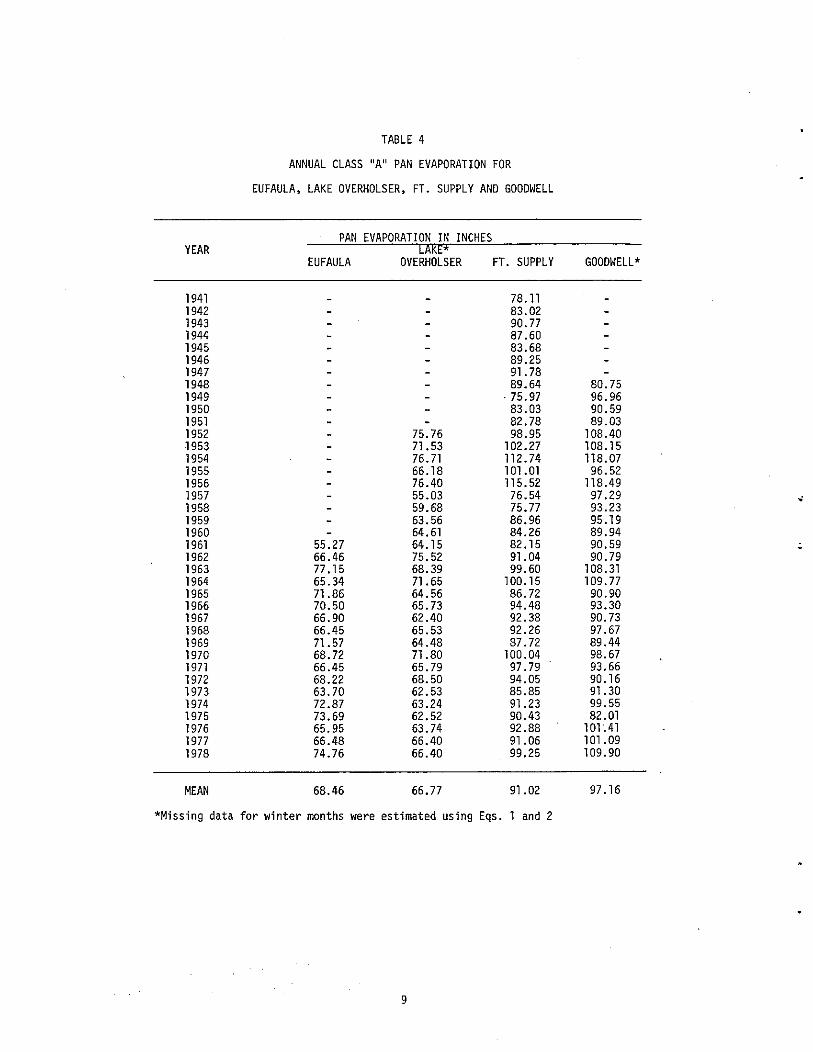
TABLE 4
ANNUAL CLASS "A" PAN EVAPORATION FOR
EUFAULA, LAKE OVERHOLSER, FT. SUPPLY AND GODDWELL
PAN EVAPORATION IN INCHESYEAR LAKE*
EUFAULA OVERHOLSER FT. SUPPLY GOODWELL*
1941 78.111942 83.021943 90.771944 87.6D1945 83.681946 89.251947 91. 781948 89.64 80.751949 ·75.97 96.961950 83.03 90.591951 82.78 89.031952 75.76 98.95 108.401953 71.53 102.27 108.151954 76.71 112.74 118.071955 66.18 1D1. 01 96.521956 76.40 115.52 118.491957 55.03 76.54 97.29 ,;
1958 59.68 75.77 93.231959 63.56 86.96 95.19196D 64.61 84.26 89.941961 55.27 64.15 82.15 90.59 ;1962 66.46 75.52 91.04 90.791963 77 .15 68.39 99.60 108.311964 65.34 71.65 100.15 109.771965 71.86 64.56 86.72 90.901966 70.50 65.73 94.48 93.301967 66.90 62.4D 92.38 90.731968 66.45 65.53 92.26 97.671969 71.57 64.48 87.72 89.441970 68.72 71.80 100.04 98.671971 66.45 65.79 97.79 93.661972 68.22 68.50 94.05 90.161973 63.70 62.53 85.85 91.301974 72.87 63.24 91.23 99.551975 73.69 62.52 90.43 82.011976 65.95 63.74 92.88 101".411977 66.48 66.40 91.06 101.091978 74.76 66.40 99.25 109.90
MEAN 68.46 66.77 91.02 97.16
*Missing data for winter months were estimated using Eqs. 1 and 2
9
2-5-4
2-5-3
2-5-1
2-5-2
1946
iIi
1950
• t i
1954
, i , i 1 i I
1958 1962
YEAR
til
1966
, i I1970
ii,
1974
i •
1978
FIGURE 5 - Annual Pan Evaporation for Eufaula, Lake Overholser,Ft. Supply and Goodwell for the Indicated Period .
..
10
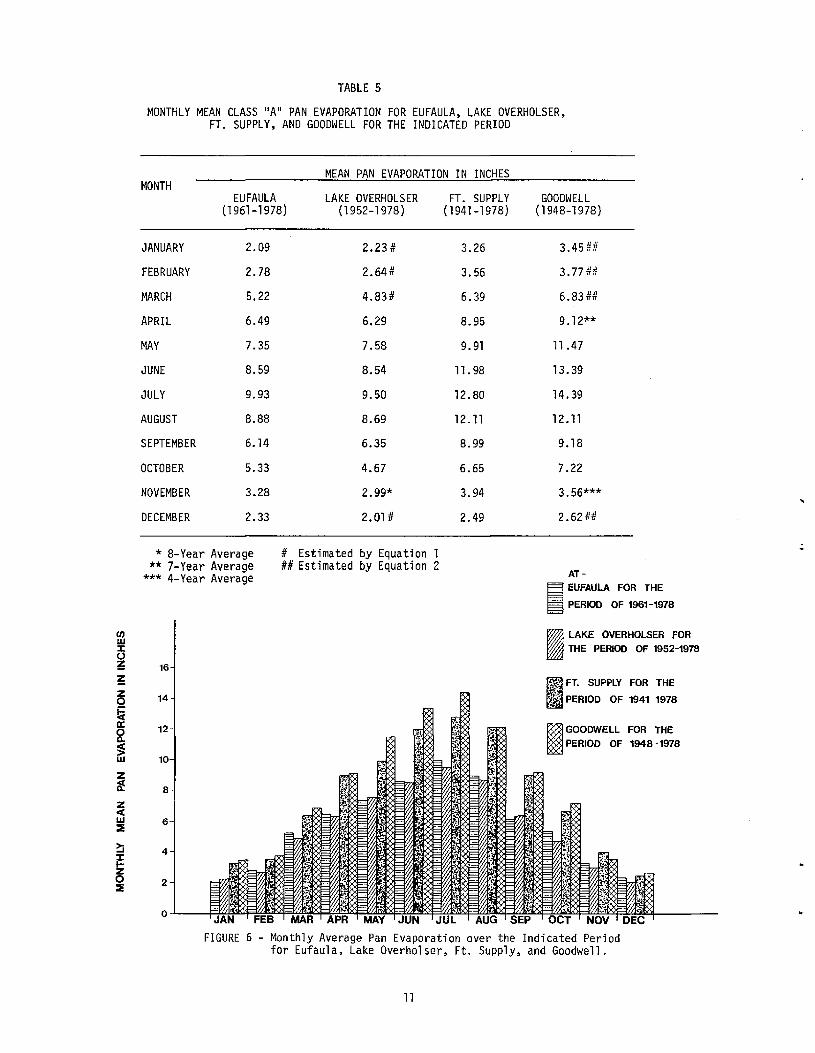
TABLE 5
MONTHLY MEAN CLASS "A" PAN EVAPORATION FOR EUFAULA, LAKE OVERHOLSER,FT. SUPPLY, AND GOODWELL FOR THE INDICATED PERIOD
MEAN PAN EVAPORATION IN INCHESMONTH
EUFAULA LAKE OVERHOLSER FT. SUPPLY(1961-1978) (1952-1978) (1941-1978)
JANUARY 2.09 2.23 # 3.26
FEBRUARY 2.78 2.64# 3.56
MARCH 5.22 4.83# 6.39
APRIL 6.49 6.29 8.95
MAY 7.35 7.58 9.91
JUNE 8.59 8.54 11. 98
JULY 9.93 9.50 12.80
AUGUST 8.88 8.69 12.11
SEPTEMBER 6.14 6.35 8.99
OCTOBER 5.33 4.67 6.65
NOVEMBER 3.28 2.99* 3.94
DECEMBER 2.33 2.01 # 2.49
* 8-Year Average # Estimated by Equation 1** 7-Year Average ## Estimated by Equation 2
*** 4-Year Average
GOODWELL(1948-1978)
3.45 ##
3.77##
6.83##
9.12**
11.47
13.39
14.39
12.11
9.18
7.22
3.56***
2.62 ##
AT-
I EUFAULA FOR THE
PERIOD OF 1961-1978
enUl::t:0~ 16
~Z 140
filr 1200.
~Ul 10
Z~ 8
Z<Cw 6:::E
~ 4~...z0 2:::E
0
I lAKE OVERHOLSER FOR
THE PERIOD OF 1952-1978
I~: FT. SUPPLY FOR THE
i;<;',' PERIOD OF 1941~1978
~ GOODWEll FOR THE
~ PERIOD OF 1948 -1978
FEB MAY
- Monthly Average Pan Evaporation over the Indicated Periodfor Eufaula, Lake Overholser, Ft. Supply, and Goodwell.
11
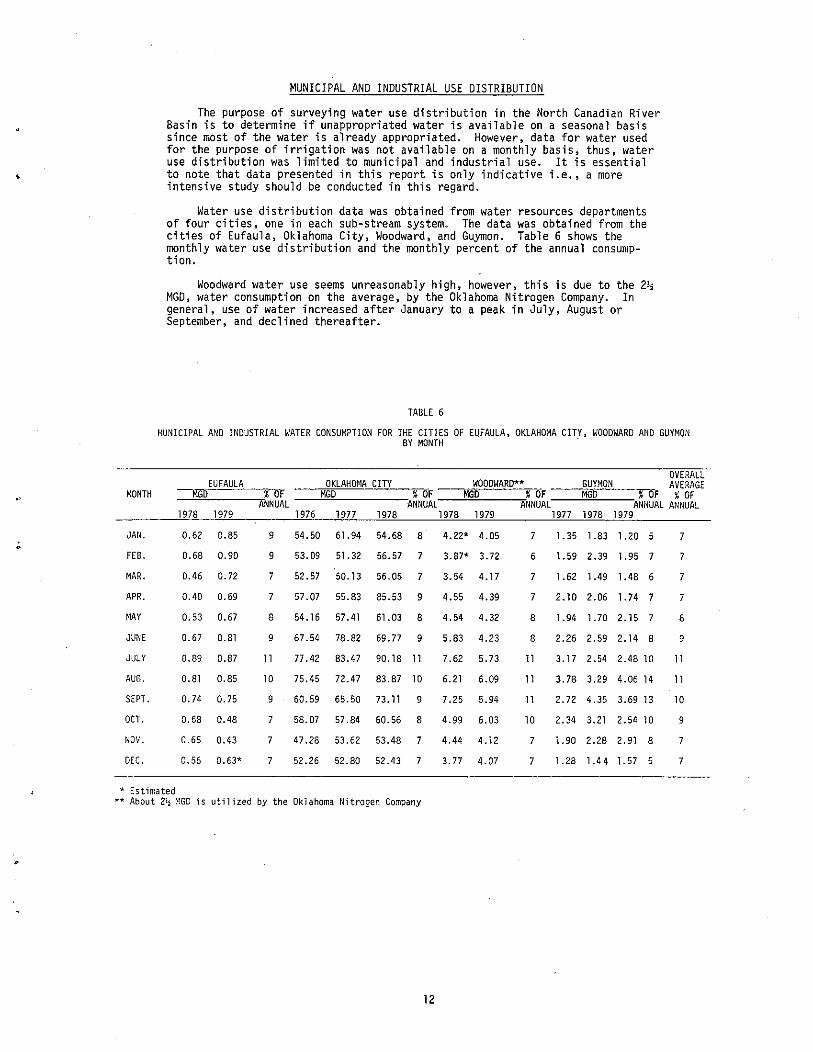
MUNICIPAL AND INDUSTRIAL USE DISTRIBUTION
The purpose of surveying water use distribution in the North Canadian RiverBasin is to determine if unappropriated water is available on a seasonal basissince most of the water is already appropriated. However, data for water usedfor the purpose of irrigation was not available on a monthly basis, thus, wateruse distribution was limited to municipal and industrial use. It is essentialto note that data presented in this report is only indicative i.e .• a moreintensive study should be conducted in this regard.
Water use distribution data was obtained from water resources departmentsof four cities, one in each sub-stream system. The data was obtained from thecities of Eufaula, Oklahoma City, Woodward, and Guymon. Table 6 shows themonthly water use distribution and the monthly percent of the annual consumption.
Woodward water use seems unreasonably high, however, this is due to the 2~
MGD, water consumption on the average, by the Oklahoma Nitrogen Company. Ingeneral, use of water increased after January to a peak in July, August orSeptember, and declined thereafter.
TABLE 6
MUNICIPAL AND INDUSTRIAL WATER CONSUMPTION FOR THE CITIES OF EUFAULA. OKLAHOMA CITY. WOODWARD AND GUYMONBY MONTH
OVERALLEUFAULA OKLAHOMA CITY WOODWARD** GUYMON AVERAGE
MONTH MGO % OF MGO % OF MGO % OF MGD % OF %OFANNUAL ·ANNUAL ANNUAL ANNUAL ANNUAL
1978 1979 1976 1977 1978 1978 1979 1977 197B 1979
JAN. 0.62 0.85 9 54.50 61. 94 54.68 8 4.22* 4.05 7 1.35 1.83 1.20 5 7~
FEB. 0.68 0.90 9 53.09 51.32 56.57 7 3.87* 3.72 6 1.59 2.39 1.95 7
MAR. 0.46 0.72 7 52.57 50.13 56.05 7 3.54 4.17 7 1.62 1.49 1.48 6 7
APR. 0.40 0.69 7 57.07 55.83 85.53 9 4.55 4.39 7 2.10 2.06 1. 74 7 7
~lAY 0.53 0.67 8 54.16 57.41 61.03 8 4.54 4.32 8 1.94 1.70 2.15 7 I;
JUNE 0.67 0.81 9 67.54 78.82 69.77 9 5.83 4.23 8 2.26 2.59 2.14 8 9
JULY 0.89 0.87 11 77.42 83.47 90.18 11 7.62 5.73 11 3.17 2.54 2.48 10 11
AUG. 0.81 0.85 10 75.45 72.47 83.87 10 6.21 6.09 11 3.78 3.29 4.06 14 11
SEPT. 0.74 0.75 9 60.59 65.50 73.11 9 7.25 5.94 11 2.72 4.35 3.69 13 10
OCT. 0.G8 0.48 7 58.07 57.84 60.56 8 4.99 6.03 10 2.34 3.21 2.54 10 9
NOV. 0.65 0.43 7 47.28 53.62 53.48 7 4.44 4.12 7 1.90 2.28 2.91 8 7
OEC. 0.56 0.63* 7 52.26 52.80 52.43 7 3.77 4.07 7 1.28 1.44 1.57 5 7
* Estimated** About 212 r·1GD is utilized by the Oklahoma Nitrogen Company
•
12
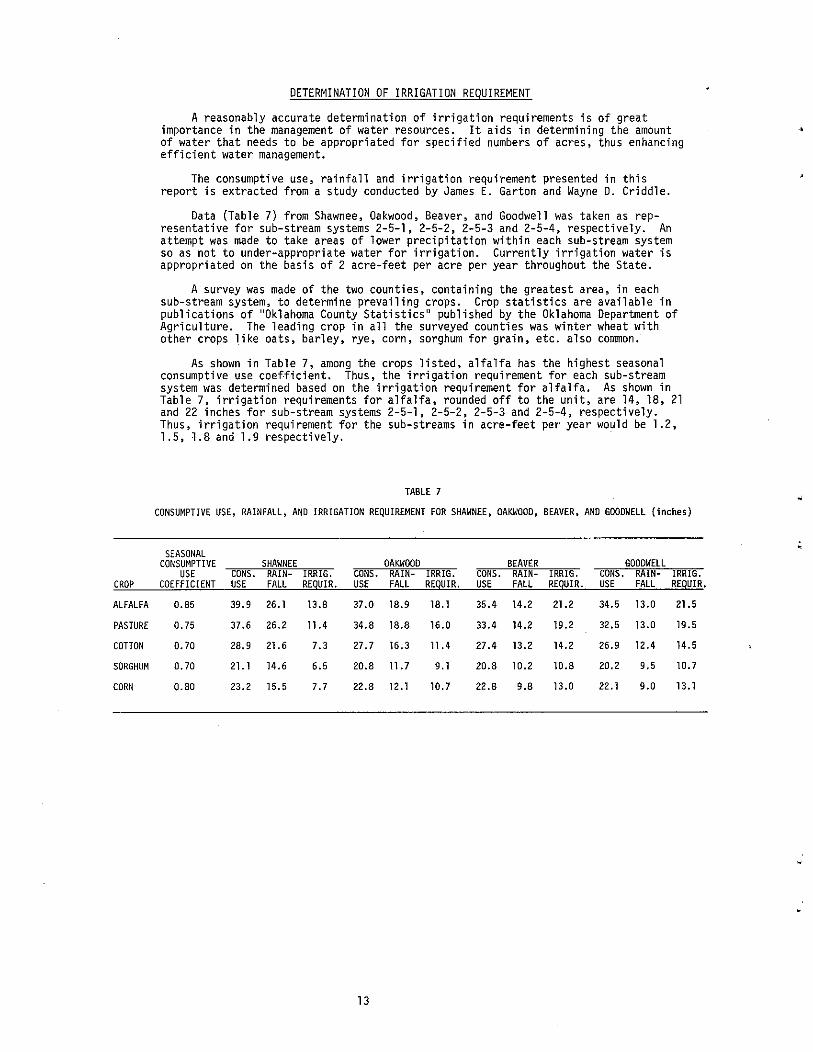
DETERMINATION OF IRRIGATION REQUIREMENT
A reasonably accurate determination of irrigation requirements ;s of greatimportance in the management of water resources. It aids in determining the amountof water that needs to be appropriated for specified numbers of acres~ thus enhancingefficient water management.
The consumptive use, rainfall and irrigation requirement presented in thisreport is extracted from a study conducted by James E. Garton and Wayne D. Criddle.
Data (Table 7) from Shawnee, Oakwood, Beaver, and Goodwell was taken as representative for sub-stream systems 2-5-1, 2-5-2, 2-5-3 and 2-5-4, respectively. Anattempt was made to take areas of lower precipitation within each sub-stream systemso as not to under-appropriate water for irrigation. Currently irrigation water isappropriated on the basis of 2 acre-feet per acre per year throughout the State.
A survey was made of the two counties, containing the greatest area, in eachsub-stream system, to determine prevailing crops. Crop statistics are available inpublications of "Oklahoma County Statistics" published by the Oklahoma Department ofAgriculture. The leading crop in all the surveyed counties was winter wheat withother crops ~ike oats, barley, rye, corn, sorghum for grain, etc. also common.
As shown in Table 7, among the crops listed, alfalfa has the highest seasonalconsumptive use coefficient. Thus, the irrigation requirement for each sub-streamsystem was determined based on the irrigation requirement for alfalfa. As shown inTable 7, irrigation requirements for alfalfa, rounded off to the unit, are 14, 18, 21and 22 inches for sub-stream systems 2-5-1, 2-5-2, 2-5-3 and 2-5-4, respectively.Thus, irrigation requirement for the sub-streams in acre-feet per' year would be 1.2,1.5, 1.8 and 1.9 respectively.
•
TABLE 7
CONSUMPTIVE USE, RAINFALL, AND IRRIGATION REQUIREMENT FOR SHAWNEE, OAKWOOD, BEAVER, AND GOODWELL (inches)
;SEASONAL
CONSUMPTIVE SHAWNEE OAKWOOD BEAVER GOODWELLUSE CONS. RAIN- IRRIG. CONS. RAIN- IRRIG. CONS. RAIN- IRRIG. CONS. RAIN- IRRIG.
CROP COEFFICIENT USE FALL REQUIR. USE FALL REQUIR. USE FALL REQUIR. USE FALL REQUIR.
ALFALFA 0.85 39.9 26.1 13.8 37.0 18.9 18.1 35.4 14.2 21.2 34.5 13.0 21.5
PASTURE 0.75 37.6 26.2 11.4 34.8 18.8 16.0 33.4 14.2 19.2 32.5 13.0 19.5
COTTON 0.70 28.9 21.6 7.3 27.7 16.3 11.4 27.4 13.2 14.2 26.9 12.4 14.5
SORGHUM 0.70 21.1 14.6 6.5 20.8 11.7 9.1 20.8 10.2 10.8 20.2 9.5 10.7
CORN 0.80 23.2 15.5 7.7 22.8 12.1 10.7 22.8 9.8 13.0 22.1 9.0 13.1
13
STREAM WATER FLOW
For surface water resources management, accurate streamflow measurements for"each sub-stream system are of great importance. Streamflow data presented ;n thisreport is primarily measured by the U. S. Geological Survey, however, to determineflow from each sub-stream system it was necessary to estimate flow for parts of thesub-stream systems. The detailed procedure employed to determine streamflow foreach sub-stream system is described below.
Tables 8 and g show the annual and the monthly distribution of streamflow foreach sub-stream systems. The streamflows are shown graphically in Figures 7 and8.
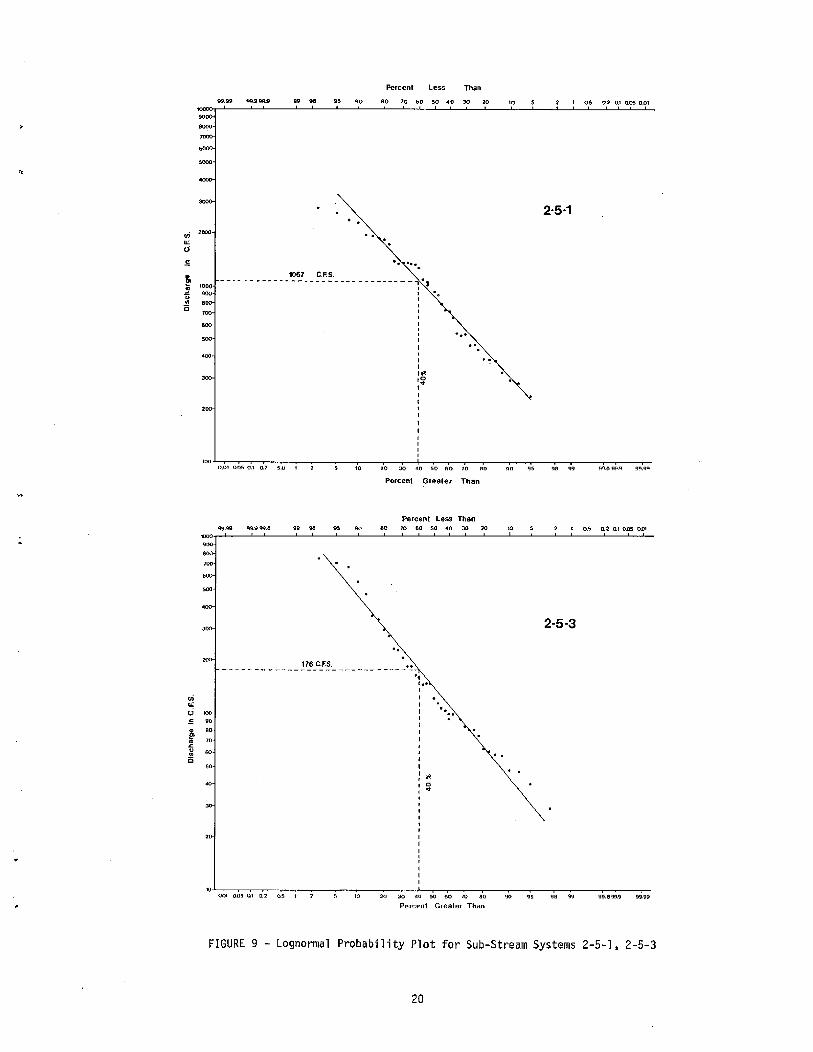
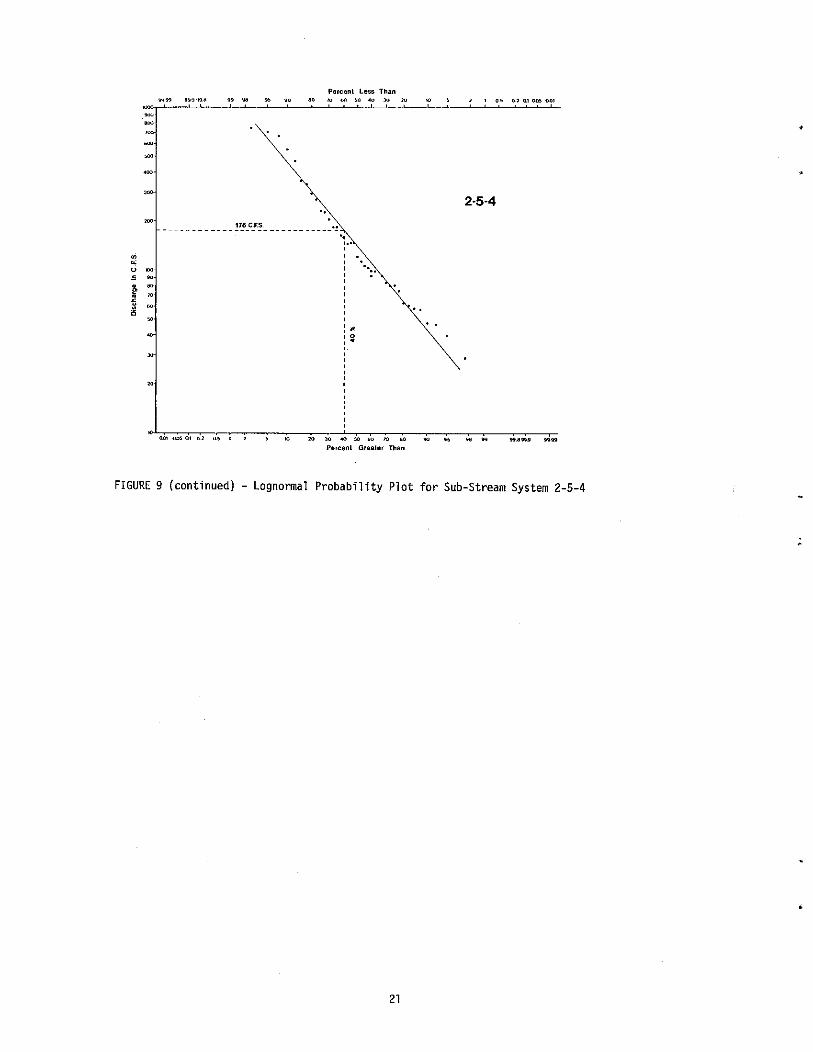
Plotting positions were computed for sub-stream systems of 2-5-1,2-5-3 and 25-4 using Equation 3 and lognormal probability plots are shown in Figure 8. Thiswas not done for sub-stream system 2-5-2 because there was not enough data toarrive at a definite pattern.
Where
P (X x)100 = (M) 100/ (n+l) ••..
P(X x) probability that flow would be equal toor greater than x
Equation 3
M rank, M= 1 for the largest M=n for the smallest
n = number of observations
A primary purpose for the Board's conducting this study was to determine howmuch stream water is available for appropriation in each sub-stream system. Asunappropriated water gets scarce, it appears inevitable that water will have to beappropriated on a seasonal basis, or not at all. Thus, the availability of monthlywater use, precipitation, evaporation and streamflow distribution could facilitatethe determination of water available on a seasonal basis. However, the effect ofreservoir regulation on the monthly distribtuionof streamflow and lack of monthlyirrigation use data presents an obstacle in determining available water on a seasonalbasis. For instance, water is released from Canton Reservoir to be diverted downstream by Oklahoma City, thus greatly altering the natural distribution for subbasins 2-5-2 and 2-5-3.
The Rules and Regulations of the Oklahoma Water Resources Board state that "ifit is determined that unappropriated water is available less than thirty-five (35)percent of the time, the Board may, in its discretion, issue a seasonal permitvalid only during certain months of the year ll
• Thus, if the amount applied for isavailable less than 35% of the time it is the Board's policy not to issue regularpermits, but only seasonal ones. Conversely, the Board will issue regular permitsif the amount applied for is available 35% of the time or more.
SUB-STREAM SYSTEM 2-5-1
. Streamflow from sub-stream system 2-5-1 was measured at the U.S. GeologicalSurvey Gage #07242000 at the North Canadian River near Wetumka which takes intoaccount 94% of the total drainage area and 54% of the isolated drainage area ofsub-stream system 2-5-1. Streamflow contributed by the downstream area (922 mi 2)from U.S.G.S. Gage #07242000 was estimated proportionately from the streamflow ofOeep Fork River near Beggs, Oklahoma, as measured by U.S.G.S. Gage #07243500. Thevalues were then added to that measured near Wetumka to represent inflow from theNorth Canadian River into Eufaula Lake. The annual average for the recorded period(1938-1976) is 1,067 cfs with a standard deviation of 709 cfs. The maximum yearlymean i5'2,775 cfs and the minimum is 89 Cf5.
SUB-STREAM SYSTEM 2-5-2
Streamflow designated as being from 2-5-2 is the flow that leaves the sub-streamsystem. It is measured by U.S.G.S. Gage #07241000 below Lake Overholser, nearOklahoma City. The recorded period ranged from 1953 to 1977 with data partiallymissing for the years of 1968, 1969, 1972 and 1973. The annual average flow for 21years of the recorded period is 105 cfs with a standard deviation of 131 cfs. Themaximum yearly mean is 498 cfs and the minimum is 0.25 cfs.
14
SUB-STREAM SYSTEM 2-5-3
Streamflow presented for 2-5-3 is the flow that leaves the sub-stream systemmeasured at U.S.G.S. Gage #07239000 at the North Canadian River just below the CantonDam. Annual average flow for the recorded period (1938-1976) is 198 cfs withstandard deviation of 189 cfs. Annual average flow since the com~letion of CantonDam has been 176 cfs (1949 - 1976). Maximum and minimum yearly mean flows for therecorded period of 1949-l976 are 666 and 29 cfs. Here, it should be noted 80,000acre-feet per year of water is released from Canton for downstream diversion byOklahoma City.
SUB-STREAM SYSTEM 2-5-4
Sub-stream system 2-5-4 is the part of the North Canadian River 8asin upstreamfrom Optima Dam. The streamflow presented in this report is the inflow to OptimaReservoir and not the flow that leaves the dam. The main streams are the NorthCanadian River and Coldwater Creek. Flow in the North Canadian River was primarilydetermined from the records from U.S.G.S. Gage #07232500 near Guymon, Oklahoma. Thedrainage area that theoretically contributes to the point where the abovereferenced gage is located comprises 43% of the sub-stream system. Coldwater Creekwatershed comprises 39%, and the remaining 18% is the drainage area between theU.S.G.S. Gage #07232500 and Optima Dam (exclusive of the area that drains to Coldwater Creek). The latter 18% of the drainage area contributes approximately 16% ofthe average annual flow over the recorded period (1938-1976) and is estimated proportionally from the flow of Coldwater Creek watershed.
Flow from Coldwater Creek watershed was measured at U.S.G.S. Gage #07371000 nearHardesty, Oklahoma, from 1940 to October 1964. The rest of the study period wasestimated from straight line equations developed for each separate month ~y treatingthe measured flow from Coldwater Creek watershed as a dependent variable, with theflow from the North Canadian River measured at U.S.G.S. Gage #07232500 as the independenvariable. Inflow to Optima from the Coldwater Creek watershed comprises approxi-mately 31% of the average annual flow over the recorded period.
Total annual average inflow into Optima Reservoir for the recorded period is 48cfs with a standard deviation of 44 cfs. The maximum yearly mean is 168 cfs and theminimum is 8 cfs.
15
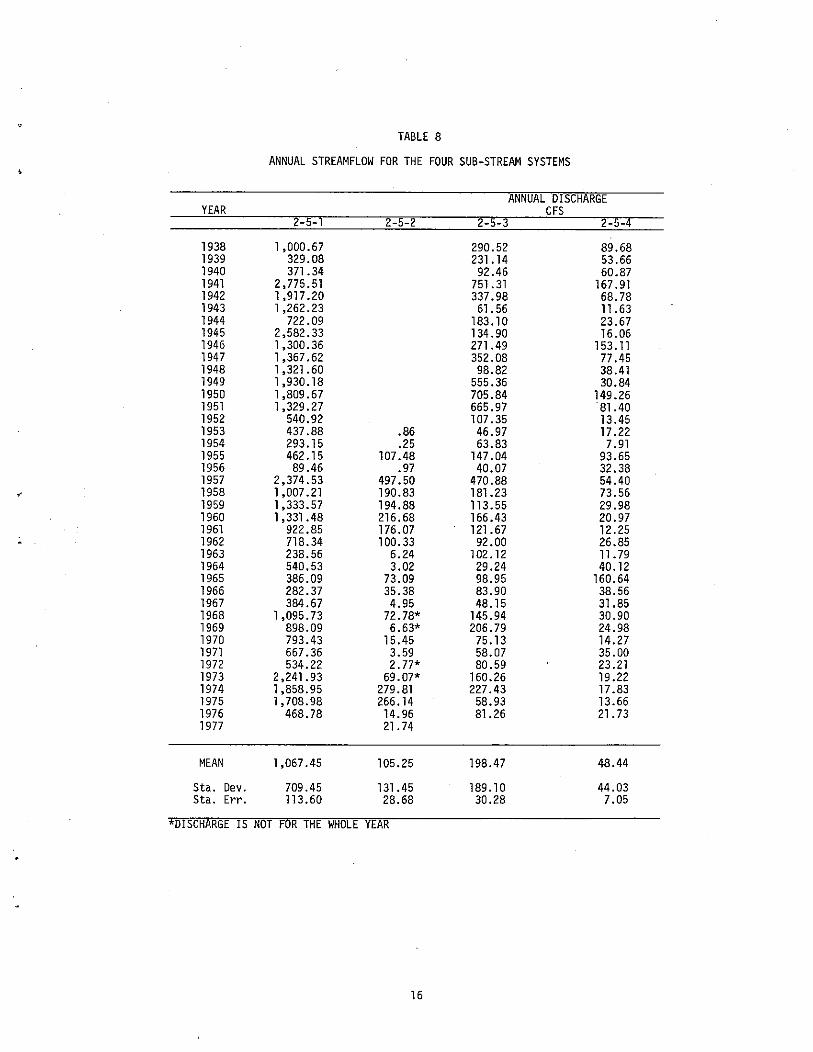
TABLE 8
ANNUAL STREAMFLOW FOR THE FOUR SUB-STREAM SYSTEMS
ANNUAL DISCHARGEYEAR CFS
2-5-1 2-5-2 2-5-3 2-5-4
193B 1,000.67 290.52 89.681939 329.08 231.14 53.661940 371.34 92.46 60.871941 2,775.51 751.31 167.911942 1,917.20 337.98 68.781943 1,262.23 61.56 11.631944 722.09 183.10 23.671945 2,582.33 134.90 16.061946 1,300.36 271.49 153.111947 1,367.62 352.08 77.451948 1,321.60 98.82 38.411949 1,930.18 555.36 30.841950 1,809.67 705.84 149.261951 1,329.27 665.97 81.401952 540.92 107.35 13.451953 437.88 .86 46.97 17.221954 293.15 .25 63.83 7.911955 462.15 107.48 147.04 93.651956 89.46 .97 40.07 32.381957 2,374.53 497.50 470.88 54.401958 1,007.21 190.83 181.23 73.561959 1,333.57 194.88 113.55 29.981960 1,331.48 216.68 166.43 20.971961 922.85 176.07 121.67 12.251962 718.34 100.33 92.00 26.851963 238.56 6.24 102.12 11. 791964 540.53 3.02 29.24 40.121965 386.09 73.09 98.95 160.641966 282.37 35.38 83.90 38.561967 384.67 4.95 48.15 31.851968 1,095.73 72.78* 145.94 30.901969 898.09 6.63* 206.79 24.981970 793.43 15.45 75.13 14.271971 667.36 3.59 58.07 35.001972 534.22 2.77* 80.59 23.211973 2,241.93 69.07* 160.26 19.221974 1,858.95 279.81 227.43 17.831975 1,708.98 266.14 58.93 13.661976 468.78 14.96 81.26 21.731977 21. 74
MEAN 1,067.45 105.25 198.47 48.44
Sta. Dev. 709.45 131.45 189.10 44.03Sta. Err. 113.60 28.68 30.28 7.05
*DISCHARGE IS NOT FOR THE WHOLE YEAR
16
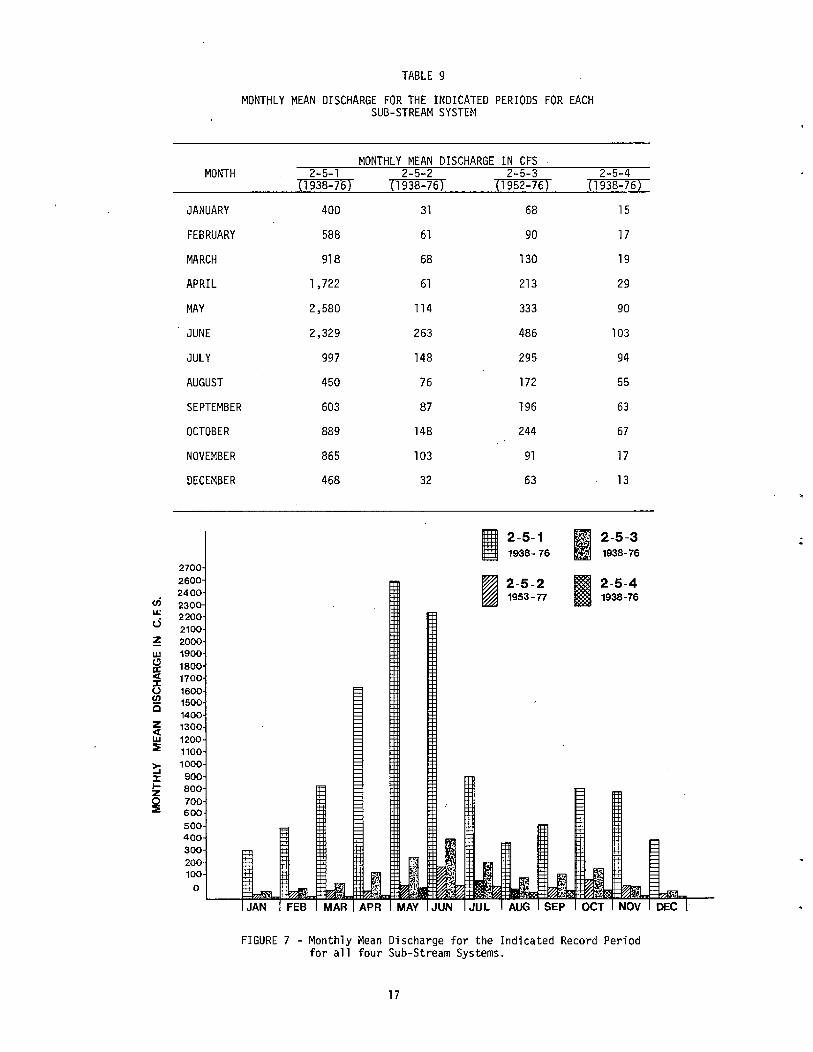
TABLE 9
MONTHLY MEAN DISCHARGE FOR THE INDICATED PERIODS FOR EACHSUB-STREAM SYSTEM
MONTHLY MEAN DISCHARGE IN CFSMONTH 2-5-1 2-5-2 2-5-3 2-5-4
(1938-76) (1938-76) (1952-76 ) (1938-76)
JANUARY 400 31 68 15
FEBRUARY 588 61 90 17
MARCH 918 68 130 19
APRIL 1.722 61 213 29
MAY 2.580 114 333 90
JUNE 2.329 263 486 103
JULY 997 148 295 94
AUGUST 450 76 172 55
SEPTEMBER 603 87 196 63
OCTOBER 889 148 244 67
NOVEMBER 865 103 91 17
DECEMBER 468 32 63 13
270026002400
<Ii 230L&: 2200U 2100~ 2000UJ 1900t:l 1800~ 1700:J:() 1600!Il 15002i
1400Z 1300octUJ 1200~ 1100
~1000
:J: 900I- 800Z
~ 700600500400300200100
0
JAN
FIGURE 7
I 2-5-1 I 2-5-3 .1938-76 1938-76
~2-5-2
~2-5-4
1953~77 1938-76
NOV DEC
- Monthly Mean Discharge for the Indicated Record Periodfor all four Sub-Stream Systems.
17

2750 2-5-1
2500
U) 2250u.:(,) 2000
Z
W 1750Cla:oct:I: 1500()
~C 1250Zol ------ ---- ----W 1000::E
~ 750a:octw> 500
250
0
1940 1950 1960 1970
YEAR".
. 500
2-5-2enu.:0 400
~
WCla:ol 300:I:(,)U)
i5zoct 200w:::E
~a:octw
100------.-
>
1960 1970
YEAR
FIGURE 8 - Yearly Mean Discharge for Sub-Stream Systems 2-5-1. 2-5-2
18

700 2-5-3
en 600u:e,j
Z500
u.ICIa:<:r: 4000en0z
300<UJ~
~ 200a:<w>-
100
0
1940 1950 1960 1970
YEAR
200 2-5-4
180
u:i 160u:0
140~
u.I120
~:r:~ 100i5z 80<UJ~
60~a:< 40UJ>-
20
01940 1950 1960 1970
YEAR
FIGURE 8 - (continued) Yearly Mean Discharge for Sub-Stream Systems 2-5-3. 2-5-4
19
Pe,cent ~ess Than
99 98 95 90' an 10 tiD 50 "0 30 20 '0 1 o-S 02 QJ Q.OS. 0.01
2·5-1
... Ii•••
'..,; 2000
'"US
•'";;; '000
1i 900.. 800C
700
600
"'"<00
'00
1067 C,F.S,------ .. - ... -- ... _------------------- -.,, '.,,,,,,,,,,,,,..,0,",
II,1I,,,,
'.'
0,01 m)~ 0.1 0.1 5.0 1 10 ;;'0 ~ 40 SO 60 10 so qO 95
Percent Greater Than
99.99IDOll
9'10
"'"100
600
SOO
000
99 .. 9!i 90
Percent Less Thanan 70 60 50 40 30 JO 10 0.5 0.2 0., 0.Q5 0.01
2·5-3
..
'.I ••,,,I ••••,,,,I,,I
) ..,0,",I,,,,,,,,,,,,
'.176 C,F.S, ..
-~--~----~--~-------------~-~-
<Ii..:u.!:
•e' 70~~ ..C 50..
IO,L",,"--,-o~n=-'-='o=-,-U·2~~~--,--~-~~-~'o--'~0-~~50~S~0-~"':--0·0-~90:c-~.,-----:9':.-:!:.9:--~99:-:,.:-:"':-.:----::.7.9::-.Percent Greater Than
FIGURE 9 - Lognormal Probability Plot for Sub-Stream Systems 2-5-1.2-5-3
20
Pelcenl less Than"",'<9 011.. '""a .9... '" bl' ~Il Oil ]11.... 10 , 0.5 0.' Q' Qffi QQ':::',::;::._:;:::;::__.i:--"-_--''----''-'------''----'_~''_~~~_"__~~~_~~~_~~~~_
".
2·5·4..__ _______ !7~5!~ .!
•
•"0 ~, 00
f '"ro~
00
.,'..,,,I ••••,,,,,,,,:.:~
.L="",=c.70,,-,oC,,,C,,,-,,...-.,--,,...-"00,,",C,c:,,l.:-oooCCwC.-rocCw"""-C;-"..CC',C.'wCC-Cw".O.~=,-~w"w=Percenl Grealer Than
FIGURE g (continued) - Lognormal Probability Plot for Sub-Stream System 2-5-4
21

"
•
APPROPRIATED WATERS
Table 10 shows the total amount of water which has been appropriated forthe categories of 1) irrigation, 2) municipal and industrial and 3) recreation,fish and wildlife for each sub-stream system. The amount under irrigation alsoincludes water rights that have a combined purpose of recreation and irrigation.
·Appropriated water for the entire North Canadian River Basin allocatedfor the purposes of irrigation is 14.7%, municipal and industrial 84.7%, and0.6% for recreation, fish and wildlife. Over 62% of the total appropriatedwater is from sub-stream system 2-5-1 and 33% is from sub-stream system 2-5-2,leaving 5% from the other two sub-stream systems combined. The values in Table10 were prepared after a recent (1979) reduction or cancellation of unused waterrights, which should make them reasonably representative of actual present use.
TABLE 10
APPROPRIATED WATER FROM EACH SUB-STREAM SYSTEM
SUB-STREAM APPROPRIATED ACRE-FEET OF WATERSYSTEM MUNICIPAL & RECREATION, FISH TOTAL
IRRIGATION INDUSTRIAL & WILDLIFE
2-5-1 29,972 128,215 396 158,583
2-5-2 3,377 80,000 4 83,381
2-5-3 3,209.2 7,051 1,070 11,330.2
2-5-4 723 0 0 723
TOTAL 37,281.2 215,266 1,470 254,017.2
22
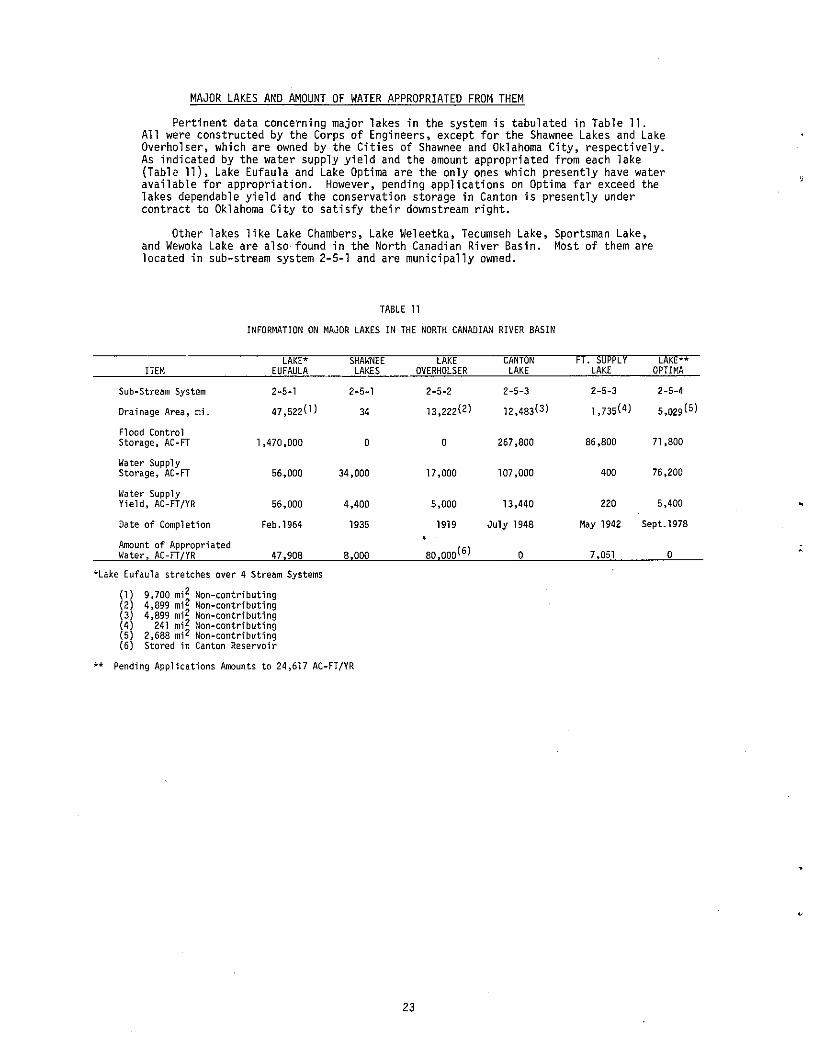
MAJOR LAKES ANO AMOUNT OF WATER APPROPRIATEO FROM THEM
Pertinent data concerning major lakes in the system is tabulated in Table 11.All were constructed by the Corps of Engineers, except for the Shawnee Lakes and LakeOverholser, which are owned by the Cities of Shawnee and Oklahoma City, respectively.As indicated by the water supply yield and the amount appropriated from each lake(Tabla 11), Lake Eufaula and Lake Optima are the only ones which presently have wateravailable for appropriation. However, pending applications on Optima far exceed thelakes dependable yield and the conservation storage in Canton is presently undercontract to Oklahoma City to satisfy their downstream right.
Other lakes like Lake Chambers, Lake Weleetka, Tecumseh Lake, Sportsman Lake,and Wewoka Lake are also· found in the North Canadian River Basin. Most of them arelocated in sub-stream system 2-5-1 and are municipally owned.
TABLE 11
INFORMATION ON MAJOR LAKES IN THE NORTH CANAOIAN RIVER BASIN
lAKE* SHAWNEE LAKE CANTONITEM EUFAULA LAKES OVERHOLSER LAKE
Sub-Stream System 2-S-1 2-5-1 2-5-2 2-5-3
Drainage Area. mi. 47,522(1) 34 13,222(2) 12,4B3(3)
Flood ControlStorage, AC-FT 1,470.000 0 0 267,800
Water SupplyStorage, AC-FT 56,000 34,000 17,000 107,000
Water SupplyYield, AC-FT/YR 56,000 4,400 5,000 13,440
Date of Completion Feb.1964 1935 1919 July 1948
Amount of Appropriated80,000(6)Water, AC-FT/YR 47,908 8,000 0
*Lake Eufaula stretches over 4 Stream Systems
(1) 9,700 m;2 Non-contributing(2) 4,899 mi 2 Non-contributing(3) 4,899 mi 2 Non-contributing(4) 241 mi 2 Non-contributing(5) 2,688 mi 2 Non-contributing(6) Stored in Canton Reservoir
** Pending Applications Amounts to 24,617 AC-FT/YR
FT. SUPPLY LAKE**LAKE OPTIMA
2-5-3 2-5-4
1,735(4) 5,029(5)
86,800 71,800
400 76,200
220 5,400
May 1942 Sept.1978
7,051 0
23
UNAPPROPRIATED WATER
In determining unappropriated water it was assumed that all the appropriatedwater was being utilized inasmuch as under Oklahoma law that portion not beingused becomes available to other prospective users. This assumption is quitereasonable when determining unappropriated water on a long period average and whenall non-used water rights have either been reduced or cancelled recently as theywere in this system (1979). In some of the sub-stream systems the streamflowincorporated in this report is the unappropriated amount and in others it is not,as is described below for each sub-stream system.
SUB-STREAM SYSTEM 2-5-1
Average annual streamflow for the period of 1938-1976 was computed to be 1,067 cfs(772,508 acre-feet per year). Because of the above assumption on unappropriatedwater, and since the above streamflow figure is the flow into Eufaula Lake, theunappropriated water is 772,508 acre-feet per year less the amount appropriatedfrom Lake Eufaula within the North Canadian River Basin (773 acre-feet per year)and less the annual average discharge from sub-stream system 2-5-2 which is equalto 105 cfs (76,020 acre-feet per year). Therefore, total unappropriated waterentering Lake Eufaula is 695,715 acre-feet per year.
However, it is appropriate to account for evaporation loss from Lake Eufaula.The major contributin9 streams are the Oeep Fork and the North and South CanadianRivers. Evaporation loss from the lake was proportioned by the amount of waterthat each stream contributes to the lake, as measured by U.S.G.S. Gage Nos. 07243500,07242000 and 07231500. Assuming a water surface area at the elevation of the topof the gates, evaporation loss that needs to be compensated by the North CanadianRiver amounted to 124,700 acre-feet per year. Thus, available unappropriatedwater is 571,015 acre-feet annually.
SUB-STREAM SYSTEM 2-5-2
The streamflow for sub-stream system 2-5-2 represents the amount that leavesthe sub-stream. The annual average discharge for the period considered is 105cfs (76,020 acre-feet per year). The annual average discharge from sub-streamsystem 2-5-3 is 176 cfs, of which 110 cfs is a release for use by Oklahoma City.Hence, the discharge to sub-stream system 2-5-2 from 2-5-3 is only 66 cfs (47,784acre-feet per year), and the total unappropriated water available for appropriationis 39 cfs (28,236 acre-feet per year): Unlike Eufaula Lake, since the streamflowgage is located downstream from the Overholser Dam, evaporation from Lake Overholser is already accounted for.
SUB-STREAM SYSTEM 2-5-3
The sub-stream system flow given in this report is measured below the CantonDam. However, Oklahoma City uses Canton Reservoir for storage of its water rightof 80,000 acre-feet per year to be diverted at Lake Overholser. Therefore, thetotal available unappropriated water from this sub-stream system, on the average,should equal the streamflow average, less the release for use by Oklahoma City(110 cfs) and less the discharge from sub-system 2-5-4 (48 cfs).
It was stated earlier that the annual average flow for the recorded period of1938-1976 is 198 cfs and for the recorded period of 1949-1976 it is 176 cfs. Thedifference between the two averages, among other things, is primarily due to thewater retained in the reservoir and evaporation losses from the reservoir since itscompletion in July, 1948.
Thus, it appears appropriate to adopt the 176 cfs (127,424 acre-feet per year)as the average flow from this sub-stream. Total unappropriated water would then beequal to 176 cfs less 158 cfs (114,392 acre-feet per year) equalin9 18 cfs (13,032acre-feet per year). Evaporation loss from Ft. Supply and Canton Reservoirs isautomatically accounted for.
SUB-STREAM SYSTEM 2-5-4
The. question of whether existing appropriate water rights have been utilized ornot has no significant meaning concerning this particular sub-stream system becauseof the small number of stream water rights. The unappropriated water is equal to thestreamflow minus the evaporation loss from Optima Lake. The annual average flow at
24
the Optima Dam is computed to be 48 cfs (34,752 acre-feet per year). Annual evaporation loss was computed as 0.7 times the average annual pan evaporation of Goodwelltimes 5,340 acres which is the surface area of the top conservation pool. Its valueis 30,265 acre-feet per year. Therefore, unappropriated water from Optima Reservoiris approximately 6 cfs (4,344 acre-feet per year). It should be noted that surfacearea of the reservoir i~ not always going to be 5,340 acres.
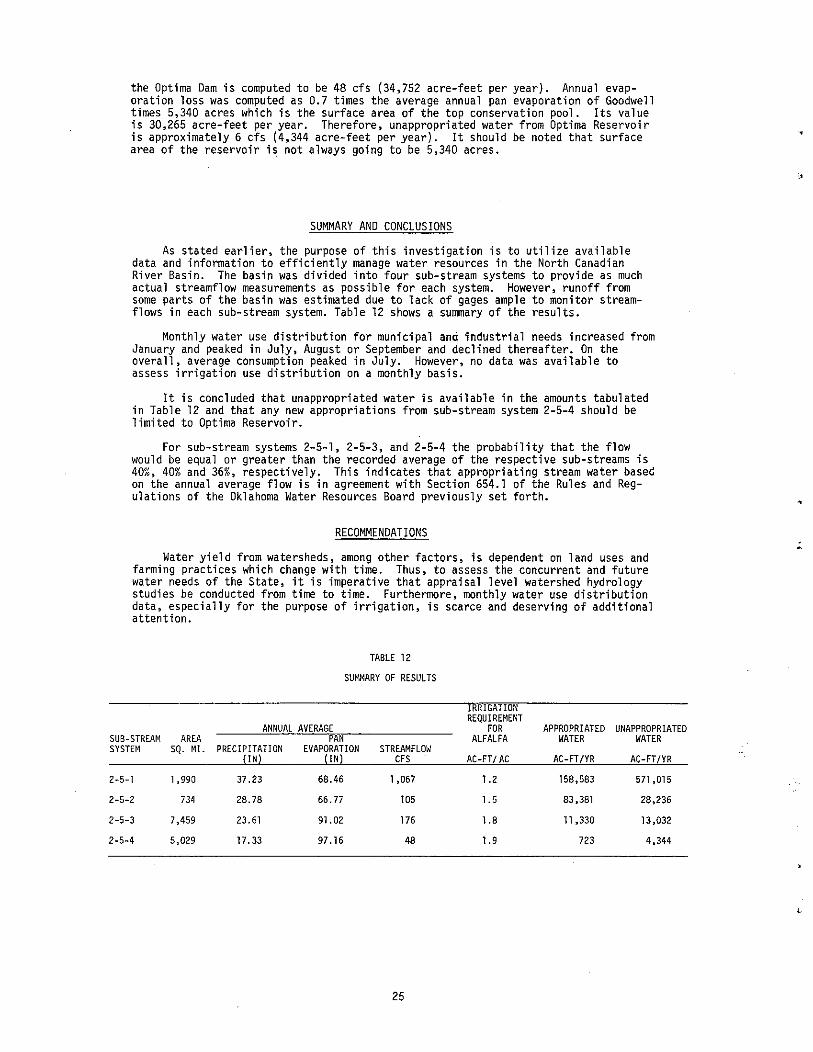
SUMMARY AND CONCLUSIONS
As stated earlier, the purpose of this investigation is to utilize availabledata and information to efficiently manage water resources in the North CanadianRiver Basin. The basin was divided into four sub-stream systems to provide as muchactual streamflow measurements as possible for each system. However, runoff fromsome parts of the basin was estimated due to lack of gages ample to monitor streamflows in each sub-stream system. Table 12 shows a summary of the results.
Monthly water use distribution for municipal anti industrial needs increased fromJanuary and peaked in July, August or September and declined thereafter. On theoverall, average consumption peaked in July. However, no data was available toassess irrigation use distribution on a monthly basis.
It is concluded that unappropriated water is available in the amounts tabulatedin Table 12 and that any new appropriations from sub-stream system 2-5-4 should belimited to Optima Reservoir.
For sub-stream systems 2-5-1, 2-5-3, and 2-5-4 the probability that the flowwould be equal or greater than the recorded average of the respective sub-streams is40%, 40% and 36%, respectively. This indicates that appropriating stream water baseGon the annual average flow is in agreement with Section 654.1 of the Rules and Regulations of the Dklahoma Water Resources 80ard previously set forth.
RECOMMENDATIONS
Water yield from watersheds, among other factors, is dependent on land uses andfarming practices which change with time. Thus, to assess the concurrent and futurewater needs of the State, it is imperative that appraisal level watershed hydrologystudies be conducted from time to time. Furthermore, monthly water use distributiondata, especially for the purpose of irrigation, is scarce and deserving of additionalattention.
TABLE 12
SUMMARY OF RESULTS
IRRIGATIONREQUIREr~ENT
ANNUAL AVERAGE FOR APPROPRIATED UNAPPROPRIATEDSUB-STREAM AREA PAN ALFALFA WATER WATERSYSTEM SQ. MI. PRECIPITATION EVAPORATION STREAMFLOW
(IN) (IN) CFS AC-FT/ AC AC-FT/YR AC-FT/YR
2-5-1 1,990 37.23 68.46 1,067 1.2 158.583 571,015
2-5-2 734 28.78 66.77 105 1.5 83,381 28,236
2-5-3 7.459 23.61 91.02 176 1.8 11 ,330 13.032
2-5-4 5.029 17.33 97.16 48 1.9 723 4,344
25

•
REFERENCES
Chow, V. T. Handbook of Applied Hydrology. New York: McGraw HillBook Co., Inc., 1964
Garton, J.E. and W. D. Criddle. Estimates of Consumptive-Use and IrrigationWater Requirements of Crops in Oklahoma. Stillwater: Tech. BulletinNo. T-57.
Haan, C.T. Statistical Methods in Hydrology. Ames: The Iowa StateUniversity Press, 1977.
Oklahoma Department of A9ricu1ture. Oklahoma Agricultural Statistics.Oklahoma City, Oklahoma.
U. S. Army, Corps of En9ineers. Drainage Area Data - Arkansas, Whiteand Red River Basins. Tulsa, Oklahoma, November 1954.
U. S. Army, Corps of En9ineers. Plan of Study - Canadian River Basin.Tulsa, Oklahoma.
U. S. Department of Commerce, NOAA. Climatological Data Oklahoma.
U. S. Geological Survey. Water Resources Data For Oklahoma.Oklahoma City, Oklahoma •
26