hydrogeology and hydrologic system of final creek basin, gila
TRANSCRIPT

Hydrogeology and Hydrologic System of Final Creek Basin, Gila County, ArizonaBy CHRIS C. NEAVILLE and JAMES G. BROWN
U.S. GEOLOGICAL SURVEYWater-Resources Investigations Report 93 4212
Tucson, Arizona 1994

U.S. DEPARTMENT OF THE INTERIOR BRUCE BABBITT, Secretary
U.S. GEOLOGICAL SURVEY Gordon P. Eaton, Director
For additional information Copies of this report can bewrite to: purchased from:
U.S. Geological SurveyDistrict Chief Earth Science Information CenterU.S. Geological Survey Open-File Reports SectionWater Resources Division Box 25286, MS 517375 South Euclid Avenue Denver Federal CenterTucson, AZ 85719-6644 Denver, CO 80225

CONTENTS
...................................................................................................................... PageAbstract ...................................................................................................................... 1Introduction. .................................................................................................................... 1
Purpose and scope.................................................................................................. 1Previous investigations........................................................................................... 3Approach................................................................................................................ 3Physical setting....................................................................................................... 3Acknowledgments.................................................................................................. 4
Hydrogeology.................................................................................................................. 4Basin structure........................................................................................................ 7Hydrogeologic units............................................................................................... 8
Hydrologic system........................................................................................................... 13Occurrence and movement of surface water.......................................................... 13
Webster Lake................................................................................................ 13Perennial streamflow.................................................................................... 15
Occurrence and movement of ground water.......................................................... 15
Stream-aquifer interactions.................................................................................... 17
Regional ground-water budget............................................................................... 26Inflow............................................................................................................ 26
Outflow......................................................................................................... 26
Water use................................................................................................................ 29Summary ...................................................................................................................... 30References cited............................................................................................................... 31
PLATES
[Plate in pocket]Plate 1. Geologic map and selected well locations, Final Creek basin, Arizona
FIGURES
1. Map showing location of study area, Final Creek basin, Arizona........................ 2
2. Map showing ground-water, surface-water, and precipitationdata-collection sites, Final Creek basin, Arizona.............................................. 4
3. Graphs showing monthly precipitation and monthly temperature, Globeand Miami, Arizona, 1893-1989....................................................................... 6
Contents III

FIGURES Continued Page
4. Map showing aquifer area, alluvial fans, and tributary streams,
Final Creek basin, Arizona................................................................................ 10
5. Graph showing measured streamflow, dissolved solids, and dissolved
manganese at Final Creek at Inspiration Dam near
Globe, Arizona,1979-91.................................................................................... 16
6. Hydrograph showing water levels and ground-water withdrawals in the
Kiser area and precipitation at Miami, Arizona, 1915-44................................. 19
7. Hydrographs showing measured water-level changes in the foothills of the
Final Mountains, Arizona, 1945-54................................................................... 20
8. Map showing streamflow-measurement sites, Final Creek basin
Arizona, 1985-87............................................................................................... 23
9. Hydrograph showing monthly mean discharges at Final Creek at
Inspiration Dam near Globe, Arizona, 1980-89................................................ 24
10. Hydrographs showing measured water-level changes in selected wells
near Final Creek, Arizona, 1984-89.................................................................. 25
11. Graphs showing measured water levels in index wells,
Final Creek basin, Arizona, 1975-92................................................................. 27
TABLES
1. Periods of greatest and least precipitation, Final Creek basin, Arizona............... 7
2. Summary of estimated aquifer properties, Kiser area,
Final Creek basin, Arizona................................................................................ 13
3. Area and capacity of Webster Lake...................................................................... 14
4. Drainage areas for major tributaries, Final Creek basin, Arizona........................ 18
5. Streamflow measurements and estimates, Final Creek basin,
Arizona, 1984-87............................................................................................... 21
6. Annual ground-water budget for Final Creek basin, Arizona,
August 1980 to September 1984....................................................................... 26
7. Ground-water withdrawals by area within Final Creek basin, Arizona,
August 1980 to September 1984....................................................................... 28
8. Evapotranspiration estimates for cottonwood and mesquite,
Final Creek basin, Arizona................................................................................ 30
IV Contents

CONVERSION FACTORS
Multiply By To obtain
millimeter (mm) 0.03937 inchcentimeter (cm) 0.3937 inch
meter (m) 3.281 footkilometer (km) 0.6214 milesquare kilometer (km2) 0.3861 square milecubic meter (m3) 35.31 cubic footcubic meter per second (m3/s) 35.3107 cubic foot per secondliter per second (L/s) 15.85 gallon per minute
In this report, air temperatures are given in degrees Celsius (°C), which can be converted to degrees Fahrenheit (°F) by the following equation:
°F=1.8(°C)+32
ABBREVIATED WATER-QUALITY UNITS
Chemical concentration and water temperature are given only in metric units. Chemical concentration in water is given in milligrams per liter (mg/L) or micrograms per liter fcg/L). Milligrams per liter is a unit expressing the solute per unit volume (liter) of water. One thousand micrograms per liter is equivalent to 1 milligram per liter. For concentrations less than 7,000 milligrams per liter, the numerical value is about the same as for concentrations in parts per million.
VERTICAL DATUM
Sea level: In this report, "sea level" refers to the National Geodetic Vertical Datum of 1929 A geodetic datum derived from a general adjustment of the first-order level nets of the United States and Canada, for merly called Sea Level Datum of 1929.
Contents V

Hydrogeology and Hydrologic System of Final Creek Basin, Gila County, Arizona
By Chris C. Neaville and James G. Brown
AbstractAcidic water that contains elevated concentrations of metals has contaminated a stream and
alluvial aquifer in a mining district near Globe, Arizona. The contaminated aquifer is a narrow layer of unconsolidated alluvium along Miami Wash and Final Creek. The alluvium overlies basin fill, which extends throughout most of the Final Creek basin. The alluvium and basin fill compose the primary aquifer in the basin. Horizontal hydraulic conductivities were estimated at about 200 meters per day in the alluvium, and average linear ground-water flow velocities are about 5 meters per day.
Water levels in the aquifer respond rapidly to extended periods of runoff in the basin and variable rates of ground-water pumping. Fluctuations of as much as 2.5 meters in 6 months have been measured. Ground-water levels were near record highs during spring 1985 and declined as much as 13 meters by spring 1989. Measured hydraulic gradients indicate that flow generally is upward from the basin fill to the alluvium. From 1980 to 1984, 155 liters per second of seepage from Webster Lake and 279 liters per second of streamflow infiltration were estimated to be the two largest sources of inflow to the regional aquifer. Significant outflows from the aquifer were 166 liters per second of pumpage and 240 liters per second of ground-water discharge to Final Creek.
INTRODUCTION
Acidic waters that contain elevated concentrations of metals drain from areas disturbed by mining activities in Final Creek basin, Arizona (fig. 1), and have created a contaminant plume about 15 km long in a stream and aquifer (Eychaner, 1988, p. 291). Mining began in the study area in the late 1800's and continued through the time of this study. From about 1940 to 1986, acidic-waste solutions were stored in Webster Lake; seepage from the lake was a major cause of aquifer contamination. Although the movement of the acidic plume is primarily in ground water, stream-aquifer interactions are important because acidic water can discharge to the land surface when runoff from large storms recharge the regional aquifer. The presence of contaminated ground water has long been recognized in the basin but was not studied until 1979 (Envirologic Systems, Inc., 1983). The U.S. Geological Survey (USGS) began studies in the area in 1984, and in 1987, cleanup of
the contaminated ground water began under the supervision of the U.S. Environmental Protection Agency (USEPA).
This study was undertaken to increase understanding of the movement of the contamination plume by a comprehensive examination of the hydrogeology and stream- aquifer system in the area. Sources of hydrogeologic data included published literature, unpublished data files of the U.S. Geological Survey and mining companies, and field studies.
Purpose and Scope
The purpose of this report is to describe the hydrogeology and stream-aquifer system in Final Creek basin. The report discusses the lithologic and hydraulic characteristics of major water bearing units and includes a water budget for the regional aquifer for August 1980 to September 1984. Important components of the water budget
Introduction 1

55 1 50' 45 1 110°40'
/^BOUNDARY * OF BASIN
33°15'Base from U.S. Geological Survey, 1:24.000; Globe. 1945. Rockingslraw Mtn.. 1986. Salt River Peak. 1986. and Inspiration, 1945 5 KILOMETERS
Figure 1. Location of study area, Final Creek basin, Arizona.
Hydrogeology and Hydrologic System of Final Creek Basin, Gila County, Arizona

include ground-water pumpage, stream leakage, seepage from Webster Lake, outflow at Inspiration Dam, and evapotranspiration.
contaminant transport in ground water and the interaction of the contaminants with aquifer materials.
Previous Investigations
The geology of the study area was described by Ransome (1903) and Peterson (1962). Both authors emphasized mineral resources of this district and the economic potential for mining. Ransome mapped the geology of the southern part of the study area from Globe to the foothills of the Final Mountains and described several mines in this area. Peterson mapped the geology of the Globe quadrangle and included a discussion of the occurrence of ground water in the basin fill.
Hazen and Turner (1946) described the geology and ground-water resources of the area south of Globe and provided maps on the water table and geology, a well inventory, and a detailed discussion of recharge and water-level changes. Turner (1955) elaborated on the hydrogeology of Pinal Creek basin and included data on climate, ground-water pumpage, and ground-water levels.
In 1979, the Central Arizona Association of Governments established the Mineral Extraction Task Force (METF) to assess the magnitude of the water-resources contamination in the Globe- Miami area. The task force was composed of representatives of Federal, State, and local agencies; local mining companies; and the Salt River Project. Between 1979 and 1983, the METF produced a series of reports describing geology, surface water and ground water, and extent of water-resources contamination from mining activities (Central Arizona Association of Governments, 1983; Envirologic Systems, Inc., 1983; Kiven and Ivey, 1981; Rouse, 1981,1983).
In 1984, the U.S. Geological Survey (USGS) began to document contaminant migration in Pinal Creek basin (Eychaner, 1988, 1989; Eychaner and Stollenwerk, 1985, 1987; Haschenburger, 1989). The area was selected as a research site under the U.S. Geological Survey Toxic Substances Hydrology Program to study
Approach
Available literature and data concerning the study area were collected and compiled for analysis. Lithologic, hydraulic, and water- chemistry data were obtained from project wells drilled from 1984 to 1990 (fig. 2). Continuous streamflow data were collected at the streamflow- gaging station at Inspiration Dam (09498400); water samples for chemical analysis were collected on a routine basis from Pinal Creek at Inspiration Dam and Pinal Creek at Setka Ranch (09498380). Streamflow measurements were made during one runoff period in the Pinal Mountains to characterize runoff and recharge in that area. These data were used to characterize the hydrogeology and stream-aquifer system of the basin.
Physical SettingPinal Creek basin in Gila County, Arizona,
includes a 504-square-kilometer surface-water drainage area. Altitudes in the study area range from 835 m at Inspiration Dam to 2,393 m above sea level in the Pinal Mountains. Pinal Creek originates in the Pinal Mountains, flows northward, and empties into the Salt River. Streamflow in the basin is ephemeral except in the northern reach of Pinal Creek that begins flowing perennially about 5.5 km upstream from Inspiration Dam. The dam is an abandoned diversion structure at the head of a narrow canyon and marks the downstream boundary of the study area. Major tributaries of Pinal Creek include Bloody Tanks Wash, Miami Wash, and Russell Gulch (fig. 1).
The largest communities in the study area, Globe and Miami, were built in response to mining activities and, to a lesser extent, cattle ranching in the surrounding area (Peterson, 1962, p. 2). Since 1874, copper-mining activities resulted in alteration of the upper basin landscape with pits and tailings piles. Globe lies in the southeastern part of the basin on the south flank of the Globe Hills. Pinal Creek flows through Globe, and a significant
Introduction 3

1100 55' 50'
33°35'
33-20 1
EXPLANATION
INTERMITTENT STREAM
DATA SITES Number is site identifier
10
0949S3SOAObservation well group Streamflow-gaging station
Precipitation gage
Inspiration Dam 09495400
oClaypooM
Base from U.S. Geological Survey, 1:24,000; Globe. 1945, Rockingstraw Mtn.. 1986, Salt River Peak. 1986, and Inspiration, 1945
3 KILOMETERS
Figure 2. Ground-water, surface-water, and precipitation data-collection sites, Final Creek basin, Arizona.
4 Hydrogeology and Hydrologic System of Final Creek Basin, Gila County, Arizona

amount of development is on the flood plains of Final Creek and along the washes of the side canyons. Miami lies in a narrow valley drained by Bloody Tanks Wash in the south-central part of Final Creek basin. A few smaller, unincorporated communities lie between Globe and Miami. Development outside these towns and communities is mostly near stream channels where water supplies and flat ground are available.
Although the climate in Final Creek basin is arid and mild for the most part, it varies considerably with altitude and seasonal changes. Weather has been monitored in the study area at Globe and Miami (figs. 2 and 3). Mean annual precipitation is 41.9 cm at Globe and 49 cm at Miami. Precipitation increases with altitude and is highest in the Final Mountains, which are 1,300 m above Globe.
Months of greatest rainfall generally are December through February, when light, steady rains that last several days are common; and in July and August, when short cloudbursts occur. During August, mean monthly precipitation is about 7 cm at Globe. During December, mean monthly precipitation is about 4.5 cm at Globe (fig. 3). Light snowfall occasionally occurs throughout most of the basin in the winter; however, in the Final Mountains, snowpack is common from December through March, and snowmelt runoff occurs during January to April. May and June are the driest months, when mean monthly precipi tation is less than 1.0 cm for the three observation stations. The warmest months are June through August; the highest mean monthly temperature is about 28°C in July. The coolest months are December and January, when mean monthly temperatures are about 7°C. Record precipitation totals for 12-month periods range from a maximum of 97 cm to a minimum of 14 cm at Globe (table 1).
Runoff in the basin varies considerably with the type of storm (Beckett, 1917, p. 40). Some storms begin as localized cloudbursts, and other storms occur as steady downpour over the entire watershed. Most of the recorded floods in the basin occur in July and August when intense, short-lived cloudbursts produce flash floods. Rainfall records reveal that such storms generally do not occur in Globe and Miami simultaneously; this nonuniformity indicates that cloudbursts are not
always uniformly distributed over the entire basin. In December 1914, January 1916, October 1983, and December 1984, large floods occurred during periods of steady precipitation after which streams commonly flowed for several months. Storms of this type have the greatest effect on ground-water levels.
Vegetation in the basin is typical of the transition zone between the mountains of central Arizona and the hot, arid desert region of the southwestern part of the State (Peterson, 1962, p. 4; Hazen and Turner, 1946, p. 5). On the basis of field observations and aerial photographs, the most common phreatophytes in the basin are mesquite, cottonwood, and saltcedar (Cooper Aerial Survey Company, 1988). Although mesquite predomi nates, cottonwood and saltcedar grow in clumps on the flood plains where the water table is shallow. Phreatophytes are densest along the perennial reach of Final Creek where the depth to ground water is normally less than 2 m. Dense mesquite occupies about 2.2 km2 in this area, and dense cottonwood covers 0.3 km2. Areas of saltcedar are difficult to quantify from the aerial photographs and could only be found sporadically in field checking.
Acknowledgments
Professor Thomas Maddock, III, University of Arizona, provided technical review and support. Thomas A. Conto, Senior Project Engineer, Cyprus Miami Mining Corporation, and Chris Erskine, hydrologist, Pinto Valley Division of Magma Copper Company, provided data and expertise on the study area. The city of Globe provided records of sewage-effluent discharge into Final Creek.
HYDROGEOLOGY
Final Creek basin is near the north boundary of the alluvial basins described by Freethey and others (1986) and is bounded by the Final Mountains to the south and by Apache Peaks and Globe Hills to the east. The setting is typical basin and range structure that has northwest-trending ranges of igneous and metamorphic rocks separated by a valley that is filled by thick alluvial deposits.
Hydrogeology 5

co 10trLUu) 8
c O 6
O 4
9: 2OLUtrQ_
1 I I I I I I T
JAN FEB MAR APR MAY JUNE JULY AUG SEPT OCT NOV DEC
MEAN MONTHLY PRECIPITATION
JAN FEB MAR APR MAY JUNE JULY AUG
MEAN MONTHLY TEMPERATURE
SEPT OCT NOV DEC
WEATHER STATION DATA
GLOBE
LOCATION. Lat 33°22'40", long 110°46'11", in NE1/4 NW1/4 NWl/4sec. 1,T. 1 S., R.15 E. (D-1-15)1bba, at U.S. Forest Service ranger station, 2.4 kilometers southeast of Globe post office.
ALTITUDE. 1,097 meters above National Geodetic Vertical Datum of 1929, from topographic map.
PERIOD OF RECORD. March 1981 to 1989. Between January 1907 and February 1981, precipitation at Globe was recorded at nine locations ranging from 0.2 to 1.6 kilometers generally northwest of the present site at altitudes between 1,048.5 and 1,130.8 meters. The longest periods at a single site were from January 1907 to April 1925 at altitude 1,089.7 meters and from May 1923 to June 1975 at altitude 1,080.5 meters.
MIAMI
LOCATION Lat 33°24'15", long 110°52'09", in SE1/4NE1/4 NW1/4 sec. 30, T. 1 N., R.15 E. (A-1-15)30bad, at Miami East plant site of Magma Copper Corporation, 0.5 kilometer northwest of Miami post office.
ALTITUDE. 1,084 meters above National Geodetic Vertical Datum of 1929, from topographic map.
PERIOD OF RECORD. February 1914 to 1989.
Figure 3. Monthly precipitation and monthly temperature, Globe and Miami, Arizona, 1893 1989.
6 Hydrogeology and Hydrologic System of Final Creek Basin, Gila County, Arizona

Table 1. Periods of greatest and least precipitation, Final Creek basin
Greatest
Least
Globe
Precipi tation, in
centimeters
21.82 ^0.96
0.0
Time period
1 month
December 1967 January 1937
(2)
Miami
Precipi tation, in
centimeters
29.31 1 69.85
0.0
Time period
December 1967 January 1967
(2)
12 months
Greatest
Least
77.01
14.17
July 1914 to June 1915
December 1947 to November 1947
97.94
19.86
August 1940 to January 1941
January 1956 to December 1956
5 years
Greatest
Least
350.29
327.58
January 1905 to December 1909
January 1946 to December 1950
359.03
335.51
January 1905 to December 1909
January 1946 to December 1950
1Snowfall only.2Several months during most years.3Annual average value.
Basin Structure
Geologic structure in the study area is dominated by north-northwestward- and north- northeastward-trending normal faults that created structural troughs that were subsequently filled by alluvial fans. These major faults separate the basin fill into the southern and northern blocks that coincide with the upper and lower basins, respectively (D.R. Pool, hydrologist, U.S. Geological Survey, written commua, 1984). Peterson (1962, p. 54) referred to the southern block as the Globe Valley block. Along the faults that surround the structural blocks, the basin fill is laterally confined by crystalline rocks, such as schist, granite, quartz monzonite, dacite, and diabase. On the basis of information on the few boreholes and mining shafts that penetrate the basin fill, the basin fill is mostly underlain by diabase, dacite, and schist. Most of the rocks older than the basin fill are highly tilted and broken into discontinuous blocks.
The southern block is a triangle-shaped graben bounded by the Miami fault, the Pinal Creek fault zone, and a west-northwestward-trending fault that is exposed in the gulches that drain the Pinal Mountains (pi. 1). The Miami fault trends northeast along the boundary of the basin fill from the Pinal Mountain foothills to the bottleneck. The
dip of this fault ranges from 35° E. to vertical, and the maximum throw exceeds 500 m (Peterson, 1962, p. 56). The Pinal Creek fault zone follows the east boundary of the southern block and is exposed in the underground workings of the Old Dominion Mine. From the mine, the fault zone extends southeastward along the course of Pinal Creek and northwestward through the bottleneck. The Pinal Creek fault zone is rarely exposed at the surface but is at least 1.5 km wide in the mine workings. This fault zone is characterized by a series of southwest-dipping step faults, and the total throw probably is less than 200 m (Peterson, 1962, p. 46). The Pinal Creek fault zone and the Miami fault intersect at the bottleneck in a complicated structural area.
In the southern block, the basin fill is slightly tilted except near boundary faults where it is tilted toward the basin. Minor faults and fractures mostly trend north to northeast. A seismic- refraction survey indicated that the thickness in the basin fill abruptly decreases by 30 m from south to north midway along Miami Wash (D.L. Igou, geophysicist, Cities Service Oil Company, written commun., 1967). This thickness change was interpreted as a normal fault and indicated that the southern block may contain more than one major area of basin fill.
Hydrogeoiogy 7

Two possible normal faults may control the structure of the northern block (D.R. Pool, written commun., 1984). These faults are not shown on plate 1 because they have not been mapped in detail. One fault trends north and northwest from the bottleneck to Inspiration Dam along the west boundary of the lower basin. The second fault trends east and west along Wood Springs Wash, crosses Horseshoe Bend Wash, and continues west across Final Creek. This second fault is evident from the abrupt bends at drainage crossings, a distinct contrast in geomorphology, and the change from conglomerate to lacustrine deposits on the north side of the fault. In the northern block, the basin fill generally is flat lying with a slight westward tilt except near the west boundary. Minor faults and fractures trend north to northeast.
Hydrogeologic Units
The geology of much of the study area is described in detail by Peterson (1962) and Ransome (1903). Geologic units mapped in this area range in age from Precambrian to Quaternary. The Precambrian basement complex is mainly schist that is intruded by large bodies of igneous rocks. A sedimentary sequence with some intrusions unconformably overlies this basement complex. Deposition of a thick limestone sequence occurred during the Paleozoic era. Igneous intrusions accompanied by faulting, deformation, and mineralization began in the Late Cretaceous period and continued into the early Tertiary period. During the Tertiary period, tuff and dacite erupted over the eroded surface of the faulted sedimentary and igneous rocks. Beginning in the late Tertiary period, alluvial materials began filling the structural troughs created by block faulting and formed a thick sequence of basin fill that unconformably overlies an eroded surface of dacite and other older rocks. Faulting and mild volcanic activity continued into the Pliocene and Pleistocene epochs (Peterson, 1962, p. 8). Erosion has resulted in the current pattern of dissected basin fill and reworked alluvium along the major drainages.
A generalized geologic map of the study area (pi. 1) was constructed on the basis of geologic mapping by Peterson (1962), Ransome (1903), Hazen and Turner (1946), E.D. Wilson (geologist,
Arizona Geological Survey, written commun., 1960), and D.R. Pool (written commun., 1984). For purposes of this study, geologic units previously mapped separately were grouped in part on the basis of hydrologic significance (pi. 1). Most of the basement-complex rocks were combined into a single unit of granitic and metamorphic rocks of low hydraulic conduc tivity. The diabase and volcanic rocks were excluded from this first grouping despite their low hydraulic conductivity. These two units were distinguished because of their contact with the basin fill and their structural control of ground-water movement in certain locations. All the Precambrian and Cambrian conglomerates and quartzites were grouped into one unit on plate 1 and were also separated from other rocks of low hydraulic conductivity. Limestones in the basin were grouped together and are water bearing to a certain degree, depending on the amount of fracturing and karst features (Hazen and Turner, 1946, p. 20).
The consolidated alluvial units overlying diabase and dacite in the basin were called Gila Conglomerate of Tertiary age by Ransome (1903, p. 47) and Peterson (1962, p. 41) and are known locally by that term. Heindl (1958), however, showed that consolidated alluvium in Pinal Creek basin is not equivalent to Gila Conglomerate in its type section, although their ages overlap. For this report, these units are termed basin fill and follow the usage of Freethey and others (1986, sheet 1).
A formation of dioritic detritus underlies part of the basin fill near Old Dominion Mine (Ransome, 1903, p. 50). Peterson (1962, p. 10) described and mapped the same outcrops as thrust- faulted Madera Diorite of Proterozoic age. Because this unit proved to have considerable water-bearing capacity in the mine (Beckett, 1917, p. 39), these outcrops are identified in this report as megabreccias to emphasize their hydrologic significance (pi. 1).
Basin fill and unconsolidated alluvium constitute the principal aquifer for the basin. Just north of the confluence of Pinal Creek and Miami Wash, the aquifer narrows to 1.4 km wide and divides the basin into two parts (fig. 2). This area will be referred to as the bottleneck in this report.
8 Hydrogeology and Hydrologic System of Pinal Creek Basin, Giia County, Arizona
The area south of the bottleneck will be referred to as upper Final Creek basin, and the area north of the bottleneck will be referred to as lower Final Creek basin.
Basin-fill materials consist of alluvial and fluviolacustrine deposits that grade from coarse fanglomerates near mountain areas to fine-grained lacustrine or play a deposits, which were formed when shallow bodies of water occupied parts of the basin (D.R. Pool, written commun., 1984). Broader features of basin-fill deposits are typical of broad, coalescing alluvial fans laid down by periodic floods and intermittent streams. Character and composition vary according to the source area, degree of transportation, and sorting. Deposits range from unsoited, unconsolidated rubble as much as 5 m in diameter to well-stratified deposits of firmly cemented sand, silt, and gravel that contain well-rounded pebbles and cobbles (Peterson, 1962, p. 41).
Three major alluvial fans constitute most of the volume of the basin fill (fig. 4). The largest of these fans, the Final Mountains alluvial fan, overlaps the northern flank of the Final Mountains. The top of the fan is a crudely stratified mixture of diorite and granite fragments, and the lower part of the fan is composed entirely of unsoited angular fragments of schist (Peterson, 1962, p. 41). A second large fan is near the Globe Hills and is known as the Globe Hills alluvial fan. This fan was formed from detritus carried from the north and northeast and is composed of lenticular beds of gravel, sand, and silt that are firmly indurated by calcareous cement. Most of the fragments of quartzite, limestone, dacite, and diabase are well rounded, which indicates that they have been transported considerable distances (Peterson, 1962, p. 41). The two fans meet approximately along the channels of Russell and Webster Gulches. The third large fan, the Apache Peak alluvial fan, formed in the lower basin in the foothills that are south and west of Apache Peaks.
On the basis of exploratory drilling and a seismic-refraction survey (location of survey line is shown on plate 1), the basin fill is thickest in the upper basin. Beneath Solitude tailings pond, a borehole penetrated 1,220 m of basin fill without reaching another rock unit (Peterson, 1962, p. 41). About 4 km south of the mouth of Russell Gulch, at
the southern end of the refraction survey, the greatest thickness of basin fill was calculated to be about 1,040 m (D.L. Igou, geophysicist, Cities Service Oil Company, written commun., 1967). The refraction survey continued northward along Russell Gulch and Miami Wash to just north of the bottleneck. Although the accuracy of the depth calculations from the seismic-refraction data is uncertain, the interpretation of the results appears to be consistent with basin structure and drilling information. The basin fill along the refraction- survey lines thins northward along Miami Wash to a calculated depth of 125 m just north of the bottleneck. The deepest nearby borehole ended in basin fill at a depth of 122 m. In the lower basin, three wells drilled about 5 km north of the bottleneck completely penetrated the basin fill at 171,224, and 282m.
According to D.R. Pool, (written commun., 1984), the basin fill can be separated into at least four lithologic units distinguishable by color, texture, bedding, consolidation, and structure. The relative ages and stratigraphic relations of the units are inferred by the degree of deformation and consolidation that generally decreases upward. In this report these four units will be referred to as Units 1-4; Unit 1 is the oldest and Unit 4 is the youngest.
Unit 1 is a moderately to well-consolidated, reddish-gray sandstone and conglomerate. Outcrops of this unit are found adjacent to rock types other than basin fill and near major structures where there is distinct faulting and tilting.
Unit 2 is a poorly to moderately consolidated, poorly sorted, distinctly bedded, buff to gray sandstone and conglomerate. Unit 2 contains few depositional structures, is found throughout the basin, and is generally flat lying to slightly lilted except near major faults. Minor normal faults and fractures in Unit 2 trend in a north-northeasterly direction. Near Horseshoe Bend Wash, Unit 2 changes to a moderate to well-sorted, poor to moderately consolidated, gray sandstone, which is only slightly to moderately tilted even though it is near major structures. The sandstone generally is clean, massive, and crossbedded and includes some gravel and cobble lenses.
Hydrogeology 9

110-55'
33°35'
33°20'
EXPLANATION
BOUNDARY OF AQUIFER
BOUNDARY OF ALLUVIUM
INTERMITTENT STREAM
Pringle diversion pumping station
Apache Peak alluvial fan
Solitude Tailings Pond
Globe Hills alluvial fan
Pinal Mountains alluvial fan
110°45'
Base from U.S. Geological Survey, 1:24,000; Globe, 1945, Rockingstraw Mtn., 1986, Salt River Peak, 1986, and inspiration, 1945
3 KILOMETERS
Figure 4. Aquifer area, alluvial fans, and tributary streams, Pinal Creek basin, Arizona.
10 Hydrogeology and Hydrologic System of Pinal Creek Basin, Gila County, Arizona

Unit 3 is a poorly consolidated, brown, reddish-brown, and gray conglomerate that overlies the older units of basin fill north of the bottleneck. Unit 3 has indistinct flat-lying bedding, and no apparent faults or fractures cut the unit.
Unit 4 is a fine-grained playa deposit that crops out northeast of the perennial reach of Final Creek. This playa deposit is moderately to well consolidated, brown to light gray, composed of interbedded mudstone and siltstone and includes gypsum layers and lenses of sand and gravel. Unit 4 tilts slightly to the northeast and has many northwestward-trending fractures. Unit 4 lies at similar altitudes as deposits of Units 2 and 3, but correlation with other units of basin fill is unclear.
Relatively impermeable granitic, meta- morphic, and volcanic rocks that range from Proterozoic to Tertiary age form the boundary of the basin fill on the south and west and at depth. South of the bottleneck, the west boundary is the Miami fault (pi. 1). The south boundary is a northwestward-trending fault along the flanks of the Final Mountains. North of Globe, these granitic, metamorphic, and volcanic rocks also bound the basin fill on the east. Mineralized water that flows through these rocks was intercepted by mine workings in the eastern part of the Old Dominion Mine. Beckett (1917) noted that the working of successively lower levels of the mine drained this water from the overlying level. Because this water was encountered only as mining proceeded to the east, it is doubtful that before mining these fracture zones were hydraulically connected to basin fill or alluvium to the west. At the west end of the Old Dominion Mine, permeable fractures in megabreccias that underlie the basin fill allow seepage of water from basin fill into the mine.
Limestone units of Paleozoic age that yield usable quantities of water to wells underlie basin fill and alluvium between Miami Wash and Final Creek (Peterson, 1962, pi. 2, section E-E'). The degree of hydraulic interconnection among the three units is unknown. Along the southeast boundary of the upper basin, the drainage divide that extends from Final Mountains to Globe Hills (fig. 1) coincides with a ground-water divide (Hazen and Turner,
1946; p. 24, Harshbarger, 1969). According to Hazen and Turner (1946), a fault may be responsible for this divide. Basin fill is truncated to the north by volcanic rocks of Tertiary age.
Two single-well, constant-discharge aquifer tests made by the City Services Company in sec. 32, T. 2 N., R. 15 E., (C.G. Taylor, Environmental Engineer, Magma Copper Corporation, written commun., 1987) provided the only reliable estimates of hydraulic conductivity in the basin fill. The two wells that are in the lower basin fill had screened intervals of 130 m and 305 m, respectively. Semilogarithmic analysis of time- drawdown and recovery plots from these tests produced hydraulic conductivities between 0.1 and 0.2 m/d.
Data were not available to calculate or estimate the storage properties of the basin-fill aquifer. A Regional Aquifer Systems Analysis (RASA) study of similar deposits in nearby basins, however, provided information with which to characterize aquifer-storage properties at Final Creek (Freethey and others, 1986).
Basin-fill deposits at Final Creek and elsewhere in the Basin and Range physiographic province were created by late Cenozoic block faulting. Freethey and others, (1986, sheet 1) found that the storage properties of basin-fill deposits were controlled mainly by average particle size. Freethey and others (1986) designated deposits as being either coarse, intermediate, or fine grained and estimated the range in specific yield of each type of deposits. Basin fill in the study area ranges in size from boulder to clay but is predominately composed of fine sand to silt-sized material. This size distribution would place these deposits into the intermediate grain-sized facies, in which specific yield ranges from 5 to 25 percent (Freethey and others, 1986, sheet 1).
Unconsolidated alluvium overlies the basin fill primarily along the drainages. The greatest volume of alluvium was deposited along Miami Wash and Final Creek, where unconsolidated alluvium ranges from 300 to 800 m wide and may be as much as 50 m thick. Along the minor tributaries, the alluvium generally is less than 15m
Hydrogeology 11

thick. The alluvium is thickest below the south end of Miami Wash and thins northward to Inspiration Dam, where it is truncated by volcanic rocks of Tertiary age.
Alluvial deposits include channel fill, terrace deposits along present streams, and fan deposits at the mouths of washes. In general, the alluvium consists mostly of sand and gravel; however, material sizes can range from clay to boulders. In December 1988, six borings were completed in the alluvium at four locations from Russell Gulch to near the head of perennial flow. A hollow-stem auger was used to take samples of alluvium at least at every meter. Most of the material was sand and gravel. Samples from three borings between 22 and 25 m deep contained an average of 10 percent silt or clay, 57 percent sand, and 33 percent gravel. In one boring drilled near the head of perennial flow, a clay lens approximately 4 m thick was penetrated. The contact between the alluvium and basin fill is difficult to distinguish during drilling, but in general, drilling becomes harder as the basin fill becomes more cemented. Also, a boulder zone commonly is encountered at the base of the alluvium. In the Kiser area, this zone ranges in thickness from about 2 to 5 m (Hydro Geo Chem, 1989a).
Along the major drainages and most minor tributaries, alluvium is underlain and bounded laterally by basin fill. Beyond the area underlain by basin fill, thin deposits of alluvium are present in small drainages and are underlain by relatively impermeable rocks that range from Proterozoic to Tertiary age.
Hydraulic-conductivity and storage values of the stream alluvium were obtained from aquifer tests, gradient-area-outflow calculations, and specific -capacity data. Aquifer tests were made in wells in the Kiser area at the south end of Miami Wash (Hydro Geo Chem, 1989a, b). The aquifer tests included several step-drawdown tests, one 24-hour constant-discharge test, and one 7-day constant-discharge test using seven observation wells within a 250-meter radius of the pumping well. Test results indicated that two distinct water-producing zones exist in the alluvium: a basal boulder zone and an overlying sandy zone that
has lower hydraulic conductivity than the basal zone. The alluvium had confined responses during early pumping as vertical flow was impeded by the upper zone. Later, drawdown began to be affected by the delayed drainage from the upper zone. From these tests, a horizontal hydraulic conductivity of 490 m/d was estimated for the boulder zone, and an effective hydraulic conductivity for the entire alluvial section was calculated to be 160 m/d. Storage coefficients estimated from the 7-day test ranged from 0.0003 to 0.0004, and specific yield was estimated to be from 0.2 to 0.3 (table 2). The effective horizontal hydraulic conductivity for the alluvium was estimated between well groups 400 and 500 using Darcy's Law, which is:
where
Q K
i A
Q = KiA,
= flow in aquifer,= hydraulic conductivity,= hydraulic gradient, and= area.
(1)
For the alluvium in Pinal Creek between well groups 400 and 500:
Q = discharge at Inspiration Dam, which represents ground-water discharge in the alluvium under most conditions; estimated discharge from the basin fill to the alluvium is negligible; mean ground-water discharge is about 20,000 m3/d;
/ = difference in water levels measured in well groups 400 and 500 divided by the distance between these wells; and
A = average area of the alluvium in Pinal Creek.
Solve for K\
where
' a- (2)
K = (20,000 m3/d)/(0.007)(l 1,000 m2) = 260 m/d,
12 Hydrogeology and Hydrologic System of Pinal Creek Basin, Gila County, Arizona

Table 2. Summary of estimated aquifer properties, Kiser area, Final Creek basin, Arizona
Well
KBM-1 ............
KB3 .................KB4.................KB4. ................KB5. ................KB5. ................KB6. ................KB6. ................SNEST ............P4H1... .............
Test method1
Constant discharge
Constant dischargeStep-drawdown
Constant dischargeStep-drawdown
Constant dischargeConstant discharge
Trans- missivity, in meters
squared per day
2,3201,9501,3902,8802,9702,9702,320
2,3202,230
930
Hydraulic conductivity, in meters per day
1278076
157162162127
12712251
Storage coefficent
0.0004.0003.0003.0003.0003.0003.0004
.0004
.0003
.0003
Specific yield
0.3.3.2.2.2.2.3
.3
.2
.2
1 Source of data: Hydro Geo Chem, Inc., 1989a, b. All transmissivity values were divided by the screened length of the well to obtain hydraulic-conductivity values.
Q = 20,000 m3/d,= (937.1 m - 895.4 m)/5,900 m= 0.007,
and A = 11,000m2 .
This calculation used the known heads at well groups 400 and 500, the estimated length and area of the flow path, and the known outflow. Because flow in and out of the alluvium is thought to be negligible between well groups 400 and Inspiration Dam, outflow measured at Inspiration Dam is equal to the subsurface flow between well groups 400 and 500.
Specific-capacity data were obtained during ground-water sampling and were used to estimate hydraulic conductivities. Drawdown and dis charge were measured in 29 monitoring wells that were pumped for 0.5 to 1.5 hours. Estimated specific-capacity values ranged from 145 to 305 m/d.
HYDROLOGIC SYSTEM
The boundary of the Final Creek surface-water drainage basin forms the boundary of the study area. Major tributaries include Bloody Tanks Wash and Russell Gulch, which join to form Miami Wash. Miami Wash flows into Final Creek, which exits the basin at Inspiration Dam. Flow in streams provides recharge to the regional aquifer, which discharges to Final Creek for about 6 km above Inspiration Dam.
Occurrence and Movement of Surface Water
Stream courses in most of the basin are dry except after periods of intense or prolonged rainfall. Excluding lower Final Creek, perennial flow is restricted to springs in the Final Mountains, Globe Hills, and hills north of Miami and Final Creek. During late winter and spring in most years, snowmelt produces flow in streams in the flanks of the Final Mountains. During years of greater-than- average snowfall in the Final Mountains, flow may be continuous from the Final Mountains to Inspiration Dam for a period of weeks. Hazen and Turner (1946, p. 25) measured streamflow losses on the flanks of the Final Mountains north of the fault that separates basin fill from older rocks. Although some reaches gained in flow downstream, the net flux was from stream to aquifer. In the spring of 1989, project personnel measured a total of 0.03 m3/s of streamflow in six tributaries underlain by granitic rock. The entire flow infiltrated stream alluvium just north of the fault contact between basin fill and crystalline rocks.
Webster Lake
Webster Lake was at the confluence of Webster Gulch and Lost Gulch. Leach-plant discard material was dumped from rail cars along the south edge of Webster Gulch after 1926 and
Hydrologic System 13

formed a slope at the angle of repose. The material had been crushed to less than 1-centimeter diameter but was not as fine as concentrator tailings. Landslides probably occurred frequently down the slope because of the instability inherent in the method of emplacement and variations in water content. One or more such landslides eventually blocked the channel at a point where the drainage area was about 36 km2. These deposits later were extended across the whole valley. The lake was formed in 1941 (Timmers, 1986, p. 3) and was visible in aerial photographs taken January 23,1942 (T.A. Conto, Senior Project Engineer, Cyprus Miami Mining Corporation, oral commun., 1988). The stage of Webster Lake was controlled by a tunnel that later was blocked. The lake was ordered drained by the USEPA in 1986, and by May 1988, the lake was dry.
The area and capacity of Webster Lake at various water levels (table 3) were estimated from topographic maps made after the lake was drained (Cooper Aerial Survey Company, 1989). USGS topographic maps show the lake area as 104,000 m2 in December 1945; maps of 1989 show 105,000 m2 for the same surface elevation. The maximum area of lake according to estimates of this study was 462,000 m2, although Gilkey and Beckman (1963, p. 28) reported an area of 526,000 m2 at an unknown elevation.
Webster Lake was used in copper mining to store water from many sources until it was needed again. These waters generally were acidic and contained large concentrations of metals (Timmers, 1986, p. 17-22). The largest volumes of water came from iron launders and dewatering of underground or open-pit mines. Launder solutions were first produced by Inspiration in 1941 from water that drained into their underground mine and became acidic during unforced leaching (Central Arizona Association of Governments, 1983, p. 27). In 1944, the electrolytic precipitation plant was destroyed by fire, and iron launders were used exclusively for about a year. In 1950, intentional leaching of caved areas above the mine began (Honeyman, 1954, p. 32). The leach water came from Webster Lake, which had a pH of 2.5 and contained at least
10 mg/L of ferric iron. Inspiration's iron-launder facilities were closed in 1974 and 1981 (Timmers, 1986, p. 18-22). The iron launders were replaced by a solvent-extraction plant that began operating in 1979 (Central Arizona Association of Govern ments, 1983, p. 52).
Analyses of lake water collected from the mid- 1970's through the drying of the lake indicate that the pH of lake water was between 2 and 3. Concentrations of dissolved iron and sulfate were greater than 2,000 mg/L and 19,000 mg/L, respectively.
Spills of acidic lake water occurred when intense or prolonged rainfall caused the lake to overflow. Records are virtually nonexistent for the 1940's through the 1960's, but during the late 1970's and 1980's, heavier-than-normal rainfall caused the lake to overflow on more than eight occasions. The most prolonged event occurred in 1978 when the lake flowed from January 16-30 at a maximum discharge of 700 L/s and had a pH as low as 2.57.
Table 3. Area and capacity of Webster Lake
Elevation, in meters
1,0961,0981,1001,1021,1041,1061,1081,1101,1121,1141,1161,1181,1201,1221,1241,1261,127
Area, in cubic meters
35,90050,00071,10089,600
109,000135,000160,000188,000222,000257,000294,000335,000378,000418,000436,000453,000462,000
Cumulative volume, in cubic
meters
12,00059,000
174,000327,000522,000776,000
1,060,0001,400,0001,820,0002,300,0002,830,0003,470,0004,180,0004,960,0005,790,0006,680,0007,150,000
14 Hydrogeology and Hydrologic System of Final Creek Basin, Gila County, Arizona

Perennial StreamfiowThe aquifer is constricted laterally and at depth
near site 500 (fig. 2). In this area, ground water rises to the surface and creates perennial flow in Final Creek. In 1992, flow was perennial from about 1 km below site 500 to Inspiration Dam at the basin boundary and to the mouth of Final Creek. Ground-water levels and the point at which perennial flow begins are controlled by variations in precipitation, ground-water withdrawals, and the removal of contamination sources. From 1988 to 1989, the head of perennial flow moved downstream about 600 m (Eychaner, 1991, p. 441). Streamflow measurements made during a period of base flow in March 1990 indicate that about 40 percent of the base flow surfaces in the first 600 m of the perennial reach (Faires and Eychaner, 1991, fig. 2).
Discharge and water quality have been monitored since 1979 at Final Creek at Inspiration Dam (fig. 2). Average discharge at Inspiration Dam during 1981-91 was 310 L/s and includes ground-water discharge and direct runoff. Ground-water discharge to the perennial reach varied from 210 to 280 L/s from 1980 to 1989. Diversions and withdrawals at Pringle Pump Station from what naturally would be part of base flow to the stream averaged 90 L/s during 1979-85 and 1988-89. Dissolved-solids concentration in Streamflow from 1980 to 1989 increased despite dilution during wet years (fig. 5).
Discharge measurements made concurrently with the collection of water-chemistry samples at Final Creek at Setka Ranch provided limited information on the nature of base flow near the head of perennial flow. All discharges and water samples were measured or collected when no ephemeral flow was contributing to the creek. Superimposed on a long-term trend of decreasing discharge from about 150 L/s in 1987 to 50 L/s in 1991 was a yearly cycle in which minimum discharges occurred generally during the summer and maximum discharges occurred during the winter. The minimum discharge of 90 L/s measured in 1988 was 29 percent less than the average of the maximum discharges measured during the preceding and following winters. The long-term decrease is accompanied by downstream movement of head of flow and declining ground-
water levels, all of which are controlled by variations in fluxes in the upper part of the basin. The yearly variation in flow probably is not related to increased evapotranspiration during summer months because chloride, a conservative constituent in the flow system at Final Creek, changed little during 1988. The decrease may be caused by increased withdrawals for stock and domestic use in the area or may reflect seasonal variations in local recharge.
Occurrence and Movement of Ground Water
Ground water in rocks from Precambrian to Tertiary age generally is restricted to intensely fractured and (or) faulted areas. Elsewhere, these rocks are relatively impermeable. Springs in the Final Mountains south of the basin-fill contact indicate that some flow occurs in fractured and weathered crystalline rock; however, the quantity of this flow is insignificant to that in the regional aquifer. In the Globe Hills, precipitation enters the subsurface through faults, joints, fractures, and karst features (Hazen and Turner, 1946, p. 20) mainly in shale and quartzite formations associated with the Old Dominion Vein fault (Peterson, 1962, p. 44, Beckett, 1917, p. 41). This water is pumped from the Old Dominion Mine for industrial use.
At the west end of the Old Dominion Mine, water from the regional aquifer enters the mine through fractures in underlying mega- breccias. Ground water that does not enter the mine continues to flow northward in the alluvium. As mentioned previously, limestone units of Paleozoic age that underlie basin fill and alluvium between Miami Wash and Final Creek northwest of Globe yield usable quantities of water to wells and should be considered a part of the regional ground-water system.
Basin fill and overlying alluvium are hydraulically connected and form the primary aquifer in the basin. The alluvial aquifer is unconfined, and ground-water movement generally is from the north flank of the Final Mountains northwest toward Inspiration Dam. Most ground- water recharge is from rainfall and snowmelt runoff in the surrounding mountains. Intense or prolonged storms cause large, rapid changes in
Hydrologic System 15

O 1,500CCQ<2
00 CflLU
1,000
2. 500
LUC/) 2CC
I I I I I I I I I T I I
O
o
o
2"
o
Lu^ 3,000 OCC 2LUOQ-
§16^ 2,000i"Q
1,000 60
2~
O
!< 50 DC2CCLU LU
2 5 40
oS
uli 30
II 20111 2
(/)
Q
n
i i i i i i i i i i i i
- «^»--^>'A#b'"^0
0
o
o o
I I I I I I I I I I I I
I I I I I I I I I I I I
o
o o
O 0 n 0-0 0 Q °
0 0° 0 °riPD
OX CD ^ °0^> 056°^ o
0
(EX O^ O
^^ ° o ° "
^nWOrjChu?^ O (C(?5^vi^>^ I i I I i i i I I i
1979 1980 1981 1982 1983 1984 1985 1986 1987 1988 1989 1990 1991YEAR
Figure 5. Measured streamflow, dissolved solids, and dissolved manganese at Final Creek at Inspiration Dam near Globe, Arizona, 1979-91.
16 Hydrogeology and Hydrologic System of Pinal Creek Basin, Gila County, Arizona

ground-water levels. At such times, streamflow may be uninterrupted from the Final Mountains to Inspiration Dam. Runoff collects in the tributaries that drain the higher altitudes (fig. 4) and infiltrates into the alluvium along the stream channels.
The alluvial fan from the Final Mountains is unsorted detrital material and generally yields only small quantities of water to wells. In the alluvial fan at the base of the Final Mountains, the water bearing capacity of the alluvium significantly increases where the alluvium thickens along the major tributaries. The alluvial fan from the Globe Hills, however, includes many channels and lenticular beds of sand and gravel that yield water easily to wells.
Ground water flows into the alluvium in the Kiser area from smaller bodies of alluvium along Russell Gulch, Bloody Tanks Wash, and Webster Gulch and from the underlying basin fill. Seepage from Webster Lake increased ground-water flow along Webster Gulch into the Kiser area until 1988 when the lake was completely drained. From the Kiser area, ground water flows north along Miami Wash toward the bottleneck.
Ground water in the alluvium along Miami Wash and Final Creek join at the bottleneck where the aquifer is constricted by underlying crystalline rocks. During the wet periods of March to May 1980, February 1983, and December 1986, ground water discharged from the aquifer to Miami Wash in the bottleneck area. During drier periods, however, ground water does not discharge to the surface at the bottleneck. Ground-water flow approaching the bottleneck in wet periods, therefore, can exceed the capacity at the bottleneck. Surface flow at the bottleneck generally returns to the aquifer within a few kilometers.
North of the bottleneck, the alluvium along Final Creek receives subsurface flow from the east along the Apache Peaks alluvial fan and continues to move northward along Final Creek to Inspiration Dam where the aquifer is truncated by dacite. Approximately 9 km north of the bottleneck, ground water discharges to the surface and creates perennial streamflow in Final Creek. Streamflow generally increases until all the water is streamflow at Inspiration Dam. Three sets of streamflow
measurements made since 1984 indicated that flow at the mouth is no greater than that at Inspiration Dam. Assuming that losses to evaporation are insignificant, this means that no significant flow occurs beneath the dam.
On the basis of water-level data, horizontal gradients in the alluvium range from 0.009 m/m between well groups 100 and 300 to 0.007 m/m between well groups 400 and 500. Ground-water velocities were calculated using these gradients and estimated hydraulic conductivities of about 5 m/d. Vertical gradients have also been measured in the USGS monitor-well groups (Eychaner and others, 1989). Concurrent upward and downward vertical gradients in different wells within the same group indicate that the basal boulder zone that has a high hydraulic conductivity intercepts vertical flow and rapidly carries this flow away horizontally.
Vertical gradients change seasonally in magnitude, and vertical-head changes within each well group are normally less than 0.3 m. Vertical gradients in the wells farther from stream channels generally are greater than in wells near the channels. Downward vertical gradients caused by recharge along the stream channels or by a declining water table under dry channels also are indicated by some hydrographs.
Stream-Aquifer Interactions
During January through April, winter rains can cause tributary flow that recharges the regional aquifer in Final Creek basin. The quantity of runoff that enters a particular tributary is a function of altitude and drainage area (table 4). The tributaries that drain altitudes above 2,135 m and, therefore, receive the most snowmelt for a given drainage area are upper Final Creek, Icehouse Canyon, Sixshooter Canyon, Kellner Canyon, and Russell Gulch (table 2). The drainage west of Russell Gulch in the Final Mountain foothills receives runoff from altitudes of as much as 1,830 m. The two main tributaries draining this area, Solitude Gulch and Mud Springs Canyon, are blocked by Solitude tailings pond. Seepage from the pond augments recharge along stream
Hydrologic System 17

Table 4. Drainage areas for major tributaries, Pinal Creek basin, Arizona
_ .. . Total area, in Tributary ' ' square meters
Area above 1,830 meters, in square
kilometers
Area above 2,1 35 meters, in square
kilometersPinal Mountains
Upper Pinal Creek above 1,165 meters......... ................... ............
Bloody Tanks Wash above 1,220 meters .....................................Solitude tailings dam.... ........................................... .....................Kellner Canyon above confluence with Icehouse Canyon ..........Icehouse Canyon above confluence with Kellner Canyon ..........
28.4 26.4 22.8 20.5 13.6 6.6
9.2 7.4
.5
.5 3.1 2.3
2.8 .5 .2
0 1.3
.8Apache Peaks
Nugget Wash above 1,220 meters................................................Negro Wash above 1,200 meters... ...................................... .........Wood Springs Wash above 1,220 meters. ........................ ............
19.7 11.5 22.8
1.3 1.0 0
0 0 0
channels. In wet years, a shallow pond on the dam covers as much as 0.75 km2, but in dry years, the pond disappears.
Inspiration Consolidated Copper Company attempted to correlate water-level changes with aquifer stresses from 1915 to 1945 in the Kiser area (T.A. Conto, written commun., 1988). Records of Cyprus-Miami Mining Corporation (CMMC) contain graphs of ground-water levels and pumpage from the Kiser area (outlined in figure 1), and a graph of monthly precipitation at Miami (fig. 6). Because the water-level graph on figure 6 is a composite of water levels (some are most likely pumping levels) from different wells in different years, and because pumping outside the Kiser area is not shown, the illustration shows only qualitatively the relation of water levels to changes in pumping and precipitation. As figure 6 indicates, water levels generally rose during or following periods of higher-than-normal rainfall or following periods when ground-water withdrawals were minimal. Conversely, water levels declined in response to decreased precipitation, increased pumping, or a combination of the two.
Hazen and Turner (1946, p. 25) made a detailed hydrologic investigation of the upper basin during a period of runoff in April 1945. During this investigation, gains and losses of streamflow were calculated for upper Pinal Creek, Sixshooter Canyon, Icehouse Canyon, Kellner Canyon, and Russell Gulch. From these measurements, the
total flow recharged in the upper basin was about 265 L/s. These measurements were made after a winter-spring period of average precipitation, except for March 1945, which had above-average precipitation.
Turner (1955, p. 6) compared well hydrographs in the foothills of the Pinal Mountains with streamflow in the drainage during 1945 to 1954, which was the worst drought period recorded in Pinal Creek basin (table 1). Water levels in shallow wells near these tributaries responded rapidly to seasonal changes and fluctuated as much as 12 m/yr (fig. 7a, b). Turner's hydrographs show that water levels in wells in the alluvium near the channel rise to the level of the streambed during wet months, maintain this head as the streams are running, and decline sharply in the absence of runoff. Water levels in wells developed in basin fill away from the stream channel have lower heads and do not respond rapidly to seasonal changes (fig. 7c).
During intense precipitation, streamflow typically is uninterrupted from the Pinal Mountains to Inspiration Dam. In March 1985, streamflows and water levels were measured during continuous flow that began in December 1984 and ended in March 1985. Streamflow measurements during this period of flow showed that a loss of 140 L/s occurred in Miami Wash north of the confluence of Russell Gulch and Bloody Tanks Wash (table 5; fig. 8). At the bottleneck, Pinal Creek gained 110 L/s, possibly as a result of a constriction of the
18 Hydrogeology and Hydrologic System of Pinal Creek Basin, Gila County, Arizona

CO DC LU
-fu_UJCC
cr^ 15
25
LiJw 30
1915 1920 1925 1930 1935 1940 1945
W 1915 1920 1925 1930 1935 1940 1945
OpcoSDC
80
60
LJJ 40 act
20
1915 1920 1925 1930
YEAR
1935 1940 1945
Figure 6. Water levels and ground-water withdrawals in the Kiser area and precipitation at Miami, Arizona, 1915-44.
Hydrologic System 19

10
g 15
(D-1-15)13bda
(D-1-15)13bab
1945 1946 1947 1948 1949 1950 1951 1952 1953 1954
a 02 < _J
ou 5CO
tr uu
10
B
> 15uu_J
tr LUi-< n
5
10
15
20
25
30
1945 1946 1947 1948 1949 1950 1951 1952 1953 1954
(A-1-15)36bda
1945 1946 1947 1948 1949 1950 1951 1952 1953 1954
YEAR
Figure 7. Measured water-level changes in the foothills of the Final Mountains, Arizona, 1945-54 (Turner, 1955). A, Wells in alluvium 200 feet from channel in Sixshooter Canyon. B, Wells in alluvium 50 feet from channel in Icehouse Canyon. C, Wells in basin fill 1,500 to 1,800 feet from channel in Icehouse Canyon. (See well locations on plate 1.)
20 Hydrogeology and Hydrologic System of Final Creek Basin, Gila County, Arizona

Table 5. Streamflow measurements and estimates, Final Creek basin Arizona, 1984-87
Date
Streamflow at measurement sites, in liters per second
Russell Gulch
1
Bloody Tbnks Wash
2 3
Miami Wash
4
Seepage ditch
5 6
Pinal Creek
7 8 9 10 11 12 13 14
09-06-84
01-09-85
02-14-8503-01-85
03-19-85
04-07-85
04-08-85
05-07-8506-06-85
06-25-85
07-10-85
08-05-85
08-28-85
08-29-85
09-09-85
10-07-85
11-01-85
11-04-85
11-20-85
12-04-85
12-10-85
12-11-85
12-16-85
01-06-86
02-07-86
170 425260.1
MF
28
3
30
0
0
0
0
0
0
0
0
0
0
.14 30
.28 127
0
<15
F228.1
M
F
<30
0
00
0
0
0
0
0
0
0
0
0
0
0
0
85(0)
<30
0
>565
355359.4
M
<60
15
4235
15
42
35
F
2.8M30
30
<3
15
F
30
F
70(0)
30
20
<15
>280
F 255 F50.6 101.0 138.4MM M
F F
F F F 0
0
00
<30 00
0
0
F F 0 0
7.4 17.5 0M M
0
0
55 F 0
55 0
F F 0 0
70 0
F F
85 170 0
85 140 0
70 0
50 0
0
1.415P
625.4M
<140
15
5057
30
35
0
0
0
0
0
0
0
0
0
0
0
0
0.06
622.6M
42
4250
15
30
35
0
9.0M0
0
0
0
0
0
0
0
0
0 226 D
1,415D
1,130684.9 684.9 877.3
M M M849
D594
D42 594
D42 45328 280
D15 209
D
50 224D
0 195D
0 13.3 216.5 186.5M MM
0 195D
0 209D
0 272D
274D
0 274D
274D
0 209D
0 195D
195D
F 181D
0 238D
0 255D
Hydrologic System 21
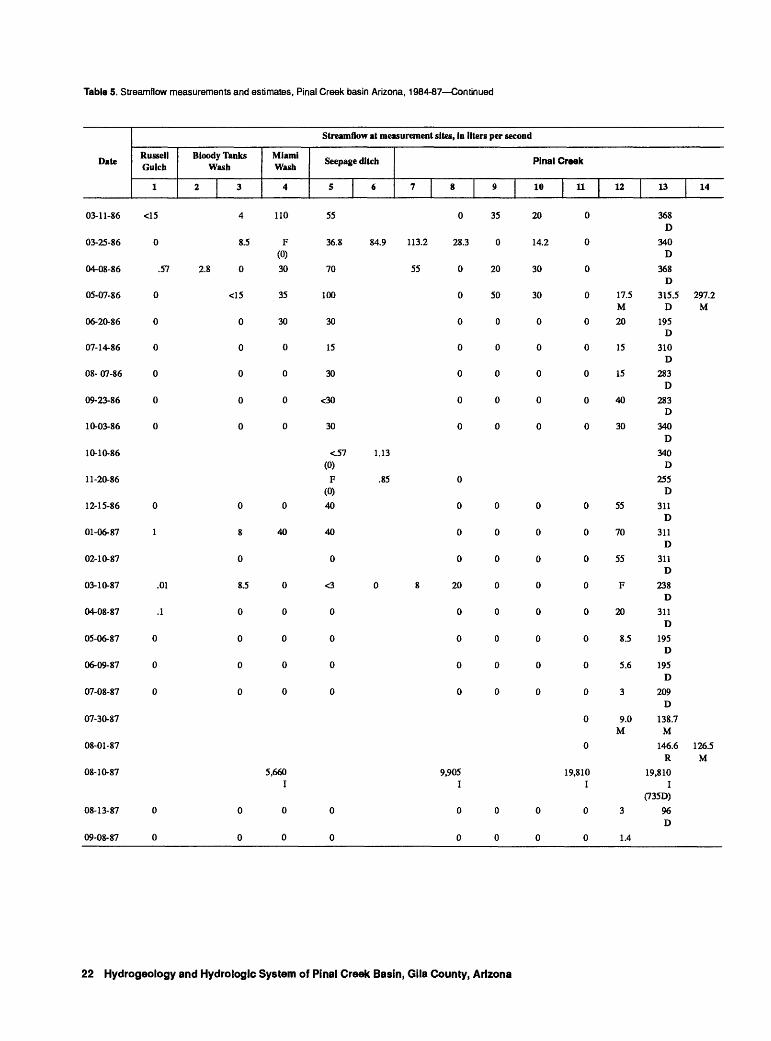
Table 5. Streamflow measurements and estimates, Final Creek basin Arizona, 1984-87 Continued
Date
Streamflow at measurement sites, In liters per second
Russell Gulch
1
Bloody Tanks Wash
2 3
Miami Wash
4
Seepage ditch
5 6
Pinal Creek
789 10 I 11 12 13 1 14
03-11-86
03-25-86
04-08-86
05-07-86
06-20-86
07-14-86
08- 07-86
09-23-86
10-03-86
10-10-86
11-20-86
12-15-86
01-06-87
02-10-87
03-10-87
04-08-87
05-06-87
06-09-87
07-08-87
07-30-87
08-01-87
08-10-87
08-13-87
09-08-87
<15 4 110
0 8.5 F(0)
.57 2.8 0 30
0 <15 35
0 0 30
0 00
0 00
0 00
0 00
0 00
1 8 40
0
.01 8.5 0
.1 00
0 00
0 00
0 00
5,660I
0 00
0 00
55
36.8
70
100
30
15
30
<30
30
<57(0)
F(0)
40
40
0
<3
0
0
0
0
0
0
0
84.9 113.2 28.3
55 0
0
0
0
0
0
0
1.13
.85 0
0
0
0
0 8 20
0
0
0
0
9,905I
0
0
35
0
20
50
0
0
0
0
0
0
0
0
0
0
0
0
0
0
0
20
14.2
30
30
0
0
0
0
0
0
0
0
0
0
0
0
0
0
0
0
0
0
0
0
0
0
0
0
0
0
0
0
0
0
0
0
0
0
19,810I
0
0
17.5M
20
15
15
40
30
55
70
55
F
20
8.5
5.6
3
9.0M
3
1.4
368D
340D
368D
315.5D
195D
310D
283D
283D
340D
340D
255D
311D
311D
311D
238D
311D
195D
195D
209D
138.7M
146.6R
19,810I
(735D)
96D
297.2M
126.5M
22 Hydrogeology and Hydrologic System of Pinal Creek Basin, Gila County, Arizona

110°55'
33°35'
EXPLANATION
INTERMITTENT STREAM
4 STREAMFLOW-MEASUREMENT SITE
Pringle diversion pumping station
BOUNDARY OF AQUIFER
Base from U.S. Geological Survey, 1:24,000; Globe, 1945, Rockingstraw Mtn., 1986, Salt River Peak, 1986, and Inspiration, 1945
3 KILOMETERS
Figure 8. Streamflow-measurement sites, Final Creek basin, Arizona, 1985-87.
Hydrologic System 23

aquifer. Flow in Final Creek gradually increased by 55 L/s from the bottleneck to the head of perennial flow, and then gained 200 L/s between well group 500 and Inspiration Dam.
The peak flows of December 1984 represent mostly surface-water runoff after Globe had received 13.3 cm of precipitation and Miami received 15.4 cm of precipitation in the last week of the month. In the last 5 days of December 1984, outflows at Inspiration Dam averaged 7,600 L/s. Because of recharge to the aquifer, monthly mean discharge at Inspiration Dam continued to rise through February 1985 and did not return to normal until May 1985 (fig. 9). The maximum monthly mean discharge of about 1,200 L/s occurred in February 1985 and corresponds to the highest water-level peaks in all well groups except well group 500 (fig. 10).
Water levels in wells along Miami Wash and lower Final Creek (fig. 10) peaked during the winter and spring of 1984-85, when 68 cm and 92 cm of precipitation fell during June 1984 to May 1985 in Globe and Miami, respectively. This 12- month period was the wettest in the basin since August 1940 to July 1941 (table 1). Hydrographs of well groups 50 and 100 differ from those for well groups 200 and 400 because the latter groups are closer to the stream channel. Water levels peaked
in well groups 200 and 400 during March 1985 because of continued runoff in the channel of Final Creek, whereas water levels in well groups 50 and 100 peaked in January 1985. Following the peak in winter and spring of 1984-85, water levels generally declined in the aquifer. During 1985- 87, most of the decline was the result of the release of ground water from storage that accumulated during the peak of 1984-85. In 1987, water levels began to decline at a greater rate because (1) withdrawals of water from the plume increased; (2) precipitation was less than normal; and (3) draining of Webster Lake from 1986-88 removed a significant source of water to the aquifer.
Hydrographs for well groups 200 and 400 exhibited sharp peaks during the flow in the spring of 1985. Abrupt rises in water levels caused by recharge become attenuated as this water moves away from the point of recharge. As a result, hydrographs from wells in well groups 50,100, and 300, which are farther away from the stream channel than well groups 200 and 400, exhibit relatively gradual water-level rises. Although well group 500 is near the stream, water levels are fairly constant because of the proximity to the head of perennial flow. Evapotranspiration causes small, seasonal variations in water levels in well
1,000
o o$ 800DC ULJ Q.
600
LU
1 400
I O CO Q
ULJ DC
CO
200
1980 1981 1982 1983 1984 1985 1986 1987 1988 1989YEAR
Figure 9. Monthly mean discharges at Final Creek at Inspiration Dam near Globe, Arizona, 1980-89.
24 Hydrogeology and Hydrologic System of Final Creek Basin, Gila County, Arizona

oLL DC
CO
Q
O_iLU CO
CO DC UU\-uu
UU>UJ
DC UJ
0
2
4
6
8
10
12
14
0
2
4
6
8
10
12
14
16
0
2
4
6
8
10
12
14
16
18
WELL GROUP 50___i_____i_____i1984 1985 1986 1987 1988 1989
105
107
WELL GROUP 100____I_______I______I
1984 1985 1986 1987 1988 1989
Ah 202 \/ \ ,\
N'\
201
WELL GROUP 200
1984 1985 1986 1987 1988 1989
YEAR
0
2
4
6
8
10
12
14
WELL GROUP 300____I______I______I I______I
1984 1985 1986 1987 1988 1989
403U 402
10
12
i l i l r
WELL GROUP 400I______|______I
1984 1985 1986 1987 1988 1989
,'504
WELL GROUP 500____I______|________I
1984 1985 1986 1987 1988 1989
YEAR
Figure 10. Measured water-level changes in selected wells near Final Creek, Arizona, 1984-89.
Hydrologic System 25

group 500. During the summer months, small declines occur as transpiration from phreatophytes is at a maximum.
During the spring of 1989, streamflow in the foothills of the Final Mountains was measured following a drier-than-normal winter. During this period, snowmelt runoff was contributing flow to the tributaries that drain the highest altitudes. Streamflow measured in each of the tributaries was about 5 L/s, and total streamflow was about 30 L/s. This streamflow infiltrated into the alluvium along the drainage and disappeared shortly after reaching the southern contact between the basin fill and the underlying rocks of the Final Mountains.
Throughout much of the year, Final Creek basin commonly has no streamflow except north of well group 500, where Final Creek flows perennially. The location of the head of perennial flow migrates in response to water-table fluctuations. Except for occasional periods of high runoff, the discharge measured at Inspiration Dam represents discharge of the remaining ground water from the aquifer.
Regional Ground-Water BudgetA water budget is an accounting of inflows and
outflows in a hydrologic system. Ideally, such a budget will account for all significant inflows and outflows, which in this case include stream leakage, sewage releases, evapotranspiration, underflow, and pumpage.
Water-budget components were estimated by averaging measured and estimated fluxes during a 4-year period ending in September 1984. The basin was not in hydrologic equilibrium during this time, however, because precipitation in the basin was about 15 percent above normal and water levels in monitor wells rose during that period (fig. 11). In general, water levels in wells in the alluvium are usually rising or declining, which indicates that the basin is rarely or never in a state of equilibrium.
InflowInflows to the regional aquifer include
streamflow infiltration in major drainages in the foothills of the Final Mountains and the mountains
north of Globe and sewage releases to Final Creek north of Globe (table 6). Until it was drained in 1988, seepage of water from Webster Lake also contributed inflow through the alluvium in Webster Gulch.
Seepage into the aquifer from Webster Lake was estimated by calculating the ground-water flow in Webster Gulch on the basis of lake altitudes, water levels in Webster Gulch, and an estimated hydraulic conductivity for the alluvium in Webster Gulch. The estimate was constrained through the use of stable-isotope ratios from the lake water and from ground water from well groups 100 and 300 (J.H. Eychaner, hydrologist, U.S. Geological Survey, written commun., 1989). Seepage from the lake into alluvium in Webster Gulch was estimated to be 155 L/s (table 6).
Sewage effluent is discharged into the bed of Final Creek north of Globe. Records indicate that the effluent averaged 40 L/s and varied less than 15 percent in response to changes in precipitation.
A minimum estimate of natural streamflow infiltration and areally distributed recharge was made by subtracting the total of other sources of
Table 6. Annual ground-water budget for Final Creek basin, Arizona, August 1980 to September 1984
[>, greater than]
Water-budget elements
Inflow
Sewage effluent... ...................................
Webster Lake .........................................
Natural stream leakage and areally distributed recharge. ........................... ..
Total inflow............ .............................
Outflow
Withdrawals by wells1 . ..........................
Withdrawals of "west-side" water from
Evapotranspiration......... ........................
Discharge to perennial reach .................
Rate, in liters per second
40
155
>277
>472
166
13
53
240
472
-water diversions at Pringle.
26 Hydrogeology and Hydrologic System of Pinal Creek Basin, Gila County, Arizona

DC
(0
Q
LU CO
LUI- Ul
SUJ
DC UJ
I
10
15
20
25
30
I I I I I I I I I I I I I I I I T
(A-1-15)9aad2 O O
O O
J____I____I____I____I____I____I____I____|____I____I____I____I
O
I____I____I
1975 1980 1985 1990
10
12
l I I I I I I I I I I I I I I I I
(D-1-15)13bda
O
O
I____I____I____I____I____I____I____I J____I____I____I____I____I____I
O -
1975 1980 1985 1990YEAR
Figure 11. Measured water levels in index wells, Final Creek basin, Arizona, 1975-92.
Hydrologic System 27

ground-water inflow from total ground-water outflow. The difference of 277 L/s was con sidered to be a minimum because during the budget period water levels were rising, which indicates that during this time inflows exceeded outflows.
Outflow
Ground-water outflows include discharge to Final Creek, ground-water withdrawals, and evapotranspiration. Ground-water discharge to Final Creek was calculated from streamflow records of Final Creek at Inspiration Dam, and included only periods when the creek was at base flow. Daily flows that exceeded 1,415 L/s were excluded because larger flows were considered to include a significant surface-water runoff com ponent. From August 1980 to September 1984, the calculated ground-water discharge was 240 L/s. In February 1988, ground-water dis charge to Final Creek was estimated to be 278 L/s following a period of heavier-than-normal precipi tation. During April 1989, which followed a relatively dry winter and early spring, average ground-water discharge to Final Creek was 210 L/s.
Ground water is withdrawn from the alluvium for industrial use at Pringle Pump Station, about 1.5 km upstream from Inspiration Dam (table 7). Surface water also is diverted at Pringle and pumped back up through the valley for use at the mines. Available pumpage information for Pringle combines ground-water withdrawals and surface-water diversions. Under natural con ditions, both the surface water diverted and ground water pumped from alluvium at Pringle would leave the basin as streamflow at Inspiration Dam.
Water is withdrawn from wells in Riser basin for industrial use. Water is withdrawn for industrial and public-supply use from the alluvium adjacent to Russell Gulch; from alluvium, basin fill and underlying limestone just south of the confluence of Final Creek and Miami Wash; and from near the toe of the Solitude tailings pond. Water for the residents of Miami is withdrawn from basin fill; Globe residents are supplied from a well field in Cutter basin to the east.
In the Old Dominion Mine, water from the basin fill enters the west side of the mine through fractures in underlying dacite. On the basis of incomplete records, flow of "west-side" water into the mine ranges from 6.3 to 15.8 L/s and may vary in response to seasonal phenomena such as amount of rainfall (Bob Peeples, engineer, Magma Mining Co., oral commun., 1993). Rainfall for August 1980 to September 1984 was 15 percent more than normal. How of water from basin fill into the mine, therefore, was estimated to be 13 L/s, or 15 percent more than the average of the observed range in flow. Total withdrawals from the aquifer (but including surface water diversions at Pringle) in the basin averaged about 179 L/s from August 1980 to September 1984.
Evapotranspiration estimates for phreato- phytes near the perennial-flow reach of Final Creek were made using the equation developed by Blaney and Griddle (1950):
U = KF, (3) where
U - consumptive-use rate or evapotrans piration,
K = empirical consumptive-use coeffi cient that is dependent on the spe cies of vegetation, and
F - climatic factor derived by multiply ing the mean monthly temperature in degrees Fahrenheit (7) by the monthly percentage of total daytime hours in the year (/>); F = (rX/>)/100.
Table 7. Ground-water withdrawals by area within Final Creek basin, Arizona, August 1980 to September 1984
Area of withdrawal Rate, in liters per second
Pringle1 ........................................................ 90Kiser............................................................. 30
Russell Gulch south of State Highway 88 ... 9Solitude tailings dam ................................... 1Other............................................................ 36Old Dominion.............................................. 13
Total ................................................... 179
-water diversions at Pringle.
28 Hydrogeology and Hydrologic System of Pinai Creek Basin, Gila County, Arizona

F values were calculated using monthly mean temperatures from the Miami weather station and interpolated P values at 33 percent from Cruff and Thompson (1967, p. M17). The consumptive-use coefficients (K), for cottonwood and mesquite were from Rantz (1968, p.D10-D12). Maximum K values were used to estimate the upper limit of evapotranspiration rates (table 8).
Maximum evapotranspiration occurs when the water table is at the ground surface and decreases with depth. From October 1,1943, to September 22, 1944, in Safford Valley, cottonwoods used 2.3 m of water where the water table was estimated to be at 2.1 m; and mesquite used 0.9 m of water where the water table was estimated to be at 3.0 m (Gatewood and others, 1950, p. 138). Robinson (1958, p. 62) reported that the maximum depth from which cottonwoods obtain water is probably about 9 m. On the basis of this information, negligible evapotranspiration was assumed to occur when water levels were more than 10m below land surface.
From natural-color aerial photographs at 1:15,000, mesquite and cottonwood stands were mapped and classified as dense, medium, and light coverage. As described by the U.S. Bureau of Reclamation (1973), density factors were then multiplied by the area of each category:
Category
Light................
Density factor, in percent
100350
The total areas of mesquite and cottonwood near the perennial reach were estimated to be 1,404,950 m2 and 93,630 m2, respectively, after adjusting for the density factors. Computed evaporation rates for each plant (table 8) were multiplied by the appropriate area to obtain an estimate of evapotranspiration for the area covered by each. Total evapotranspiration for the basin is estimated to be 53 L/s.
Water UseThe principal water users in Final Creek basin
are CMMC, Pinto Valley Division (PVD) of Magma Copper Company, city of Globe, and
Arizona Water Company, which supplies water to residents of Miami and Globe. Other commercial and domestic uses account for a small part of the total water consumption in the basin.
Although CMMC owns about 40 wells in the basin, their major source of water for industrial use is Pringle Pump Station about 1.5 km upstream from Inspiration Dam. At Pringle, both surface water and ground water are withdrawn from Pinal Creek and the alluvium. Pringle Pump Station was installed in about 1940 to replace the water supply from the Kiser area that had become contaminated with acidic water. In the 1980's, five wells in the Kiser area also were used by CMMC periodically for water supply.
In 1987, CMMC began pumping and treating contaminated ground water from new production wells in the Kiser area. As of June 1989, a total of seven production wells had been installed for pumping and treating ground water in the Kiser area. In addition, four wells were installed in Webster Gulch to intercept contamination from Webster Lake. In 1989, CMMC rehabilitated the inactive Fodera well field and Burch Shaft to pump contaminated water. As part of the remediation program, 27 monitoring wells were installed to sample ground water and measure water levels.
PVD owns about 30 wells, and most of the water used in their operations is pumped from four main areas: (1) Old Dominion Mine from which water is withdrawn for commercial use; (2) alluvium near Miami Gardens; (3) alluvium, basin fill, and underlying limestone just south of the confluence of Pinal Creek and Miami Wash; and (4) near the toe of the Solitude tailings pond. The city of Globe and Arizona Water Company are the major utilities providing water to the residents in the basin. In the late 1950's, the city of Globe installed a well field about 3.2 km east of Pinal Creek in Cutter basin (fig 1). As of 1989, Globe supplied its residents from Cutter basin and did not use the city wells in Pinal Creek basin. Although the city of Globe does not withdraw water from Pinal Creek basin, the city discharges an average of 40 (but sometimes as much as 60) L/s of sewage effluent into Pinal Creek 3 km north of the city limits. The Arizona Water Company operates 12 wells that are completed in basin fill and supplies residents in the Miami area. Flow rates
Hydrologic System 29

Table 8. Evapotranspiration estimates for cottonwood and mesquite, Final Creek basin, Arizona
[Evapotranspiration estimated using equation of Blaney and Griddle (1950)]
Month
Tem pera
ture, in degreesFahren
heit
Annualdaytime hours, inpercent
Climatic factor1
Cottonwood
Maximum consumptive-
usecoefficient2
Evapo trans
piration,in meters
Mesquite
Maximum consumptive-
usecoefficient2
Evapo trans
piration,in meters3
January ........ .February.......March .......... .April. ........... .May ..............June..............July...............August. .........September .... October.........November..... December.....
Annual..........
444
48.553.761.469.979.683.681.176.8 66.053.3 46.2
7.156.948.368.789.689.659.829.308.35 7.927.06 6.99
100.00
3.183.374.495 39
6.777.688.217546.41 523
3.76 3.22
65.25
001.71.71.71.71.71.71.7 1.71.7 0
0 00 0
.19 .8
.23 .8
.29 .8
.33 .8
.35 .8
.32 .8
.28 .8
.22 .8
.16 .8 JKj 0
237
00
.09
.11
.14
.16
.17
.15
.13
.11
.08 ,00
1.03
1Climatic factor is derived by multiplying the mean monthly temperature in degrees Fahrenheit (T) by the monthly percentage of total daytime hours in the year (P); therefore, F = (7)(P)/100.
2Empirical consumptive-use coefficient that is dependent upon the species of vegetation. For Final Creek basin, cotton woods and mesquite are bare from December through February; therefore, the consumptive-use coefficient was assumed to be zero for these months.
Product of climatic factor and maximum consumptive-use coefficient multiplied by 0.025 to convert from inches to meters.
from these deep wells range from about 2 to 13 L/s and average 5 L/s (J. Dexel, manager, Arizona Water Company, Miami, written commun., 1989).
SUMMARY
Mining activities in Final Creek basin have created a plume of acidic water in the alluvial aquifer and in Final Creek. The basin is bounded by the Final Mountains, Apache Peaks, and the Globe Hills. These surrounding mountains are drained by Final Creek, which flows ephemerally in the southern part of the basin until it emerges as a perennial stream in the northern 5.5 km of the basin. Final Creek flows northward and empties into the Salt River. The climate in the region is mild and arid.
Topography of the study area is typical of that in the Basin and Range physiographic province. North- to northwestward-trending mountain ranges surround the alluvial basin. A thick sequence of basin fill was deposited in the
trough between mountain ranges, and unconsolidated alluvium overlies this basin fill along the drainage. Alluvium and basin fill constitute the primary aquifer in the basin, and many wells have been completed in this aquifer. Principal users of the ground water are the mining companies and the communities of Globe and Miami.
Water levels in the aquifer have been influenced mainly by extended periods of runoff in the basin and variable rates of ground-water pumping. Water levels respond rapidly to these stresses, and fluctuations of as much as 25 m in 6 months have been measured. The hydraulic properties of the alluvium control aquifer responses to these stresses. In the alluvium, horizontal hydraulic conductivities were estimated to range between 150 and 200 m/d. Hydrographs of water levels measured in monitoring wells indicate that water levels were near record highs during spring 1985 and declined as much as 13 m by spring
30 Hydrogeology and Hydrologic System of Final Creek Basin, Glla County, Arizona

1989. Measured hydraulic gradients indicate that flow is generally upward from the basin fill to the alluvium.
Seepage from Webster Lake of 155 L/s and streamflow infiltration of more than 277 L/s were the two largest sources of inflow to the regional aquifer from August 1980 to September 1984. Significant outflows from the aquifer were pumpage of 166 L/s and ground-water discharge to Final Creek of 240 L/s.
REFERENCES CITED
Beckett, P.O., 1917, The water problem at the Old Dominion Mine: American Institute of Mining Engineers Transactions, v. 54, p. 35-66.
Blaney, H.F., and Criddle, W.D., 1950, Determining water requirements in irrigated areas from climatological and irrigation data: U.S. Depart ment of Agriculture, Soil Conservation Service, Technical Paper 96,48 p.
Central Arizona Association of Governments, 1983, Past and current major mining operations in the Globe-Miami area: Florence, Arizona, Central Arizona Association of Governments, Mineral Extraction Task Force Report METF-2,106 p.
Cooper Aerial Survey Company, 1988, Pinal Creek project aerial photographs, December 14: Clay- pool, Arizona, Cyprus Miami Mining Corporation, 121 photographs, scale 1:13,000.
___1989, Pinal Creek project topographic maps: Claypool, Arizona, Cyprus-Miami Mining Corporation, 121 photographs, scale 1:13,000.
Cruff, R.W., and Thompson, T.H., 1967, A comparison of methods of estimating potential evapotranspiration from climatological data in arid and subhumid environments: U.S. Geological Survey Water-Supply Paper 1839-M, 28 p.
Envirologic Systems, Inc., 1983, Mining activities and water quality report: Florence, Arizona, Central Arizona Association of Governments, Mineral Extraction Task Force Report METF-7,142 p.
Eychaner, J.H., 1988, Evolution of acidic ground-water contamination in a copper-mining area in Arizona, in Computer Methods and Water Resources Water Quality Planning and Management: Rabat, Morocco, First International Conference Pro ceedings, September 1988, v. 6, p. 291-302.
Eychaner, J.H., 1989, Research activities related to acidic water near Globe, Arizona, in Mallard, GJE.,
and Ragone, S.E., eds., U.S. Geological Survey Toxic Substances Hydrology Program Proceedings of the Technical Meeting, Phoenix, Arizona, September 26-30: U.S. Geological Survey Water-Resources Investigations Report 88-4220, p. 599-601.
_ 1991, The Globe, Arizona, research site Contaminants related to copper mining in a hydrologically integrated environment, in Mallard, GJE., and Aronson, D.A., eds., U.S. Geological Survey Toxic Substances Hydrology Program Proceedings of the Technical Meeting, Monterey, California, March 11-15, 1991: U.S. Geological Survey Water-Resources Investigations Report 91-4034, p. 439-447.
Eychaner, J.H., and Stollenwerk, K.G., 1985, Neutralization of acidic ground water near Globe, Arizona, in Schmidt, K.D., ed., Ground-Water Contamination and Reclamation: Bethesda, Maryland, American Water Resources Association Technical Publications Series TPS 85-2, p. 141-148.
__ 1987, Acidic ground-water contamination from copper mining near Globe, Arizona, in Franks, B.J., ed., U.S. Geological Survey Program on Toxic Waste, Ground-Water Contamination, Pro ceedings of the Third Technical Meeting, Pensacola, Florida, March 23-27, 1987: U.S. Geological Survey Open-File Report 87-109, p. D-13toD-24.
Eychaner, J.H., Rehmann, M.R., and Brown, J.G., 1989, Chemical, geologic, and hydrologic data from the study of acidic contamination in the Miami Wash-Pinal Creek area, Arizona, water years 1984-87: U.S. Geological Survey Open-File Report 89-410,105 p.
Faires, L.M., and Eychaner, J.H., 1991, Trace element trends at Pinal Creek, Arizona, in Mallard, G.E., and Aronson, D.A., eds., U.S. Geological Survey Toxic Substances Hydrology Program Proceedings of the Technical Meeting, Monterey, California, March 11-15, 1991: U.S. Geological Survey Water-Resources Investigations Report 91-4034, p. 461-465.
Freethey, G.W., Pool, D.R., Anderson, T.W., and Tucci, Patrick, 1986, Description and generalized distribution of aquifer materials in the alluvial basins of Arizona and adjacent parts of California and New Mexico: U.S. Geological Survey Hydrologic Investigations Atlas HA-663,4 sheets.
References Cited 31

Gatewood, J.S., Robinson, T.W., Colby, B.R., Hem, J.D., and Halpenny, L.C., 1950, Use of bottom-land vegetation in Lower Safford valley, Arizona: U.S. Geological Survey Water-Supply Paper 1103, 210 p.
Gilkey, M.M., and Beckman, R.T., 1963, Water requirements and uses in Arizona mineral industries: U.S. Bureau of Mines Information Circular 8162,97 p.
Haschenburger, J.K., 1989, Manganese in channel sediments of Final Creek, Arizona, in Mallard, G.E., and Ragone, SJE., eds., U.S. Geological Survey Toxic Substances Hydrology Program Proceedings of the Technical Meeting, Phoenix, Arizona, September 26-30,1988: U.S. Geological Survey Water-Resources Investigations Report 88-4220, p. 593-597.
Harshbarger, J.W., 1969, Availability and development of ground water in Miami-Globe Area, Arizona: Claypool, Arizona, Inspiration Consol- dated Copper Corporation report, 12 p.
Hazen, GJE., and Turner, SP., 1946, Geology and ground-water resources of the upper Pinal Creek area, Arizona: U.S. Geological Survey open-file report, 55 p.
Heindl, L.A., 1958, Cenozoic alluvial deposits of the Upper Gila River area, New Mexico and Arizona: Tucson, University of Arizona, doctoral dissertation, 249 p.
Honeyman, P.D.I., 1954, The "new look" at Inspiration: Mining Congress Journal, v. 40, no. 9, September, p. 30-32, and 72.
Hydro Geo Chem, 1989a, Results and interpretation of aquifer test in Kiser basin near Miami, Arizona: Claypool, Arizona, Cyprus Miami Mining Corporation report, 60 p.
___1989b, Results and interpretation of step drawdown tests along Pinal Creek near Miami, Arizona: Claypool, Arizona, Cyprus Miami Mining Corporation report, 27 p.
Kiven, C.W., and Ivey, J.B., 1981, Geology of the Pinal and Pinto Creek drainage basins, Gila, Pinal, and
Maricopa Counties, Arizona: Florence, Arizona, Central Arizona Association of Governments, Mineral Extraction Task Force Report METF-4, 64 p.
Peterson, N.P., 1962, Geology and ore deposits of the Globe-Miami District, Arizona: U.S. Geological Survey Professional Paper 342,151 p.
Ransome, L.F., 1903, Geology of the Globe copper district, Arizona: U.S. Geological Survey Professional Paper 12,168 p.
Rantz, S£., 1968, A suggested method for estimating evapotranspiration by native phreatophytes, in Geological Survey Research, 1968: U.S. Geological Survey Professional Paper 600-D, p. D10-D12.
Robinson, T.W., 1958, Phreatophytes: U.S. Geological Survey Water-Supply Paper 1423,84 p.
Rouse, J.V., 1981, Geohydrology of the Globe-Miami area: Florence, Arizona, Central Arizona Association of Governments, Mineral Extraction Task Force Report METF-5,103 p., 1 sheet.
__ ed., 1983, Water quality report for the Globe-Miami area: Florence, Arizona, Central Arizona Association of Governments, Mineral Extraction Task Force Report METF-6, v. 1,163 p. v. 2,258 p.
Timmers, Jake, 1986, Response to finding of violation and order IX-FY86-78: Inspiration Consolidated Copper Company letter to U.S. Environmental Protection Agency, Water Management Division, August 27,44 p.
Turner, SP., 1955, Status of ground-water resources in the Globe area, Arizona: City of Globe report, 9 p.
Wilson, E.D., Moore, R.T., and Pierce, H.W., 1959, Geologic map of Gila County, Arizona: University of Arizona, Arizona Geological Survey, 1 sheet
32 Hydrogeology and Hydrologic System of Pinal Creek Basin, Gila County, Arizona