hydrogeological studies for the in-situ leach field test ... bromide tracer test ... figure 7....
TRANSCRIPT

Draft
Hydrologic Field Test 1
Hydrogeological Studies For the In-Situ Leach Field Test at Florence, Arizona
Table of Contents
1. ABSTRACT ......................................................................................................................................... 2
2. INTRODUCTION............................................................................................................................... 3
3. GEOLOGY .......................................................................................................................................... 7
4. REGIONAL HYDROGEOLOGY .................................................................................................... 9
5. WELLFIELD DESRIPTION AND WELL CONSTRUCTION ....................................................10
6. HYDROGEOLOGIC TESTS ...........................................................................................................13
6.1 INTERFERENCE PUMPING TESTS ........................................................................................................13
6.2 TRACER TESTS .................................................................................................................................14
6.2.1 Water Injection Test ...............................................................................................................14
6.2.2 Bromide Tracer Test ..............................................................................................................15
7. INTERPRETATION OF HYDROGEOLOGIC TESTS ...............................................................20
8. NUMERICAL PREDICTION PRIOR TO THE LEACH TEST ..................................................26
9. FIELD LEACH TEST .......................................................................................................................28
9.1 FIELD TEST RESULTS ........................................................................................................................28
9.2 HYDRAULIC CONTROL .....................................................................................................................31
9.3 POND EVAPORATION ........................................................................................................................31
9.4 ELECTRIC RESISTANCE TOMOGRAPHY .............................................................................................35
9.5 RECLAMATION TESTS ......................................................................................................................35
10. CONCLUSIONS ................................................................................................................................37
11. RECOMMENDATIONS FOR FUTURE STUDIES ......................................................................38
SWVP-022556
SWVP-0596

Draft
Hydrologic Field Test 2
LIST OF FIGURES
Figure 1. Schematic draw of in situ leaching system. ........................................................ 4
Figure 2. Location of Florence In Situ Project. .................................................................. 5
Figure 3 Well layout in the field leach test. ....................................................................... 6
Figure 4. Geologic east-west cross section at 745700N. ................................................... 8
Figure 5. Location of the pre-leaching test. ..................................................................... 11
Figure 6. The design of wells. .......................................................................................... 12
Figure 7. Theis-type curve analysis for BHP-1 in BHP-5 pumping test. ........................ 14
Figure 8 Wellfield setup for the water injection test........................................................ 15
Figure 9. Relative concentrations of sulfate in recovery wells in water injection tests. .. 16
Figure 10. Relative Br concentration vs. time curves ...................................................... 17
Figure 11. Diagram representation of Br percentage reaching pumping wells ............... 19
Figure 12. Field drawdown curves and the calibrated drawdown curves for the BHP-9
pumping test. ............................................................................................................. 22
Figure 13. Calibrated results of hydraulic conductivity ................................................... 24
Figure 14. Sulfate concentrations of field data and calibration results. ........................... 24
Figure 15. Simulated and measured Bromide concentrations in BHP-6, BHP-7, BHP-8,
and BHP-9 ................................................................................................................. 25
Figure 16. Plan view of concentration spreading within the first mining block after 10
and 365 days. ............................................................................................................ 27
Figure 17. Vertical concentration profile from a cross section between injection wells
BHP-6 and BHP-8, and production wells BHP-1, BHP-10, and BHP-12 after one
year. Each layer represents 20 feet. ......................................................................... 27
Figure 18. Net positive pumping rate. ............................................................................. 29
Figure 19. pH of pumping wells during leaching phase. ................................................. 30
Figure 20. Evaporation rate of the evaporation pond. ..................................................... 31
Figure 21. Copper grade in pregnant solution from BHP-1. ........................................... 32
Figure. 22. Copper grade in pregnant solution from recovery wells. .............................. 33
Figure 23. Water levels in four pair of observations. ...................................................... 34
Figure 24. Conductivity difference from background after one month of acid injection. 36
Figure 25. Sulfate recovery during the leaching and rinsing phases. .............................. 37
SWVP-022557

Draft
Hydrologic Field Test 3
1. ABSTRACT
BHP Copper conducted a field test for the feasibility study of an in situ copper
leaching project near Florence, Arizona. Twenty wells were drilled in five-spot pattern at
a spacing of 50 feet. Hydrologic tests and field measurements were conducted to
understand the hydrologic system. Conceptual and numerical groundwater models were
built. Inverse modeling was used to determine the spatial distributions of hydrologic
parameters. The calibrated model was then used to predict the flow of injected solution
in the field test
The injection of dilute sulfuric acid solution started on Oct. 31, 1997 and stopped
on Feb. 9, 1998. The reclamation started upon the cessation of acid injection. During the
acid injection and reclamation phases, chemical samples were taken on a regular basis.
The water levels and flow rates were recorded to meet environmental requirements.
Electrical Resistance Tomography was used to monitor the solution flow. All the
information collected was used to understand the hydrogeologic system at the Florence in
situ leach site.
2. INTRODUCTION
BHP Copper is conducting a feasibility study for an in situ copper leaching
project near Florence, Arizona. The design of the in-situ mining process is surface well-
to-well leaching. Dilute sulfuric acid solution is injected into the oxide ore deposit,
which is 400 feet below the ground surface, via injection wells constructed to protect the
regional aquifers, as shown in Figure 1. The solution travels through fractures and
porous spaces in the ore body and reacts with the minerals, mobilizing and transporting
copper in solution. The pregnant solution is then recovered by a series of pumping wells
surrounding the injection wells and sent to the processing plant for copper extraction. The
economic and environmental criteria require the understanding the site hydrologic system
to address the concerns not only of BHP Copper but also of the regulatory agencies.
Specifically, the well injection capacities, flow paths, and solution control need to be
understood.
SWVP-022558

Draft
Hydrologic Field Test 4
Figure 1. Schematic draw of in situ leaching system.
Florence copper deposit is located two miles northwest of Florence, Arizona
(Figure 2). The evaluation of the deposit began in 1969 when regional reconnaissance of
Arizona by the Continental Oil Company (Conoco) led to an examination of potential
copper resource at Florence. Conoco started drilling in March 1970, and by August
1970, core samples from drilling indicated that a potential ore body had been discovered.
A pilot mine and a plant were developed later. However, the project did not go forward
presumably due to a low copper price at the time and the relatively large capital
investment.
Magma Copper Company (now part of the BHP Copper) acquired the property in
July 1992 from Conoco and initiated a pre-feasibility study in January 1993. The study
focused on determining the most appropriate mining technology. The two methods
evaluated were Open Pit mining followed by heap leaching and in situ solution mining,
SWVP-022559

Draft
Hydrologic Field Test 5
Figure 2. Location of Florence In Situ Project.
SWVP-022560

Draft
Hydrologic Field Test 6
either method followed by Solvent Extraction and Electrowinning (SX/EW) to
produce a copper cathode product. The outcome of the study is that stand alone in situ
mining followed by solvent extraction and electrowinning is the technically preferred
method of development for this deposit (RDTG, 1995).
A field leach test was conducted from Oct. 31, 1997 to Feb. 9, 1998 as a part of
the pre-feasibility study. The objectives of the test were three-folds. First, the test was
conducted to verify the ability to operate the wellfield in a manner that met the
environmental requirements for the APP and UIC permits. Second, the test was used to
understand the in situ leach process, primarily the copper recovery curve as a function of
time. The test was also conducted to prove the ability to reclame. Twenty wells were
drilled in a spacing of 71 feet (Figure 3). Prior to the leach test, interference pumping
tests and tracer tests were conducted. Conceptual and numerical groundwater models of
the Florence mine site were built. The inverse modeling was used to determine the
spatial distributions of some hydrologic parameters.
Northowb 2
Observation well
Pumping well
Injection well
owb 5
bhp 12 bhp 10
bhp 13
owb 1owb 3
bhp 2
bhp 3bhp 4
bhp 5
bhp 6
bhp 7
bhp8
bhp 9
bhp 11
bhp 1
ch 2ch1
owb 5
71 ft
50 ft
Figure 3 Well layout in the field leach test.
SWVP-022561

Draft
Hydrologic Field Test 7
The reclamation started upon the cessation of acid injection and is planned to be
completed in the late 1999. During the acid injection and reclamation phases, chemical
samples were taken on a regular basis. Electrical Resistance Tomography was used to
monitor the solution flow. All the information collected was used to understand the
hydrogeologic system at the Florence in situ leach site.
3. GEOLOGY
The Florence deposit is in the Basin and Range Province of southern Arizona, in
the Eloy sub-basin of the Pinal Active Management Area (AMA). The geologic section
in the immediate Florence area is relatively simple in terms of rock types present, but
complicated in terms of structure. The oldest known rock type in the Florence area is a
Precambrian quartz monzonite prophyry of botholithic dimensions. Paleozoic
sedimentary rocks are considered to have overlain this rock originally, but these have
been removed by subsequent erosion. The Precambrian quartz monzonite is intruded by
a granodiorite prophyry of Laramide age. Figure 4 shows a cross section. This intrusive
event was accomplished by the development of extensive fractures which guided the flow
of hydrothermal fluids responsible for formation of the primiary sulfide mineralization at
Florence (see Florence Project Final Pre-Feasibility Report, Section II for detail).
Copper mineralization occurs in strongly faulted and fractured rocks of
Precambrian and Tertiary ages. Depending on copper mineralization, the bedrock is
subdivided into an upper oxide zone and a lower sulfide. The resource classification in
the oxidized portion of the mineralized system yields a total of 321 million tons with
average grades of 0.25% ASCu and 0.37% TCu, which is the leaching target. The sulfide
zone beneath the oxide has more than 1 billion tons of materials averaging 0.287% TCu.
The most structural features in the bedrock are dominated by a series post-mineral
faults. The thickness of these fault zones ranges from a few feet to as much as 50 feet.
Clayey, gaugy, and sheared zones on the fault walls are commonly associated with these
large-scale structural features.
SWVP-022562

Draft
Hydrologic Field Test 8
Figure 4. Geologic east-west cross section at 745700N.
SWVP-022563

Draft
Hydrologic Field Test 9
The rock units in the deposit area are intensely fractured and shattered. The
fracture in diamond core has been geologically logged in great detail. Statistical analysis
shows that there are an average of 11 to 15 fractures per foot compared 6 to 10 fractures
per foot in sulfide zone. The average spacing between fractures in oxide is about 1 inch
and 80% of the spacing less than 2 inch. Fractures in all directions have been found to
have copper mineralization.
4. REGIONAL HYDROGEOLOGY
The Florence oxide deposit is buried under more than 300 ft of post-mineral
cover. The sedimentary overburden material, possibly correlative to the Gila
conglomerate, is of Quaternary age and consists mainly of unconsolidated silt, sand,
gravel, and boulders. The 300 ft basin-fill overburden is divided into three major units:
the Upper Basin-fill Unit (UBFU), Middle Fine-Grained Unit (MFGU), and Lower
Basin-Fill Unit (LBFU). The UBFU is composed of unconsolidated to weakly cemented,
interbedded clay, silt, sand, gravel and boulders. Its thickness ranges from 200 ft to about
500 ft in the mine area. The UBFU is the principal source of groundwater in the area.
The average hydraulic conductivity is about 60 ft/day. The MFGU, underneath the
UBFU, is a layer composed of calcareous silt and clay that is about 20 to 40 feet thick
and has very low permeability. The thickness of the LBFU varies from less than 50 ft on
the east of the mine site to about 800 ft on the west. It consists of weakly to moderately
cemented boulder, gravel, sand, silt and clay. The pumping tests and groundwater
geochemical data indicate that the LBFU and UBFU are hydrologically separated by the
almost impermeable MFGU with conductivity less than 0.001 ft/day. The hydraulic
conductivity of the LBFU is about 5 ft/day, which is one order of magnitude smaller than
the UBFU.
The hydraulic conductivity of the oxide zone varies from 0.1 ft/day to 1.0 ft/day
with a geometric mean of 0.5 ft/day. The pumping tests showed the oxide zone and the
LBFU have direct hydrologic communication. This indicates that the injected solution
could move away from the oxide to the LBFU if solution flow were not controlled. The
sulfide zone is much less permeable compared with the oxide zone. The average
SWVP-022564

Draft
Hydrologic Field Test 10
hydraulic conductivity is about 0.003 ft/day. The sulfide zone has been considered as an
impermeable boundary condition for the oxide aquifer.
The oxide and sulfide zones exist under saturated conditions. Generally,
groundwater in the mine area occurs at an elevation ranging from 1,250 to 1,350 feet
above sea level, which is approximately 100 to 200 feet below land surface. The
groundwater level varies as a function of weather, rainfall, and irrigation use. Generally,
the water level declines in summer and rises in winter.
The measurement of water levels near the mine site suggests that the general
direction of groundwater flow is from southeast to northwest at an approximate gradient
of 0.5 percent. The direction and gradient are caused by groundwater recharge and
withdrawal, and therefore vary with time. The UBFU is recharged primarily by
subsurface flow from the Gila River channel, as well as by percolation from agricultural
water and a small amount of rainfall. Some recharge also occurs as percolation of surface
runoff from the mountains at the basin perimeter. The LBFU is recharged primarily by
subsurface flow originating from the Gila River. The oxide zone is recharged from
LBFU and from subsurface flow under the Gila River. The primary withdrawal in the
area is used for agriculture. Since the early 1980s, the recharge and withdrawal have
been about equal and the water level has been stabilized (Florence PreFeability Report).
5. WELLFIELD DESRIPTION AND WELL CONSTRUCTION
The field test area is located in the southeast corner of the proposed leach zone, as
shown in the Figure 5. The area is selected because it is representative of the leach zone.
Figure 3 shows the wellfield layout. BHP-6 to BHP-9 are the four injection wells
surrounding the center production well, BHP-1. The copper recovery rate obtained from
this test area is believed to simulate the repeated five-spots in the large scale production
and will be used in the final financial analysis. Each of the four injection wells is
surrounded by four production wells in a five-spot pattern. Further out, observation wells
(OWB wells) have been positioned to monitor lateral solution excursion in the Oxide
Unit. Wells OWB2 and was used to monitor the UBFU. Two metallurgical wells were
drilled in between BHP-1 and BHP-6 to sample the solution in between the central
production well and an injection well.
SWVP-022565

Draft
Hydrologic Field Test 11
A universal well (uni-well) design for both injection and production wells was
used. The uni-well design allows easy switching between injection and production wells
to enhance sweep efficiency and to reduce well clogging and precipitation of minerals in
fractures. Figure 6 shows a schematic well design. The well is cased and the annulus is
cemented from the surface to 40 to 60 feet below the top of the oxide. To demonstrate
vertical solution control, annular conductivity devices were installed in the Upper Basin
Fill Unit (UBFU) at injection and production wells. The diameter is six inches wide. A
40 foot buffer zone (or bedrock exclusion zone) is designed to reduce potential solution
excursion into the lower basin-fill unit. The lower portion of the well is an open hole
approximately six inches in diameter. Four-inch or 1 ½ inch PVC screen is installed
inside the open hole. Because solution flowing into wells through fracture rock is very
clean, gravel pack was not used. This design also reduces well clogging due to bacteria
growth in gravel packs. The reverse circulation (RC) drilling method was used. This
technique allows the flexibility of being able to log and sample the drill cuttings for ore
control and to assess qualitatively the hydraulic character of the rock.
P12-O
P13.2-
P15-O
P19.1-
P28.2-
P8.1-O
PW1-
PW2-
PW2-
PW3-
PW7-
OWB
Test area
Figure 5. Location of the pre-leaching test.
SWVP-022566

Draft
Hydrologic Field Test 12
Figure 6. The design of wells.
SWVP-022567

Draft
Hydrologic Field Test 13
6. HYDROGEOLOGIC TESTS
6.1 INTERFERENCE PUMPING TESTS
Pumping tests were conducted in BHP-1, BHP-2, BHP-4, BHP-5, BHP-6, BHP-7,
BHP-8, BHP-9, BHP-10, BHP-11, BHP-12, and BHP-13, respectively. No tests were
conducted in BHP-3 because of time restriction. In each pumping test, the drawdown in
the pumping well and surrounding wells are recorded using In Situ data loggers and PWI
data recorders. The pumping rate in a pumping test was kept constant using PWI
controllers. Each test lasted from one day to three days. The next test started only after
the water levels had been recovered from the previous test. In BHP-6 and BHP-9 tests,
two cycles of pumping and recovery were employed.
Figure 7 is the typical drawdown curves in semi-log plot. The drawdown in all
wells shows a linear relationship in the period of 10 minutes to 1,000 minutes. The
curves flatten in later time because of the inflow leaking from the upper basin-fill aquifer.
All the analytical solutions for leaky aquifers assume that the overlying aquifer is much
less permeable than the tested aquifer. At the Florence site, the overlying basin-fill
aquifer is more much permeable than the oxide. Therefore, the analytical solutions for
leaky aquifers are not applicable. Numerical inverse modeling (calibration) is used to
estimate hydraulic parameters by matching the field data with the simulated results. To
provide an initial estimation for the numerical simulations, analytical solutions for
confined aquifers are used to analyze the drawdown curves using the pre-flattened
portion.
Figure 7 also shows the fit between field data and the Theis’ analytical solution.
The hydraulic conductivity generated was 0.8 ft/day and storativity was 0.0005. The
Theis solution assumes that the rock is homogeneous and isotropic. Analyses of all the
pumping tests were conducted. The mean hydraulic conductivity of the all pumping tests
was about 0.5 ft/day and storativity was 0.0005. The analytical results were quite
uniform because each value represents the mean value over a large volume. However,
the analytical results cannot reproduce the recovery curves in the tracer tests, because the
local heterogeneity, which is important in the transport, was smeared. This was the major
motivation of using inverse modeling to calibrate the hydraulic parameters.
SWVP-022568

Draft
Hydrologic Field Test 14
It was seen that when the pumping well and observation well were switched, the
hydraulic conductivities obtained were very close. This is an indication that the data are
reliable.
0.01
0.1
1
10
100
0.1 1 10 100 1000 10000
Time, Minutes
Dra
wdo
wn,
ft
BHP 1
Fitting
Figure 7. Theis-type curve analysis for BHP-1 in BHP-5 pumping test.
6.2 TRACER TESTS
6.2.1 Water Injection Test
Two tracer tests were conducted. The first tests involved BHP-1, BHP-2, BHP-3,
BHP-4, and BHP-5. The rest of the wells had not been drilled when this test was
conducted. Figure 3 shows the wellfield setup for this test. Upper basin water from well
M10-GU, which is 1500 feet away from BHP-1, was injected into the central well, BHP-
1, at a rate of 52 gpm. The injected water was recovered from four corner wells, BHP-2,
BHP-3, BHP-4, and BHP-5 at a rate of 13 gpm per well. The injection test lasted about
two and a half months from March 12 to May 27, 1997. The test is, therefore, called
water injection test. Sulfate in the injected water was used as a tracer. The concentration
of sulfate in the upper basin water is 230 mg/l compared to 65 mg/l in the oxide water.
SWVP-022569

Draft
Hydrologic Field Test 15
The chemical lab tests and numerical simulations of chemical reaction show that sulfate
can be treated as a conservative tracer in this water injection test.
BHP-5Pump52 GPM
Booster pump
Pump13 GPM
52 GPM
Tank 21,000 GBleed port
Well M10-GU
BHP-1
BHP-2
BHP-3BHP-4
600 ft
Figure 8 Wellfield setup for the water injection test.
Samples were taken daily from pumping and injection wells. All the major ions
were analyzed by the BHP Metallurgical Laboratory in San Manuel, Arizona. Figure 9
shows the sulfate concentrations in all the wells. It is seen that the earliest detectable
breakthrough of sulfate happened at in BHP-4 at day three. BHP-3 and BHP-5 had
breakthroughs at day 5 and 6 respectively. The breakthrough was not seen until ten to
fifteen days in BHP-2. The different arrival times are attributable to the heterogeneities in
the oxide rock and ambient groundwater gradient, which is in the northwesterly direction.
6.2.2 Bromide Tracer Test
Following the 90 days of leaching operation of the field test area, the reclamation
phase began. During reclamation, a tracer test using Bromide was conducted. Ground
water from a nearby well WW-4 (3,000 ft away) and Sodium Bromide solution were
mixed together with an inline mixer. The mixed solution, with Bromide concentration of
SWVP-022570

Draft
Hydrologic Field Test 16
54 ppm, was injected into BHP at 55 gallon per minute. The injected solution was
recovered from BHP-2, BHP-3, BHP-4, BHP-5, BHP-6, BHP-7, BHP-8, and BHP-9.
Table shows the average pumping and injection rates during the tracer test. The average
total pumping rate was 93 gpm. Bromide was injected for 45 hours. After this time, only
ground water was injected into BHP-1.
Figure 9. Relative concentrations of sulfate in recovery wells in water injection
tests.
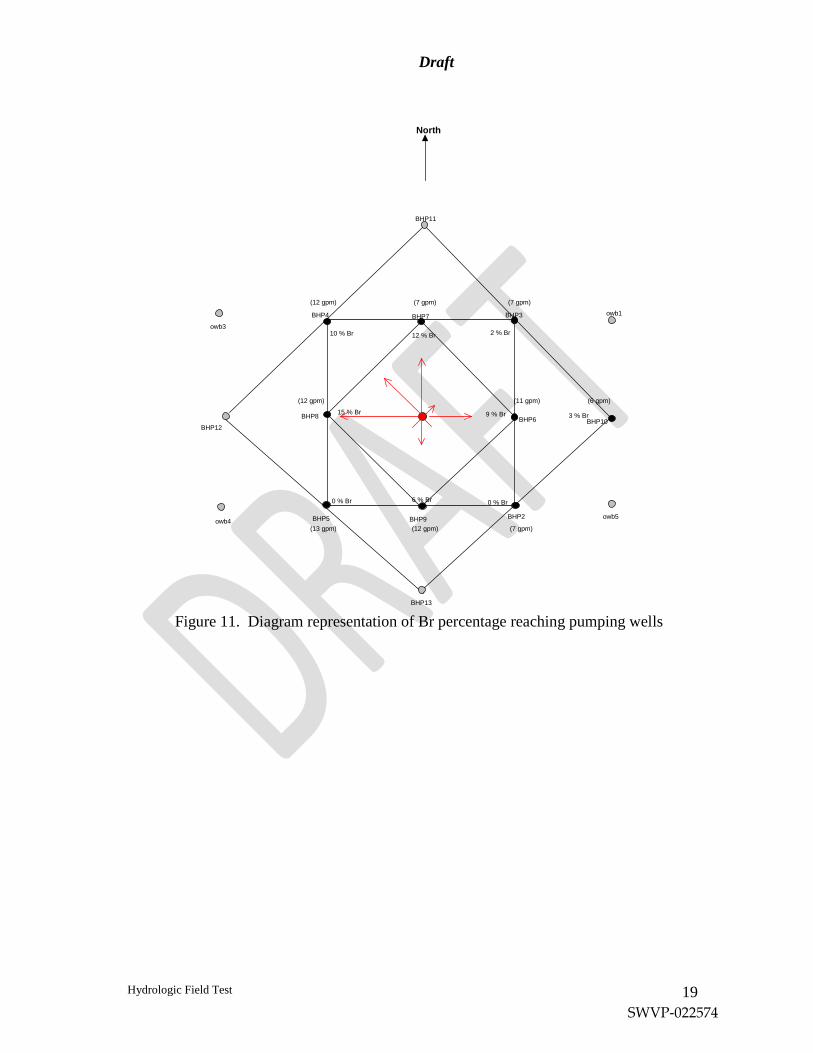
The relative concentrations vs. time curves are presented in Figure 10. Figure 11
is a diagrammatic representation of how much solution reached each pumping well.
About 56% of the injected bromide had been recovered in one month period with forcast
of 90% in three months. Notice that the percentage of Bromide solution recovered at the
pumping wells is not necessarily proportional to the pumping rate or distance from the
injection well. A large difference in heterogeneity and communication exist. BHP-7
pumped at only 7 gpm and recovered 12% Bromide; BHP-6 being at an equal distance of
50 ft from the injection well, pumped at a higher rate of 11 gpm but received only 9%
Bromide. BHP-8 and BHP-9 are of equal distance from the injection well and had a
0.00
0.20
0.40
0.60
0.80
1.00
1.20
0 10 20 30 40 50 60
Day
Rel
ativ
e Su
lfate
Con
cent
ratio
n BHP1
BHP2
BHP3
BHP4
BHP5
SWVP-022571

Draft
Hydrologic Field Test 17
Figure 10. Relative Br concentration vs. time curves
Br Field TestRelative Concentration vs Time
Injected 50 ppm for 2 days into BHP1
-0.20
0.00
0.20
0.40
0.60
0.80
1.00
05/13/98 05/18/98 05/23/98 05/28/98 06/02/98 06/07/98 06/12/98
Day
Rel
. Con
c. (p
pm)
BHP2
BHP3
BHP4
BHP5
BHP6
BHP7
BHP8
BHP9
BHP10
CH1
CH2
Br Field TestRelative Concentration vs Time
Injected 50 ppm for 2 days into BHP1
-0.05
0.00
0.05
0.10
0.15
0.20
0.25
0.30
05/13/98 05/18/98 05/23/98 05/28/98 06/02/98 06/07/98 06/12/98
Day
Rel
. Con
c. (p
pm)
BHP2
BHP3
BHP4
BHP5
BHP6
BHP7
BHP8
BHP9
BHP10
CH1
CH2
SWVP-022572

Draft
Hydrologic Field Test 18
similar pumping rate of 12 gpm, but they had different results. Fifteen percent of
Bromide reached BHP-8 and only 6% Bromide reached BHP-9.
BHP-2, BHP-3, BHP-4, and BHP-5, which are farther (71 ft) from BHP-1
recovered negligible amount of Bromide, with the exception of BHP-4. BHP-4 pumping
at 12 gpm recovered 10% Bromide. BHP-10, even farther (113 ft) from BHP-1, pumped
only 6 gpm, and recovered 3% of Bromide.
Notice that most of the recovery was obtained from wells (BHP-7, BHP-8, BHP-
4) on the northwest quadrant of the wellfield. These results indicate that there is a very
good communication between BHP-1 and those wells. There is also a good connection
with wells east of BHP-1 (BHP-6 and BHP-10). The vectors in Figure 11 indicate the
direction and quantatity of Bromide recovery.
The test demonstrated that Bromide is an excellent non-reactive tracer.
SWVP-022573
Draft
Hydrologic Field Test 19
Figure 11. Diagram representation of Br percentage reaching pumping wells
North
6 % Br
BHP9
BHP6
BHP7
BHP8
BHP4
BHP2BHP5
BHP3
BHP10
(13 gpm) (12 gpm) (7 gpm)
(12 gpm) (7 gpm) (7 gpm)
(12 gpm) (11 gpm) (6 gpm)
BHP11
BHP12
BHP13
owb1
owb3
owb4owb5
12 % Br
15 % Br
10 % Br 2 % Br
0 % Br
9 % Br
0 % Br
3 % Br
SWVP-022574

Draft
Hydrologic Field Test 20
7. INTERPRETATION OF HYDROGEOLOGIC TESTS
Numerical inverse modelings were used to calibrate hydraulic parameters in the
oxide zone, based on the field tests. The flow distribution was simulated using
MODFLOW, a flow model developed by the U.S. Geological Survey (McDonald and
Harbaugh, 1988). The tracer movement was simulated using MT3D, a transport model
that considers advective and dispersive processes (Zheng, 1990). The inverse calculation
was conducted using a Parametric Estimation software, PEST.
To calibrate the parameters, an initial estimation of these parameters was put in
the models. The results of the simulations were then compared with field data. If the
match was not satisfied, the hydraulic parameters were adjusted by PEST and simulations
were repeated, until a satisfactory comparison of field data and simulation results were
achieved. The interference pumping test data were used to calibrate the distribution of
hydraulic conductivity. The water injection test data were used to calibrate the
dispersivity, and effective porosity. Because of the heterogeneous nature of the rocks, the
calibration is usually non-unique. However, the major features within the area
surrounded by the wells will be captured.
The model grid covers 7,000 ft by 7,000 ft of area within the test site and 640 ft of
depth. The grid design is characterized by non-uniform cell spacings of 10 ft (middle
cells), 20 ft, 40 ft, 60 ft, 135 ft, and 140 ft which encompasses the boundary of 7000 ft by
7000 ft. The wells were positioned in the inland block which is separated (discretized) in
10 ft x 10 ft cells. The grid’s perimeter cells were assigned constant head boundary
conditions. The vertical dimension of the model was discretized into 3 layers. The top
layer covers the lower basin fill unit. The second layer covers the top 40 feet of oxide.
The bottom layer covers the rest of the oxide. All the layers were considered to be
confined aquifers. The transmissivities were allowed to vary and were calculated from
the saturated thickness and hydraulic conductivity. The storage coefficients were
considered to be uniform.
The test area was divided into 37 distinct zones. A high conductive zone and two
low conductive zones were introduced along BHP-5 and BHP-9, based on the
examination of pumping data and tracer data as well as the geological features. Some
SWVP-022575

Draft
Hydrologic Field Test 21
zones were combined as one zone during the calibration process to reduce the number of
parameters, in order to reduce the computation time and enhance the certainty of
calibration.
Figure 12 shows the field drawdown curves and the calibrated curves for BHP-9
pumping tests. Other 17 pumping tests were calibrated simutaneously. There were more
than 350 plots. Figure 13 shows the calibration results of transmitivity. The results show
that the zone connecting BHP-5 and BHP-9 does have significant differences with the
surrounding rocks. The conductivity of the high conductive zone is 5 ft/day, sandwhched
by the low conductive zones of as low as 0.1 ft/day. This feature indicates that there is a
short circuit between BHP-5 and BHP-9. The wellfield is separated into two somehow
isolated areas.
The SO4 concentration curves of the calbration and field water injection test data
were shown in Figure 14. The dispersivity value obtained is 70 feet and the effective
porosity is 6%. This is consistent with the previous studies (Orr, 1997). The match is
surprisely good, considering that the dsipersivity value and the effective porosity were
treated uniform. It was found that introducing more zones of dispersity and effective
porosity only slightly improved the match.
The bromide test was not used to calibrate the model because the bromide test
was conducted after three months of leaching. The conditions of rock had been changed
since the pumping tests and water injection tests were conducted. However, the test was
used to validate the numerical simulations, as shown in Figure 15. The match is
qualitatively good. The slower arrival times in the test data indicates the porosity
increased due to the leaching of minerals.
In summary, the approach of equivalent porous medium embedded significant
discrete features matches the field data very well in such a highly fractured and
heterogeneous rock, as was found by Neuman (1982).
SWVP-022576

Draft
Hydrologic Field Test 22
Figure 12. Field drawdown curves and the calibrated drawdown curves for the
BHP-9 pumping test. BHP2
-2
3
8
13
18
1 10 100 1000 10000minutes
BHP3
-2
3
8
13
1 10 100 1000 10000minutes
BHP4
-2
3
8
13
1 10 100 1000 10000minutes
BHP5
-238
131823
1 10 100 1000 10000minutes
BHP6
-2
3
8
13
1 10 100 1000 10000minutes
BHP7
-2
3
8
13
1 10 100minutes
BHP8
-2
38
13
18
1 10 100 1000 10000minutes
BHP9
-28
182838
1 10 100 1000 10000
minutes
BHP10
-2
3
8
13
1 10 100 1000 10000minutes
BHP12
-2
3
8
13
18
1 10 100 1000 10000minutes
BHP13
-2
3
8
13
18
1 10 100 1000 10000minutes
OWB1
-2
3
8
13
1 10 100 1000 10000minutes
OWB3
-202468
1 10 100 1000 10000
minutes
OWB4
-2
3
8
13
18
1 10 100 1000 10000minutes
OWB5
-2
3
8
13
1 10 100 1000 10000minutes
SWVP-022577

Draft
Hydrologic Field Test 23
SWVP-022578

Draft
Hydrologic Field Test 24
X
Y
Z Background K = 0.6
K= 0.03K= 0.01
K= 0.01
K=0.25
K= 0.08
K= 9.7
Figure 13. Calibrated results of hydraulic conductivity
-0.10
0.00
0.10
0.20
0.30
0.40
0.50
0.60
0.70
0 10 20 30 40 50 60 70
day
rela
tive
conc
entr
atio
n
BHP2 meas
BHP2 calc
BHP3 meas
BHP3 calc
BHP4 meas
BHP4 calc
BHP5 meas
BHP5 calc
Figure 14. Sulfate concentrations of field data and calibration results.
SWVP-022579

Draft
Hydrologic Field Test 25
Figure 15. Simulated and measured Bromide concentrations in BHP-6, BHP-7, BHP-8, and BHP-9
BHP6 Br Test
-0.2
-0.15
-0.1
-0.05
0
0.05
0.1
0.15
0.2
0.25
0.3
0 5 10 15 20 25 30 35
Day
Rel
ativ
e C
once
ntra
tion
0
0.2
0.4
0.6
0.8
1
1.2
Wei
ght
Measured
Calculated
Residual
Weight
BHP7 Br Test
-0.05
0
0.05
0.1
0.15
0.2
0.25
0.3
0 5 10 15 20 25 30 35
Day
Rel
ativ
e C
once
ntra
tion
0
0.2
0.4
0.6
0.8
1
1.2
Wei
ght
Measured
Calculated
Residual
Weight
BHP8 Br Test
-0.05
0
0.05
0.1
0.15
0.2
0.25
0.3
0 5 10 15 20 25 30 35
Day
Rel
ativ
e C
once
ntra
tion
0
0.2
0.4
0.6
0.8
1
1.2W
eigh
t
Measured
Calculated
Residual
Weight
BHP9 Br Test
-0.05
0
0.05
0.1
0.15
0.2
0.25
0.3
0 5 10 15 20 25 30 35
Day
Rel
ativ
e C
once
ntra
tion
0
0.2
0.4
0.6
0.8
1
1.2
Wei
ght
Measured
Calculated
Residual
Weight
SWVP-022580

Draft
Hydrologic Field Test 26
8. NUMERICAL PREDICTION PRIOR TO THE LEACH TEST
The hydrologic parameters obtained in the water injection tests were used in the
simulations to predict the solution flow in the field leach test. Because of the lack of data
and model incapability, chemical reactions were not included in the model and studied
separately in a simplified model (See Florence Pre-Feasibility Report, Vol. IV). This
represents a worst-case scenario for the spreading of injected solution because the
neutralization processes should retard the solution movement.
Figure 16 presents the plan view of lateral concentration spreading after 10 days
and 365 days of leaching in the oxide zone. A five percent hydraulic gradient in the
northwest direction was imposed in the simulations to account for irrigation wells effect
on the natural hydraulic gradient of 0.5 percent. After ten days, the concentration plume
did not surpass the area bounded by BHP-10 to BHP-13. The inner production wells
(BHP-1 through BHP-5) start exhibiting about 22 percent of the leaching concentration.
BHP-2 is an exception; only 12 percent of the leaching concentration is achieved after the
first 10 days. At this time, the outer production wells (hydraulic control wells, BHP-10 to
BHP-13) display a 3 percent to 8 percent concentration, while the observation wells have
no sign of the solution. This figure shows that the outer production wells, besides
functioning to maintain hydraulic control, will also capture part of the leaching solution.
After one year, the model indicates that the 0.05 concentration contour could travel
between 50 ft to less than 100 feet beyond the area bounded by BHP-10 to BHP-13. The
injected solution will be detected in the observation wells (OWB1, OWB3, OWB4,
OWB5) located 50 feet from production wells. The model predicts that observation well
OWB6 (not shown in Figure 16), constructed about 200 feet northwest from the leaching
block, will not see the injected solution. The concentration of injected solution at BHP-1
is about 85 percent, representing a 15 percent dilution. The observation wells, which are
50 ft from the outer production wells, display 12 to 38 percent concentration. By the
year-end, most of the wells are on their way to reaching equilibrium. The simulations
represent the worst case scenario. The solution spreading shall be smaller due to solution
neutralization by the rock formation. If this phenomenon is confirmed during the leach
SWVP-022581

Draft
Hydrologic Field Test 27
Figure 16. Plan view of concentration spreading within the first mining block
after 10 and 365 days.
0.050.100.200.300.400.500.700.80
0.95
UBFU
OXIDE
LBFU
MFGU
MODFLOW BC Symbols
Well
Point Source/Sink
MT3D BC Symbols
Figure 17. Vertical concentration profile from a cross section between injection
wells BHP-6 and BHP-8, and production wells BHP-1, BHP-10, and BHP-12 after one
year. Each layer represents 20 feet.
SWVP-022582

Draft
Hydrologic Field Test 28
test, the magnitude of the spreading should be taken into account in future in-situ
leaching design around the permitted leaching boundary zone. The wells shall be placed
at a minimum of 150 feet from the permit boundary.
Figure 17 presents a vertical concentration profile from a cross section between
injection wells BHP-6 and BHP-8, and production wells BHP-1, BHP-10, and BHP-12.
The wells are placed 40 ft underneath the LBFU and oxide contact zone. The cross
section between the two other injection wells has similar concentration contours. It is
seen that the injected solution had moved 20 ft to 40 ft into the LBFU at the end of one
year. The simulations assume that the hydraulic conductivity in the LBFU does not
change. The laboratory test on cores from LBFU showed that the permeability of LBFU
could be reduced 50% during the leaching because of mineral precipitation. The actual
vertical excursion could be smaller.
9. FIELD LEACH TEST
9.1 FIELD TEST RESULTS
Injection of sulfuric acid solution started on October 31, 1997. The leaching
solution was made of ground water from Florence, concentrated sulfuric acid from San
Manuel, and San Manuel raffinate. The injected solution had a pH of 1.6.
The wellfield was operating at a total injection rate of 122 gpm and a total
recovery rate of 150 gpm.
Table 1 presents the average injection and pumping rates for the wells. The rates
declined with time due to the clogging of pumps. The pumping rates was kept low
thereafter. The problem was solved later by injecting raffnate around pumps to disolve
the precipitation on the pumps. Injection rates ranged between 21 to 35 gpm per well.
Pumping rates in the inner production wells ranged between 14 to 19 gpm per well.
Pumping rates in the perimeter pumping wells ranged between 10 to 13 gpm. The total
pumping rates have been kept larger than the total injection rates, based on permit
requirements. The net pumping and injection rates are shown in Figure 18. BHP1, which
is surrounded by the four injection wells, was the main production well. It pumped at an
average rate of 39 gpm.
SWVP-022583

Draft
Hydrologic Field Test 29
The leach solution had an average pH of 1.6. During the leaching phase, the pH
of most recovery wells gradually decreased as the leach solution traveled from the
injection point to the pumping wells. The main production well, BHP-1, reached a pH of
3 at the end of the leaching period. The rest of the pumping wells ranged between pH of
3 and 7. The pH decline was hardly noticeable at BHP-13 and BHP-2 (Figure 19).
Table 1. Average injection and pumping well rates during leaching phase
Figure 18. Net positive pumping rate.
Inflow vs. Outflow Rates
02040
6080
100
120140
160180
200
10/31/97 12/30/97 02/28/98 04/29/98 06/28/98 08/27/98 10/26/98 12/25/98 02/23/99 04/24/99
Rate
(gpm
)
Injectate to f ield
Total Flow from Field
average averageWell ID injection (gpm) Well ID pumping (gpm)BHP6 32 BHP1 39BHP7 35 BHP2 14BHP8 21 BHP3 17BHP9 33 BHP4 16sum 122 BHP5 19
BHP10 11BHP11 11BHP12 10BHP13 13
sum 150
SWVP-022584

Draft
Hydrologic Field Test 30
Figure 19. pH of pumping wells during leaching phase.
The copper production at the main pumping well, BHP-1 and other recovery wells
are shown in
Figure 21 and Figure 23. As is found in the hydrogeologic investigations, a short
circuit exists between injection well BHP-9 and pumping well BHP-5. Therefore, a
greater copper concentration is seen at BHP-5. The maximum concentration was about
250 ppm. BHP-10 reached about 200 ppm copper after 100 days of leaching. Wells
BHP-2, BHP-12, and BHP-13 showed low copper levels because of the low conductive
zones discussed in the previous section.
pH of Recovery Wells
1
2
3
4
5
6
7
8
11/1/97 12/1/97 12/31/97 1/30/98
Date
pH
BHP1
BHP2
BHP3
BHP4
BHP5
BHP10
BHP11
BHP12
BHP13
INJECTATE
SWVP-022585

Draft
Hydrologic Field Test 31
9.2 HYDRAULIC CONTROL
Environmental permits require a) the total injection be less than the total recovery,
and b) perimeter pumping wells have a deeper water level than the adjacent observation
wells. These have been achieved during the leaching and reclamation periods as shown
in Figure 18 and Figure 23.
9.3 POND EVAPORATION
A seven-arce pond was built to store and evaporate the preganant leach solution.
Three spary lines were installed to enhance the evaporation. The daily evaporation rate
was estimated by measuring the pond solution level as shown in Figure 20 The natural
evaporation rates vary from 2 gpm/arce in winter to about to 7 gpm/arce in summer. The
average is 3 gpm/arce. The total evaporation rates, including four spary lines, vary from
4 gpm/arce in winter to about to 12 gpm/arce in summer. Increase the number of spary
lines in the pond would increase the evaporation rate. But the number of lines should be
limited to 1 to 1.5 per arce. The rate provides the bases for the design of evaporation
ponds for the full production.
Figure 20. Evaporation rate of the evaporation pond.
0
4
8
12
16
15-Apr 24-Jul 1-Nov 9-Feb
Gal
lon
per m
inut
e natural evaTotal Evaporation
SWVP-022586

Draft
Hydrologic Field Test 32
bhp1 Cu
0
20
40
60
80
100
120
140
10/17/97 11/6/97 11/26/97 12/16/97 1/5/98 1/25/98 2/14/98Time, day
Cu,
ppm
Figure 21. Copper grade in pregnant solution from BHP-1.
SWVP-022587

Draft
Hydrologic Field Test 33
Figure. 22. Copper grade in pregnant solution from recovery wells.
Copper Concentration during Leaching Phase
0
50
100
150
200
250
300
10/30/97 11/29/97 12/29/97 1/28/98
Date
BHP1BHP10BHP11BHP12BHP13BHP2BHP3BHP4BHP5
SWVP-022588

Draft
Hydrologic Field Test 34
Figure 23. Water levels in four pair of observations.
Hydraulic ControlNE well pairs
140
150
160
170
180
190
200
210
220
10/01/97 12/30/97 03/30/98 06/28/98 09/26/98 12/25/98 03/25/99 06/23/99
pumping wellOBS well
Hydraulic ControlNW well pairs
100
150
200
250
300
350
10/01/97 12/30/97 03/30/98 06/28/98 09/26/98 12/25/98 03/25/99 06/23/99
pumping wellOBS well
Hydraulic ControlSW well pairs
140
150
160
170
180
190
200
210
220
10/01/97 12/30/97 03/30/98 06/28/98 09/26/98 12/25/98 03/25/99 06/23/99
pumping wellOBS well
Hydraulic ControlSE well pairs
100
120
140
160
180
200
220
10/01/97 12/30/97 03/30/98 06/28/98 09/26/98 12/25/98 03/25/99 06/23/99
pumping wellOBS well
SWVP-022589

Draft
Hydrologic Field Test 35
9.4 ELECTRIC RESISTANCE TOMOGRAPHY
To monitor the flow paths of solution from injection well to pumping wells,
Electric Resistance Tomography (ERT) were used during the injection test. Dr. Douglas
LaBreque from Steamtech Environmental Services in Bakersfield, California performed
these investigations. Electric Resistance Tomography is a new technology that is similar
to medical Magnetic Resistance Image (MRI) in theory but uses electrical resistance
instead of magnetic resistance as signals. Electrodes are placed in wells along wellbore.
By measuring electrical resistance between two electrodes before and after the injection,
the changes in electrical resistance of the rock can be calculated by inverse modeling
(ref). Because the injection fluids have smaller resistance (10,000 µS/cm) than the
formation water (850 µS/cm), the zones with negative changes in resistance (positive
changes in conductance) represent the flow paths of injected solution. In this study,
electrodes were placed in BHP-1, BHP-2, BHP-3, BHP-4, and BHP-5 at three-meter
intervals. The data was collected before the injection of leach solution and after two
months of leach. Figure 24 shows the changes in conductivity due to the injection of
leach solution on the cross section of BHP-5 to BHP-1 and BHP-3. Although the results
are qualitative, it is clear that the solution sweep through most of the oxide rocks.
Although the screen of the well is 40 feet below the top of the oxide, the solution has
flow vertically into overburden for about 20 feet which is consistent with the numerical
simulations. The detailed results are described in Appendix I.
9.5 RECLAMATION TESTS
Upon the termination of the three-month leaching test on Feb. 9, 1998, the rinsing
test commenced. During the rinsing phase, the acid solution was replaced by water while
the recovery wells were kept pumping. Then, the fresh water was injected into BHP-1
and rest of wells were used as recovery well. This switch of recovery and injection
helped to extract acid solution faster. Following the period of groundwater injection, the
residual wellfield solutions were pumped with no injection.
SWVP-022590

Draft
Hydrologic Field Test 36
Figure 24. Conductivity difference from background after one month of acid
injection.
SWVP-022591

Draft
Hydrologic Field Test 37
Sulfate was used as an indicator to the recovery of the injected acid solution.
About 1.2 million pounds of sulfate were injected into the wellfield during the leaching
phase (Figure 25). In August, 1999, 94 percent of the sulfate (1.14 million pounds) was
recovered based on the flow and geochemical assay data. This validated the numerical
models which showed that the injected solution would be contained during the leach test.
Figure 25. Sulfate recovery during the leaching and rinsing phases.
10. CONCLUSIONS
Hydraulic tests were conducted in the wellfield before the leaching tests started.
Numerical inverse modeling was used to built hydrogeological model and calibrated
parameters. The calibrated model was used to simulate the solution movement in the
leaching test. The results showed that the injected solution will flow vertically into
Lower Basin Fill Unit for 20 feet. Although permits allow this, it is not desiable for the
leaching purposes. The vertical excursion can be reduced by increase the distance
between the top of the screen and the botton of the LBFU from 40 feet to 60 feet.
0.0
0.2
0.4
0.6
0.8
1.0
1.2
1.4
0 10 20 30 40 50 60 70 80 90 100Weeks After the Start of Injection
SO4,
lbs
in m
illio
ns
total SO4 INtotal SO4 out
92.7% Recoveredafter 99 weeks (Sep. 22, 99)94.5% will be recovered on Oct 31,1999
SWVP-022592

Draft
Hydrologic Field Test 38
Horizontally, the results showed that injected solution could be controled. These findings
were confirmed by the field test conducted later.
Field test demonstrated that the field operation can meet the environmental
regulations. For three months of test, there was no violation. The hydraulic control
systems worked as designed to prevent the excursion of leaching solutions in the
wellfield. This is verified by the fact that the injected solution was able to be recoveried
during the reclamation phase. More than 95 percent of the sulfate injected into the
ground was recovered during the rinsing phase by Oct. 1999.
The hydraulic tests and field test showed that the well design was satisfactory.
The well spacing of 75 feet that was used in the test met environmental and hydraulic
requirements. A well spacing of 50 feet can also meet these requirements but is more
difficult to drill due to the requirements on well derivation; however, the former will
result in a better financial .
11. RECOMMENDATIONS FOR FUTURE STUDIES
It is suggested that the post-leach tests be conducted. These tests will includes
pumping tests and tracer tests to determine the changes in hydraulic conductivity and
porosity due to leaching. The test results can help to understand the leach processes, such
as, the locations of mineral dissolution and precipitation. They can also be used to verify
the geochemical modeling which predicts the changes in porosity. Post-leach drilling
shall also be conducted to exam the completeness and the location of mineral dissolution,
as well as the excursion of injected solution.
SWVP-022593

Draft
Hydrologic Field Test 39
References
Florence Project Final Pre-Feasibility report, Vol, II, Geology, Growth and Technology Group, BHP, 1997.
Florence Project Final Pre-Feasibility report, Vol, IV, Hydrogeologic and Metallurgic Evaluations, Growth and Technology Group, BHP, 1997.
McDonald, M. G., and Harbaugh, A. W., 1988, A modular three-dimensional finite-difference ground-water flow model: U.S. Geological Survey Techniques of Water Resources Investigations 06-A1.
Neuman, S. P., 1982, Statistical characterization of aquifer heterogeneities - An overview, in T. N. Narasimhan, ed., Recent trends in hydrology: Geol. Soc. Am. Spec. Paper 189, p. 81-102.
Orr, S., Porosity estimation review, Appendix IV, Vol. IV, in Florence Project Final Pre-Feasibility report, Growth and Technology Group, BHP, 1997.
Resource Development Technology Group (RDTG), 1994, Pre-feasibility study Florence Project: Tucson, Ariz., Magma Copper Co., unpub. report, Oct. 1994, 333 p., 5 pls.
Zheng, C., 1990, MT3D - A Modular Three-Dimensional Transport Model for Simulation of Advection, Dispersion and Chemical Reactions of Contaminants in Groundwater Systems: S.S. Papadopulus & Associates, Inc.
SWVP-022594