hydrogeological assessments of impacts of irrigation on
TRANSCRIPT

Journal of Water Resources and Ocean Science 2020; 9(5): 107-122 http://www.sciencepublishinggroup.com/j/wros doi: 10.11648/j.wros.20200905.13 ISSN: 2328-7969 (Print); ISSN: 2328-7993 (Online)
Hydrogeological Assessments of Impacts of Irrigation on Alluvial Water Table of Delta of Senegal River
Abdoul Aziz Gning1, 2, *
, Alassane Thiam2, Raymond Malou
1, Mapathé Ndiaye
1
1Faculty of Sciences and Technics, University Cheikh Anta Diop, Dakar, Senegal 2Faculty of Training for Engineering, University of Thies, Thies, Senegal
Email address:
*Corresponding author
To cite this article: Abdoul Aziz Gning, Alassane Thiam, Raymond Malou, Mapathé Ndiaye. Hydrogeological Assessments of Impacts of Irrigation on Alluvial Water Table of Delta of Senegal River. Journal of Water Resources and Ocean Science. Vol. 9, No. 5, 2020, pp. 107-122. doi: 10.11648/j.wros.20200905.13
Received: September 15, 2020; Accepted: October 5, 2020; Published: October 22, 2020
Abstract: Building dams on the Senegal River has facilitated the development of irrigated farming in Delta of Senegal River. However, this practice is threatened by the increasing degradation of soils mainly caused by salinization. The main cause of this problem is the presence of a salty aquifer at a low depth. Nevertheless, the characteristics and functioning of this aquifer are not well known. The main objective of this study, funded by Wallonie-Brussels International, is a contribution to the characterization of the hydrodynamic functioning, the hydro geochemistry of the aquifer and to identify the impact on agricultural waters. A two-step methodology has been developed: Firstly, a regional survey has been performed in the whole delta; secondly an irrigation plot has been monitored to have a detailed description of the groundwater dynamic and of the transport of salt under irrigation. Results of the regional survey show (1) the main factors that explain the fluctuation of the groundwater level are the artificial high water levels in the River, rice growing and to a lesser extent precipitation and (2) the high salt concentration in the upper aquifer. The monitoring of the Ndelle rice growing area (30 km to the North-East of Saint-Louis) has allowed calculating water and salt budgets at the scale of the irrigation plot. The influence of the irrigation on the groundwater levels has also been studied.
Keywords: Groundwater, Salinization, Irrigation, Delta of Senegal River, Senegal
1. Introduction
Agricultural sector is by far the largest user of water resources of the world with 70% of world consumption [1]. In arid areas, characterized by a rainfall deficit and a very significant evaporation, the practice of the irrigated culture makes it possible to take up the challenge of the agricultural production to ensure, in the medium or long term, the food self-sufficiency.
Rainfall and evapotranspiration are among the most significant variables that can be used to determine the cause of climate changes and show the level of environmental response to climate change on a basin or regional scale [2-5]. Precipitation and evapotranspiration represent the volumes of incoming and outgoing water in the hydrological budget
which is believed to be the same in the long run [6]. This can be seen in term of water balance which demonstrates the condition of water surplus or deficit at a particular place and time. Spatial and temporal variability in rainfall amount and evapotranspiration as a result of global climate change is posing serious danger to water resources management, rain-fed agriculture, food security and poverty reduction especially in the developing countries. In fact, by the year 2020, crop yield from countries practicing essentially rain-fed agriculture could decrease by about 50%, while access to food in sub-Saharan Africa is projected to be seriously compromised [5-7].
However, irrigation development is accompanied by risks

108 Abdoul Aziz Gning et al.: Hydrogeological Assessments of Impacts of Irrigation on Alluvial Water Table of Delta of Senegal River
of waterlogging and soil degradation, related essentially to the difference in concentration between water flows through irrigation and evaporation: These risks are exacerbated by the presence of a shallow aquifer.
In the DFS (meaning), the availability of water following the dams’ commissioning has enabled the irrigated culture development, reflected in a significant increase in the established area. Rice growing occupies the vast majority of these areas and its practice requires considerable water consumption. This inevitably leads to a percolation process towards a sub-flush surface layer [8]. The rise, by recharging, of this water table presupposes almost permanent bottlenecks and vertical transfers of water and material flows in the environment. Soil degradation, after a few years of exploitation, is undoubtedly linked to this transfer of material flow between the aquifer (originally salty) and the soil. The deep drainage of agricultural origin substances, introduced by irrigation water, and the upward ascents of salt, coming from the aquifer, would be implicated [9]. The balance between the need to increase the cultivation area, and the volumes of water used, and the need to limit the percolation of water becomes the new challenge [10].
Groundwater salinization in Delta of Senegal River originates from marine water invasion into the continent that has occurred in both past and present. Marine invasion and even full transgressions have occurred along the Senegalese coast throughout geological history, with spatial contact and communication existing between them [11].
The hydro geochemical study of the superficial aquifer of the DFS allowed us to confirm its marine origin and its character, locally, hyper salty places) due to an over-concentration by evaporation [12]. This explains the risks of soil degradation in the case of proximity of this aquifer to the soil surface. However, the study of the geochemical processes responsible for the evolution of the mineralization of the aquifer does not allow us to identify the impact of irrigation on the salinity of the superficial aquifer [13].
To better understand the irrigation dynamics relationship of groundwater-salinization of soils, the second axis of our methodological approach consists in conducting an experimental study of the hydrogeological and hydro geochemical behavior of the superficial aquifer at the scale of the irrigated perimeter. The objective is to characterize the hydric, saline and geochemical functioning of the aquifer but also of the unsaturated zone during and outside irrigation in order to highlight the transfers of water flows and solutes per ascending and per descending. This study should also lead to the development of a conceptual model of the operation of this set allowing simulations and predictions to be made for rational management of resources and a sustainable practice of irrigation.
To conduct this experimental study, Ndelle agricultural perimeters were chosen. The choice of this site was made on the basis of consultation with SAED agents. The main criteria for selecting the site are accessibility, securing monitoring equipment and the cooperation of peasant
populations.
2. Methodology
2.1. Study Site
The village of Ndelle is located at 30 km from the city of Saint Louis (Figure 1) in a transition zone between the ocean-influenced climate of the city of Saint-Louis and the desert climate of Richard Toll [14].
The geological context of the delta is part of that of the Senegalo-Mauritanian basin, whose formations are described in numerous studies [15-18]. The geological formations that outcrop in the SRD zone are mainly composed of quaternary deposits (Figure 1). From a hydro-geological point of view, various studies indicate the presence of three aquifer systems [18-19]: the superficial aquifer represented by the Quaternary alluvial formations and the sandy or clay-sand deposits of the Continental Terminal, the intermediate aquifer of the Tertiary calcareous formations and the deep aquifer of the Maastrichtian sandstone formations. The superficial aquifer of the Quaternary formations that contains the alluvial groundwater is complex and occupies the entire major bed of the river. Schematically, from a hydro-geological point of view, various studies indicate the presence of three aquifer systems [20-21]: the superficial aquifer represented by the Quaternary alluvial formations and the sandy or clay-sand deposits of the Continental Terminal, the intermediate aquifer of the Tertiary calcareous formations and the deep aquifer of the Maastrichtian sandstone formations. The superficial aquifer of the Quaternary formations that contains the alluvial groundwater is complex and occupies the entire major bed of the river. But few studies have focused on integrating knowledge by taking into account the variability of soils and cultivation methods to estimate flows over the entire crop cycle at the scale of water management units (hydraulic grid, perimeter and alluvial depression [22, 23]. The umbro thermal diagram (Figure 2), obtained thanks to climatic data collected at the AFRICARICE station (ex ADRAO) of Ndelle between 2011 and 2013, shows that only August and September can be considered as wet, with a maximum precipitation during September. The average monthly temperatures vary between 20 and 30°C and are higher during the rainy season. Geomorphologically, the agricultural perimeter is located in a settling basin, topographic depression with a clay soil which limits, a priori, infiltration and therefore promotes the practice of rice cultivation. This perimeter is managed by a Hydraulic Union to which SAED entrusts responsibility for the operation and maintenance of the facilities carried out on public funds. The Hydraulic Union in turn brings together Economic Interest Groups (EIG) which are groups of villagers allowing better access to agricultural credit. The Hydraulic Union of Ndelle has 05 EIG. In 2008, as part of the Lampsar Rive Gauche Project (LRGP), the perimeter was rehabilitated and its exploitable area increased to 274 [24]. The farming calendar is made up of three seasons (figure 2): (1) a so-called hot

Journal of Water Resources and Ocean Science 2020; 9(5): 107-122 109
counter-season campaign which runs from February to the end of June, (2) a winter campaign from July to October and (3) a campaign extending cold counter season from October to April. Rice cultivation is the dominant activity and is
generally practiced in hot counter-season and wintering. The cold counter-season is generally devoted to market gardening, notably with the cultivation of tomatoes and onions.
Figure 1. Location of the plots and the experimental setup.
Figure 2. Umbro-thermal diagram of the station in the study area.
On the Ndelle site, more than sixteen (16) plots was chosen for the experiment. The plots vary in size between 1 and 1.5 ha and are separated by earthen bunds. The experimental monitoring began in February 2012 during the hot off-season campaign and continued until May 2014.
2.2. Experimental Protocol
The aim of this experimental study is to characterize the water, saline and geochemical functioning of the soil and the surface water table in agricultural perimeters during and outside the cultivation period in order to determine the role of irrigation in recharge and geochemical evolution of the water table, on the one hand, and the movements of solutes from the
ground to the water table and vice versa, on the other hand. Thus, it is necessary to estimate the volumes of water provided by irrigation (rice growing in particular) and the evolution of the quality of this water, to estimate the volumes of water transferred to the water table via the unsaturated zone and to quantify the quantities of salts mobilized.
The experimental protocol set up consists of a device for monitoring the irrigation water slide (surface piezometer), the evolution of the soil and the soil solution (capacitive probes, piezometers and porous candles), the dynamics of the water table and the evolution of its chemistry (piezometers).
As part of this study, we set up a “surface piezometer”. It is a PVC tube 63 mm in diameter and 1.5 m in length. This tube is driven 50 cm into the ground and screened on the surface to an equivalent height. An automatic recorder, of the DIVER type, is placed inside the tube to measure the pressure variation. A BARO DIVER type probe allows the recording of atmospheric pressure. The compensation of the DIVER probe allows having the water layer above the probe. From this value will be deducted the depth of the device from the ground to have the water slide above the plot. This device does not allow knowing the total amount of water supplied but what remains above the ground surface.
Three probes were installed respectively 25, 50 and 80 cm deep to measure the water content in the soil. The probes were installed just before the start of irrigation to get the starting point. However, a few days after the irrigation, they were removed for safety reasons. As a result, the behavior of the ZNS could not be followed after irrigation.
Jan Feb March April May June July Aug Sept. Oct. Nov. Dec.
0
20
40
60
80
100
120
140
160
180
T°C
Rain (mm)
Ra
in (
mm
)
0
10
20
30
40
50
60
70
80
90
Tem
per
atu
res (°C
)
110 Abdoul Aziz Gning et al.: Hydrogeological Assessments of Impacts of Irrigation on Alluvial Water Table of Delta of Senegal River
To monitor the dynamics of the water table, a first line of piezometers was installed along the secondary channel and perpendicular to the main irrigation and drainage channel. The piezometers are 50 m apart and are of two types. Surface piezometers, named ND (ND01 to ND11), and deep piezometers named NDP (NDP01 to NDP05). Surface piezometers have a maximum depth of 3 m and are screened from the base of the structure a few centimeters from the ground surface: deep piezometers have a depth of between 5 and 6 m and have a screen height of two meters. They were placed in duplicate with the short piezometers (ND01, ND03, ND06, ND08 and ND11). A second line of short piezometers was installed perpendicular to the secondary irrigation canal (ND12 and ND13). Subsequently, other deep piezometers (ND14 to ND21) were installed on other plots of the perimeter in order to have more space in the mesh. All the piezometers were leveled with differential GPS.
Piezometric level measurements were performed with a manual probe every two days throughout the study.
Continuous monitoring of soil salinity, the use of TDR probes and capacitive probes were able to monitor. In addition to the water content of the soil, the apparent electrical conductivity of the soil [25, 26]. Theoretical principles and practical methods have been widely discussed by Dalton et al. (1984) [27], Nadler et al. (1991), Topp et al. (1980), among others cited by Noborio (2001) [28-29]. Capacitive probes directly provide the value of the soil's CEa. The conductivity of the soil solution is deduced from this by the following relation:
CEw = (εw [×CE a])/(εs-εsw=0)) (1)
With, εw the electrical permittivity of soil water, CEa the apparent electrical conductivity of the soil, εs the apparent electrical permittivity of the soil, εsw = 0 the electrical permittivity of dry soil. This formula provides an approximation of the electrical conductivity of soil water.
3. Results and Discussions
3.1. Water Function
The study of water functioning makes it possible to quantify the inputs and the stresses and to describe the water behavior of the soil and the water table during and outside the water supply period. A water balance is proposed for different periods.
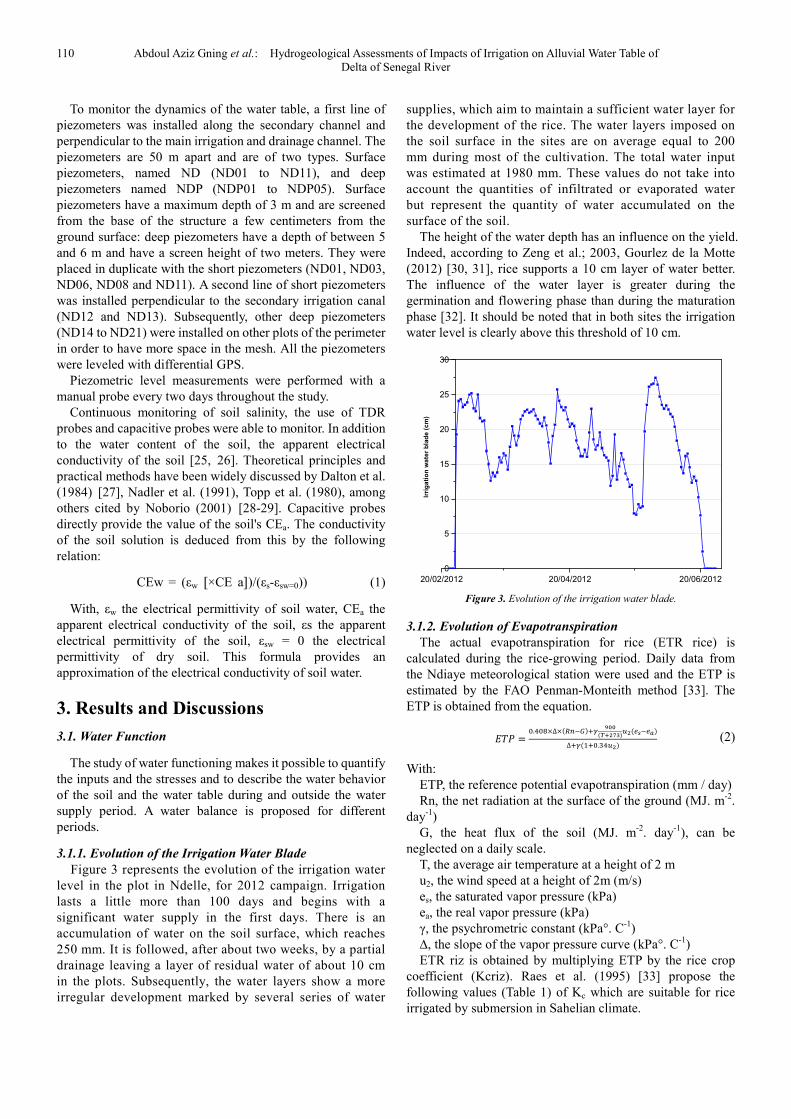
3.1.1. Evolution of the Irrigation Water Blade
Figure 3 represents the evolution of the irrigation water level in the plot in Ndelle, for 2012 campaign. Irrigation lasts a little more than 100 days and begins with a significant water supply in the first days. There is an accumulation of water on the soil surface, which reaches 250 mm. It is followed, after about two weeks, by a partial drainage leaving a layer of residual water of about 10 cm in the plots. Subsequently, the water layers show a more irregular development marked by several series of water
supplies, which aim to maintain a sufficient water layer for the development of the rice. The water layers imposed on the soil surface in the sites are on average equal to 200 mm during most of the cultivation. The total water input was estimated at 1980 mm. These values do not take into account the quantities of infiltrated or evaporated water but represent the quantity of water accumulated on the surface of the soil.
The height of the water depth has an influence on the yield. Indeed, according to Zeng et al.; 2003, Gourlez de la Motte (2012) [30, 31], rice supports a 10 cm layer of water better. The influence of the water layer is greater during the germination and flowering phase than during the maturation phase [32]. It should be noted that in both sites the irrigation water level is clearly above this threshold of 10 cm.
Figure 3. Evolution of the irrigation water blade.
3.1.2. Evolution of Evapotranspiration
The actual evapotranspiration for rice (ETR rice) is calculated during the rice-growing period. Daily data from the Ndiaye meteorological station were used and the ETP is estimated by the FAO Penman-Monteith method [33]. The ETP is obtained from the equation.
��� =�.�×∆× �������
���
�������� ������
∆�� ��.!��� (2)
With: ETP, the reference potential evapotranspiration (mm / day) Rn, the net radiation at the surface of the ground (MJ. m-2.
day-1) G, the heat flux of the soil (MJ. m-2. day-1), can be
neglected on a daily scale. T, the average air temperature at a height of 2 m u2, the wind speed at a height of 2m (m/s) es, the saturated vapor pressure (kPa) ea, the real vapor pressure (kPa) γ, the psychrometric constant (kPa°. C-1) ∆, the slope of the vapor pressure curve (kPa°. C-1) ETR riz is obtained by multiplying ETP by the rice crop
coefficient (Kcriz). Raes et al. (1995) [33] propose the following values (Table 1) of Kc which are suitable for rice irrigated by submersion in Sahelian climate.
20/02/2012 20/04/2012 20/06/2012
0
5
10
15
20
25
30
Irri
ga
tio
n w
ate
r b
lad
e (
cm
)

Journal of Water Resources and Ocean Science 2020; 9(5): 107-122 111
Table 1. Crop coefficients for rice as a function of development stage [34].
Kc (phase initiale) Kc (phase de germination) Kc (phase de maturation) Kc (phase initiale)
1,15 1,3 1,05 1,15
Results obtained (Table 1) show that the daily ETR rice
varies between 8 and 12 mm (figure 4). It reaches its maximum value in May, which corresponds to the stage of maturation. The total REE over the culture period is estimated to be 1108 mm during the culture. However, the presence of a layer of water on the surface of the soil prevents any evaporation on the soil surface. Evaporation therefore takes place from the irrigation water and in the form of transpiration in the crops. This evapotranspiration could explain the fluctuations of the irrigation water level. In fact, after the plot has been completely filled with water, it can be considered that the soil is at saturation, that the infiltration is maximum and that the main part of the water outlets is done by evapotranspiration or by lateral losses through the protection bunds for the plot.
Figure 4. Evolution of the RTE rice in Ndelle.
3.1.3. Evolution of Soil Water Content
Figure 5. Evolution of soil water content during rice cultivation.
Figure 5 shows the change in soil water content during rice cultivation. From the first days of irrigation, the soil is quickly saturated and the water content remains almost constant throughout the cultivation phase. Indeed, maintaining a layer of water throughout the duration of the crop keeps the soil saturated over the entire profile. No drying is noted on the profile; this shows that the plants’ water demand is largely satisfied. When irrigation is stopped, there is a decrease in the water content which tends to return to initial values.
3.1.4. Groundwater Behavior
The level of the water table was monitored for two years, from the installation of the network in March 2012 until June 2014. This made it possible to observe the behavior of the water table during different periods of culture but also during a wintering period when there is no farming. The periods of water supply are structured as follows: rice growing (March to June 2012), wintering without cultivation (July to September 2012), market gardening (December 2012 to May 2013), rice growing in winter (July to September 2013) and a rice growing between February and June 2014. Given the fairly large number of piezometers, only a few structures were chosen for the presentation of level fluctuations. These are four shallow piezometers (ND01, ND05, ND07 and ND09) and five deep piezometers (NDP01, NDP02, NDP03, NDP04, NDP05) following a transect from the main irrigation channel to the main drainage channel (Figure 6).
The fluctuations of the water table are represented in figures 6 and 7 respectively for the surface piezometers and the deep piezometers. Figure 6 highlights the nature of the water table in parallel with other parameters such as irrigation water depth, daily rainfall, and ETP and soil water content. The irrigation water level was only measured during the first rice-growing season. For the other campaigns, it was assumed to be constant and equal to 15 cm.
A first global analysis of the behavior of the water table, made in Figures 7 and 8, shows that the water table uploads, regardless of the type of piezometer considered, during cultivation periods (rice-growing and market gardening) and during rainy season. Outside these periods, the groundwater level drops and can reach a level of less than-1 m, therefore clearly below sea level. It can also be noted that the recharge due to rice cultivation is clearly greater than that due to rain or market gardening.
The comparative analysis with the other parameters shows that during rice growing, the soil profile is saturated with water and the water table is about 1 m (i.e. 50 cm deep from the soil). This reflects a significant recharge (rise of more than 1 m) due to the percolation of irrigation water both at the level of the irrigated plots and at the level of the irrigation canals. Indeed, as observed above, irrigation by submersion mobilizes large volumes of water (water depth> 15 cm in the plots) and
20/02/2012 20/04/2012 20/06/2012
0,0
0,1
0,2
0,3
0,4
0,5
So
il w
ate
rco
nte
nt
(m3/m
3)
20 cm
50 cm
80 cm

112 Abdoul Aziz Gning et al.: Hydrogeological Assessments of Impacts of Irrigation on Alluvial Water Table of Delta of Senegal River
the canals are filled with water throughout the cultivation period.
Figure 6. Groundwater behavior.
Figure 7. Evolution of the piezometric level at the level of surface piezometers.
20/02/2012 20/06/2012 20/10/2012 20/02/2013 20/06/2013 20/10/2013 20/02/2014 20/06/2014
-1,5
-1,0
-0,5
0,0
0,5
1,0
1,5
ND01 ND05 ND07 ND09P
iezom
etr
ic le
vel (m
)
Rice cultivation Rain season Market gardening Rice cultivation Rice cultivation in
rain season

Journal of Water Resources and Ocean Science 2020; 9(5): 107-122 113
Figure 8. Evolution of the piezometric level at the level of deep piezometers.
Figure 9. Comparative evolution of the different hydrological parameters.
20/02/2012 20/06/2012 20/10/2012 20/02/2013 20/06/2013 20/10/2013 20/02/2014 20/06/2014
-1,5
-1,0
-0,5
0,0
0,5
1,0
1,5P
iezo
me
tric
le
ve
l (m
)
NDP01
NDP02
NDP03
NDP04
NDP05
Rice cultivation Rain season Rice cultivation
in rain season
Market gardening Rice cultivation
01/02/2012 01/08/2012 01/02/2013 01/08/2013 01/02/2014 01/08/2014
0
20
40
60
Rain
(m
m)
01/02/201201/05/201201/08/201201/11/201201/02/201301/05/201301/08/201301/11/201301/02/201401/05/2014
0
5
10
15
ET
P (
mm
)
01/02/2012 01/08/2012 01/02/2013 01/08/2013 01/02/2014
0
10
20
30
Irri
gation
(cm
)
01/02/2012 01/08/2012 01/02/2013 01/08/2013 01/02/2014
0,2
0,4
Wate
r co
nte
nt
01/02/2012 01/08/2012 01/02/2013 01/08/2013 01/02/2014
-1,5
-1,0
-0,5
0,0
0,5
1,0
1,5
ND01 ND03 ND05
Pie
zom
etr
ic leve
l (m
)

114 Abdoul Aziz Gning et al.: Hydrogeological Assessments of Impacts of Irrigation on Alluvial Water Table of Delta of Senegal River
Figures 9 and 10 also show that the water level measured at
the ND01 and NDP01 piezometers, located 2 m from the main irrigation canal, is always higher than that of the other piezometers. Even during a period of generalized drop at the level of the water table (in the off-season), the altitude of the water table at the level of these two piezometers remains higher and never reaches the zero value, while at the level of the other piezometers, the level of the water table passes below-0.5 m. This shows that the level of the water table is imposed at the level of these piezometers by the level of the Lampsar located just behind the channel. During irrigation, these two piezometers are therefore subject to the influence of the irrigation canals combined with that of the watercourse. During rice growing in the winter, due to the lowering of the river level, recharge by irrigation is predominant and the level difference between the piezometers decreases. The differences in level are mainly due to the topography that has a slight slope towards the drainage channel.
3.1.5. Calculation of Water Balances
In order to estimate the quantities of water brought to the water table, water balances are calculated for the rice-growing period and for the winter period. A plot-scale water balance was calculated over the period of the rice growing period using the equation proposed by Diaw (1996):
∑App = ETRrice + ∆RS + ∆S + Per (3)
The layer of water supplied (∑App) during irrigation and estimated using the surface piezometer. The rice RTE is calculated using the FAO method.
The variation in soil water reserve (∆RS) is estimated from capacitive probes. The total stock is estimated at 213 mm. Note that the soil water reserve is maximum from the first days and hardly varies until the irrigation is stopped [35]. The reserve variation in the water table (∆S) is estimated from the piezometric fluctuations. As the data indicates, rice cultivation causes the water table to rise by 1 m. Considering that the web is free and assuming an effective porosity of 20%, the blade stored in the web is equal to 300 mm. Drainage losses (Per) are difficult to quantify but were estimated from the balance equation. The results show that most of the irrigation water supply is taken up by evapotranspiration, which represents
more than 50% of the water consumption provided by irrigation. The crops’ water demand is ensured with an efficiency of 56 %. This efficiency may in reality be lower than these values because of the difficulty in quantifying the losses. The variations in the stock of the water table represent respectively 17 and 15.5% of the irrigation water but are largely sufficient to cause a rise in the water table.
Figure 10. Water balance at the plot level during irrigation.
3.2. Study of Saline and Geochemical Functioning
The study of saline and geochemical functioning makes it possible to describe the salinity (here the electrical conductivity) and the hydro chemical quality of the water in each compartment but also their possible evolution during water processes.
3.2.1. Surface Waters
It is here grouped under the term "surface water", the Lampsar waters, the irrigation and drainage canals and the water from the submersion of the plot.
(i). Evolution of Electrical Conductivity
The electrical conductivity of the irrigation water (in the secondary irrigation canal), the submersion water of the plot and the drainage water was measured at different dates during the first rice-growing season (February-June 2012). The values obtained are shown in the Table 2 below.
Table 2. Results of the EC monitoring of irrigation, submersion and drainage water.
Dates Secondary irrigation channel Irrigated plot Secondary drainage channel Main drainage channel
Electrical Conductivity (µS/cm)
9/03/2012 110 230 420
10/04/2012 105 200 350 900 23/04/2012 109 205 459 935 5/05/2012 105 208 563 1125 26/05/2012 97 203 357 1226 2/06/2012 118 155 368 1154 9/06/2012 94 108 361 1313 11/06/2012
103 359 1359
13/06/2012
153 354 1315
Reading table 2 shows that the irrigation water is minimally
mineralized and its electrical conductivity does not change during the irrigation period. The submersion water (having stayed a few days in the plot) has a higher mineralization than

Journal of Water Resources and Ocean Science 2020; 9(5): 107-122 115
that of the irrigation water. This implies that there is dissolution of solutes (especially salts) present on the surface of the soil. However, the Electrical Conductivity of the submerged water does not change much thereafter and even tends to decrease.
Thus, the salinity of the water gradually increases from the irrigation canal until the water is evacuated by drainage. The values measured at the level of the main drainage water collectors, namely the Ndiaël and Noar stations (regional study) are between 3000 and 5000 µS/cm, i.e. more than 10 times the salinity of the irrigation water. This increase in salinity may be due to several factors, including the dissolution of salts present in the soil solution, contamination by water from the groundwater that rises sharply during irrigation or quite simply by the effect of the evaporation recovery. This confirms the importance of the drainage system at the level of these perimeters and clearly explains the risks of soil salinization at the level of plots with summary development (without a drainage system).
(ii). Hydro Chemical Nature of Surface Water
The Lampsar water, used for irrigation, was sampled at different dates during the first monitoring campaign. The results of the chemical analyzes are recorded in Table 3. They show a stable composition over the period. The pH is slightly basic and the overall mineralization is low. The SAR (Sodium Absorption Rate) is used to assess the suitability of water for irrigation and the potential risk of alkalization and salinization associated with its use. It involves the concentrations of sodium, calcium and magnesium and is calculated using the formula:
SAR= [Na]/(([Ca]+[Mg])/2) (4)
The concentrations are expressed in meq/L. Lampsar water constitutes good quality water for irrigation with a SAR <1. However, some authors such as Boivin et al. (1995) [36] and Hammecker et al. (2009) [37] draw attention to the fact that these waters, despite low mineralization and a SAR <1, can be a source of alkalization of soils. According to these authors, the waters of the Senegal River generally have a positive calcite residual alkalinity. So, when they concentrate under the effect of evaporation, Ca and Mg tend to precipitate and cause a considerable increase in alkalinity and SAR. This could cause alkalization or sodization of soils as reported by Ndiaye (1987) [38] in Niger. This confirms the need for leaching and drainage of these waters to avoid any water concentration (Table 3).
Table 3. Chemical composition of irrigation water.
Samples 11/03/2012 11/04/2012 13/06/2012 Moyenne
pH 7,66 7,56 7,68 7,63 CE (µS/cm) 105 101 103 103 Na+ (meq/l) 0,41 0,45 0,4 0,42 K+ (meq/l) 0,03 0,04 0,03 0,03 Mg2+ (meq/l) 0,24 0,33 0,28 0,28 Ca2+ (meq/l) 0,33 0,38 0,28 0,33 HCO3
-(meq/l) 0,6 0,62 0,6 0,61 Cl-(meq/l) 0,38 0,31 0,37 0,35
Samples 11/03/2012 11/04/2012 13/06/2012 Moyenne
NO3-(meq/l) 0,01 0 0 0
SO42-(meq/l) 0,07 0,03 0,06 0,05
SAR 0.78 0.75 0.76 0.76
The mechanisms for acquiring the chemical characteristics of water during concentration are conventionally studied through concentration diagrams, the aim of which is to show that the salinization of water results from concentration by evaporation [39]. This method has been used by Valles (1987) in Tunisia [40], by Gueddari (1984) [41] in Tanzania and Tunisia, by Barbièro (1994) [42] in the Niger river valley and by Boivin et al. (1995) [43], Barbiero (1999) [39] and Hammecker et al. (2009) [35]. The water concentration is estimated using a chemical tracer. In general, a conservative tracer is a substance or a calculated quantity that marks the flow of water without interacting with its environment. Only processes such as concentration by evaporation or mixing of water cause their concentration to vary in proportion to changes in volume. This can be translated by the simple relation of proportionality between the molality of a tracer [Ti] in the initial state and [Tf] its molality after evaporation of a fraction of water:
[T#] = FC × [T&][Tf ]=FC×[Ti ] (5)
Where FC is the concentration factor, i.e. the ratio of the initial water volume to the final volume. Chloride ion is a good indicator of the state of concentration of water since it is considered a very conservative chemical element rarely found in salt precipitation. The concentration factor (FC) was estimated from the ratio of the Cl concentration of the water of the main drainage channel to that of the river water.
On this basis, Gourlez de la Motte (2012) [31], considering the results of Table 3, carried out a simulation of the evolution of the salinity and the alkalinity of the Lampsar water under the effect of the concentration by evaporation. The simulations were carried out with the software PhreeqC (Parkkurst and Appelo, 1999) [44]. The partial pressure of CO2 (PCO2) was determined such that log PCO2 =-3.5 atm. It has also been brought into equilibrium with gypsum, Mg-calcite, quartz, sepiolite and kaolinite.
The results of this simulation show that the EC increases very little and remains below 1000 µS/cm with a concentration factor of 0.94 (Figure 11a). The pH, for its part, increases and reaches the value of 8.4 with a concentration factor of 0.6 ((Figure 11b). This increase in pH is then slowed down by the fact that calcite begins to precipitate from this value (Figure 11b). The Mg2+ concentration increase with the concentration factor and the precipitation of calcite is too low to attenuate this increase. Only the precipitation of the sepiolite, which occurs from a concentration factor of 0.8, causes a decrease in the Mg concentrations which nevertheless remains present in solution.
The concentration of Na+ increases exponentially (Figure 11c); this increase combined with a decrease in the concentrations of Ca and Mg leads to an increase in the alkalizing power (SAR). However, a concentration factor of

116 Abdoul Aziz Gning et al.: Hydrogeological Assessments of Impacts of Irrigation on Alluvial Water Table of Delta of Senegal River
0.94 is required for the Lampsar water to present risks for irrigation with a SAR equal to 7 (Figure 10f). These values of EC and SAR, were only measured at the level of the main drainage channel.
These simulations show that there may be risks with regard
to the use of the river water but above all the importance of setting up an adequate drainage system. Thus, we clearly understand the risks of alkalinization and sodization of soils at the level of PIPs (Private Irrigated Perimeters) characterized by an absence of a drainage system [21, 45].
Figure 11. Evolution calculated using Phreeq C of the composition of Lampsar water under the effect of concentration.
0,0 0,2 0,4 0,6 0,8 1,0 1,20
200
400
600
800
1000
1200
0,0 0,2 0,4 0,6 0,8 1,0 1,27,0
7,2
7,4
7,6
7,8
8,0
8,2
8,4
8,6
8,8
9,0
0,0 0,2 0,4 0,6 0,8 1,0 1,2
0
2
4
6
8
10
12
14
16
0,0 0,2 0,4 0,6 0,8 1,0 1,20,0
0,5
1,0
1,5
2,0
2,5
3,0
0,0 0,2 0,4 0,6 0,8 1,0 1,20,00
0,02
0,04
0,06
0,08
0,10
0,12
0,14
0,16
0,18
0,0 0,2 0,4 0,6 0,8 1,0 1,20
3
6
9
12
15
18
CE
(µ
S/c
m)
Concentration Factor
pH
Concentration Factor
Na
(m
mo
l/l)
Concentration Factor
Co
nc
en
trati
on
(m
mo
l/l)
Concentration Factor
Alk
Mg
Ca
(e) (f)
Co
nc
en
trati
on
(m
mo
l/l)
Concentration factor
Calcite
Sepiolite
(a) (b)
(c) (d)
SA
R
Concentration Factor

Journal of Water Resources and Ocean Science 2020; 9(5): 107-122 117
3.2.2. Groundwater
(i). Evolution of the Groundwater EC
The salinity of the water table was measured every two days in all the piezometers and throughout the irrigation period. Like the salinity of the soil, the salinity of the water table presents a very high spatial variability (Figure 12) (Table 4). The measured values of electrical conductivity of the sheet vary in fact between 1 and 15 mS/cm. Here too, the distribution of the salinity of the water table does not seem to follow any apparent logic, except for the influence of Lampsar, irrigation canals and drainage waters. In fact, the water table in the piezometers close to the main irrigation canal (therefore Lampsar) has lower EC values while these are very high at the level of the piezometers close to the main drainage canal. However, the EC values measured in the plots are significantly lower than the average salinity of Nouakchott’ aquifer at the DFS scale. These values reflect an influence of watercourses and/or irrigation as in the case of piezometers
located near the river where the water table is characterized by a dilution by the addition of fresh water.
The evolution over time of the salinity of the water table during irrigation is also not uniform. Indeed, three behaviors are observed at the level of the piezometers. There is a first group of piezometers where the salinity of the groundwater during the irrigation phase remains almost constant (Figure 12). The water table in these piezometers is characterized by relatively low salinity. In the second group, the salinity dropped suddenly during irrigation, and this for a few days, before gradually rising (Figure 13). At the level of these piezometers, the salinity of the water in the first 2 meters of the water table is lower than at depth; the dilution effect therefore seems to be limited to the first few meters. In the third group, the salinity of the water table drops considerably during irrigation and remains relatively low until the end of irrigation (Figure 13). This drop in salinity is observed throughout the depth of the water table.
Figure 12. Distribution map of the electrical conductivity of the surface water table.
(ii). Hydro Chemical Behavior of the Water Table
The water from the groundwater was sampled in June 2012, before the end of rice growing and in December 2012 before the start of market gardening. The representation of these results on a Piper diagram makes it possible to identify two faces at the level of the water table: a sodium chloride faces and a sodium bicarbonate faces (Figure 13). The sodium chloride faces constitute the characteristic faces of the waters of the Nouakchott alluvial table. Na and Cl ions are by far the
dominant elements in these waters and the regional hydro geochemical study has shown their marine origin. On the other hand, many points are located below the seawater sample, in the zone susceptible to cation exchange [46]; proof that their composition appears to be influenced by contact with fresh water. Indeed, the waters with a sodium bicarbonate faces are characterized by relatively low EC values compared to the other points and an enrichment in HCO3 which constitutes the dominant anion in the waters of the river (Table 4). These piezometers are all located near the main irrigation canal, so

118 Abdoul Aziz Gning et al.: Hydrogeological Assessments of Impacts of Irrigation on Alluvial Water Table of Delta of Senegal River
near the river. Moreover, the fact that point NDP01 keeps the same faces during the December 2012 campaign, when there was no irrigation, shows that the bicarbonate enrichment is due to contact with the Lampsar water. This confirms the filling of the water table by the river. The study of the water table dynamics discussed above showed that the level of
Lampsar imposed the level of the water table at the level of the NDP01. The ND01 and ND03 surface piezometers, in duplicate with the NDP01 and NDP02 deep piezometers, even if they tend towards a sodium bicarbonate facies, still retain a sodium chloride facies.
Figure 13. Evolution of the water table EC during irrigation.
Table 4. EC and Na/Cl and Na/Cl ratios of the piezometers (campaign June 2012).
Piezometer Facies CE µS/cm Ca (meq/l) Na (meq/l) Cl (meq/l) Na/Cl (meq/l) Na/Ca (meq/l)
ND01 Na-Cl 4651 2,12 42,42 29,55 1,44 20,00 ND03 Na-Cl 1532 1,57 11,74 9,15 1,28 7,48 ND08 Na-Cl 5797 7,42 40,08 43,23 0,93 5,40 ND11 Na-Cl 12007 16,22 87,65 92,42 0,95 5,40 ND14 Na-Cl 20934 10,91 183,76 182,82 1,01 16,85 ND16 Na-Cl 34610 47,18 273,77 313,67 0,87 5,80 ND18 Na-Cl 5155 7,33 34,69 34,68 1,00 4,73 ND19 Na-Cl 11945 3,80 109,68 101,28 1,08 28,89 ND21 Na-Cl 2396 0,70 20,34 9,86 2,06 29,23 NDP03 Na-Cl 2152 5,55 60,73 36,71 1,65 10,95 NDP04 Na-Cl 1951 9,10 56,26 56,65 0,99 6,18 NDP05 Na-Cl 552 13,29 91,97 92,51 0,99 6,92 PZ1 Na-Cl 7132 14,67 116,89 82,93 1,41 7,97 ND20 Na-HCO3 2382 0,28 25,23 6,58 3,83 89,72 NDP01 Na-HCO3 1219 0,51 17,73 6,92 2,56 34,60 NDP02 Na-HCO3 1338 1,13 3,50 1,61 2,18 3,10
18/02/2012 18/03/2012 18/04/2012 18/05/2012 18/06/2012
0
5
10
15
20 ND01 ND03 ND06 ND07
Wate
r ele
ctr
ica
l co
nd
uctivity (
mS
/cm
)
18/02/2012 18/03/2012 18/04/2012 18/05/2012 18/06/2012 18/07/2012
0
5
10
15
20 ND02 ND04
Wa
ter
ele
ctr
ical con
du
ctivity (
mS
/cm
)
18/02/2012 18/03/2012 18/04/2012 18/05/2012 18/06/2012 18/07/2012
0
5
10
15
20
ND08 ND09 ND10
Wate
r ele
ctr
ical con
du
ctivity (
mS
/cm
)

Journal of Water Resources and Ocean Science 2020; 9(5): 107-122 119
Figure 14. Piper diagram of groundwater.
In addition, all the piezometers are characterized by a Na/ Cl ratio higher than that of sea water (0.86), especially at the level of the piezometers near the river where the excess of Na relative to Cl is more marked. This enrichment in Na not accompanied by an increase in Cl, further confirming the occurrence of cationic exchanges [47] Appelo and Postma,
2005 [46-48]). This can be verified using the diagram (Na+ K)-Cl as a function of (Ca + Mg)-(HCO3 + SO4) (Figure 15) which shows that all the points with a facies Na-HCO3 line up on the line with slope-1, as do most other structures. Thus, the deficit of Ca and Mg is compensated by an increase in Na concentrations.
Figure 15. Diagram (Na+K)-Cl as a function of (Ca+ Mg)-(HCO3+SO4).
3.2.3. Salt Balance
In order to better understand the movements of salt within the soil, in relation to the movements of water, a salt balance
was carried out. The balance is based on the water balance and its equation is as follows:
With Cirr, the salt concentration of the irrigation canal water;

120 Abdoul Aziz Gning et al.: Hydrogeological Assessments of Impacts of Irrigation on Alluvial Water Table of Delta of Senegal River
Cpar, the salt concentration of the plot water and Csol, the variation in soil salt concentration. All these concentrations were calculated using the electrical conductivities measured in the field, assuming that 1000 µS = 640 mg/L of salts [1].
The salt balance is not balanced. [check repetition here] Indeed, the quantity of salts evacuated by emptying (0.6 t/ha) and that mobilized by variations in stock (0.3 t/ha) are greater than the quantity of salts provided by irrigation (0.72 t/Ha). This assumes that evapotranspiration creates a concentration of salts in the unsaturated zone that will be remobilized by the movements of water generated by changes in stock.
4. Conclusion
Monitoring the behavior of the alluvial water table during a rice-growing season has made it possible to highlight the role of irrigation in replenishing the water table. A level rise of more than one meter is noted in some places. On the other hand, irrigation does not seem to have an effect on the salinity of groundwater since the electrical conductivity measured varies a bit during the campaign.
Calculation of the water balance shows that the irrigation water level at the plot can be reduced without affecting the yield. At the same time, this would reduce the rise of the salt table.
At the level of the salinization process, several trends can be identified. The main source of salinity comes from the water table. However, in the Delta, it is shallow. Its level increases dramatically during irrigation and is strongly influenced by the flood stage. It is therefore necessary to limit its recharge in order to prevent it from salinizing the root zone. In addition, the supply of salt through irrigation should not be neglected.
The layer of water present in the perimeter of Ndelle is often greater than 10 cm. However, it has been shown that rice tolerates a smaller water slide better, especially in the presence of high salinity [30]. Farmers in the area tend to open the bunds as soon as water is available in the irrigation canal. Farmers should be sensitized to better control water supply. Graduated scales could be installed in the perimeters to control the water level. Further studies should also be carried out in the Delta to determine the optimum water level for each stage of development of the used varieties.
The irrigation water is not very salty. However, since natural drainage is almost inexistent and the volumes of water supplied very large, salts tend to accumulate in the soil. According to Boivin et al. (2002) [49]. The salts provided by irrigation would still be leached at the end of the crop when the water table goes down and the air in the soil can escape. However, this claim could not be verified. It would be interesting to continue monitoring the perimeter for several seasons in order to see if an increase in salinity may occur in the long term.
A drainage network, even superficial, is essential to fight against salinity. In its absence, salts accumulate in the soil without ever being leached out. The solution becomes concentrated due to evaporation, and after four or five years the soil becomes unusable. The presence of a drainage
network should become an obligation. The leaching fraction must be calibrated in order to limit water consumption and stop the salinization process.
Watering prior to cultivation followed by emptying 24 hours later (to allow the salts time to dissolve) makes it possible to leach the salts that accumulate on the surface during inter-culture (fight against capillary rise) [32]. To fight against capillary rise, it is also advisable to work the soil on the surface quickly after harvest in order to break the capillaries and limit the upward flow. Emptying before harvest is essential. Complete emptying before each crop cycle should allow the salts to be evacuated before the concentration of water.
References
[1] Food and Agriculture Organization of the United Nations (FAO), “Water for Sustainable Food and Agriculture A report produced for the G20 Presidency of Germany,” Rome, 2017.
[2] Yao F, Xu Y, Lin E, Yokozawa M, Zhang J. 2007. Assessing the impacts of climate change on rice yields in the main rice areas of China. Climatic Change, 80, 395-409.
[3] Cannarozzo M, Noto LV, Viola F. 2006. Spatial distribution of rainfall trends in Sicily (1921– 2000). Physics and Chemistry of the Earth 31: 1201–1211.
[4] Liu et al. 2008 Liu, L., M. I. Mishchenko, and W. P. Arnott, 2008: A study of radiative properties of fractal soot aggregates using the superposition T-matrix method. J. Quant. Spectrosc. Radiat. Transfer, 109, 2656-2663.
[5] Ashaolu ED. 2018. Effect of climate and land use/land cover change on groundwater recharge in Osun drainage basin, Nigeria. (Ph. D. Thesis), University of Ilorin, Nigeria.
[6] Christopherson RW. 1995. Elemental Geosystems, Macmillan, New York. Pp. 230-239.
[7] IPCC 2007. Summary for policymakers. In: Solomon S, Qin D, Manning M, Chen Z, Marquis M, Averyt K, Tignor M, Miller HL (eds) Climate change 2007: the physical science basis. Contribution of working group I to the Forth Assessment Report of the Intergovernmental Panel on Climate Change. Cambridge University Press, Cambridge, pp 1–18.
[8] Food and Agriculture Organization of the United Nations (FAO), “The State of the World’s Land and Water Resources for Food and Agriculture,” 2009.
[9] A. Pulido-Bosch, J. P. Rigol-Sanchez, A. Vallejos, J. M. Andreu, J. C. Ceron, L. Molina-Sanchez F. Sola, 2018: Impacts of agricultural irrigation on groundwater salinity Environmental Earth Sciences 77 (5) • March 2018 DOI: 10.1007/s12665-018-7386-6.
[10] Bouwer, H. 2002. Integrated water management for the 21st century: problems and solutions. J. Irri. Dra. Eng. ASCE, 128: 193-202.
[11] Audibert, M., 1970. Etude hydro-agricole du bassin du fleuve Sénégal. Delta du Fleuve Sénégal: Etude Hydrogéologique. Généralités et rapport de synthèse, Organisation des Nations Unies pour l’alimentation et l’agriculture (FAO).
Journal of Water Resources and Ocean Science 2020; 9(5): 107-122 121
[12] Narany ST, Ramli MF, Aris AZ, Sulaiman WN, Juahir H, Fakharian K (2014) Identification of the hydrogeochemical processes in groundwater using classic integrated geochemical methods and geostatistical techniques, in Amol-Babol plain, Iran. Sci World J 2014: 1–15.
[13] Farid, 1980. Farid, M., 1980, Nile Delta Groundwater Study, Cairo University.
[14] Diene, R. S. 1998. Riziculture et dégradation des sols en vallée du fleuveSénégal: analyse comparée des fonctionnements hydro-salins des sols du delta et de la moyenne vallée en simple et double riziculture. Ph. D. dissertation.
[15] Government of Western Australia, Department of Water. Understanding Salinity. http://www.water.wa.gov.au/water-topics/water-quality/managing-water-quality/understanding-salinity.
[16] Da Boit, M., Impact des aménagements hydro-agricoles sur la nappe superficielle de la basse vallée du fleuve Sénégal (Thiagar, Richard Toll, Dagana). 1993, FST-UCAD. 94 pages
[17] Kirsch, R., 2009. Groundwater quality-saltwater intrusions. Groundwater Geophysics, a tool for Hydrogeology, second edition, (p. 475-488).
[18] Abdoul Aziz Gning, Mansour Gueye, Mapathé Ndiaye, Fatou Ngom Diop, Raymond Malou “Dynamics and Interactions between Surface Water, Irrigation Water, and Groundwater in the Senegal River Delta’ American Journal of Water Resources. 2020, 8 (2), 78-91. DOI: 10.12691/ajwr-8-2-4.
[19] Lange, G. et Seidel, K., 2007. Electromagnetic Methods. Environmental Geology: Handbook of Field Methods and Case Studies, (p. 239-281). Springer Publishing.
[20] Mean, A., 2011. Caractérisation hydrogéologique du Delta du Fleuve Sénégal. Master Thesis, University of Liège, Faculty of Sciences, Department of Geology.
[21] Ceuppens, J. and M. C. S. Wopereis, “Impact of non-drained irrigated rice cropping on soil salinization in the Senegal River Delta”, Geoderma, vol. 92. 125-140. 1999.
[22] Van Asten P. J. A., L. Barbiero, M. C. S. Wopereis, J. L. MAEGHT et S. E. A. T. M VAN DER ZEE (2003). Actual and potential salt-related soil degradation in an irrigated rice scheme in the Sahelian zone of Mauritania. Agric. Water Manag., 60, 13-32.
[23] SAED/DAIH/DHGE. (2008), Bilan de prélèvements d’eau et d’énergie, Délégation de Dagana Campagnes SSF, SSC et HIV 2005 Rapport provisoire 22p.
[24] Boike, J., Roth, K., 1997. Time domain reflectometry as a field method for measuring water content and soil water electrical conductivity at a continuous permafrost site. Permafr. Periglac. Process. 8 (4).
[25] S. Schneider Y. Coquet P. Vachier C. Labat J. Roger‐Estrade P. Benoit V. Pot S. Houot “Effect of Urban Waste Compost Application on Soil Near‐Saturated Hydraulic Conductivity” Journal of Environmental Quality, 25 Feb 2009, 38 (2): 772-781 DOI: 10.2134/jeq2008.0098.
[26] Dalton, F. N., et al. "Time-domain reflectometry: simultaneous measurement of soil water content and electrical conductivity." Science, vol. 224, 1984, p. 989+. Accessed 14 Aug. 2020.
[27] A. Nadler S. Dasberg I. Lapid’1991’Time Domain Nadler A, Dasberg S., Lapid 1., 1991: Time domain reflectometry measurements of water content and electrical conductivity of layered soil columns. Soil Sci. Soc. Am. J. 55: 938-943. https://doi.org/10.2136/sssaj1991.03615995005500040007x
[28] Topp, G. C., J. L. Davis, and A. P. Annan. 1980. Electromagnetic determination of soil water content: Measurement in coaxial transmis lines. Water Resour. Res. 16: 574–582.
[29] Noborio, K. (2001). Measurement of soil water content and electrical conductivity by time domain reflectometry: A review. Computers and Electronics in Agriculture, 31 (3), 213-237. https://doi.org/10.1016/S0168-1699(00)00184-8
[30] Zeng L, Lesch SM, et Grieve CM: 2003. Rice growth and yield respond to changes in water depth and salinity stress.: Agricultural Water Management 59: 67-75.
[31] Gourlez de la Motte L: 2012. Salinisation progressive des eaux et des sols liée aux conditions hydrogéologiques et aux pratiques d'irrigation dans une riziculture du Delta du fleuve Sénégal Travail de Fin d'Etudes Université de Liège. 65 pp.
[32] Lacharme M: 2001. Le contrôle de la salinité dans les rizières: «Mémento Technique de Riziculture», V. 20 pp.
[33] Allen R. G., Pereira L. S., Raes D. et Smith M. (1998)-Crop evapotranspiration. Guidelines for computing crop requirements. FAO irrigation and drainage paper, vol. 56, Rome, 15 p.
[34] Frank Raes “Entrainment of free tropospheric aerosols as a regulating mechanism for cloud condensation nuclei in the remote marine boundary layer”, First published: 20 February 1995 https://doi.org/10.1029/94JD02832, American Geophysical Union.
[35] Hammecker C., A. C. D Antonio, J. L. Maegth et P. Boivin P. (2003) Experimental and numerical study of water flow in soil under irrigation in northern Senegal: evidence of air entrapment. Eur. J. Soil Sci., 54, 491-503.
[36] Boivin P., D. Brunet, C. Gascuel-Odoux, P. Zante et J. P. Ndiaye (1995). Les sols argileux de la région de Nianga-Podor: répartition, caractéristiques, aptitudes et risques de dégradation sous irrigation. Dans Nianga, laboratoire de l’agriculture irriguée en moyenne vallée du Sénégal, BOIVIN P., DIA I, LERICOLLAIS A., POUSSIN J. C., SANTOIR C. et SECK S. M. [Éditeurs.], pp. 67-81.
[37] Hammecker C., Van Asten P. J. A., Marlet S., Maeght J. L., Poss R. 2009. Simulating the evolution of soil solutions in irrigated rice soils in the Sahel. Geoderma, 150 (1-2): 129-140.
[38] Ndiaye, M-K. 1987. Evaluation de la fertilité des sols 5 l’office du Niger (Mali). Contribution à la recherche des causes et origines de la dégradation des sols dans le kouroumari. Doctorat thèsis, INP Toulouse.
[39] Barbiéro L. et Laperrousaz C., 1999. La cartographie de la salinité dans la vallée du fleuve Sénégal. Succès d'une démarche ascendante. Colloque Geofcan, Géophysique des sols et des formations superficielles, 21-22 septembre 1999, Orléans (BRGM, INRA, IRD, UPMC).
[40] Valles, V. (1987). étude et modÇlisation des transferts d‘eau et de sel dans un sol argileux. Application au calcul de doses d’irrigation, Sci. GÇol. MÇm., 79, 148 p.

122 Abdoul Aziz Gning et al.: Hydrogeological Assessments of Impacts of Irrigation on Alluvial Water Table of Delta of Senegal River
[41] Guédarri M. (1984). GÇochimie et thermodynamique des Çvaporites continentales. étude du lac Natron en Tanzanie et du Chott el Jerid en Tunisie, Sci. GÇol. MÇm., 76, 143 p.
[42] Barbiéro Laurent. (1994). Les sols alcalinisés sur socle dans la vallée du fleuve Niger: origines de l'alcalinisation et évolution des sols sous irrigation. Rennes (FRA); Paris: ENSAR; INRA, 209 p. multigr. + 50 p. multigr. These Sci. de l'Environnement, ENSAR: Rennes. 1994/01/13.
[43] Boivin P., Favre F. et Maegth J. L. (1998). Les sols de la moyenne vallée du Fleuve Sénégal: caractéristiques et évolution sous irrigation. Étude gestion sols, 5, 235-246.
[44] Parkkurst, D. L., et Appelo, C. A. J., 1999, User's guide to PHREEQC (version 2)-a computer program for speciation, reaction-path, 1D-transport, and inverse geochemical calculations.: USGS. Water Resour. Inv. Rep. 99-4259, v. 312.
[45] Wopereis, M. C. S., J. Ceuppens, J., Boivin, P., Ndiaye, A. M.,
et Kane, A., 1998, Preserving soil quality under irrigation in the Senegal River Valley: Netherlands Journal of Agricultural Science, v. 46, no. 1, p. 97-107.
[46] Appelo, C. A. J., et Postma, D., 2005, Geochemistry, Groundwater and Pollution, Rotterdam.
[47] Abdelgader, A., Achour, F., et Mudry, J., 1996, Validation des écoulements par l'analyse discriminante: Revue des scicences de l'eau, v. 2, no. 219-230.
[48] Madioune, D. H., 2012, Etude hydrogéologique du système aquifère du horst de Diass en condition d’exploitation intensive (bassin sédimentaire sénégalais): apport des techniques de télédétection, modélisation, géochimie et isotopie Thèse de Doctorat en Sciences de l'Ingénieur Université de Liège (ULG).
[49] Boivin, P., et al., 2002, Processes driving soil solution chemistry in a flooded rice-cropped vertisol: analysis of long-time monitoring data: Geoderma, v. 110 (2002) no. 87-107.