hydrogeologic site characterization using azimuthal resistivity surveys
TRANSCRIPT

179
Hydrogeologic Site Characterization Using Azimuthal Resistivity Surveys
Luis E. Marin1 \ Birgit Steinich2, D. Jaglowski3, and M.J. Barcelona3
'Instituto de Geofisica, Tnstituto de Geologia, Universidad Nacional Autonoma de Mexico, Mexico City, Mexico CP 04510
?Department of Civil and Environmental Engineering, University of Michigan, 1223 1ST Building, 2200 Bonisteel Blvd., Ann Arbor, MI 48109
ABSTRACT
The purpose of this work is to evaluate whether azimuthal resistivity surveys (ARS) provide diagnostic information for mapping preferred hydraulic conductivity directions in unconsolidated sediments as they do in fractures/jointed media. Nineteen azimuthal resistivity surveys (ARS) were conducted in three different places within a shallow, unconsolidated, sand and gravel aquifer located at the Michigan Integrated Remediation Technology Laboratory (MIRTL). Two of the three places where soundings were conducted lie along the flow path where a controlled tracer release using bromide took place. The ARS were conducted using a Wenner array, with electrode separations (AB/ 3) that ranged from 4.0-11.0 meters. Electrical anisotropy ratios gave a range of 1.08-1.37 for all 19 soundings. Ground water direction of the induced plume was along the regional flow path as determined for the period from July 1996, using continuous water level recorders. Thus, the observed electrical anisotropy ratios were not significant enough to represent changes in the regional ground water flow direction. However, the results from this work suggest that ARS may be used as part of an integrated hydrogeological study which may yield semi-quantitative information of the electrical anisotropy with increasing electrode spacing.
Introduction
The University of Michigan's National Center for Integrated Bioremediation Research and Development (NCIBRD) conducts field site characterization and bioremediation technology demonstrations at the former Wurt-smith Air Force Base (WAFB) where ground water quality has been affected by previous spills of trichloroethene, dichloroethene, and various fuels. Three pump and treat systems have been installed at the base and are currently in operation to contain these known contaminant plumes. Wurtsmith Air Force Base is located in Iosco County in the northeastern part of Michigan's lower Peninsula at 44°28' North and 83°22' West. The base is located on a five mile wide sandy plain that is part of the Oscoda Lake Plain. The hydrogeology at WAFB is relatively simple. It consists of unconsolidated sediments deposited during glacial episodes of the Pleistocene Epoch which lie unconformably over bedrock. The main source of water supply is a shallow un-confined aquifer located in clean, medium-grained sand and gravel (USGS, 1990). The unconfined aquifer is overlain by a very thin soil cover, on the order of 10 cm. The aquifer ranges in thickness from nine to 25 meters. There is a thick clay layer underlaying these sediments. The specific conductance of the shallow ground water at WAFB is on the order of 100-800 |Jimhos/cm. Cummings and Twenter (1986) report that the hydraulic conductivity within the base ranges between 12 m/d and 45 m/d.
The NCIBRD has developed plans for the installation of an in situ research facility to evaluate the performance of various bioremediation approaches. At this facility, known as the Michigan Integrated Remediation Technology Laboratory (MIRTL), a tracer study using bromide was conducted to determine aquifer properties relevant to the transport and distribution of injected contaminants. Another purpose was to evaluate the variability of low paths in time so that operation of parallel test lanes without physical barriers could be determined. The depth to the water table underneath the MIRTL is five meters. A solution with 200 mg/1 bromide was injected one meter below the water table. The bromide was introduced into the ground on September 3, 1996, and the plume traveled 88 meters with a vertical dispersion of 3.3 m, over a 241 day period. The plume consistently traveled along the direction of ground water flow during this time.
As part of the hydrogeologic site characterization, several different methodologies were employed to estimate the value of the hydraulic conductivity as well as to examine the nature of the sediments. These were grain-size analysis, falling head permeameter tests and pneumatic slug tests. The range in values were 2.8-23 m/d for the grain size analyses, 4-16 m/d for the falling head permeameter tests and 8-29 m/d for the slug test data. It is interesting to note (and not totally unexpected) that variations in the grain size were observed in the vertical direction (Aubochon et ai, 1996). Except for the thin soil cover mentioned above, no
JEEG, December 1998, Volume 3, Issue 4, p. 179-184
Dow
nloa
ded
12/1
9/14
to 1
69.2
30.2
43.2
52. R
edis
trib
utio
n su
bjec
t to
SEG
lice
nse
or c
opyr
ight
; see
Ter
ms
of U
se a
t http
://lib
rary
.seg
.org
/
180
Journal of Environmental and Engineering Geophysics
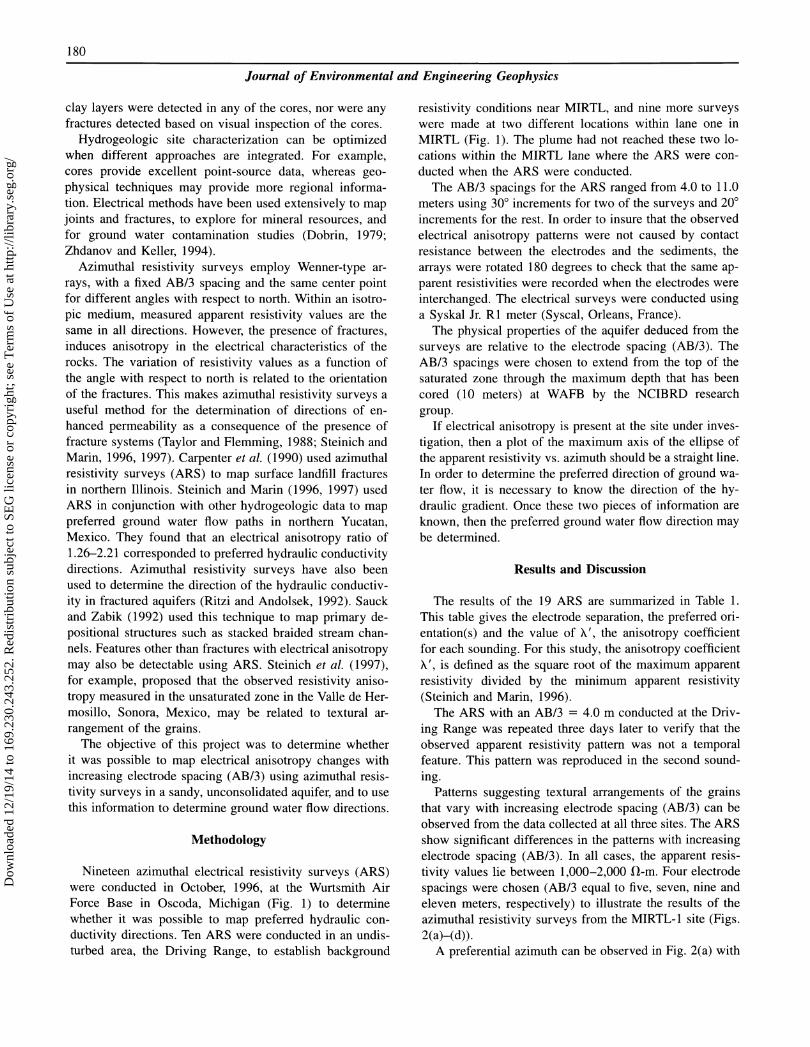
clay layers were detected in any of the cores, nor were any fractures detected based on visual inspection of the cores.
Hydrogeologic site characterization can be optimized when different approaches are integrated. For example, cores provide excellent point-source data, whereas geophysical techniques may provide more regional information. Electrical methods have been used extensively to map joints and fractures, to explore for mineral resources, and for ground water contamination studies (Dobrin, 1979; Zhdanov and Keller, 1994).
Azimuthal resistivity surveys employ Wenner-type arrays, with a fixed AB/3 spacing and the same center point for different angles with respect to north. Within an isotropic medium, measured apparent resistivity values are the same in all directions. However, the presence of fractures, induces anisotropy in the electrical characteristics of the rocks. The variation of resistivity values as a function of the angle with respect to north is related to the orientation of the fractures. This makes azimuthal resistivity surveys a useful method for the determination of directions of enhanced permeability as a consequence of the presence of fracture systems (Taylor and Flemming, 1988; Steinich and Marin, 1996, 1997). Carpenter et al. (1990) used azimuthal resistivity surveys (ARS) to map surface landfill fractures in northern Illinois. Steinich and Marin (1996, 1997) used ARS in conjunction with other hydrogeologic data to map preferred ground water flow paths in northern Yucatan, Mexico. They found that an electrical anisotropy ratio of 1.26-2.21 corresponded to preferred hydraulic conductivity directions. Azimuthal resistivity surveys have also been used to determine the direction of the hydraulic conductivity in fractured aquifers (Ritzi and Andolsek, 1992). Sauck and Zabik (1992) used this technique to map primary de-positional structures such as stacked braided stream channels. Features other than fractures with electrical anisotropy may also be detectable using ARS. Steinich et al (1997), for example, proposed that the observed resistivity anisotropy measured in the unsaturated zone in the Valle de Her-mosillo, Sonora, Mexico, may be related to textural arrangement of the grains.
The objective of this project was to determine whether it was possible to map electrical anisotropy changes with increasing electrode spacing (AB/3) using azimuthal resistivity surveys in a sandy, unconsolidated aquifer, and to use this information to determine ground water flow directions.
Methodology
Nineteen azimuthal electrical resistivity surveys (ARS) were conducted in October, 1996, at the Wurtsmith Air Force Base in Oscoda, Michigan (Fig. 1) to determine whether it was possible to map preferred hydraulic conductivity directions. Ten ARS were conducted in an undisturbed area, the Driving Range, to establish background
resistivity conditions near MIRTL, and nine more surveys were made at two different locations within lane one in MIRTL (Fig. 1). The plume had not reached these two locations within the MIRTL lane where the ARS were conducted when the ARS were conducted.
The AB/3 spacings for the ARS ranged from 4.0 to 11.0 meters using 30° increments for two of the surveys and 20° increments for the rest. In order to insure that the observed electrical anisotropy patterns were not caused by contact resistance between the electrodes and the sediments, the arrays were rotated 180 degrees to check that the same apparent resistivities were recorded when the electrodes were interchanged. The electrical surveys were conducted using a Syskal Jr. Rl meter (Syscal, Orleans, France).
The physical properties of the aquifer deduced from the surveys are relative to the electrode spacing (AB/3). The AB/3 spacings were chosen to extend from the top of the saturated zone through the maximum depth that has been cored (10 meters) at WAFB by the NCIBRD research group.
If electrical anisotropy is present at the site under investigation, then a plot of the maximum axis of the ellipse of the apparent resistivity vs. azimuth should be a straight line. In order to determine the preferred direction of ground water flow, it is necessary to know the direction of the hydraulic gradient. Once these two pieces of information are known, then the preferred ground water flow direction may be determined.
Results and Discussion
The results of the 19 ARS are summarized in Table 1. This table gives the electrode separation, the preferred orientation^) and the value of X', the anisotropy coefficient for each sounding. For this study, the anisotropy coefficient X', is defined as the square root of the maximum apparent resistivity divided by the minimum apparent resistivity (Steinich and Marin, 1996).
The ARS with an AB/3 = 4.0 m conducted at the Driving Range was repeated three days later to verify that the observed apparent resistivity pattern was not a temporal feature. This pattern was reproduced in the second sounding.
Patterns suggesting textural arrangements of the grains that vary with increasing electrode spacing (AB/3) can be observed from the data collected at all three sites. The ARS show significant differences in the patterns with increasing electrode spacing (AB/3). In all cases, the apparent resistivity values lie between 1,000-2,000 fl-m. Four electrode spacings were chosen (AB/3 equal to five, seven, nine and eleven meters, respectively) to illustrate the results of the azimuthal resistivity surveys from the MIRTL-1 site (Figs. 2(a)-(d)).
A preferential azimuth can be observed in Fig. 2(a) with
Dow
nloa
ded
12/1
9/14
to 1
69.2
30.2
43.2
52. R
edis
trib
utio
n su
bjec
t to
SEG
lice
nse
or c
opyr
ight
; see
Ter
ms
of U
se a
t http
://lib
rary
.seg
.org
/
181
Marin et ah: Hydrogeologic Site Characterization Using Azimuthal Resistivity Surveys
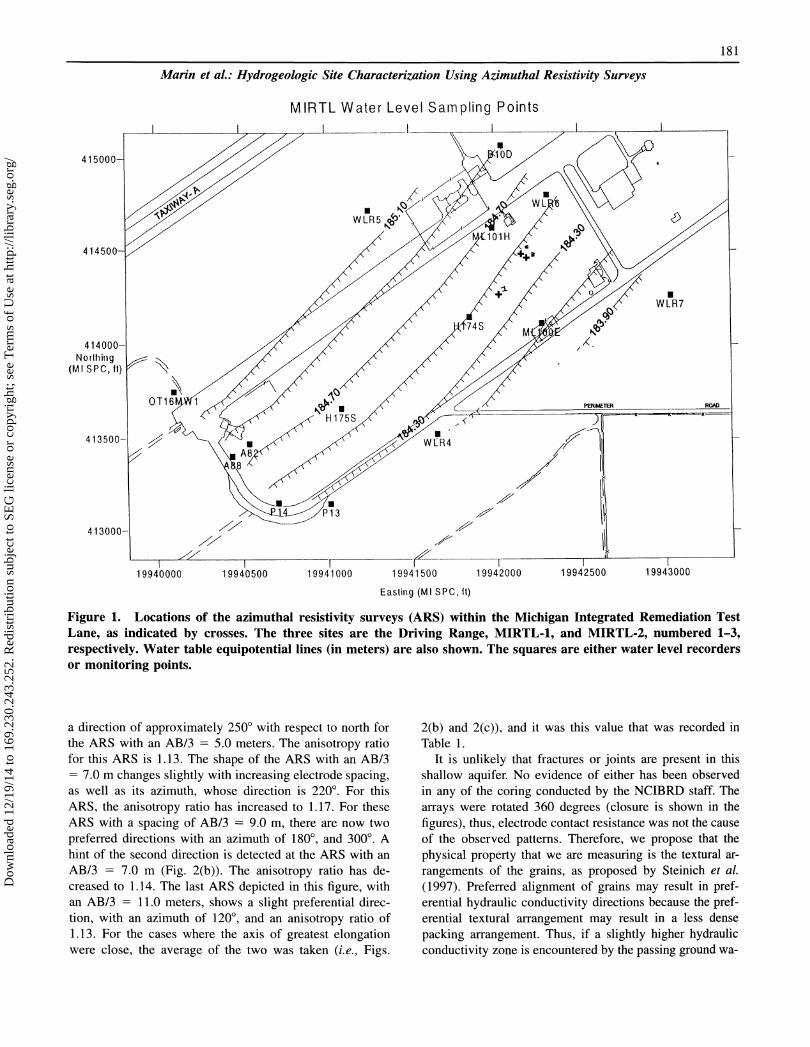
Figure 1. Locations of the azimuthal resistivity surveys (ARS) within the Michigan Integrated Remediation Test Lane, as indicated by crosses. The three sites are the Driving Range, MIRTL-1, and MIRTL-2, numbered 1-3, respectively. Water table equipotential lines (in meters) are also shown. The squares are either water level recorders or monitoring points.
a direction of approximately 250° with respect to north for the ARS with an AB/3 = 5.0 meters. The anisotropy ratio for this ARS is 1.13. The shape of the ARS with an AB/3 = 7.0 m changes slightly with increasing electrode spacing, as well as its azimuth, whose direction is 220°. For this ARS, the anisotropy ratio has increased to 1.17. For these ARS with a spacing of AB/3 = 9.0 m, there are now two preferred directions with an azimuth of 180°, and 300°. A hint of the second direction is detected at the ARS with an AB/3 = 7.0 m (Fig. 2(b)). The anisotropy ratio has decreased to 1.14. The last ARS depicted in this figure, with an AB/3 =11.0 meters, shows a slight preferential direction, with an azimuth of 120°, and an anisotropy ratio of 1.13. For the cases where the axis of greatest elongation were close, the average of the two was taken (i.e., Figs.
2(b) and 2(c)), and it was this value that was recorded in Table 1.
It is unlikely that fractures or joints are present in this shallow aquifer. No evidence of either has been observed in any of the coring conducted by the NCIBRD staff. The arrays were rotated 360 degrees (closure is shown in the figures), thus, electrode contact resistance was not the cause of the observed patterns. Therefore, we propose that the physical property that we are measuring is the textural arrangements of the grains, as proposed by Steinich et al (1997). Preferred alignment of grains may result in preferential hydraulic conductivity directions because the preferential textural arrangement may result in a less dense packing arrangement. Thus, if a slightly higher hydraulic conductivity zone is encountered by the passing ground wa-
Dow
nloa
ded
12/1
9/14
to 1
69.2
30.2
43.2
52. R
edis
trib
utio
n su
bjec
t to
SEG
lice
nse
or c
opyr
ight
; see
Ter
ms
of U
se a
t http
://lib
rary
.seg
.org
/

182
Journal of Environmental and Engineering Geophysics
Table 1. Electrode spacing (AB/3), axis of greatest elongation in the resistivity plots integrated with hydraulic gradient using the ARS, and electrical anisot-ropy ratio, A'. The axis data presented in column two have been integrated with the hydraulic gradient to choose the preferred direction in which ground water would flow, if these mapped textural arrangements were large enough to cause such a deviation. For all three AB/3 = nine meters, there is a second preferred direction. This is highlighted with a star in the table.
Preferred orientation, AB/3, meters degrees V
Driving Range 4.0 90 1.08 5.0 250 1.09 6.0 260 1.10 7.0 250 1.09 8.0 240 1.09 9.0 180 1.09 9.0* 240 1.09*
10.0 180 1.10 11.0 200 1.11
MIRTL-1
5.0 260 1.13 6.0 240 1.20 7.0 220 1.17 9.0 240 1.14 9.0* 300 1.14*
10.0 300 1.09 11.0 300 1.13
MIRTL-2
9.0 200 1.11 9.0* 210 1.11*
10.0 300 1.37 10.0 210 1.19
ter, it will preferentially flow through these higher hydraulic conductivity zones. The electrical current will flow preferentially through water than through a solid, making it possible to map these features with an electrical technique such as the ARS.
The ARS gives an orientation as a straight line. In order to determine which is the preferred direction of the hydraulic conductivity, the direction of the hydraulic gradient is needed. Since ground water flow at the MIRTL area is towards the east-southeast (124°; with a standard deviation of 4.6°) as determined from data from six continuous water level recorders for the period of July 1996 through the present, the direction of preferred hydraulic conductivity as
mapped using the azimuthal resistivity surveys are shown in Table 1.
Assuming that the electrical anisotropy is a result of the textural arrangement of the sand grains, these would correspond to the prevailing directions during deposition such as wind and/or water currents. Thus, it would not be unexpected to identify different preferential directions at the same or different electrode spacings. One example of this scenario, can be observed at site MIRTL-1 (AB/3 = 9.0 m) where two different preferential directions have been identified. On the other hand, if the observed textures show the same prevailing direction, this may suggest that either they were part of the same depositional package, or that they were deposited with a similar prevailing direction. Comparing the directions obtained for both MIRTL sites (1 & 2) for an AB/3 spacing of nine to eleven meters, there is this suggestion, since the prevailing directions are 120°. With the exception of one of the directions obtained for the AB/3 = 9.0 m, these appear to be local effects, since these directions are not observed at the third site, which is located 100 meters away (Driving Range).
The anisotropy coefficient values obtained in this study range from 1.08-1.37. These values are below the threshold level needed to allow ground water to flow in a different direction than the 'regional' hydraulic gradient. This suggests, that unlike fractured/jointed systems in which variations in X' on the order of 10% may correspond to preferred ground water flow paths, larger physical changes corresponding to larger variations in the electrical anisotropy coefficient are needed before significant deviations in ground water will occur. Although variations on the order of 8-37% were measured regarding the changes in X' with increasing electrode spacing at the WAFB, these changes apparently are not large enough to allow ground water to deviate from its 'regional' direction. However, it is encouraging to be able to detect and 'map' electrically anisotropic zones in a shallow, unconfined, sand and gravel aquifer. It is possible that the electrical anisotropy measured in this study is a result of the grain packing texture, which would lead to a small variation in the apparent resistivity. The work presented here also suggests that variations in the electrical anisotropy ratio (X') of ten percent do not represent physical changes that are significant enough to alter ground water flow directions. The results from the azimuthal resistivity surveys conducted at the Michigan Integrated Remediation Technology Laboratory suggest that this geophysical technique may be used successfully as part of an integrated hydrogeological study which, for simple aquifer systems, may yield semi-quantitative information on the electrical anisotropy properties with increasing electrode spacing. This information may in turn be used locally to gain a better understanding of the local isotropic/anisotropic properties of the aquifer. The ARS must be field verified in each case; however, in this particular case, the grain
Dow
nloa
ded
12/1
9/14
to 1
69.2
30.2
43.2
52. R
edis
trib
utio
n su
bjec
t to
SEG
lice
nse
or c
opyr
ight
; see
Ter
ms
of U
se a
t http
://lib
rary
.seg
.org
/

183
Marin et ah: Hydrogeologic Site Characterization Using Azimuthal Resistivity Surveys
Figure 2. Apparent resistivity values (fl-m) vs. azimuth at four different electrode spacings (AB/3): (a) five, (b) seven, (c) nine and (d) eleven meters for selected azimuthal resistivity surveys from MIRTL-1. All azimuthal directions are measured with respect to true north (values were not corrected for the magnetic deviation).
size study shows that textural changes are present with depth at MIRTL. The information obtained from a study such as this one may allow hydrogeologists to have a better understanding of the medium. It may also help to choose appropriate locations for pump and treat systems, or it may be used to 'map' preferential hydraulic conductivity directions underlying landfills or other sites of interest.
Conclusions
Nineteen azimuthal resistivity surveys, using the Wenner array, were conducted at the Michigan Integrated Remediation Technology Laboratory Area to evaluate the method in assisting with hydrogeological site characterization of simple sand and gravel aquifers. Electrode spacings (AB/
Dow
nloa
ded
12/1
9/14
to 1
69.2
30.2
43.2
52. R
edis
trib
utio
n su
bjec
t to
SEG
lice
nse
or c
opyr
ight
; see
Ter
ms
of U
se a
t http
://lib
rary
.seg
.org
/
184
Journal of Environmental and Engineering Geophysics
3) ranged from four to eleven meters. Although changes in the apparent resistivity with increasing electrode spacing were observed for this aquifer, which led to an electrical anisotropy ratio of (X') on the order of 1.08-1.37, these values do not correspond to physical characteristics such as textural changes that is significant enough to force ground water flow to deviate from its 'regional' flow direction. These results, however, suggest that azimuthal resistivity surveys may help as part of hydrogeologic site characterization studies in porous media as a semi-quantitative method to determine the local anisotropic conditions and perhaps to determine the preferred direction(s) of the hydraulic conductivity.
Acknowledgements
Marin acknowledges support from the Consejo Nacional de Ciencia y Tecnologia (Grant 025 8PT) as well as a sabbatical fellowship from the Direccion General de Asuntos del Personal Aca-demico of the Universidad Nacional Autonoma de Mexico. Partial support was obtained from the University of Michigan and the Strategic Environmental Research and Development Program, U.S. Department of Defense. Patricia Beddows and Gerardo Bo-canegra helped out with the field work. Mark Henry provided invaluable logistical support. The authors also thank Jerry Mc-Junkin of TerraPlus, Inc. for the loan of the geophysical equipment as well as Phil Carpenter and an anonymous reviewer for revisions which improved this manuscript.
References
Aubuchon, J., Duram, D., Greene, C , 1996, Determination and comparison of hydraulic conductivity by three methods in the Michigan Integrated Remediation Laboratory Area: NCIBRD, 16 pp.
Carpenter, P., Kaufman, R., and Price, B., 1990, Use of resistivity soundings to determine landfill structure: Ground Water, 28(4), 560-575.
Cummings, T.R., and Twenter, F.R., 1986, Assessment of ground water contamination at Wurtsmith Air Force Base, Michigan, 1982-1985: United States Geological Survey, Water Resources Investigations Report, 86-4188.
Dobrin, M.B., 1979, Introduction to Geophysical Prospecting, 3rd Edition: McGraw-Hill.
Ritzi, R.W, and Andolsek, R.H., 1992, Relation between anisotropic transmissivity and azimuthal resistivity surveys in shallow, fractured, carbonate flow systems: Ground Water, 30(5), 774-780.
Sauck, A.W, and Zabik, S.M., 1992, Azimuthal resistivity techniques and the directional variations in hydraulic conductivity in glacial sediments, in Proceedings of the Symposium on the Application of Geophysics to Engineering and Environmental Problems, R.S. Bell (ed.), The Society of Engineering and Mineral Exploration Geophysicists, SA-GEEP, 1992, 1, 197-222.
Steinich, B., and Marin, L.E., 1996, Hydrogeological investigations in northwestern Yucatan, Mexico, using resistivity surveys: Ground Water 34(4), 640-646.
Steinich, B., and Marin, L.E., 1997, Determination of flow characteristics in the aquifer of the northwestern Peninsula of Yucatan, Mexico: Journal of Hydrology 191, 315-331.
Taylor, R.W, and Flemming, A.H., 1988, Characterizing jointed systems by azimuthal resistivity surveys: Ground Water, 26(4), 464-474.
USGS, 1990, Installation, Restoration Program Phase II-Confir-mation/Quantification Stage 2, Wurtsmith Air Force Base, Michigan: Hydrogeology near Wurtsmith Air Force Base, Michigan: United States Geological Survey, Water Resources Division.
Zhdanov, M.S., and Keller, G.V., 1994, The geoelectrical methods in geophysical exploration, Elsevier, Amsterdam, Netherlands, 873 pp.
Dow
nloa
ded
12/1
9/14
to 1
69.2
30.2
43.2
52. R
edis
trib
utio
n su
bjec
t to
SEG
lice
nse
or c
opyr
ight
; see
Ter
ms
of U
se a
t http
://lib
rary
.seg
.org
/