hydrogeologic and water-quality data from wells …
TRANSCRIPT
HYDROGEOLOGIC AND WATER-QUALITY DATA
FROM WELLS NEAR THE HUECO BOLSON
RECHARGE PROJECT AREA, EL PASO,
TEXAS, 1990 AND 1991
By Robert D. Brock, Paul M. Buszka, and Edward M. Godsy
U.S. GEOLOGICAL SURVEY Open-File Report 94-329
Prepared in cooperation with theEL PASO WATER UTILITIES-PUBLIC SERVICE BOARD,
TEXAS WATER DEVELOPMENT BOARD,
and
U.S. DEPARTMENT OF THE INTERIOR,
U.S. BUREAU OF RECLAMATION
Austin, Texas 1994

U.S. DEPARTMENT OF THE INTERIOR
BRUCE BABBITT, Secretary
U.S. GEOLOGICAL SURVEY
Gordon P. Eaton, Director
Any use of trade, product, or firm names is for descriptive purposes only and does not imply endorsement by the U.S. Government.
For additional information write to: Copies of this report can be purchased from:
U.S. Geological Survey Earth Science Information Center
District Chief Open-File Reports Section U.S. Geological Survey Box 25286, Mail Stop 517 8011 Cameron Rd. Denver Federal Center Austin, TX 78754-3898 Denver, CO 80225-0046

CONTENTS
Abstract ..................................................................................................^^ 1Introduction .......................................................................................................................................................................... 1
Purpose and Scope .................................................................................................................................................... 2Description of the Study Area .................................................................................................................................. 2Previous Investigations ............................................................................................................................................. 2Well-Numbering System .......................................................................................................................................... 2
Hydrogeologic Data ............................................................ 5Data-Collection Methods.......................................................................................................................................... 5Results ........................................................._ 7
Water-Quality Data......................................................................................^ 13Description of Wells Sampled .................................................................................................................................. 13Data Collection and Analysis Methods .................................................................................................................... 13Quality Assurance..................................................................................................................................................... 20Results ...........................................................^ 29
Physical Properties, Major Ions, and Trace Elements ................................................................................... 29Nutrients and Field Colorimetric Analyses ................................................................................................... 30Stable-Isotopic Ratios ................................................................................................................................... 30Organic Carbon and Methylene Blue Active Substances ............................................................................. 30Volatile and Semivolatile Organic Compounds ............................................................................................ 31Bacterial Analyses......................................................................................................................................... 32
References Cited .................................................................................................................................................................. 32
FIGURES
1. Map showing location of the study area ............................................................................................................... 32. Map showing location of wells in northeast El Paso in and near the Hueco Bolson Recharge
Project area ......................................................................................................................................................... 43-6. Selected geophysical logs from:
3. Observation well 5-621 in the Hueco Bolson Recharge Project area, El Paso, Texas .............................. 84. Observation well 5-622 in the Hueco Bolson Recharge Project area, El Paso, Texas .............................. 95. Observation well 5-625 in the Hueco Bolson Recharge Project area, El Paso, Texas .............................. 106. Observation well 5-626 in the Hueco Bolson Recharge Project area, El Paso, Texas .............................. 11
7-9. Graphs showing:7. Cumulative volumes of injected water from the Hueco Bolson Recharge Project area,
El Paso, Texas, water withdrawn from adjacent wells, and the cumulative difference between injected and withdrawn water volumes ....................................................................................... 12
8. Volume of treated water injected into the Hueco bolson aquifer by wells in the HuecoBolson Recharge Project area, El Paso, Texas ........................................................................................... 14
9. Volume of water withdrawn from the Hueco bolson aquifer by wells in the Hueco BolsonRecharge Project area, El Paso, Texas ....................................................................................................... 18
10A-D. Water-level hydrographs for wells in and near the Hueco Bolson Recharge Project area, El Paso, Texas:A. Production wells located more than 1.5 miles from an injection well....................................................... 21B. Production wells located less than 0.75 mile from an injection well ........................................................ 21C. Observation wells located within 700 feet south of an injection well....................................................... 21D. Observation wells located within 700 feet north of an injection well ....................................................... 21
CONTENTS Hi

11-14. Graphs showing:
11. Difference between volumes of water injected at well 6-406 and water withdrawn from
well 6-402, and water levels in wells 5-301 and 6-405 in and near the Hueco Bolson
Recharge Project area, El Paso, Texas ....................................................................................................... 22
12. Difference between volumes of water injected at well 5-613 and water withdrawn from
well 5-601, and water levels in wells 5-301 and 5-614 in and near the Hueco Bolson
Recharge Project area, El Paso, Texas ....................................................................................................... 23
13. Volumes of water injected at well 5-620 and water levels in wells 5-607,5-621, and
5-622 in and near the Hueco Bolson Recharge Project area, El Paso, Texas ............................................ 24
14. Volumes of water injected at well 5-624 and water levels in wells 5-607, 5-625, and
5-626 in and near the Hueco Bolson Recharge Project area, El Paso, Texas ............................................ 25
TABLES
1. Geophysical logs run for selected wells near the Hueco Bolson Recharge Project area...................................... 6
2. Hydrogeologic information derived from geophysical logs ................................................................................. 7
3. Compilation of aquifer-test data from wells near the Hueco Bolson Recharge Project area ............................... 26
4. Results of borehole tracer tests in observation wells near the Hueco Bolson Recharge Project area,
August 1990 .................................................. 27
5. Characteristics of wells ........................................................................................................................................ 34
6. Analytical method, method-reporting limit, sample volume, preservation and bottle requirements,
and holding times for water samples .................................................................................................................... 37
7. Explanation of preservation and bottle-requirement codes used in table 6 .......................................................... 28
8. Quality-assurance objectives for measured data .................................................................................................. 28
9. Physical properties of water from injection, observation, and production wells, 1990 and 1991........................ 42
10. Concentrations of major ions and trace elements in water from injection, observation, and
production wells (1990 and 1991), and quality-assurance samples (1991).......................................................... 45
11. Concentrations of nutrients in water from injection, observation, and production wells (1990
and 1991), and quality-assurance samples (1991)................................................................................................ 53
12. Concentrations of selected constituents in water from injection, observation, and production
wells as determined using field colorimetric methods, 1990 and 1991................................................................ 61
13. Stable-isotopic ratios in water from injection, observation, and production wells, 1990 and 1991 .................... 67
14. Concentrations of organic carbon and methylene blue active substances in water from injection,
observation, and production wells, 1990 and 1991 .............................................................................................. 71
15. Concentrations of selected volatile organic compounds in water from injection, observation, and
production wells, and quality-assurance samples, 1990 and 1991 ....................................................................... 75
16. Bacterial populations in water from injection, observation, and production wells, and quality-
assurance sample, 1990 ........................................................................................................................................ 84
iv

CONVERSION FACTORS, VERTICAL DATUM, ABBREVIATED WATER-QUALITY UNITS, AND ABBREVIATIONS
Multiply
acre-foot (acre-ft)foot (ft)
foot per second (ft/s) foot squared per day (ft^/d)
gallon (gal)gallon per minute (gal/min)
inch (in.)mile (mi)
million gallons per day (Mgal/d)
degree Celsius (°C)
By
0.0012330.30480.3048 0.092903.7850.06308
25.41.6090.04381
Temperature°F=1.8(°C) + 32
To obtain
cubic hectometermetermeter per second meter squared per dayliterliter per secondmillimeterkilometercubic meter per second
degree Fahrenheit (°F)
Sea level: In this report, "sea level" refers to the National Geodetic Vertical Datum of 1929--a geodetic datum derived from a general adjustment of the first-order level nets of the United States and Canada, formerly called Sea Level Datum of 1929.
Per mil: A unit expressing the ratio of stable-isotopic abundances of an element in a sample to those of a standard material. Per mil units are equivalent to parts per thousand. Stable-isotopic ratios are calculated as follows:
8X = (R( sample)
R (standard)-1) x 1,000,
where X is the heavier stable isotope, andR is the ratio of the heavier, less abundant stable isotope to the lighter stable isotope in a sample or standard.
The 8 values for stable-isotopic ratios discussed in this report are referenced to the following standard materials:
Element Standard Identity and reference
oxygen
hydrogen
carbon
oxygen-l8/oxygen-16 (8 18O)
hydrogen-2/hydrogen-l or deuterium/protium (8D)
carbon-13/carbon-!2 (813C)
Vienna-Standard Mean Ocean Water (Fritz and Fontes, 1980, p. 11)
Vienna-Standard Mean Ocean Water (Fritz and Fontes, 1980, p. 13)
National Institute of Standards and Technology number 20; Solehofen limestone (Fritz and Fontes, 1980)
Abbreviated water-quality units:
u,g/L, microgram per literU.L, micro literurn, micrometeru,S/cm, microsiemens per centimeter at 25 °C
Abbreviations:
AODC, acridine orange direct counts of bacteriaDOC, dissolved organic carbonHBRP, Hueco Bolson Recharge ProjectMBAS, methylene blue active substanceMPN, most probable numberNWQL, U.S. Geological Survey, National Water Quality
Laboratory, Arvada, Colorado PVC, polyvinyl chloride QA, quality assurance
mg, milligrammg/L, milligram per litermL, millilitermm, millimeterng/L, nanogram per liter
RPD, relative percent differenceSOC, suspended organic carbonSVOC, semivolatile organic compoundTHM, trihalomethaneTOC, total organic carbonUSEPA, U.S. Environmental Protection AgencyUSGS, U.S. Geological SurveyVOC, volatile organic compound
CONTENTS

Hydrogeologic and Water-Quality Data from Wells near the Hueco Bolson Recharge Project Area, El Paso, Texas, 1990 and 1991
By Robert D. Brock, Paul M. Buszka, and Edward M. Godsy
Abstract
Tertiary-treated wastewater currently (1991) is being injected into the Hueco bolson aquifer at a site in northeastern El Paso, Texas, to supplement the quantity of available freshwater. Hydrologic data were compiled and water-quality and bacterial data were collected from existing wells near the Hueco Bolson Recharge Project (HBRP) in August and September 1990 and 1991.
Borehole tracer tests indicated upward ground-water flow in nearly all tested intervals of several observation wells. The cumulative volume of injected water was less than the volume pro duced from wells adjacent to the HBRP area. Water levels in three production wells, located more than 1.5 miles from the injection wells, declined at rates comparable to those observed before injection operations. Water levels in wells located within 0.75 mile of the injection-well pipe line declined at a slower rate after HBRP injection operations had begun. Between 1985 and 1991, water levels in observation wells located within 700 feet of an injection well either did not appre ciably decline, or declined at smaller rates than water levels in more distant production wells.
Trihalomethane compounds were detected in water from 8 of the 16 observation and produc tion wells sampled in 1990 and in 10 of the 17 wells sampled in 1991. Concentrations of trihalo- methane compounds in these samples ranged from 0.05 to 1.9 |lg/L (micrograms per liter) in 1990 and from 0.05 to 1.4 |ig/L in 1991. Concentrations of trihalomethane compounds in samples of injected
water from two wells were 27.8 and 34.6 |J,g/L respectively, in 1991. Dibromomethane and dichloromethane were detected in water from injection wells and from observation wells within about 700 feet of the injection wells.
Aerobic bacteria were determined to be the only bacteria type present in ground water except for samples from two wells, which also contained denitrifying bacteria. The populations of aerobic bacteria determined in ground water ranged from 80 to more than 160,000 most probable number of organisms per milliliter of sample.
INTRODUCTION
El Paso is dependent on ground water pumped from the Hueco bolson aquifer for 65 percent of its water supply (Knorr and Cliett, 1985, p. 428). The amount of freshwater stored in this aquifer is projected to decrease, from an estimated 10 million acre-ft in 1980 to approximately 3 million acre-ft by 2030, because of estimated increases in population and indus trial demand (White, 1983, p. 69). To supplement avail able supplies of freshwater, tertiary-treated wastewater currently (1991) is being injected into the Hueco bol son aquifer at a tertiary treatment plant that is part of the HBRP in northeastern El Paso. The injection of the tertiary-treated wastewater is being conducted by the El Paso Water Utilities-Public Service Board.
Before injection, municipal wastewater from northeast El Paso is treated to meet or exceed U.S. Environmental Protection Agency (USEPA) primary drinking water standards by a combination of the fol lowing techniques: (1) primary clarification; (2) bio logical treatment with granular activated carbon under aerobic and anaerobic conditions; (3) lime treatment;
INTRODUCTION
(4) ozone disinfection; (5) pH-adjusted filtration through granular activated carbon; and (6) chlorina- tion. The treated wastewater typically contains 0.78 to 0.92 mg/L of DOC (White and Sladek, 1990, p. 35). Chlorination of waters containing DOC can produce appreciable concentrations of a group of carcinogenic compounds known as trihalomethanes or THM's (Thunnan, 1985, p. 227-228).
Between 1987 and 1989, the sum of THM com pounds (dichlorobromomethane, bromoform, chloro form, and dibromochloromethane) in the treated municipal wastewater ranged from 10 to 26 |ig/L (Roger Sperka, El Paso Water Utilities-Public Service Board, written commun., 1990). The USEPA standard stating that the sum of THM compounds not exceed 100 |ig/L in public drinking water supplies is scheduled for review and is subject to revision by 1993 (Mark McCasland, U.S. Environmental Protection Agency, Dallas, Texas, written commun., 1992).
The U.S. Geological Survey (USGS), in cooper ation with the El Paso Water Utilities-Public Service Board, Texas Water Development Board, and U.S. Department of the Interior, U.S. Bureau of Reclama tion, compiled hydrogeologic data and collected water samples from existing injection, observation, and pro duction wells to describe: (1) the hydrogeologic frame work of the Hueco bolson aquifer near the HBRP; (2) the presence and distribution of injected wastewater and its associated constituents; (3) the water-quality effects of wastewater injection; and (4) the redox envi ronment of the aquifer near the HBRP.
Purpose and Scope
This report presents hydrogeologic and water- quality data collected from existing HBRP injection, observation, and production wells in August and Sep tember 1990 and 1991. Information concerning the study area, data collection and analysis methods, and description of the wells sampled also are included in the report.
Description of the Study Area
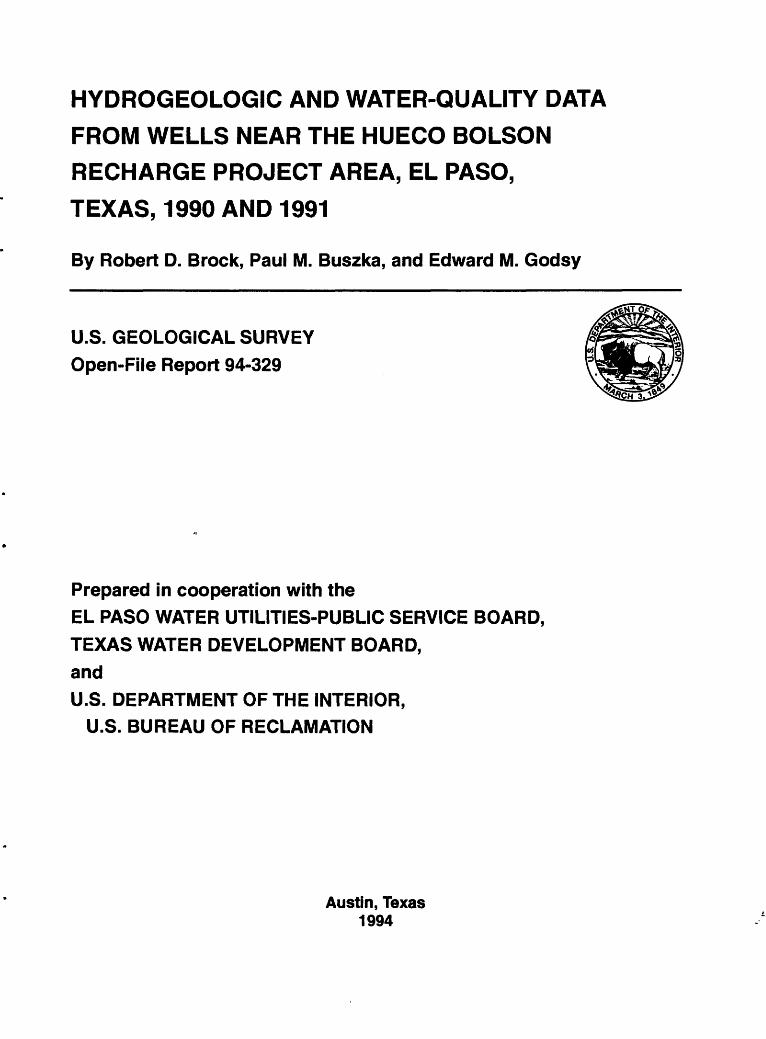
The study area is located in northeast El Paso (fig. 1). El Paso is located in westernmost Texas, along the international border with Mexico, which is formed by the Rio Grande. El Paso is dominated by three types
of geographic features: valleys, bolsons, and moun tains. A bolson is "an extensive, flat alluvium-floored basin into which drainage flows centripetally with gen tle gradients toward a playa or central depression" (Bates and Jackson, 1987, p. 79). El Paso has a sunny dry climate with hot summers and mild winters. The annual average temperature is 63 °F, and annual precip itation averages 7.8 in.
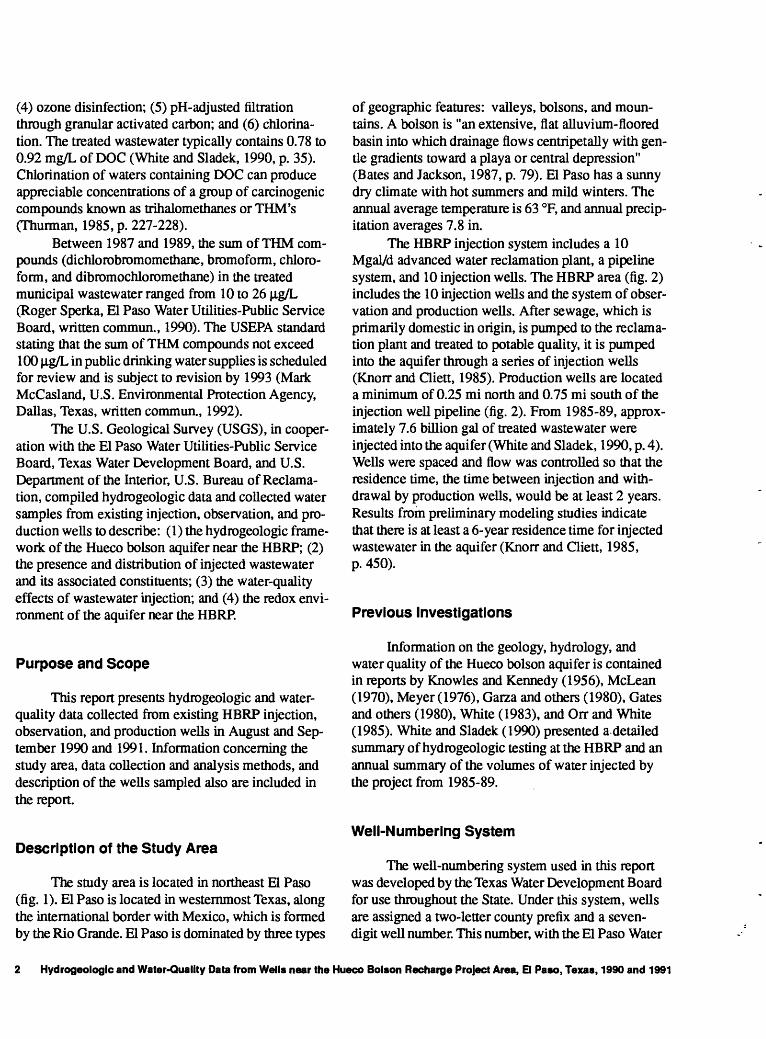
The HBRP injection system includes a 10 Mgal/d advanced water reclamation plant, a pipeline system, and 10 injection wells. The HBRP area (fig. 2) includes the 10 injection wells and the system of obser vation and production wells. After sewage, which is primarily domestic in origin, is pumped to the reclama tion plant and treated to potable quality, it is pumped into the aquifer through a series of injection wells (Knorr and Cliett, 1985). Production wells are located a minimum of 0.25 mi north and 0.75 mi south of the injection well pipeline (fig. 2). From 1985-89, approx imately 7.6 billion gal of treated wastewater were injected into the aquifer (White and Sladek, 1990, p. 4). Wells were spaced and flow was controlled so that the residence time, the time between injection and with drawal by production wells, would be at least 2 years. Results from preliminary modeling studies indicate that there is at least a 6-year residence time for injected wastewater in the aquifer (Knorr and Cliett, 1985, p. 450).
Previous Investigations
Information on the geology, hydrology, and water quality of the Hueco bolson aquifer is contained in reports by Knowles and Kennedy (1956), McLean (1970), Meyer (1976), Garza and others (1980), Gates and others (1980), White (1983), and Orr and White (1985). White and Sladek (1990) presented a detailed summary of hydrogeologic testing at the HBRP and an annual summary of the volumes of water injected by the project from 1985-89.
Well-Numbering System
The well-numbering system used in this report was developed by the Texas Water Development Board for use throughout the State. Under this system, wells are assigned a two-letter county prefix and a seven- digit well number. This number, with the El Paso Water
2 Hydrogeologic and Water-Quality Data from Wells near the Hueco Bolson Recharge Project Area, El Paso, Texas, 1990 and 1991
106° 30' 106°00'
32° 00'
31°30'
30
LOCATION MAP
Figure 1. Location of the study area.
INTRODUCTION 3
106° 25' 106°22'30" 106° 20'
31°57'30"-
31° 55'-
tt El Paso Natural
Gas Plant - - -Q T5-303 Vs-304
Hervey Water / Reclamation Plant
2 MILES I
EXPLANATION
12 KILOMETERS
HUECO BOLSON RECHARGE PROJECT AREA
5-509 n INJECTION WELL AND NUMBER
5-613 SAMPLED INJECTION WELL AND NUMBER
5-614 A OBSERVATION WELL AND NUMBER
e^os A SAMPLED OBSERVATION WELL AND NUMBER
5-901 Q PRODUCTION WELL AND NUMBER
5-204 SAMPLED PRODUCTION WELL AND NUMBER
Note: Well number consists of last four digits of the Texas well-numbering system
Figure 2. Location of wells in northeast El Paso in and near the Hueco Bolson Recharge Project area.
4 Hydrogeologic and Water-Quality Data from Wells near the Hueco Bolson Recharge Project Area, El Paso, Texas, 1990 and 1991
Utilities-Public Service Board well identification number in parentheses, is shown in the tables. Because this project covers a small area, all of the wells men tioned in this report have identical county prefixes (JL), 1-degree quadrangle numbers (49), and the first digit of the 7.5 minute quadrangle number (0). Therefore, the wells discussed in the figures and text were identified only by the last four digits of the State well number.
HYDROGEOLOGIC DATA
Available hydrogeologic data for the area near the HBRP include: (1) borehole geophysical data from this and previous investigations; (2) determinations of aquifer parameters from aquifer tests in selected wells and previous aquifer simulations; (3) results of bore hole tracer tests for selected observation wells; and (4) records of ground-water production, treated-water injection, and water-level measurements from January 1985 to March 1991. These hydrogeologic data provide information needed to define the hydrogeologic frame work of the Hueco bolson aquifer near the HBRP.
Data-Collection Methods
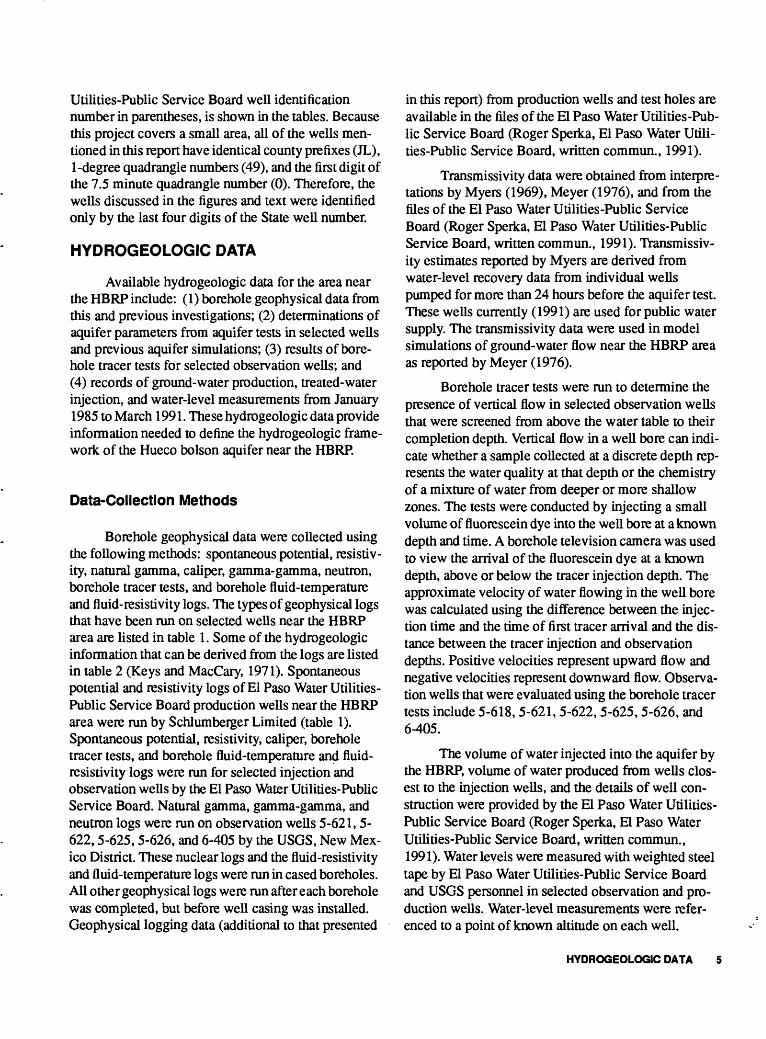
Borehole geophysical data were collected using the following methods: spontaneous potential, resistiv ity, natural gamma, caliper, gamma-gamma, neutron, borehole tracer tests, and borehole fluid-temperature and fluid-resistivity logs. The types of geophysical logs that have been run on selected wells near the HBRP area are listed in table 1. Some of the hydrogeologic information that can be derived from the logs are listed in table 2 (Keys and MacCary, 1971). Spontaneous potential and resistivity logs of El Paso Water Utilities- Public Service Board production wells near the HBRP area were run by Schlumberger Limited (table 1). Spontaneous potential, resistivity, caliper, borehole tracer tests, and borehole fluid-temperature and fluid- resistivity logs were run for selected injection and observation wells by the El Paso Water Utilities-Public Service Board. Natural gamma, gamma-gamma, and neutron logs were run on observation wells 5-621,5- 622,5-625,5-626, and 6-405 by the USGS, New Mex ico District. These nuclear logs and the fluid-resistivity and fluid-temperature logs were run in cased boreholes. All other geophysical logs were run after each borehole was completed, but before well casing was installed. Geophysical logging data (additional to that presented
in this report) from production wells and test holes are available in the files of the El Paso Water Utilities-Pub lic Service Board (Roger Sperka, El Paso Water Utili ties-Public Service Board, written commun., 1991).
Transmissivity data were obtained from interpre tations by Myers (1969), Meyer (1976), and from the files of the El Paso Water Utilities-Public Service Board (Roger Sperka, El Paso Water Utilities-Public Service Board, written commun., 1991). Transmissiv ity estimates reported by Myers are derived from water-level recovery data from individual wells pumped for more than 24 hours before the aquifer test. These wells currently (1991) are used for public water supply. The transmissivity data were used in model simulations of ground-water flow near the HBRP area as reported by Meyer (1976).
Borehole tracer tests were run to determine the presence of vertical flow in selected observation wells that were screened from above the water table to their completion depth. Vertical flow in a well bore can indi cate whether a sample collected at a discrete depth rep resents the water quality at that depth or the chemistry of a mixture of water from deeper or more shallow zones. The tests were conducted by injecting a small volume of fluorescein dye into the well bore at a known depth and time. A borehole television camera was used to view the arrival of the fluorescein dye at a known depth, above or below the tracer injection depth. The approximate velocity of water flowing in the well bore was calculated using the difference between the injec tion time and the time of first tracer arrival and the dis tance between the tracer injection and observation depths. Positive velocities represent upward flow and negative velocities represent downward flow. Observa tion wells that were evaluated using the borehole tracer tests include 5-618, 5-621,5-622, 5-625, 5-626, and 6-405.
The volume of water injected into the aquifer by the HBRP, volume of water produced from wells clos est to the injection wells, and the details of well con struction were provided by the El Paso Water Utilities- Public Service Board (Roger Sperka, El Paso Water Utilities-Public Service Board, written commun., 1991). Water levels were measured with weighted steel tape by El Paso Water Utilities-Public Service Board and USGS personnel in selected observation and pro duction wells. Water-level measurements were refer enced to a point of known altitude on each well.
HYDROGEOLOGIC DATA

Table 1 . Geophysical logs run for selected wells near the Hueco Bolson Recharge Project area
Well number type of geophysical log Well number type of geophysical log
Injection wells2
JL-49-05-509 (RW-10) Spontaneous potential,resistivity
JL^9-05-613 (RW-8) Spontaneous potential, resistivity, caliper
JL-49-05-616 (RW-2) Spontaneous potential, resistivity, caliper
JL-49-05-617 (RW-3) Spontaneous potential, resistivity
JL-49-05-619 (RW-5) Spontaneous potential, resistivity
JL-49-05-620 (RW-4) Spontaneous potential, resistivity, caliper
JL-49-05-623 (RW-6) Spontaneous potential, resistivity
JL-49-05-624 (RW-7) Spontaneous potential,resistivity
JL-49-05-627 (RW-9) Spontaneous potential, resistivity
JL-49-06-406 (RW-1) Spontaneous potential, resistivity, caliper
Observation wells3
JL^9-05-614 (OB-8)
JL-49-05-618 (OB-5)
Spontaneous potential, resistivity
Spontaneous potential, resistivity, borehole tracer tests, borehole fluid temperature and fluid resistivity
JL-49-05-621 (OB-4A) Spontaneous potential,resistivity, natural gamma, caliper, gamma-gamma, neutron, borehole tracer tests, borehole fluid temperature and fluid resistivity
JL-49-05-625 (OB-7A)
Observation wells3 Continued
JL-49-05-622 (OB-4B) Spontaneous potential,resistivity, natural gamma, gamma-gamma, neutron, borehole tracer tests, borehole fluid temperature and fluid resistivity
Spontaneous potential, resistivity, natural gamma, gamma-gamma, neutron, borehole tracer tests, borehole fluid temperature and fluid resistivity
Spontaneous potential, resistivity, natural gamma, gamma-gamma, neutron, borehole tracer tests, borehole fluid temperature and fluid resistivity
JL-49-06-405 (OB-1) Spontaneous potential,resistivity, natural gamma, gamma-gamma, neutron, borehole tracer tests, borehole fluid temperature and fluid resistivity
Production wells4
JL-49-05-626 (OB-7B)
JL^9-05-603 (32)
JL-49-05-604 (34)
Spontaneous potential, resistivity
Spontaneous potential, resistivity
1 El Paso Water Utilities-Public Service Board well numbers are in parentheses.2 Logs were run by the El Paso Water Utilities-Public Service Board.3 Spontaneous potential, caliper, borehole fluid-temperature and fluid-resistivity logs were run by the El Paso Water Utilities-Public Service Board; all
other logs were run by the U.S. Geological Survey, New Mexico District.4 Logs were run by Schlumberger Limited.
6 Hydrogeologic and Water-Quality Data from Wells near the Hueco Bolson Recharge Protect Area, El Paso, Texas, 1990 and 1991

Table 2. Hydrogeologic information derived from geophysical logs
[Modified from Keys and MacCary, 1971]
Type of geophysical log Application or information derived
Spontaneous potential, resistivity Natural gamma CaliperGamma-gamma, neutron Borehole tracer tests
Borehole fluid temperature
Borehole fluid resistivity
Stratigraphic correlation, lithology, porosityStratigraphic correlation of clay/argillaceous unitsBorehole diameterStratigraphic correlation, porosity, lithology-mineralogy (indirectly)Determine vertical movement of water within borehole; determine yields of
major water-producing zonesDetermine temperature of formation fluid; temperature gradients; locate
water-producing zonesDetermine resistivity of formation fluid
Results
Data from selected geophysical logs of observa tion wells, located south of the line of injection wells, are presented in figures 3 through 6.
Aquifer-test data for wells near the HBRP are summarized in table 3. All transmissivity tests were interpreted using the Theis recovery method (Myers, 1969; Roger Sperka, El Paso Water Utilities-Public Service Board, written commun., 1991). When the pre test water level was within or lower than the first screened interval, that water level was used to compute the length of the tested interval for transmissivity deter minations. Transmissivity values determined from these tests ranged from 4,220 to 32,100 ft2^. Transmis sivity estimates from ground-water modeling of the Hueco bolson aquifer in the HBRP area ranged from less than 6,680 ft2/d, in the part of the aquifer between the Franklin Mountains and McCombs Road, to more than 20,000 tf/d in an area near wells 5-602, 5-603, and 5-604 (Meyer, 1976, fig. 1, fig. 8, p. 16). The spe cific yield of the aquifer in the HBRP area has been estimated to range from 0.15 to 0.22, based on model simulations by Garza and others (1980, p. 10). The storage coefficient of the aquifer in the HBRP area has been estimated to range between 0.0001 to 0.0004 (Meyer, 1976, p. 15).
The results of the borehole tracer tests indicated the prevalence of substantial upward-directed flow in nearly all tested intervals of observation wells 5-618, 5-621,5-622,5-625,5-626, and 6-405 (table 4). Verti cal flow rates were smallest typically at, or near, the bottom of the screened interval, and near the uppermost
tested interval. Vertical flow was not observed in well 5-626 between 380 and 400 ft below land surface, and in well 6-405 at 614 ft below land surface. The largest vertical flow observed, 1.1 ft/s, was in well 5-626 between 652 and 663 ft below land surface.
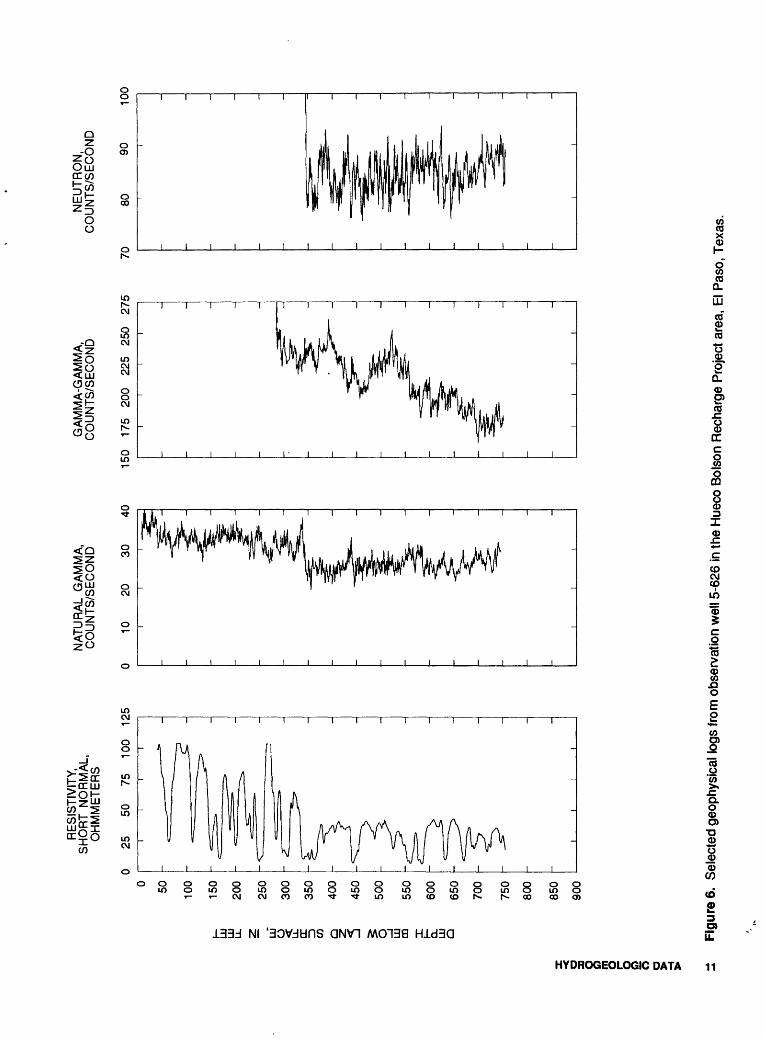
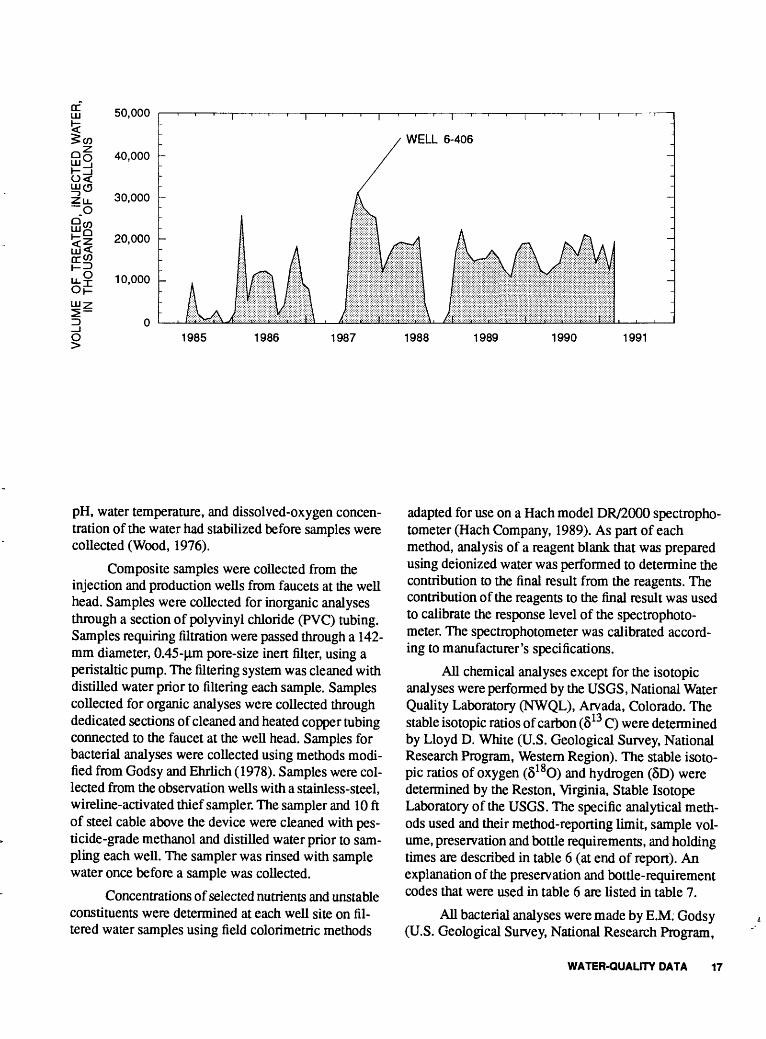
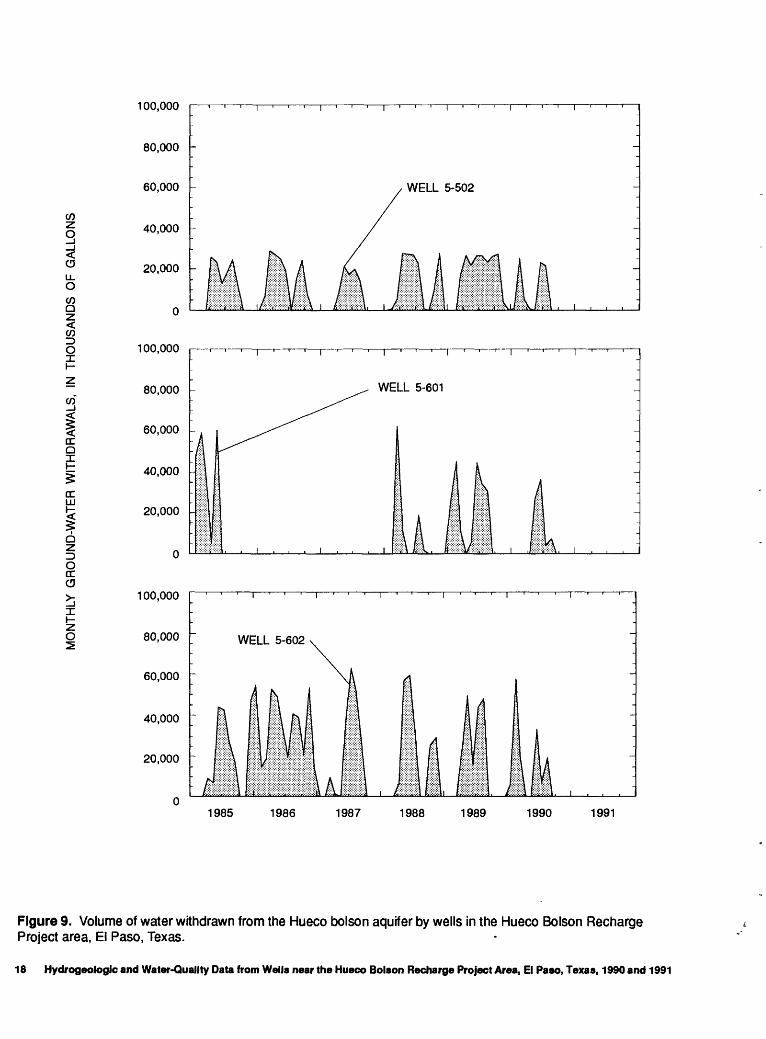
Tertiary-treated wastewater from the Fred Hervey Water Reclamation Plant (fig. 2) has been injected into the Hueco bolson aquifer since May 1985. The cumulative volume of treated water injected into the aquifer always has been less than the cumulative volume withdrawn from wells adjacent to the HBRP area (fig. 7). The differences between volumes of water injected and withdrawn typically are less during the spring and summer than during the fall and winter. Vol ume of treated water injected into the aquifer by indi vidual HBRP wells is shown in figure 8. White and Sladek (1990) summarized data for the total volume of water treated at the plant and injected into the aquifer between 1985-89. The volume of ground water with drawn from wells in the HBRP area is shown in figure 9. Data on volumes of treated water injected into the aquifer, ground-water production, and water levels measured at selected wells are available from the files of the El Paso Water Utilities-Public Service Board (Roger Sperka, El Paso Water Utilities-Public Service Board, written commun., 1991).
Water levels measured in production and obser vation wells in northeastern El Paso are plotted against time in figure 10. Water levels in three production wells, located more than 1.5 mi north (5-204 and 5-301) and south (5-607) of the injection wells, declined at rates comparable to those observed before HBRP injection operations began (fig. 10A). Water
HYDROGEOLOGIC DATA

i £ 8 & 6" B> M I B> <2 m
tn LU LU
O if
DC CO
Q 1 LU
CD Q_
LU
Q
0 50 100
150
200
25
0
30
0
350
400
45
0
500
550
600
65
0
700
750
800
850
900
RE
SIS
TIV
ITY
,S
HO
RT
N
OR
MA
L,O
HM
ME
TE
RS
25
50
75
100
125
NA
TUR
AL
GA
MM
A,
CO
UN
TS
/SE
CO
ND
10
2030
40
GA
MM
A-G
AM
MA
, C
OU
NT
S/S
EC
ON
D
150
175
200
225
250
275
J_
__
_I_
__
_I_
__
_I
NE
UT
RO
N,
CO
UN
TS
/SE
CO
ND
7080
9010
0
Figu
re 3
. Se
lect
ed g
eoph
ysic
al lo
gs fr
om o
bser
vatio
n w
ell 5
-621
in th
e H
ueco
Bol
son
Rec
harg
e Pr
ojec
t are
a, E
l Pas
o, T
exas
.

LLJ
LU LLJ § DC ID O
< LLJ
CO Q.
LLJ
O
X
O
0 50 100
150
200
250
300
350
400
450
500
550
600
650
700
750
800
850
900
RE
SIS
TIV
ITY
,S
HO
RT
NO
RM
AL,
OH
MM
ET
ER
S
25
50
75
100
125
NA
TU
RA
L G
AM
MA
, C
OU
NT
S/S
EC
ON
D
10
2030
40
GA
MM
A-G
AM
MA
, C
OU
NT
S/S
EC
ON
D
150
175
200
225
250
275
NE
UT
RO
N,
CO
UN
TS
/SE
CO
ND
7080
9010
01
I I
5 O Sj <o Fi
gure
4.
Sel
ecte
d ge
ophy
sica
l tog
s fro
m o
bser
vatio
n w
ell 5
-622
in th
e H
ueco
Bol
son
Rec
harg
e Pr
ojec
t are
a, E
l Pas
o, T
exas
.

Oiu
O O
oo
"i r
i i i i i i i i i i i i i i i i i
CO (0 X
.-Q S
8
1 I I I I 1 I I I I I 1 I I 1 I 1
I I I I I I I I I I I I I I I I I
Q.
UJ
CO£CO
l*Q. <DE»(0
8DC
1
20
8O
I
in CMcpin
1o73
oCO
*
o_r o
C/3 UO w CM
i i i i i i i i i T T i i i i i r
o oooooooo OQQQOOQOOCO O)
o00
133d Nl '30VddnS QNV1 MO138 Hid3Q
2CO
S(0
Q.
8O)
T3 O
1O
CO
IO)
10 Hydrogeologic and Water-Quality Data from Wells near the Hueco Bolson Recharge Project Area, & Paso, Texas, 1990 and 1991
3(Q
i P>CO2. CD
a(O CDo o
CO
sCO
o3o or c/>CD
0)
O3
CD_
01 O)roO)5'
CDI C CD
S
CD CD CD -j -j o> o> w ai^.^.cocoroK)-^-'S
en ocn ocnocn ocnocnotnocnocno oo oooo ooooooooooo
o o
Ul
! I I I I I I III I I I I I
o
N> O
00 O
.&. O
81z5
&%$> o>ilo>
IDO CD O
0)
CD u
Ia0)cB0)
i i i i i i i i i i i n i i i i
i i i i i i i i i i i i i i i i i
0
If(/)>C/5CD m> OSo|§->
0) COpCD X 0) COo
O
-CD0 Z
O
o o
coz o<CD
CO Q
coID O
IE LU
ILJ_ O
LU2ID
i
10,000,000
8,000,000 -
6,000,000 -
4,000,000 -
2,000,000 -
CUMULATIVE INJECTED WATER CUMULATIVE WITHDRAWN WATER
coz O
LULL
QZ <
2,000,000
1 ,500,000
1,000,000
500,000
-500,000
-1,000,000
-1,500,000
-2,000,000 I
1985 1986 1987 1988 1989 1990 1991
Figure 7. Cumulative volumes of injected water from the Hueco Bolson Recharge Project area, El Paso, Texas, water withdrawn from adjacent wells, and the cumulative difference between injected and withdrawn water volumes.
12 Hydrogeologic and Water-Quality Data from Wells near the Hueco Bolson Recharge Project Area, El Paso, Texas, 1990 and 1991
levels in wells 5-601,5-605, and 6-402, which are located within 0.75 mi of the injection-well pipeline, declined at a slower rate after HBRP injection opera tions began (fig. 10B). Water levels in observation wells located within about 700 ft of an injection well (figs. 10C, and 10D), either did not appreciably decline, or declined at smaller rates between 1985 and 1991, than did water levels in more distant production wells.
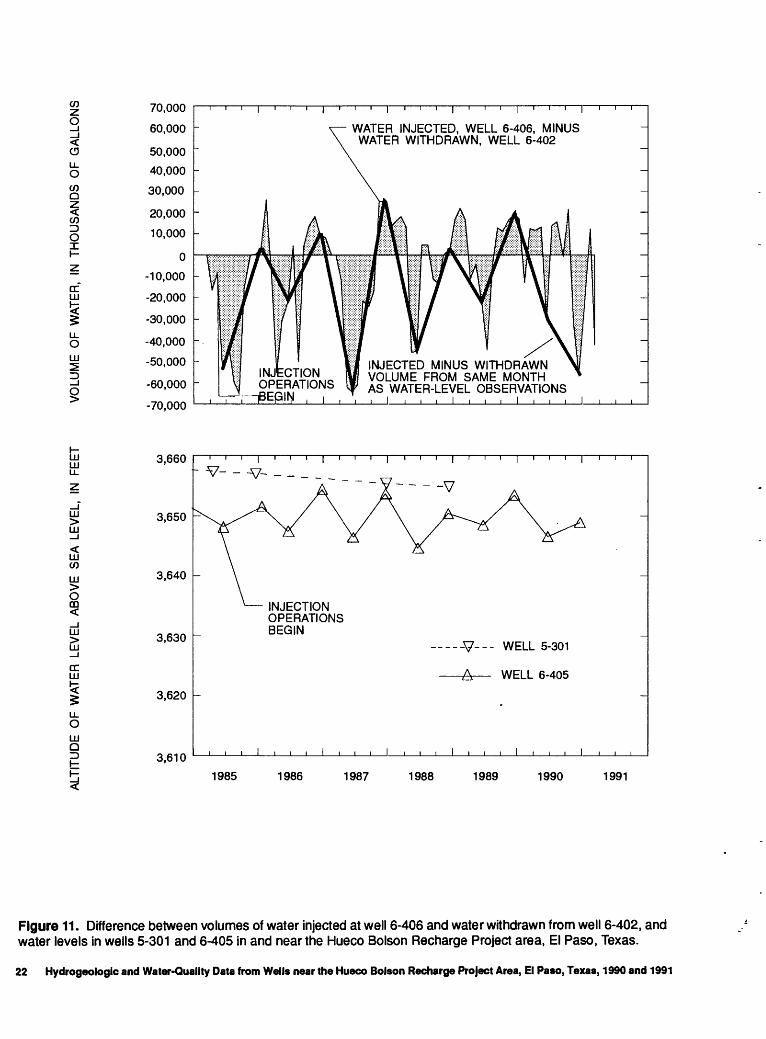
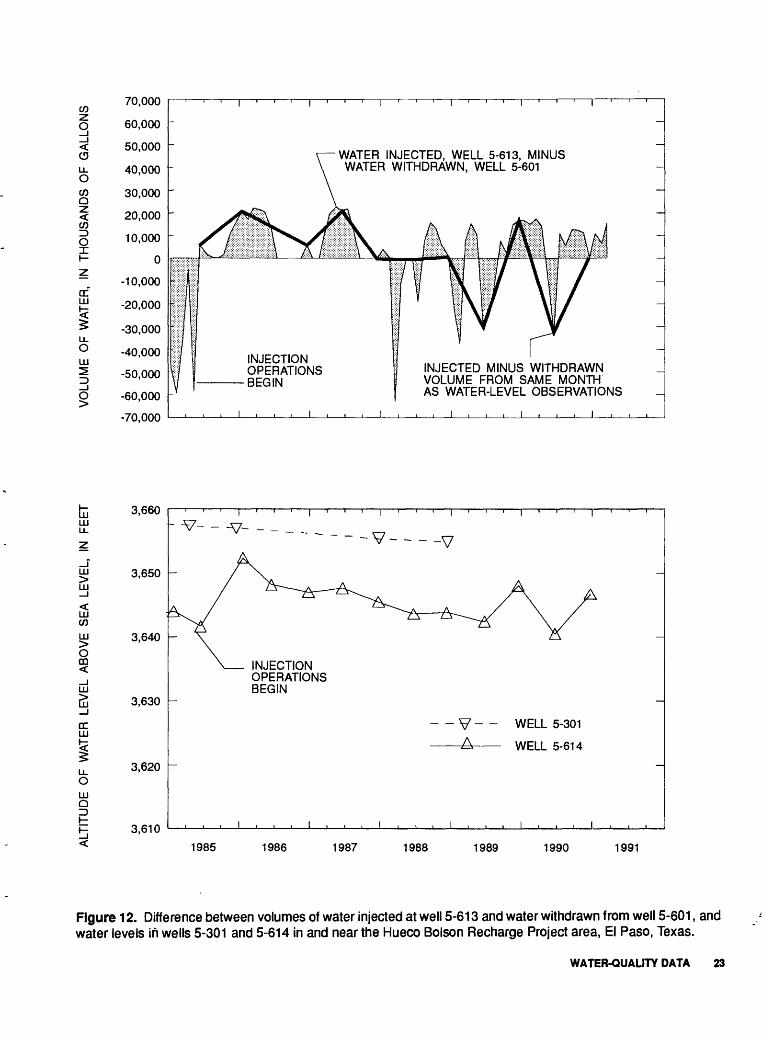
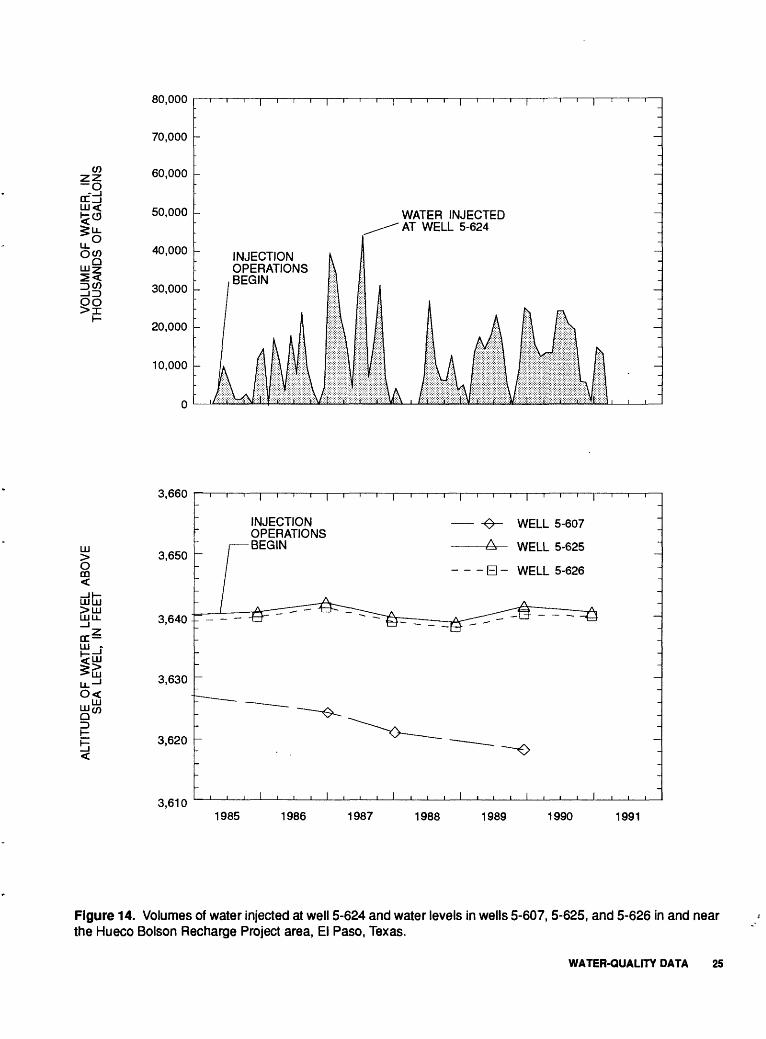
The trend in the altitude of water levels in obser vation well 6-405 was similar to the trend in the volume of water injected at well 6-406 minus the volume of water withdrawn from production well 6-402 (fig. 11). The trend in the altitude of water levels in observation well 5-614 was similar to the trend in the volume of water injected at well 5-613 minus the volume of water withdrawn from production well 5-601 (fig. 12). Water levels in observation wells 5-621 and 5-622 increased during periods when more water was injected and decreased during periods when less water was injected at well 5-620 (fig. 13). Water levels in observation wells 5-625 and 5-626 increased during periods when more water was injected and decreased during periods when less water was injected at well 5-624 (fig. 14). Water levels in a well outside the HBRP, observation well 5-607, also are shown on figures 13 and 14.
WATER-QUALITY DATA
Description of Wells Sampled
The location of wells sampled is shown in figure 2. Characteristics of wells are given in table 5 (at end of report). Samples were collected in August and Septem ber 1990 by USGS personnel at 1 injection well, 6 observation wells, and 11 production wells. Samples were collected in August and September 1991 by USGS personnel at 2 injection wells, 6 observation wells, and 11 production wells. The wells sampled were selected to characterize the chemistry and micro biology of injected water and ground water in and near the HBRP area.
Well 5-613 was the only injection well sampled in 1990. The well was sampled on three occasions dur ing 1 week to define changes in the chemistry of the injected water. Injection wells 5-613 and 5-624 were sampled in 1991. Well 5-624 was sampled on two occa sions. On August 27,1991, the well was sampled dur ing normal injection operations. On September 8,1991, 2 days after injection stopped, an existing turbine pump in the injection well was turned on, and the well was
sampled three times in 6 hours while pumping water from the aquifer. The samples were collected after 24,000, 182,000, and 336,000 gal of water had been pumped from the aquifer.
The observation wells that were sampled in 1990 and 1991 were 5-618,5-621,5-622,5-625,5-626, and 6-405. Wells 5-621,5-622,5-625, and 5-626 were sam pled at two depths along their screened interval to define depth-related differences in water chemistry. These sampled depths were selected based on data obtained from spontaneous potential and resistivity logs of the wells.
Production wells 5-204, 5-301, 5-601,5-602, and 6-402, located north of the injection well pipeline, were sampled in 1990 (fig. 2). Production wells 5-204, 5-303, 5-601,5-602, 6-401, 6-402, and 6-404, located north of the injection well pipeline, were sampled in 1991.
Production wells, 5-603,5-604,5-605,5-501, 5-607, and 5-615, located south of the injection well pipeline, were sampled in 1990. Production wells 5-603,5-605, 5-607, and 5-615 were sampled in 1991.
Data Collection and Analysis Methods
Water samples were collected in 1990 for inor ganic analyses, which included major ions, trace ele ments, nutrients, and the stable-isotopic ratios of oxygen, hydrogen, and carbon; for organic analyses, which included dissolved organic carbon (DOC), sus pended organic carbon (SOC), methylene blue active substances (MBAS), volatile organic compounds (VOC), and semivolatile organic compounds (SVOC); and for bacterial analyses, which included acridine orange direct counts of bacteria (AODC), aerobic bac teria, denitrifying bacteria, anaerobic bacteria, sulfate- reducing bacteria, and methanogenic bacteria. Water samples also were collected in 1991 for inorganic anal yses, which included major ions, trace elements, nutri ents, and the stable-isotopic ratios of oxygen and hydrogen; and for organic analyses, which included total organic carbon (TOC), DOC, and VOC.
Prior to sample collection, at least three bore vol umes of water were pumped from a sampled well using a submersible pump. The existing in-well pump was used for purging the production wells. For observation wells, a submersible pump was lowered into the well approximately 50 ft below the water surface. After the three bore volumes of water were removed, pumping continued until measurements of specific conductance,
WATER-QUALITY DATA 13

CO
I<CD
CO Q
COz> oIE
tr LU
IQ LU
O LU
Q LU
LUtr
oLU
50,000
40,000
30,000
20,000
10,000
WELL 5-509
50,000
40,000
30,000
20,000
10,000
50,000
40,000
30,000
20,000
10,000
WELL 5-613
WELL 5-616
1985 1986 1987 1988 1989 1990 1991
Figure 8. Volume of treated water injected into the Hueco bolson aquifer by wells in the Hueco Bolson Recharge Project area, El Paso, Texas.
14 Hydrogeologic and Water-Quality Data from Wells near the Hueco Bolson Recharge Project Area, El Paso, Texas, 1990 and 1991

VO
LUM
E
OF
TR
EA
TE
D,
INJE
CTE
D
WA
TER
, IN
T
HO
US
AN
DS
O
F G
ALL
ON
S
m
a D o

COz g
CD
CO Q
CO
oI
ocLUIQ UJ
O UJ-3
Q UJ
O UJ
_ O
50,000
40,000
30,000
20,000
10,000
50,000
40,000
30,000
20,000
10,000
50,000
40,000
30,000
20,000
10,000
WELL 5-623
i ' i
WELL 5-624
WELL 5-627
1985 1986 1987 1988 1989 1990 1991
Figure 8.~Continued.
16 Hydrogeologic and Water-Quality Data from Wells near the Hueco Bolson Recharge Project Area, El Paso, Texas, 1990 and 1991
gj 50,000
QQ 40,000LU_j
o<
Zu. 30,000 ~O
~ 20,000
10,000OH jjjZ
§
WELL 6-406
1985 1986 1987 1988 1989 1990 1991
pH, water temperature, and dissolved-oxygen concen tration of the water had stabilized before samples were collected (Wood, 1976).
Composite samples were collected from the injection and production wells from faucets at the well head. Samples were collected for inorganic analyses through a section of polyvinyl chloride (PVC) tubing. Samples requiring filtration were passed through a 142- mm diameter, 0.45-u,m pore-size inert filter, using a peristaltic pump. The filtering system was cleaned with distilled water prior to filtering each sample. Samples collected for organic analyses were collected through dedicated sections of cleaned and heated copper tubing connected to the faucet at the well head. Samples for bacterial analyses were collected using methods modi fied from Godsy and Ehrlich (1978). Samples were col lected from the observation wells with a stainless-steel, wireline-activated thief sampler. The sampler and 10 ft of steel cable above the device were cleaned with pes ticide-grade methanol and distilled water prior to sam pling each well. The sampler was rinsed with sample water once before a sample was collected.
Concentrations of selected nutrients and unstable constituents were determined at each well site on fil tered water samples using field colorimetric methods
adapted for use on a Hach model DR/2000 spectropho- tometer (Hach Company, 1989). As part of each method, analysis of a reagent blank that was prepared using deionized water was performed to determine the contribution to the final result from the reagents. The contribution of the reagents to the final result was used to calibrate the response level of the spectrophoto- meter. The spectrophotometer was calibrated accord ing to manufacturer's specifications.
All chemical analyses except for the isotopic analyses were performed by the USGS, National Water Quality Laboratory (NWQL), Arvada, Colorado. The stable isotopic ratios of carbon (813 C) were determined by Lloyd D. White (U.S. Geological Survey, National Research Program, Western Region). The stable isoto pic ratios of oxygen (518O) and hydrogen (5D) were determined by the Reston, Virginia, Stable Isotope Laboratory of the USGS. The specific analytical meth ods used and their method-reporting limit, sample vol ume, preservation and bottle requirements, and holding times are described in table 6 (at end of report). An explanation of the preservation and bottle-requirement codes that were used in table 6 are listed in table 7.
All bacterial analyses were made by E.M. Godsy (U.S. Geological Survey, National Research Program,
WATER-QUALITY DATA 17
CD u_ O
Q
Z)oX
ccQX
CC LLJ
IQ
O CC CD
100,000
80,000
60,000
40,000
20,000
100,000
80,000
60,000
40,000
20,000
100,000
80,000
60,000
40,000
20,000
WELL 5-602
WELL 5-502
WELL 5-601
1985 1986 1987 1988 1989 1990 1991
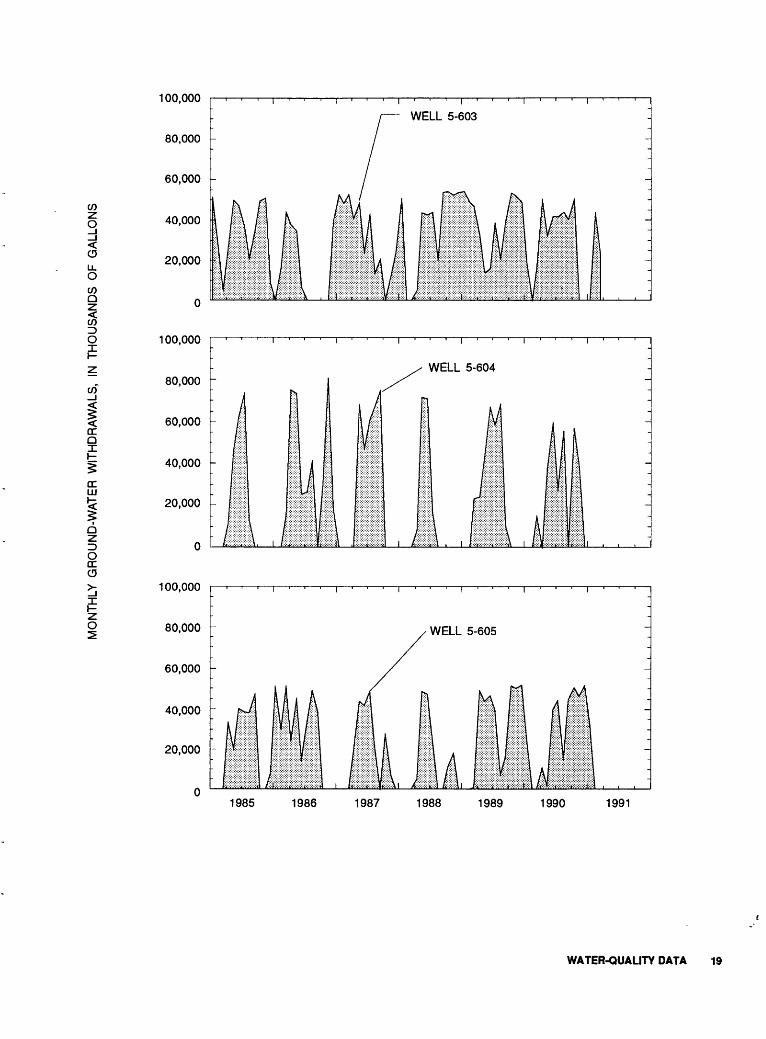
Figure 9. Volume of water withdrawn from the Hueco bolson aquifer by wells in the Hueco Bolson Recharge Project area, El Paso, Texas.
18 Hydrogeologic and Water-Quality Data from Wells near the Hueco Bolson Recharge Project Area, El Paso, Texas, 1990 and 1991
MO
NTH
LY G
RO
UN
D-W
AT
ER
W
ITH
DR
AW
ALS
, IN
T
HO
US
AN
DS
O
F G
ALL
ON
S
IV) o "o o o
O "o o o
en o "o
o o
CD o o
o
o
o o o
o o
IV) o "o o
o
o "o o
o
O) oCD o
o
o 8 o
IV) o 8 o
en o 8 o
CD
OO
O
I m 31 6 I
en CO
CD
0> CO
CD
-si
CO
CD
CD CO
CD
CO CO
CO o CO
CO

in
si*
gg
100,000
80,000
60,000
40,000
20,000
I' h- z o
WELL 6-402
1985 1986 1987 1988 1989 1990 1991
Figure 9.-Continued.
Western Region). Subsamples for six viable bacterial determinations were removed from each of the water samples within 48 hours of their arrival at the labora tory. Subsamples were removed for the direct counting of the total number of bacteria present by AODC (Wilson and others, 1983). A five-tube most probable number (MPN) series was used to determine: (1) bac teria capable of rapid heterotrophic aerobic growth in nutrient liquid media, using Standard Methods Broth (BBL Microbiology Systems, Cockeyville, Maryland);(2) denitrifying bacteria (Stanier and others, 1966);(3) bacteria capable of anaerobic fermentative growth in nutrient liquid media, using prereduced, anaerobi- cally sterilized peptone-yeast extract-glucose broth (Holdeman and Moore, 1972); (4) sulfate reducing bac teria, incubated for 6 weeks, using prereduced, anaero- bically sterilized prepared American Petroleum Institute broth (Difco Laboratories, Livonia, Michi gan); and (5) methanogenic bacteria based on the pres ence of methane in the head space above the medium after 6 weeks incubation, as determined by gas chroma- tography (Godsy, 1980).
Quality Assurance
The quality assurance (QA) objectives for accu racy, precision, completeness, and representativeness were developed prior to sample collection. The QA objectives for accuracy, precision, and completeness for field and laboratory analyses are summarized in table 8. These objectives represent the minimum acceptable standards for all field and laboratory data. Data for a particular analysis that did not meet the project QA objectives still are reported in the data tables but are so noted in the text.
The accuracy of field measurements and labora tory analytical data was evaluated by a combination of factors. The accuracy of field measurements was eval uated by the use of standard methods of analysis with the appropriate calibration standards. These methods represent currently accepted techniques of water anal ysis. The accuracy of the laboratory analytical data col lected for inorganic constituents was evaluated by the use of standard methods and blind-reference samples submitted to the NWQL by the Branch of Quality Assurance of the USGS. Blind-reference samples also
20 Hydrogeologic and Water-Quality Data from Wells near the Hueco Boison Recharge Project Area, El Paso, Texas, 1990 and 1991

m i o
LU
111
111
LU CO LU O
CD LU LLJ
_l
CE
LU I LU Q ID
3,7
20
^
3,7
00
3,6
80
3,6
60
3,6
40
3,6
20
3,6
00
INJE
CT
ION
OP
ER
AT
ION
SB
EG
IN/
WE
LL 5
-204
WE
LL 5
-301
WE
LL 5
-607
(A)
Pro
duct
ion
wel
ls l
ocat
ed
mor
e th
an
1.5
mile
s fro
m a
n in
ject
ion
wel
l.3,
720
3,70
0
3,68
0
3,66
0
3,64
0
3,62
0
3,60
0
INJE
CT
ION
OP
ER
AT
ION
SB
EG
INv
WE
LL 5
-601
WE
LL 5
-605
WE
LL 6
-402
o CO
O)
in (O
O)
o
h- O)
in
h- O)
o
oo O)
in CO o>o 8
(B)
Pro
duct
ion
wel
ls
loca
ted
less
tha
n 0.
75
mile
fro
m a
n in
ject
ion
wel
l.
3,68
0
3,66
0
3,64
0
3,62
0
3,68
0
WE
LL 5
-621
W
ELL
5-6
22
WE
LL 5
-625
W
ELL
5-6
26
INJE
CT
ION
OP
ER
AT
ION
SB
EG
IN
(C)
Obs
erva
tion
wel
ls l
ocat
ed w
ithin
70
0 fe
et s
outh
of
an
inje
ctio
n w
ell.
3,66
0
3,64
0
3,62
0
INJE
CT
ION
OP
ER
AT
ION
SB
EG
IN
WE
LL 5
-614
W
ELL
5-6
18
WE
LL 6
-405
o CO
O)
in
CO
O)
o
o>
o>
(D)
Obs
erva
tion
wel
ls
loca
ted
with
in
700
feet
no
rth o
f an
in
ject
ion
wel
l.
2 Fi
gure
10.
Wat
er-le
vel h
ydro
grap
hs fo
r wel
ls in
and
nea
r the
Hue
co B
olso
n R
echa
rge
Proj
ect a
rea,
El P
aso,
Tex
as.
O)z o
O)Q
O)D OX
ocLU
Iu_ OLU2ID
8
WATER INJECTED, WELL 6-406, MINUS WATER WITHDRAWN, WELL 6-402
INJECTION OPERATIONS
INJECTED MINUS WITHDRAWN VOLUME FROM SAME MONTH AS WATER-LEVEL OBSERVATIONS
! , ! I I I I I ! ! I . ! I I I
LU LU
LU
LU
LU O)
LU
O CD
LU
LU _J
OC LU
LU QID
3,660
3,650
3,640
3,630
3,620
3,610
INJECTIONOPERATIONSBEGIN
_-_-_V__. WELL 5-301
A WELL 6-405
1985 1986 1987 1988 1989 1990 1991
Figure 11. Difference between volumes of water injected at well 6-406 and water withdrawn from well 6-402, and water levels in wells 5-301 and 6-405 in and near the Hueco Bolson Recharge Project area, El Paso, Texas.
22 Hydrogeologic and Water-Quality Data from Wells near the Hueco Bolson Recharge Project Area, El Paso, Texas, 1990 and 1991
CD
c/)Q
C/)=> O
DC 111
O
111
O
70,000
60,000
50,000
40,000
30,000
20,000
10,000
0
-10,000
-20,000
-30,000
-40,000
-50,000
-60,000
-70,000
WATER INJECTED, WELL 5-613, MINUS WATER WITHDRAWN, WELL 5-601
INJECTIONOPERATIONSBEGIN
INJECTED MINUS WITHDRAWN VOLUME FROM SAME MONTH AS WATER-LEVEL OBSERVATIONS
fcLU
HI
111
111 0)
LLJ
OCD
Ill£CE 111
111 QID
3,660
3,650
3,640
3,630
3,620
3,610
INJECTIONOPERATIONSBEGIN
- V - - WELL 5-301A WELL 5-614
1985 1986 1987 1988 1989 1990 1991
Figure 12. Difference between volumes of water injected at well 5-613 and water withdrawn from well 5-601, and water levels in wells 5-301 and 5-614 in and near the Hueco Bolson Recharge Project area, El Paso, Texas.
WATER-QUALITY DATA 23

CC_luu<
80,000
70,000
60,000
50,000
40,000
30,000
20,000
10,000
0
1 INJECTION OPERATIONS BEGIN
WATER INJECTED AT WELL 5-620
LU>OCD
LULU >LU LULL
LU -
<UJ
o<u£QD
3,660
3,650
3,640
3,630
3,620
3,610
INJECTIONOPERATIONSBEGIN
WELL 5-607
- - - -Q - - - WELL 5-621
-0 - WELL 5-622
1985 1986 1987 1988 1989 1990 1991
Figure 13. Volumes of water injected at well 5-620 and water levels in wells 5-607, 5-621, and 5-622 in and near the Hueco Bolson Recharge Project area, El Paso, Texas.
24 Hydrogeologic and Water-Quality Data from Wells near the Hueco Bolson Recharge Prelect Area, El Paso, Texas, 1990 and 1991
LU<
Lu
80,000
70,000
60,000
50,000
40,000
30,000
20,000
10,000
0
WATER INJECTED AT WELL 5-624
INJECTIONOPERATIONSBEGIN
LU >ODO
LULU>UJ LULL
DC LU r
0<
ID
EJ
3,660
3,650
3,640:r_ - -
3,630
3,620
3,610
i | i r
INJECTIONOPERATIONSBEGIN
WELL 5-607
WELL 5-625
- - - E - WELL 5-626
1985 1986 1987 1988 1989 1990 1991
Figure 14. Volumes of water injected at well 5-624 and water levels in wells 5-607,5-625, and 5-626 in and near the Hueco Bolson Recharge Project area, El Paso, Texas.
WATER-QUALITY DATA 25
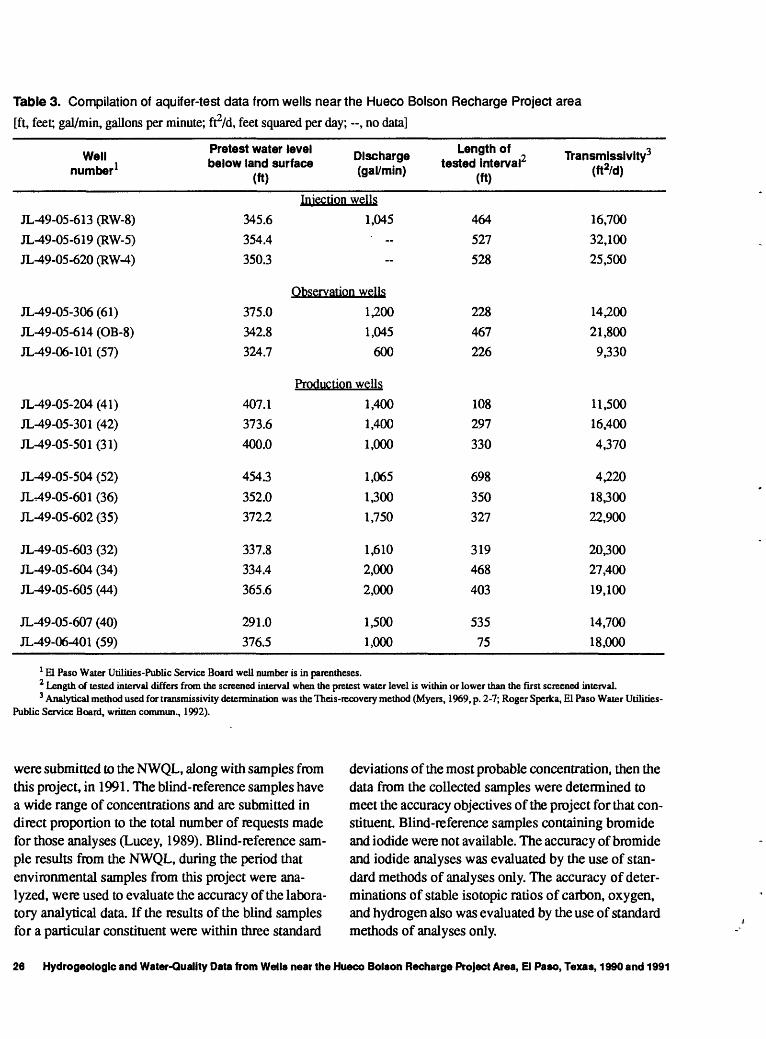
Table 3. Compilation of aquifer-test data from wells near the Hueco Bolson Recharge Project area
[ft, feet; gal/min, gallons per minute; rd, feet squared per day; --, no data]
Well number 1
JL-49-05-613 (RW-8)
JL-49-05-619 (RW-5)
jL-49-05-620(RW-4)
JL-49-05-306(61)
JL-49-05-614 (OB-8)
JL-49-06-101 (57)
JL-49-05-204 (41)
JL-49-05-301 (42)
JL-49-05-501 (31)
JL-49-05-504 (52)
JL.49-05-601 (36)
JL-49-05-602 (35)
JL-49-05-603 (32)
JL-49-05-604 (34)
JL-49-05-605 (44)
JL-49-05-607 (40)
JL-49-06-401 (59)
Pretest water
(ft)
345.6354.4350.3
375.0342.8324.7
407.1373.6400.0
454.3352.0372.2
337.8334.4365.6
291.0376.5
level
rface (gTl/min)8
Injection wells1,045
' --
Observation wellsuoo1,045
600
Production wells1,4001,4001,000
1,0651,3001,750
1,6102,0002,000
1,5001,000
Length of tested interval2
(ft)
464527528
228467226
108297330
698350327
319468403
53575
Transmissivity3 (ft2/d)
16,70032,10025,500
14,20021,800
9,330
11,50016,4004,370
4,22018,30022,900
20,30027,40019,100
14,70018,000
1 El Paso Water Utilities-Public Service Board well number is in parentheses.2 Length of tested interval differs from the screened interval when the pretest water level is within or lower than the first screened interval.3 Analytical method used for transmissivity determination was the Theis-rccovery method (Myers, 1969, p. 2-7; Roger Sperka, El Paso Water Utilities-
Public Service Board, written common., 1992).
were submitted to the NWQL, along with samples from this project, in 1991. The blind-reference samples have a wide range of concentrations and are submitted in direct proportion to the total number of requests made for those analyses (Lucey, 1989). Blind-reference sam ple results from the NWQL, during the period that environmental samples from this project were ana lyzed, were used to evaluate the accuracy of the labora tory analytical data. If the results of the blind samples for a particular constituent were within three standard
deviations of the most probable concentration, then the data from the collected samples were determined to meet the accuracy objectives of the project for that con stituent. Blind-reference samples containing bromide and iodide were not available. The accuracy of bromide and iodide analyses was evaluated by the use of stan dard methods of analyses only. The accuracy of deter minations of stable isotopic ratios of carbon, oxygen, and hydrogen also was evaluated by the use of standard methods of analyses only.
26 Hydrogeologic and Water-Quality Data from Wells near the Hueco Bolson Recharge Project Area, El Paso, Texas, 1990 and 1991

Table 4. Results of borehole tracer tests in observation wells near the Hueco Bolson Recharge Project area, August 1990
[Positive velocity represents upward flow in well bore; ft, feet; ft/s, feet per second; (c), indicates initial observation of tracer pulse from a different depth; <, less than]
Well number1
1L49-05-618 (OB-5)
11^49-05-621 (OB-4A)
JL-49-05-622 (OB-4B)
11^49-05-625 (OB-7 A)
11^49-05-626 (OB-7B)
11^49-06-405 (OB-1)
Depth of tracer injection
(ft)
547547568580
449574
451566575591
385405
665 (c)674698706
562 (c)575588 (c)603 (c)
608365387410 (c)
424450
570 (c)575663 (c)691
692485 (c)492565 (c)
575380400444 (c)
451
557614618
Depth of tracer observation
(ft)
540540561573
439564
446561570586
380400
655669693701
552570578590
603360377400
419445
545570652686
687467487535
570382395434
446
554614616
Time to tracer arrival
(seconds)
28201820
10475
22204137
6090
23152420
30153140
15452565
2425
909
1010
109812
150
1065
13530
23
457030
Vertical velocity (ft/s)
0.3.4.4.4
.1
.1
.2
.3
.1
.1
.1
.1
.4
.3
.2
.3
.3
.3
.3
.3
.3
.1
.4
.2
.2
.2
.3
.61.1
.5
.5
.2
.4
.2
.5<.l<.l
.3
.2
.1<.l
.1
1 El Paso Water Utilities-Public Service Board well number is in parentheses.
WATER-QUALITY DATA 27
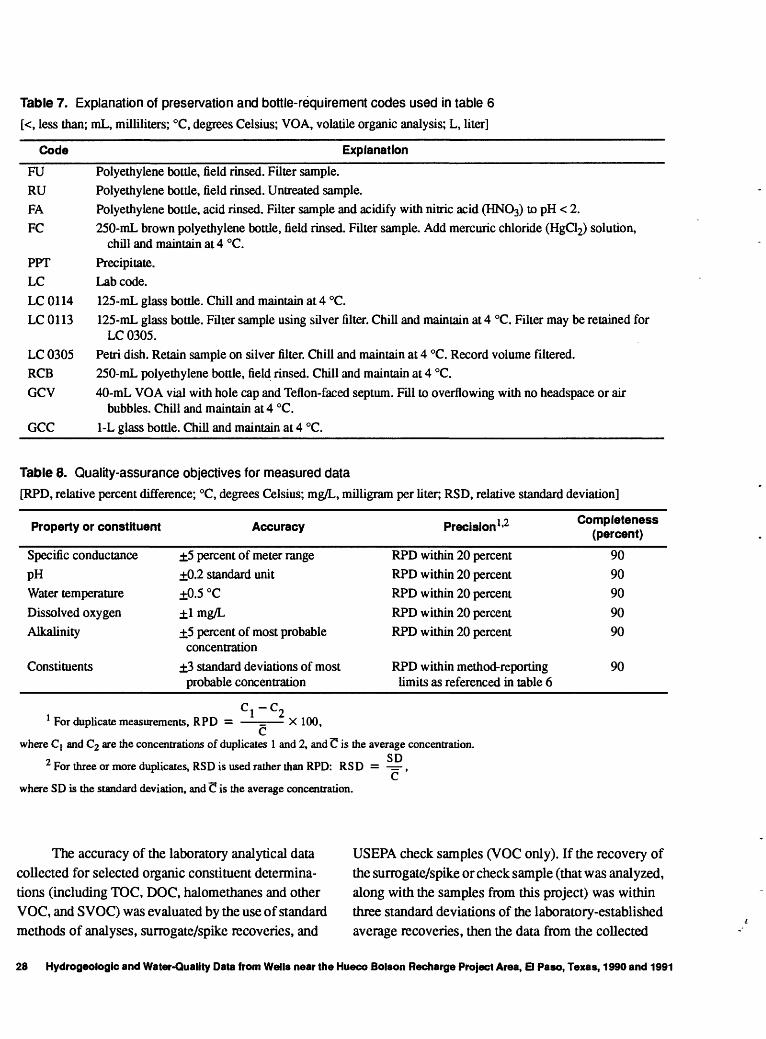
Table 7. Explanation of preservation and bottle-requirement codes used in table 6 [<, less than; mL, milliliters; °C, degrees Celsius; VGA, volatile organic analysis; L, liter]
Code Explanation
FU Polyethylene bottle, field rinsed. Filter sample.RU Polyethylene bottle, field rinsed. Untreated sample.FA Polyethylene bottle, acid rinsed. Filter sample and acidify with nitric acid (HNO3) to pH < 2.FC 250-mL brown polyethylene bottle, field rinsed. Filter sample. Add mercuric chloride (HgCl2) solution,
chill and maintain at 4 °C.PPT Precipitate.LC Lab code.LC 0114 125-mL glass bottle. Chill and maintain at 4 °C.LC 0113 125-mL glass bottle. Filter sample using silver filter. Chill and maintain at 4 °C. Filter may be retained for
LC0305.LC 0305 Petri dish. Retain sample on silver filter. Chill and maintain at 4 °C. Record volume filtered.RGB 250-mL polyethylene bottle, field rinsed. Chill and maintain at 4 °C.GCV 40-mL VOA vial with hole cap and Teflon-faced septum. Fill to overflowing with no headspace or air
bubbles. Chill and maintain at 4 °C.GCC____1-L glass bottle. Chill and maintain at 4 °C.________________________________
Table 8. Quality-assurance objectives for measured data[RPD, relative percent difference; °C, degrees Celsius; mg/L, milligram per liter; RSD, relative standard deviation]
Property or constituent
Specific conductancePHWater temperatureDissolved oxygenAlkalinity
Constituents
Accuracy
±5 percent of meter range+0.2 standard unit±0.5 °C±lmg/L+5 percent of most probable concentration
±3 standard deviations of most probable concentration
Precision 1 -2
RPD within 20 percentRPD within 20 percentRPD within 20 percentRPD within 20 percentRPD within 20 percent
RPD within method-reporting limits as referenced in table 6
Completeness (percent)
9090909090
90
r r1 2
1 For duplicate measurements, RPD = = X 100,
where Cl and C2 are the concentrations of duplicates 1 and 2, andC is the average concentration.9 SD L For three or more duplicates, RSD is used rather than RPD: RS D = -=-,
where SD is the standard deviation, and C is the average concentration.
The accuracy of the laboratory analytical data collected for selected organic constituent determina tions (including TOC, DOC, halomethanes and other VOC, and SVOC) was evaluated by the use of standard methods of analyses, surrogate/spike recoveries, and
USEPA check samples (VOC only). If the recovery of the surrogate/spike or check sample (that was analyzed, along with the samples from this project) was within three standard deviations of the laboratory-established average recoveries, then the data from the collected
28 Hydrogeotogic and Water-Quality Data from Wells near the Hueco Bolson Recharge Project Area, El Paso, Texas, 1990 and 1991

samples were determined to meet the accuracy objec tives of the project The accuracy of the SOC and MBAS analyses data was evaluated by the use of a standard method of analysis.
The precision of field measurements of physical properties was evaluated by duplicate measurements of specific conductance, pH, water temperature, and dissolved oxygen. The precision of laboratory analyti cal data was evaluated by randomly submitted dupli cate samples. If the relative percent difference (RPD) of duplicate samples was within 20 percent, then the data from the collected samples were determined to meet the precision objectives of the project. The preci sion of bacterial analyses was evaluated by the use of a five-tube MPN series.
Completeness was evaluated by dividing the number of valid analyses (those meeting the accuracy and precision objectives) by the number of samples analyzed, and multiplying by 100 to give a percent value. If the calculated result was greater than or equal to 90 percent, then the data from the collected samples were determined to be complete.
Representativeness of field data was evaluated by the use of standard methods of measurement and sample collection. Representativeness of laboratory analytical data was evaluated by the use of appropriate preservation techniques, adherence to the prescribed holding times, the use of field and laboratory blanks, and the use of field spikes. If these conditions were met, then the data from the collected samples were deter mined to accurately represent the characteristics of the aquifer.
Field spikes for the halomethane compounds were prepared from a spike mixture (which contained seven halomethane compounds) that was obtained from the NWQL. Field spikes and matrix spikes had a final concentration of 200 ng/L of each of the spike compounds in 1990. Field spikes were prepared using reagent water. Matrix spikes were prepared using ground-water samples from selected wells. Field spikes and matrix spikes had a final concentration of 500 ng/L of each of the spike compounds in 1991.
Reagent water (U.S. Environmental Protection Agency, 1990) was used as a trip blank to accompany selected samples (which were collected for VOC anal yses) to determine if any contaminants were introduced into the samples during shipping. Equipment blanks were collected by rinsing the stainless-steel thief sam pler with reagent water after it was cleaned. Other equipment blanks were collected by rinsing the copper
tubing/faucet assembly with reagent water. The rinses were analyzed for VOC and SVOC to determine if the samples were being contaminated by either the sam pling equipment or previous samples. Equipment blanks for bacterial analyses were collected by rinsing the sampling equipment with sterilized water, collect ing the rinse water, and analyzing it in the same manner as the other samples.
Results
Physical Properties, Major Ions, and Trace Elements
The specific conductance of water from injec tion, observation, and production wells ranged from 478 to 2,070 u,S/cm in 1990 and from 469 to 3,110 u,S/cm in 1991 (table 9, at end of report). Samples from wells 5-602,5-613,5-625, 6-402, and 6-405 had spe cific conductances greater than 1,000 uS/cm in 1990. Samples from wells 5-303,5-621,5-625,6-402,6-404, and 6-405 had specific conductances greater than 1,000 uS/cm in 1991. The pH of the water samples ranged from 7.2 to 8.1 in 1990, and from 7.0 to 8.0 in 1991. In 1990, the pH values in injected water from well 5-613 were slightly more acidic (7.2) than the range of pH values of water from the observation and production wells (7.3 to 8.1). All water samples contained dis solved oxygen concentrations ranging from 1.1 to 6.3 mg/L in 1990, and from 0.7 to 5.9 mg/L in 1991. The project QA objectives were met for all physical proper ties measured.
Analyses for major ions included calcium, mag nesium, sodium, potassium, bicarbonate, carbonate, sulfate, chloride, fluoride, bromide, iodide for 1990 only, and silica. The sum of the dissolved-solid constit uents ranged from 289 to 1,113 mg/L in 1990, and from 298 to 1,690 mg/L in 1991 (table 10, at end of report). Sodium and chloride generally contribute most of the equivalent charge to the sampled waters. Concentra tions of bromide and iodide were all less than 0.6 mg/L.
The project QA objectives were met for all major ions except for the following analyses: (1) the accu racy objective for fluoride analyses was not met in 1990 as determined by analysis of blind-reference sam ples by the NWQL (T.J. Maloney, U.S. Geological Survey, Branch of Quality Assurance, written com- mun., 1991); (2) the precision objective was not met for fluoride analyses from duplicate samples from well 6-402 in 1990; and (3) the completeness objective was
WATER-QUALITY DATA 29
not met for fluoride analyses in 1990 because the accu racy objective was not met.
Aluminum concentrations (1991 only) ranged from less than 10 to 40 u.g/L in 1991 (table 10). Boron concentrations ranged from 70 to 680 jig/L in 1990, and from 80 to 360 |ig/L in 1991 (table 10). The project QA objectives were met for all trace element analyses.
Nutrients and Field Colorlmetrlc Analyses
Nutrients analyzed include: nitrite; nitrite plus nitrate; nitrogen, ammonia; nitrogen, ammonia plus organic; phosphorus; and phosphorus, orthophosphate. The results of these analyses are given in table 11 (at end of report). Concentrations of nitrite plus nitrate in injected water ranged from 2.3 to 2.8 mg/L in 1990, and from 2.4 to 3.3 mg/L in 1991. Concentrations of riitrite plus nitrate in water from observation and production wells ranged from 1.2 to 6.4 mg/L in 1990, and from 0.6 to 3.3 mg/L in 1991. Concentrations of phospho rous, orthophosphate, in injected water ranged from 0.35 to 0.40 mg/L in 1990, and from 0.58 to 0.75 mg/L in 1991. Concentrations of phosphorus, orthophos phate, in water pumped from injection well 5-624 ranged from 0.58 to 0.59 mg/L on September 8,1991. Concentrations of phosphorus, orthophosphate, in other water samples ranged from less than 0.01 to 0.02 mg/L in 1990 and 1991.
The project QA objectives were met for all nutri ent data except for the following analyses: (1) the accuracy objective for nitrite analyses was not met in 1990 as determined by blind-reference sample results from the NWQL (T.J. Maloney, U.S. Geological Sur vey, Branch of Quality Assurance, written commun., 1991); (2) the precision objective was not met for nitro gen, ammonia plus organic analyses for duplicate sam ples from wells 5-603,5-605, and 6-402 in 1990, and for duplicate samples from wells 5-613 and 6-402 in 1991; (3) the precision objective was not met for nitro gen, ammonia analyses for duplicate samples from well 5-603 in 1990; (4) the precision objective was not met for phosphorous analyses for duplicate samples from wells 5-605 and 6-402 in 1990, and for duplicate sam ples from well 6-402 in 1991; and (5) the completeness objective was not met for nitrite analyses in 1990 because the accuracy objective was not met. The con stituents that did not meet the precision objective were detected at or near the reporting limit of the analytical method. Relatively high RPD's are expected near the
reporting limit (T.J. Maloney, U.S. Geological Survey, Branch of Quality Assurance, written commun., 1991).
The results of semiquantitative, field colorimet- ric analyses of free chlorine; nitrate; nitrite; nitrogen, ammonia; total iron; and ferrous iron are given in table 12 (at end of report). Nitrite was detected by field col- orimetric analyses at concentrations ranging from 0.01 to 0.09 mg/L in 1990 and 1991 analyses. No QA objec tives were developed for the field colorimetric meth ods.
Stable-lsotopic Ratios
The isotopic data are reported as the relative abundances of two stable isotopes of an element in a sample with respect to those in a standard reference sample. The reference samples used for the computa tion of the stable isotopic ratios were (1) Vienna Stan dard Mean Ocean Water for 818O and SD, and (2) a carbonate standard derived from fossil remains of Belemnitella americana from the Pee Dee Formation in South Carolina for 813C. The computational methods, descriptions of the reference standards, and methods of interpreting isotopic data are presented in more detail by Fritz and Fontes (1980).
The values of 818 O, SD, and 513C in water from injection, observation, and production wells in 1990 ranged from -10.05 to -9.00 per mil, -70.5 to -63.0 per mil, and -12.6 to -5.4 per mil, respectively (table 13, at end of report). The values of 818O, and SD in the injected water and in water from observation and pro duction wells in 1991 ranged from -10.25 to -9.05 per mil, and from -70.5 to -64.5 per mil, respectively (table 13). The project QA objectives were met for all stable isotopic data.
Organic Carbon and Methylene Blue Active Substances
The DOC, SOC, and MBAS concentrations in water from injection, observation, and production wells in 1990 ranged from 0.3 to 1.6 mg/L, less than 0.1 to 0.3 mg/L, and less than 0.02 to 0.06 mg/L, respectively (table 14, at end of report). The TOC and DOC concen trations in 1991 ranged from less than 0.1 to 1.8 mg/L and 0.2 to 2.6 mg/L, respectively (table 14).
The project QA objectives were met for all organic carbon and MBAS data except for the follow ing analyses: (1) the precision objective was not met for DOC analyses in duplicate samples from wells
30 Hydrogeologic and Water-Quality Data from Wells near the Hueco Bolson Recharge Project Area, El Paso, Texas, 1990 and 1991
5-603 and 5-605 in 1990 and for duplicate samples from well 6-402 in 1991; (2) the precision objective was not met for TOC analyses for duplicate samples from well 6-402 in 1991; and (3) the precision objec tive was not met for MBAS analyses for duplicate sam ples from well 5-603 in 1990. DOC and MBAS concentrations in these wells were within 10 times the reporting limit of the analytical method. Relatively high RPD's commonly are determined for concentra tions of duplicate samples that are near the reporting limit (T.J. Maloney, U.S. Geological Survey, Branch of Quality Assurance, oral commun., 1991). Organic car bon determinations in 1991 from wells 5-204,5-607, 5-624, 6-402, and 6-404 had DOC concentrations that were more than 0.2 mg/L greater than their TOC con centrations.
Volatile and Semivolatile Organic Compounds
In 1990, THM compounds were detected in water from 8 of the 16 observation and production wells sampled (table 15, at end of report). In water samples from observation and production wells where THM compounds were detected, the sum of the THM compounds ranged from 0.05 to 1.9 M-g/L. Concentra tions of THM compounds in 4 samples of water from injection well 5-613 ranged from 18.4 to 26.7 |4,g/L. Two halomethane compounds, dibromomethane and dichloromethane, were detected in water and from injection wells and from observation wells within about 700 ft of the injection wells.
In 1991, THM compounds were detected in water from 10 of the 17 observation and production wells sampled, including production wells 5-303, 5-601,5-605, and 6-402. In water samples from obser vation and production wells where THM compounds were detected, the sum of the THM compounds ranged from 0.05 to 1.4 |j,g/L. Concentrations of THM com pounds in 1991 in samples of water from injection wells 5-613 and 5-624 were 27.8 and 34.6 {4,g/L, respectively. Concentrations of THM compounds in 1991 in pumped samples from well 5-624, ranged from 0.33 to 0.36 \ig/L.
The project QA objectives were met for all sam ples submitted for selected-ion monitoring analyses of VOC data except for the precision objective, which was not met for duplicate trichlorofluoromethane deter minations from well 5-613 in 1990. The results of the QA samples submitted for VOC analysis are listed in table 15. The concentrations of the VOC in the reagent-
water spike in 1990 ranged from 42 to 260 ng/L, and the recoveries were within the limits of the analytical method, except for trichlorofluoromethane. Because trichlorofluoromethane is a gas at room temperature, low recoveries can occur (D.L. Rose, U.S. Geological Survey, National Water Quality Laboratory, written commun., 1990). The concentrations of the VOC in the 1990 matrix-water spike ranged from 190 to 350 ng/L. The concentrations of the VOC in the matrix-water spike were larger than intended. The data indicated an error in the spiking procedure because chloroform was the only compound detected in the sample from well 5-605, which was used as the matrix water. Dichlo romethane was detected in the trip and equipment blanks at concentrations greater than the reporting limit.
The concentrations of the VOC in the reagent- water spike, which was spiked using a 100-jiL syringe, ranged from 331 to 504 ng/L in 1991. The concentra tions of the VOC in the matrix-water spike, which was added to water samples using a 100-uL pipette, ranged from 240 to 400 ng/L in 1991. The recoveries for both spikes are within the limits of the analytical method, except for trichlorofluoromethane in the matrix spike (D.L. Rose, U.S. Geological Survey, National Water Quality Laboratory, written commun., 1991). Dichlo romethane was detected in the trip and equipment blanks at concentrations greater than the reporting limit.
In addition to the VOC's listed in table 15, water samples were analyzed for other VOC's, which are listed in table 6. The only other VOC's detected in the samples were tetrachloroethene, which was detected in duplicate samples from well 6-402 in 1990 at a concen tration of 130 ng/L, and toluene, which was detected in well 6-401 in 1991 at a concentration of 0.6 |4,g/L (U.S. Geological Survey, Austin, Texas, unpub. data). A hydrocarbon sheen was noted in the water obtained from well 6-401 in 1991 during sampling. The project QA objectives were met for all other VOC analyses. No other VOC was detected in the trip and equipment blanks in concentrations greater than the reporting limit.
The water samples from injection, observation, and production wells were analyzed for 54 methylene- chloride extractable SVOC's in 1990, which are listed in table 6. The only SVOC detected was bis (2-ethyl- hexyl) phthalate, a chemical used extensively as a plas- ticizer. Bis (2-ethylhexyl) phthalate was detected in samples collected from wells 5-622 and 5-301, with
WATER-QUALITY DATA 31
concentrations of 6 u.g/L and 7 u.g/L, respectively. Plas tic tubing was not used in sample collection equipment. The project QA objectives were met for all SVOC anal yses. The SVOC's were not detected in the equipment blanks in concentrations above the reporting limit.
Bacterial Analyses
The procedures used to assay bacterial popula tions in ground water are based on the assumption that the majority of all bacterial types present on the aquifer solids were dislodged by pumping and were entrained in the water moving toward the well bore (Godsy and Ehrlich, 1978). Processes such as sorption and size- based exclusion may impede bacterial movement through the aquifer and affect the bacterial populations that are determined by these methods (Bouwer and oth ers, 1981).
The results of the bacterial analyses are given in table 16 (at end of report). The AODC present in water from observation and production wells ranged from 2,200 organisms per mL at well 5-204, to 770,000 organisms per mL at 430 ft below land surface at well 5-622. Two samples of water from injection well 5-613 contained AODC (1,500 organisms/mL and 1,800 organisms/mL) in amounts that were comparable to that of the equipment blank (800 organisms/mL). The AODC's in all the water samples were below the mini mum number required for statistical validity of the ADOC method. The largest AODC's in all samples col lected were in five of six samples from observation wells taken within 2 days after the well was purged.
Aerobic bacteria were determined to be the only bacteria type present in all samples except well 5-621, sampled at 640 ft below land surface, and well 6-405. These two wells contained denitrifying bacteria in addition to aerobic bacteria. Aerobic bacteria popula tions in ground water ranged from 80 MPN/mL, in well 5-622 at 690 ft below land surface, to greater than 160,000 MPN/mL, in water from wells 5-622,5-625, and 5-626 (table 16).
The numbers of denitrifying bacteria were sub stantially greater than the analytical detection limit of 0.2 MPN/mL in a sample from well 6-405. Anaerobic, sulfate-reducing, and methanogenic bacteria were not detected in any of the samples. Bacteria were not detected in the equipment blank except AODC counted bacteria. The accuracy, precision, completeness, and representativeness objectives of this project were met for all bacterial analyses.
REFERENCES CITED
American Public Health Association and others, 1985, Part 908D. Estimation of bacterial density, in Standard methods for the examination of water and wastewater (16th ed.): Washington, D.C., American Public Health Association, p. 880-882.
Bates, R.L., and Jackson, J.A., eds., 1987, Glossary of geol ogy (3d ed.): Alexandria, Va., American Geological Institute, 788 p.
Bouwer, EJ., Rittman, B.E., and McCarty, P.L., 1981,Anaerobic degradation of halogenated 1- and 2-carbon organic compounds: Environmental Science and Tech nology, v. 15, no. 5, p. 596-599.
Coplin, T.B., Wildman, J.D., and Chen, Julie, 1991,Improvements in the gaseous hydrogen-water equilib rium technique for hydrogen isotope ratio analysis: Analytical Chemistry, v. 63, p. 910-912.
Epstein, Samuel, and Mayeda, Toshiko, 1953, Variation of O18 content of waters from natural sources: Geo- chimica et Cosmochimica Acta, v. 4, no. 5, p. 213-224.
Fishman, M.J., and Friedman, L.C., 1989, Methods for determination of inorganic substances in water and flu vial sediments: U.S. Geological Survey Techniques of Water-Resources Investigations, book 5, chap. Al, 545 p.
Fritz, Peter, and Fontes, J.C., 1980, Handbook of environ mental isotope geochemistry, v. 1, The terrestrial envi ronment, A: Amsterdam, The Netherlands, Elsevier Scientific Publishing Co., p. 1-19.
Garza, Sergio, Weeks, E.P., and White, D.E., 1980,Appraisal of potential for injection-well recharge of the Hueco bolson with treated sewage effluent-prelimi nary study of the northeast El Paso area, Texas: U.S. Geological Survey Open-File Report 80-1106, 39 p.
Gates, J.S., White, D.E., Stanley, W.D., and Ackerman, H.D., 1980, Availability of fresh and slightly saline ground water in the basins of westernmost Texas: Texas Department of Water Resources Report 256, 108 p.
Gleason, J.D., Friedman, Irving, and Hanshaw, B.B., 1969, Extraction of dissolved carbonate species from natural water for carbon-isotope analysis: U.S. Geological Survey Professional Paper 650-D p. D248-D250.
Godsy, E.M., 1980, Isolation of Methanobacterium bryantii from a deep aquifer by using a novel broth-antibiotic disk method: Applied and Environmental Microbiol ogy, v. 39, p. 1,074-1,075.
Godsy, E.M., and Ehrlich, G.G., 1978, Reconnaissance for microbial activity in the Magothy aquifer, Bay Park, New York, four years after artificial recharge: U.S. Geological Survey Journal of Research, v. 6, no. 6, p. 829-836.
32 Hydrogeologic and Water-Quality Data from Wells near the Hueco Bolson Recharge Project Area, El Paso, Texas, 1990 and 1991

Hach Co., 1989, Water analysis handbook: Loveland, Colo., 691 p.
Holdeman, L.V., and Moore, W.E.C., 1972, Anaerobe labo ratory manual: Blacksburg, Va., Virginia Polytechnic Institute and State University, 130 p.
Keys, W.S., and MacCary, L.M., 1971, Application of bore hole geophysics to water-resources investigations: U.S. Geological Survey Techniques of Water-Resources Investigations, book 2, chap. El, 126 p.
Knorr, D.B., and Cliett, Tom., 1985, Proposed ground-water recharge at El Paso, Texas, in Asano, Takashi, ed., Arti ficial recharge of groundwaten Butterworth Publishers, p. 425-480.
Knowles, D.B., and Kennedy, R.A., 1956, Ground-water resources of the Hueco bolson, northeast of El Paso, Texas: Texas Board of Water Engineers Bulletin 5615, 265 p.
Lucey, K.J., 1989, Quality assurance data for routine water analyses in the National Water-Quality Laboratory of the U.S. Geological Survey for water year 1988: U.S. Geological Survey Water-Resources Investigations Report 89-4166,96 p.
McLean, J.S., 1970, Saline ground-water resources of the Tularosa basin, New Mexico: Albuquerque, U.S. Geo logical Survey for the U.S. Office of Saline Water, Research and Development Program Report 561,128 p.
Meyer, W.R., 1976, Digital model for simulated effects of ground-water pumping in the Hueco bolson, El Paso area, Texas, New Mexico, and Mexico: U.S. Geologi cal Survey Water-Resources Investigations Report 58- 75,31 p.
Myers, B.N., 1969, Compilation of results of aquifer tests in Texas: Texas Water Development Board Report 98, 532 p.
Orr, B R., and White, R.R., 1985, Selected hydrologic data from the northern part of the Hueco bolson, New Mexico and Texas: U.S. Geological Survey Open-File Report 85-696, 88 p.
Stanier, R.Y., Palleroni, NJ., and Doudoroff, Michael, 1966, The aerobic pseudomonads~a taxonomic study: Jour nal of General Microbiology, v. 43, p. 159-271.
Thurman, E.M., 1985, Organic geochemistry of natural waters: Dordrecht, The Netherlands, Martinus Nijhoff/ Dr. W Junk Publishers, 497 p.
U.S. Environmental Protection Agency, 1983, Methods for chemical analysis of water and wastes: 600/4-79-020, 402 p.
___1990, Methods for organic chemical analysis of municipal and industrial wastewater: Federal Register, 40 CFR 136, App. A, Method 624, July 1,1990, p. 461.
Wershaw, R.L., Fishman, M.J., Grabbe, R.R., and Lowe, L.E., 1987, Methods for the determination of organic substances in water and fluvial sediments: U.S. Geo logical Survey Techniques of Water-Resources Investi gations, book 5, chap. 43, 80 p.
White, D.E., 1983, Summary of hydrologic information in the El Paso, Texas, area, with emphasis on ground- water studies, 1903-80: U.S. Geological Survey Open- File Report 83-775, 77 p.
White, D.E., and Sladek, GJ., 1990, Summary of data from the 1981-83 pilot study and 1985-89 operations of the Hueco Bolson Recharge Project, northeast El Paso, Texas: U.S. Geological Survey Open-File Report 90- 175, 38 p.
Wilson, J.T., McNabb, J.F., Balkwill, D.L., and Ghiorse, W.C., 1983, Enumeration and characterization of bacte ria indigenous to a shallow water-table aquifer: Ground Water, v. 21, p. 134-142.
Wood, W.W, 1976, Guidelines for collection and field anal ysis of ground-water samples for selected unstable con stituents: U.S. Geological Survey Techniques of Water- Resources Investigations, book 1, chap. D2,24 p.
REFERENCES CITED 33

Table 5. Characteristics of wells
[ft, feet; in., inches; gal/min, gallons per minute; --, no data]
Well number
JL-49-05-509(RW-10)
JL49-05-613(RW-8)
JL-49-05-616(RW-2)
JL-49-05-617(RW-3)
JL-49-05-619(RW-5)
JL-49-05-620(RW-4)
JL-49-05-623(RW-6)
JL-49-05-624(RW-7)
JL-49-05-627(RW-9)
JL-49-06-406(RW-1)
JL-49-05-306(61)
JL-49-05-321
JL-49-05-322
JL-49-05-614(OB-8)
JL-49-05-618(OB-5)
JL-49-05-621(OB-4A)
Land-surface
elevation above
sea level(ft)
4,032
3,990
4,000
4,002
3,997
3,990
3,984
3,982
4,004
4,008
4,051
4,054
4,050
3,989
3,999
3,988
Welldepth below land
surface(ft)
658
810
829
835
881
878
740
780
632
767
603
500
500
810
705
709
Pumping Diameter pump rate
(In.) setting (gal/min)
Well casing
2616
2418
2616
2616
2616
2616
2616
2616
2616
2616
18
4
4
244
6
6
Well Mow Recent screen land and
surface<ft> mea.
sured
Injection wefls
16 460
1816
16 430
16 430
16 430
16 430
16 430
16 430
16 460
16 430
Observation wells
18
4
4
4 _
6
6
Water level below land surface
(ft)
Original anddate
measured
391.8009/05/84
343.5705/18/81
356.2004/30/84
358.2006/04/84
354.4006/18/84
320.2507/02/84
348.6507/13/84
367.3008/24/84
362.1003/29/84
356.0201/03/67
379.6912/06/88
369.4512/06/88
3363312/19/81
353.8712/19/84
344.7912/19/84
Recent anddatemeasured
-
-
381.6612/20/90
384.4212/12/90
373.2712/12/90
3412612/18/90
352.6912/18/90
344.7112/18/90
Screened depths below land surface (ft)
and remarks
351 to 411, 441 to 521,556 to 576, 61 8 to 658
188 to 810
279 to 299, 324 to 344,431 to 511, 541 to 602,642 to 702, 749 to 829
329 to 349, 439 to 499,525 to 565, 589 to 609,629 to 649, 735 to 835
320 to 380, 4 13 to 453,474 to 534, 554 to 574,651 to 711, 801 to 881
284 to 304, 409 to 529625 to 645, 660 to 700,773 to 8 13, 838 to 878
193 to 273, 308 to 568,640 to 740
270 to 330, 385 to 425,460 to 540, 586 to 666,700 to 780
316 to 356, 391 to 471,5 12 to 632
296 to 336, 403 to 543,627 to 767
391 to 603; not connectedto system
300 to 500
300 to 500
315 to 810
327 to 621, 663 to 705
352 to 709
Footnote at end of table.
34 Hydrogeologic and Water-Quality Data from Wells near the Hueco Bolson Recharge Project Area, El Paso, Texas, 1990 and 1991

Table 5. Characteristics of wells-Continued
Well number 1
Land-surface
elevation above
sea level(ft)
Welldepth below land
surface(ft)
Diameter(in.)
Well casing
Well screen
Pumpsetting below land
surface(ft)
Pumping rate
(gal/min)
Recent andyearmeasured
Water level below land surface
(ft)
Original anddate
measured
Recent anddatemeasured
Screened depths below land surface (ft)
afiri rptnnfkcAllU I ClllAI Ah)
Observation wells Continued
JL49-05-622(OB-4B)
JL49-05-625(OB-7A)
JL49-05-626(OB-7B)
JL49-06-101(57)
JL49-06-111(HB-6)
JL49-06405(OB-IB)
JL49-06-503(HB-5)
JL49-06-906
3,986
3,982
3,983
4,065
4,014
4,009
3,976
4,005
709
751
751
551
560
710
601
550
6
6
6
18
6
6
6
10.75
6
6
6
18
6
6
6
10.75
._
-
~
_
~
._
342.6512/19/84
341.6712/20/84
343.8912/20/84
320.6712/29/65
307.6602/05/85
357.4512/19/84
272.1012/29/82
343.7412/18/90
347.3112/18/90
343.0012/18/90
311.1212/20/90
360.0612/18/90
277.2512/19/90
324.6012/19/90
352 to 625, 646 to 709
331 to 751
331 to 751
336 to 55 1 ; not connectedto system
337 to 537; plugged at417 in 1987
353 to 710
284 to 586
316 to 418, 472 to 489,509 to 529
Production wells
JL49-05-204(41)
JL49-05-301(42)
JL49-05-303(53)
JL49-05-304(54)
JL49-05-501(31)
JL49-05-502
JL49-05-504(52)
JL^9-05-601(36)
JL49-05-602(35)
JL49-05-603(32)
JL49-05-604(34)
4,041
4,015
4,044
4,055
4,000
4,042
4,130
3,996
4,005
3,983
3,970
515
671
870
753
730
567
1,152
690
699
657
802
18
18
18
18
18
4
18
18
18
18
18
18
1812
1812
1812
1812
4
1812
1812
1812
1812
1812
--
420
480
540
660
480
460
480
440
1,0551988
1,4101988
1,4491988
8731988
7441988
1,4561988
1,3651988
1,2061988
1,6701988
331.5801/05/60
317.0601/08/62
338.0005/16/55
338.0007/15/55
320.0012/25/56
336.5406/26/40
449.5012/28/63
299.4301/06/59
309.9801/06/59
293.7401/06/59
279.4502/13/58
375.5912/20/90
360.1212/13/88
384.4012/19/90
380.9712/09/90
379.5512/23/83
402.2912/12/89
510.0601/07/91
349.9212/19/90
357.0112/19/90
351.6212/18/90
381.9712/19/90
359 to 5 15
320 to 505, 507 to 671
380 to 870
377 to 753; not connectedto system
3 19 to 498, 500 to 730
342 to 381, 440 to 461,474 to 492, 502 to 524
461 to 1,152
350 to 690
354 to 699
335 to 506, 508 to 657
325 to 500, 501 to 802
Footnote at end of table.
Table 5 35

Table 5. Characteristics of wells-Continued
Well number
Land-surface
elevation above
sea level(ft)
Welldepth below land
surface(ft)
Diameter(in.)
Well casing
Well screen
Pumpsetting below land
surface(ft)
Pumping rate
(gal/min)
Recent andyearmeasured
Water level below land surface
(ft)
Original anddate
measured
Recent anddatemeasured
Screened depths below land surface (ft)
and remarks
Production wells ContinuedJL-49-05-605
(44)JL-49-05-607
(40)JL-49-05-615
(29A)JL-49-05-802
(26)JL-49-05-901
(28)JL-49-05-906
(62)JL-49-06-401
(59)JL-49-06-402
(56)JL-49-06-404
3,986
3,925
3,958
3,967
3,942
3,923
3,998
4,013
3,998
769
826
920
830
121
950
451
670
683
18
18
16
18
18
18
18
18
14
1812
1812
16
1812
1812
1812
18
1812
14
440
460
440
460
430
480
450
420
1,1151988
1,4411988
1,4291988
1,0121988
9231988
1,9091988
1,4581988
300.6508/12/60
244.1012/14/60
320.5812/14/82
320.2601/31/73
257.6001/06/59
252.3403/16/66
308.3612/29/65
329.8901/04/65
335.0008/23/75
343.1012/13/88
306.6512/14/89
328.5812/18/90
355.5412/18/90
325.7212/19/90
300.4012/04/89
334.8112/19/90
362.7912/12/90
324 to 769
308 to 826
557 to 677, 7 17 to 797,836 to 920
360 to 464, 467 to 820
348 to 447, 449 to 727
330 to 950
348 to 45 1 ; not connectedto system
352 to 670
396 to 676
1 El Paso Water Utilities-Public Service Board well number is in parentheses.
36 Hydrogeologic and Water-Quality Data from Wells near the Hueco Bolson Recharge Project Area, El Paso, Texas, 1990 and 1991

Table 6. Analytical method, method-reporting limit, sample volume, preservation and bottle requirements, and holding times for water samples
[USGS, U.S. Geological Survey; SH, lab schedule; LC, lab code; mL, milliliters; mg/L, milligram per liter; mg, milligrams; |ig/L, micrograms per liter; SMOW, standard mean ocean water; --, not applicable; PDB, Pee Dee Belemnite; L, liter; ng/L, nanograms per liter]
USGS schedule
or lab code
SH1022 plus LC 1183, LC1284
SH0230plus LC0162
LC0489
LC0300
LC0440
LC0114
Constituent
Major ions and trace elements:
Calcium, dissolved
Magnesium, dissolved
Sodium, dissolved
Potassium, dissolved
Sulfate, dissolved
Chloride, dissolved
Fluoride, dissolved
Bromide, dissolved
Iodide, dissolved
Silica, dissolved as SiO2
Aluminum, total
Boron, dissolved
Nutrients:
Nitrite, dissolved as N
Nitrite plus nitrate, dissolved as N
Nitrogen, ammonia, dissolved as N
Nitrogen, ammonia plus organic, dissolvedasN
Phosphorous, dissolved as P
Phosphorous, dissolved orthophosphate as P
Oxygen- 18/oxy gen- 16 (5 18O), aqueous, per mil relative to SMOW
Deuterium/protium (8D), aqueous, per mil relative to SMOW
Carbon-13/carbon-12 (5 13C), aqueous, per mil relative to PDB
Carbon, organic, total as C
Analytical method1
1-1152-85
1-1447-85
1-1735-85
1-1630-85
1-2057-85
1-2057-85
1-2057-85
1-2057-85
1-2057-85
1-1702-85
1-1051-85
1-1114-85
1-2540-85
1-2545-85
1-2522-85
1-2552-85
1-2600-85
1-2601-85
Epstein and Mayeda (1953)
Coplin and others (1991)
Gleason and others (1969)
O-3100-83
.... Sample volume, Method- r . ^ preservation and reporting * ... . .. .1 bottle-requirementUmlt cole2
0.1
.1
.1
.1
1
.1
.1
.01
.001
.110
.01
.01
.10
.01
.20
.01
.01
.15
1.5
.2
.1
250mLFU, lOOmL RU, 250 mL FA
mg/L
mg/L
mg/L
mg/L
mg/L
mg/L
mg/L
mg/L
mg/L
mg/L
^g/L
Hg/L
250mLFC
mg/L
mg/L
mg/L
mg/L
mg/L
mg/L
per mil 60 mL RU
per mil 60 mL RU
per mil 250mgPPT,RU
mg/L 100 mLLC 0114
Holding time3(days)
42
42
42
42
28
28
28
28
28
42
42
42
8
--
-
-
28
Footnotes at end of table.
Table 6 37
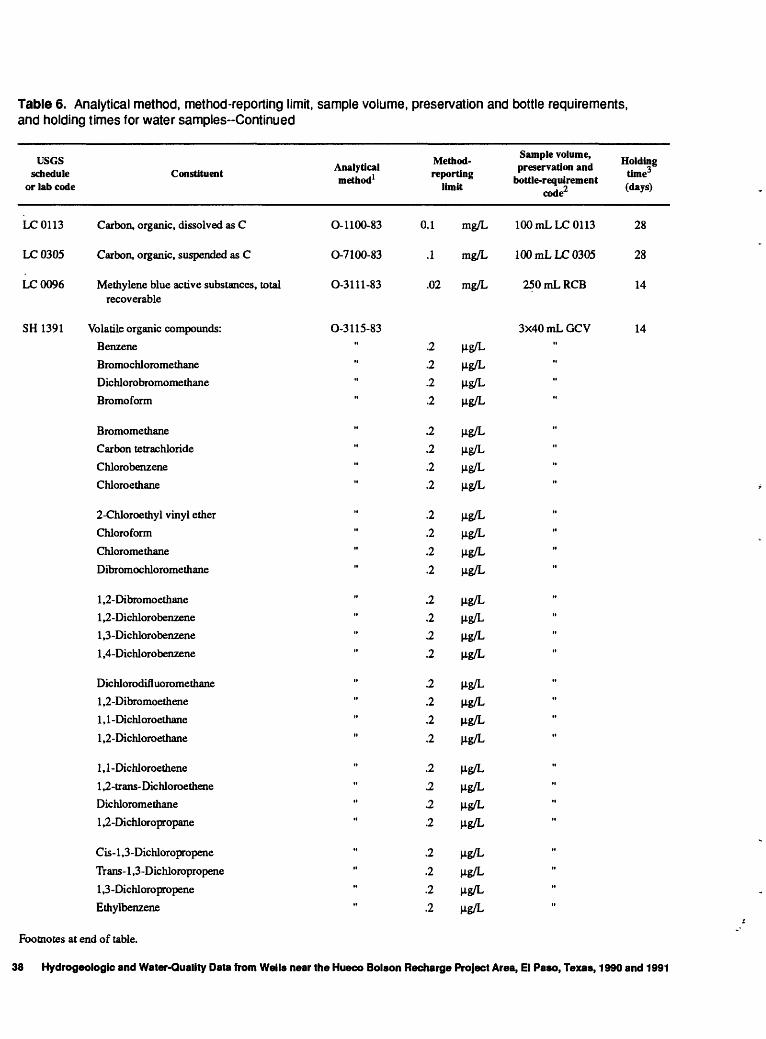
Table 6. Analytical method, method-reporting limit, sample volume, preservation and bottle requirements, and holding times for water samples-Continued
usesschedule
or lab code
LC0113
LC0305
LC0096
SH 1391
Constituent
Carbon, organic, dissolved as C
Carbon, organic, suspended as C
Methylene blue active substances, total recoverable
Volatile organic compounds:
Benzene
Bromochloromethane
Dichlorobromome thane
Bromoform
Bromomethane
Carbon tetrachloride
Chlorobenzene
Chloroethane
2-Chloroethyl vinyl ether
Chloroform
Chloromethane
Dibromochloromethane
1 ,2-Dibromoethane
1 ,2-Dichlorobenzene
1 ,3-Dichlorobenzene
1 ,4-Dichlorobenzene
Dichlorodifluoromethane
1 ,2-Dibromoethene
1 , 1 -Dichloroethane
1 ,2-Dichloroethane
1 , 1 -Dichloroethene
1 ,2-trans- Dichloroethene
Dichloromethane
1 ,2-Dichloropropane
Cis- 1 ,3-Dichloropropene
Tr ans- 1 ,3-Dichloropropene
1 ,3-Dichloropropene
Ethylbenzene
. , t . , Method- Analytical , ' .1 reportingmethod Lit
O-1100-83 0.1 mg/L
O-7100-83 .1 mg/L
O-3111-83 .02 mg/L
O-3115-83
" -2 Mg/L
" -2 Mg/L
" -2 Mg/L
" -2 M-g/L
" .2 M-g/L
" .2 Mg/L
" -2 Mg/L
" -2 Mg/L
" .2 Mg/L
.2 Mg/L
.2 Mg/L
" -2 Mg/L
" -2 Mg/L
" .2 Mg/L
" -2 Mg/L
" -2 Mg/L
" -2 Mg/L
" -2 Mg/L
" .2 Mg/L
-2 Mg/L
" -2 M-g/L
" -2 Mg/L
" -2 Mg/L
2 Mg/L
.2 Mg/L
2 Mg/L
.2 Mg/L
.2 Mg/L
Sample volume, ... *. j Holding preservation and 3
bottle-requirement .. j 2 (days) code1' v J '
100 mLLC 0113 28
100 mLLC 0305 28
250 mL RGB 14
3x40mLGCV 14"" "
»" 11
»11 11
»11M"
»
H
»»1111
»
""11
Footnotes at end of table.
38 Hydrogeologic and Water-Quality Data from Wells near the Hueco Bolson Recharge Project Area, El Paso, Texas, 1990 and 1991

Table 6. Analytical method, method-reporting limit, sample volume, preservation and bottle requirements, and holding times for water samples-Continued
usesschedule
or lab code
SH 1391
SH 1383
Constituent
Volatile organic compounds:-- Continued
Ethenylbenzene
Methylene chloride
Styrene
1 , 1,2,2-Tetrachloroethane
Tetrachloroethene
Toluene
1,1, 1-Trichloroethane
1 , 1,2-Trichloroethane
Trichloroethene
Trichlorofluoromethane
Vinyl chloride
Xylenes, mixed
Volatile organic compounds, selected-ion monitoring method:
Bromochloromethane
Dichlorobromomethane
Bromoform
Chloroform
Dibromochloromethane
Dibromomethane
Dichloromethane
Trichlorofluoromethane
Methylene chloride-extractable semivolatile organic compounds:
Acenapthene
Acenapthylene
Anthracene
Benzo (a) anthracene
Benzo (b) fluoranthene
Benzo (k) fluoranthene
Benzo (g,h,i) perylene
Benzo (a) pyrene
.. .. , Sample volume, ... . , tl , Method- r .. ' Holding Analytical .. preservation and .. 3" ' .1 reporting .... . . time method1 V, . bottle-requirement ,. , limit "* 2 (days)
O-3 1 15-83 3X40 mL GCV 14
0.2 |ig/L
.2 |ig/L
.2 jig/L
.2 »slL
.2 jig/L
.2 |ig/L
" .2 jig/L
.2 |ig/L
" .2 jig/L "
.2 jig/L
.2 |ig/L "
" .2 M-g/L "
E-50L3 3X40 mL GCV 14
20 ng/L
20 ng/L
20 ng/L
20 ng/L
20 ng/L
20 ng/L
20 ng/L
50 ng/L
0-3117-83, 1LGCC 42/45 O-3118-83
" 5.0 M-g/L "
5.0 |ig/L
5.0 jig/L "
" 10.0 |ig/L
10.0 ^ig/L
10.0 ^ig/L
10.0 ^ig/L
10.0 ug/L
Footnotes at end of table.
Table 6 39
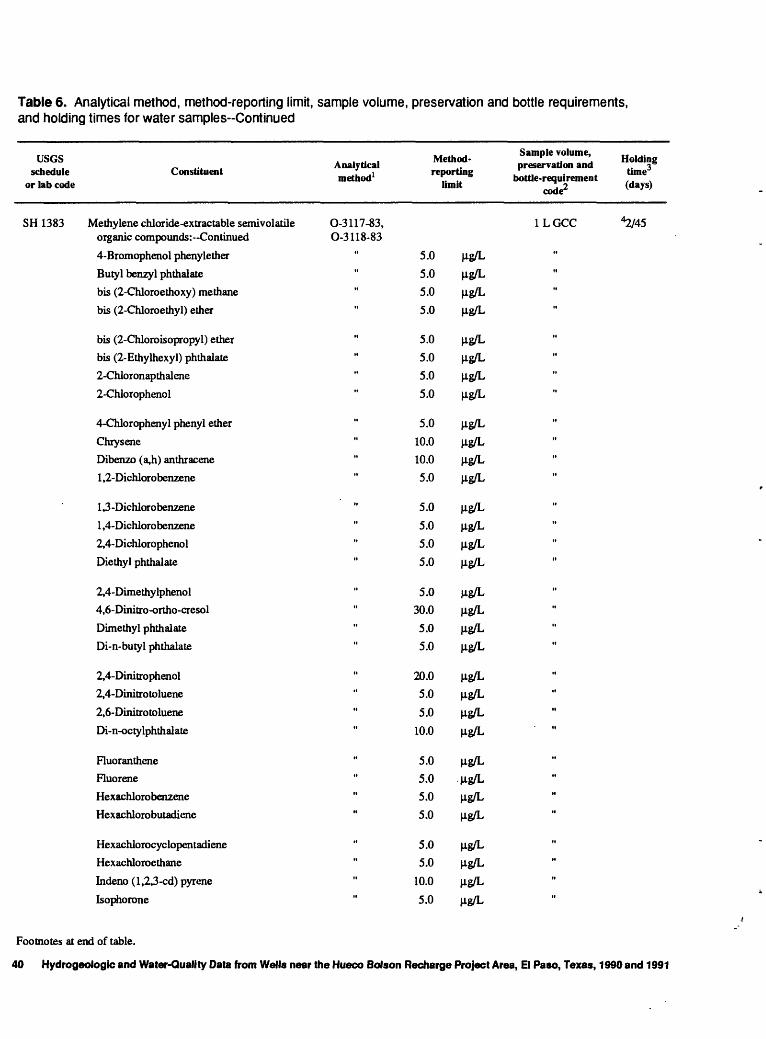
Table 6. Analytical method, method-reporting limit, sample volume, preservation and bottle requirements, and holding times for water samples-Continued
usesschedule Constituent
or lab code
SH 1383 Methylene chloride -extractable semivolatile organic compounds:~Continued
4-Bromophenol phenylether
Butyl benzyl phthalate
bis (2-Chloroethoxy) methane
bis (2-Chloroethyl) ether
bis (2-Chloroisopropyl) ether
bis (2-Ethylhexyl) phthalate
2-Chloronapthalene
2-Chlorophenol
4-Chlorophenyl phenyl ether
Chrysene
Dibenzo (a,h) anthracene
1 ,2-Dichloro benzene
1 3 -Dichloro benzene
1 ,4-Dichlorobenzene
2,4-Dichlorophenol
Diethyl phthalate
2,4-Dimethylphenol
4,6-Dinitro-ortho-cresol
Dimethyl phthalate
Di-n-butyl phthalate
2,4-Dinitrophenol
2,4-Dinitrotoluene
2,6-Dinitrotoluene
Di-n-octylphthalate
Fluoranthene
Fluorene
Hexachlorobenzene
Hexachlorobutadiene
Hexachlorocyclopentadiene
Hexachloroethane
Indeno (1,2,3-cd) pyrene
Isophorone
. . ^. . Sample volume, A »i Method- r .. . Holding Analytical . preservation and , 3
L .1 reporting .... . . time method1 ,, ,A bottle-requirement . limit j 2 (days)
code
O-3117-83, 1LGCC "2/45 O-3 118-83
" 5.0 M-g/L "
5.0 M-g/L "
" 5.0 M-g/L "
" 5.0 M-g/L "
" 5.0 M-g/L "
" 5.0 M-g/L "
" 5.0 M-g/L "
" 5.0 M-g/L "
" 5.0 M-g/L "10.0 M£/L
10.0 M£/L
" 5.0 M-g/L "
" 5.0 M-g/L "
" 5.0 M-g/L "
" 5.0 M-g/L "
" 5.0 M-g/L "
5.0 M£/L
30.0 M£/L
5.0 M£/L
" 5.0 M-g/L "
20.0 M^g/L
" 5.0 M-g/L "
" 5.0 M-g/L "
10.0 ^ig/L
5.0 M^g/L
5.0 M^g/L
5.0 M^g/L
" 5.0 M-g/L "
" 5.0 M-g/L "5.0 ^ig/L
10.0 M^g/L
" 5.0 M-g/L "
Footnotes at end of table.
40 Hydrogeologic and Water-Quality Data from Wells near the Hueco Bolson Recharge Project Area, El Paso, Texas, 1990 and 1991
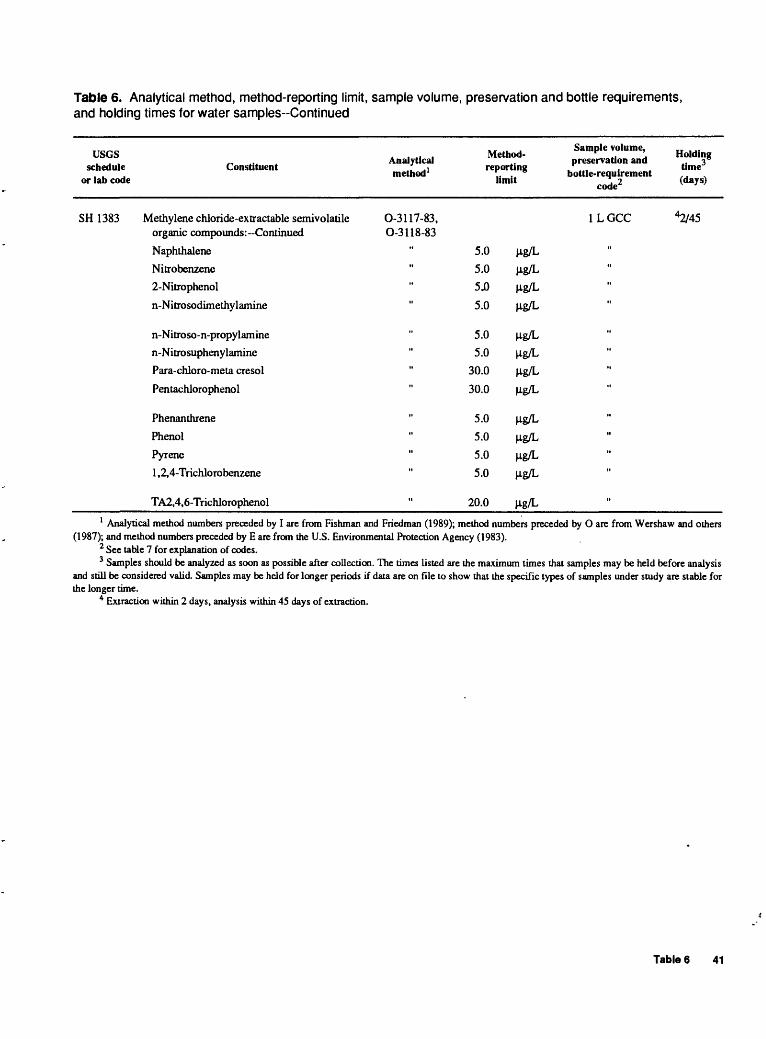
Table 6. Analytical method, method-reporting limit, sample volume, preservation and bottle requirements, and holding times for water samples-Continued
usesschedule
or lab code
SH 1383
Constituent
Methylene chloride-extractable semivolatile organic compounds: Continued
Naphthalene
Nitrobenzene
2-Nitrophenol
n-Nitrosodimethylamine
n-Nitroso-n-propylamine
n-Nitro supheny lamine
Para-chloro-meta cresol
Pentachlorophenol
Phenanthrene
Phenol
Pyrene
1 ,2,4-Trichlorobenzene
TA2,4,6-Trichlorophenol
. , t . , Method- Analytical ..
' .1 reporting method1 \. lt 6
limit
0-3117-83, 0-3118-83
5.0 n.g/L" 5.0 n.g/L
5jO n.g/L
" 5.0 M-g/L
5.0 n.g/L" 5.0 n.g/L
30.0 \nglL
30.0 M-g/L
5.0 n.g/L
5.0 ^g/L
5.0 ^g/L
5.0 ^g/L
20.0 ^g/L
Sample volume, T¥ , .. r .. . Holding
preservation and 3"bottle-requirement .. ^
i (days) code
1 L GCC 42/45
"1111
1111
"
1111
»
1 Analytical method numbers preceded by I are from Fishman and Friedman (1989); method numbers preceded by O are from Wershaw and others (1987); and method numbers preceded by E are from the U.S. Environmental Protection Agency (1983).
2 See table 7 for explanation of codes.3 Samples should be analyzed as soon as possible after collection. The times listed are the maximum times that samples may be held before analysis
and still be considered valid. Samples may be held for longer periods if data are on file to show that the specific types of samples under study are stable for the longer time.
4 Extraction within 2 days, analysis within 45 days of extraction.
Table 6 41
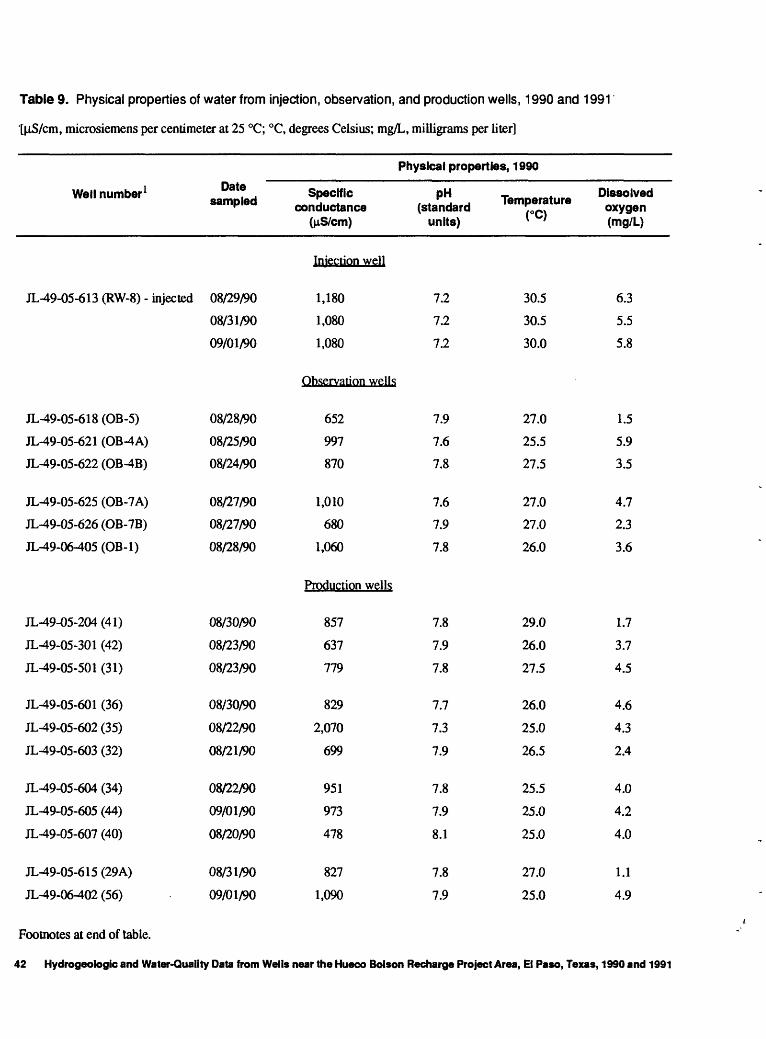
Table 9. Physical properties of water from injection, observation, and production wells, 1990 and 1991
[M-S/cm, microsiemens per centimeter at 25 °C; °C, degrees Celsius; mg/L, milligrams per liter]
Physical properties, 1990
Well number 1
JL-49-05-613 (RW-8) - injected
JL-49-05-618 (OB-5)
JL-49-05-621 (OB-4 A)
JL-49-05-622 (OB-4B)
JL-49-05-625 (OB-7 A)
JL-49-05-626 (OB-7B)
JL-49-06-405 (OB-1)
JL-49-05-204(41)
JL-49-05-301 (42)
JL-49-05-501 (31)
JL-49-05-601 (36)
JL-49-05-602 (35)
JL-49-05-603 (32)
JL-49-05-604 (34)
JL-49-05-605 (44)
JL-49-05-607 (40)
JL-49-05-615 (29A)
JL-49-06-402 (56)
Date sampled
08/29/90
08/31/90
09/01/90
08/28/90
08/25/90
08/24/90
08/27/90
08/27/90
08/28/90
08/30/90
08/23/90
08/23/90
08/30/90
08/22/90
08/21/90
08/22/90
09/01/90
08/20/90
08/31/90
09/01/90
Specific conductance
(jxS/cm)
Injection well
1,180
1,080
1,080
Observation wells
652
997
870
1,010
680
1,060
Production wells
857
637
779
829
2,070
699
951
973
478
827
1,090
pH (standard
units)
7.2
7.2
7.2
7.9
7.6
7.8
7.6
7.9
7.8
7.8
7.9
7.8
7.7
7.3
7.9
7.8
7.9
8.1
7.8
7.9
Temperature (°C)
30.5
30.5
30.0
27.0
25.5
27.5
27.0
27.0
26.0
29.0
26.0
27.5
26.0
25.0
26.5
25.5
25.0
25.0
27.0
25.0
Dissolved oxygen (mg/L)
6.3
5.5
5.8
1.5
5.9
3.5
4.7
2.3
3.6
1.7
3.7
4.5
4.6
4.3
2.4
4.0
4.2
4.0
1.1
4.9
Footnotes at end of table.
42 Hydrogeologte and Water-Quality Data from Wells near the Hueco Bolson Recharge Project Area, El Paso, Texas, 1990 and 1991

Table 9. Physical properties of water from injection, observation, and production wells, 1990 and 1991 -Continued
Physical properties, 1991
Well number 1
JL-49-05-613 (RW-8) - injected
JL-49-05-624 (RW-7) - injected
JL-49-05-624 (RW-7) - pumped2
JL-49-05-624 (RW-7) - pumped3
JL-49-05-624 (RW-7) - pumped4
JL-49-05-618 (OB-5)
JL-49-05-621 (OB-4A)
JL-49-05-622 (OB-4B)
JL-49-05-625 (OB-7A)
JL-49-05-626 (OB-7B)
JL-49-06-405 (OB-1)
JL-49-05-204 (41)
JL-49-05-303 (53)
JL-49-05-601 (36)
JL-49-05-602 (35)
JL-49-05-603 (32)
JL-49-05-605 (44)
JL-49-05-607 (40)
JL-49-05-615 (29A)
JL-49-06-401 (59)
Date sampled
08/25/91
08/27/91
09/08/91
09/08/91
09/08/91
08/30/91
08/29/91
08/29/91
08/27/91
08/27/91
08/30/91
08/23/91
09/07/91
08/26/91
09/10/91
08/25/91
09/07/91
08/24/91
08/27/91
09/09/91
Specific conductance
(uS/cm)
Injection wells
960
996
943
928
927
Observation wells
5683
5 1,0305876
5 1,050
733
5 1,040
Production wells
5891
53,1105940
5783
663
828
469
808
782
PH (standard
units)
7.6
7.6
7.6
7.6
7.5
8.0
7.3
7.6
7.6
7.8
7.6
7.8
7.8
7.8
7.9
7.9
7.9
7.0
7.9
7.9
Temperature (°C)
31.0
30.9
30.4
30.8
31.1
27.0
25.5
27.0
26.5
26.7
26.5
29.5
27.9
25.9
26.3
27.1
25.3
25.0
28.2
24.2
Dissolved oxygen (mg/L)
5.3
5.6
3.4
4.9
5.1
1.2
2.9
2.6
4.5
1.4
2.8
1.7
.7
5.9
1.9
2.3
4.3
3.8
1.2
5.9
Footnotes at end of table.
Table 9 43
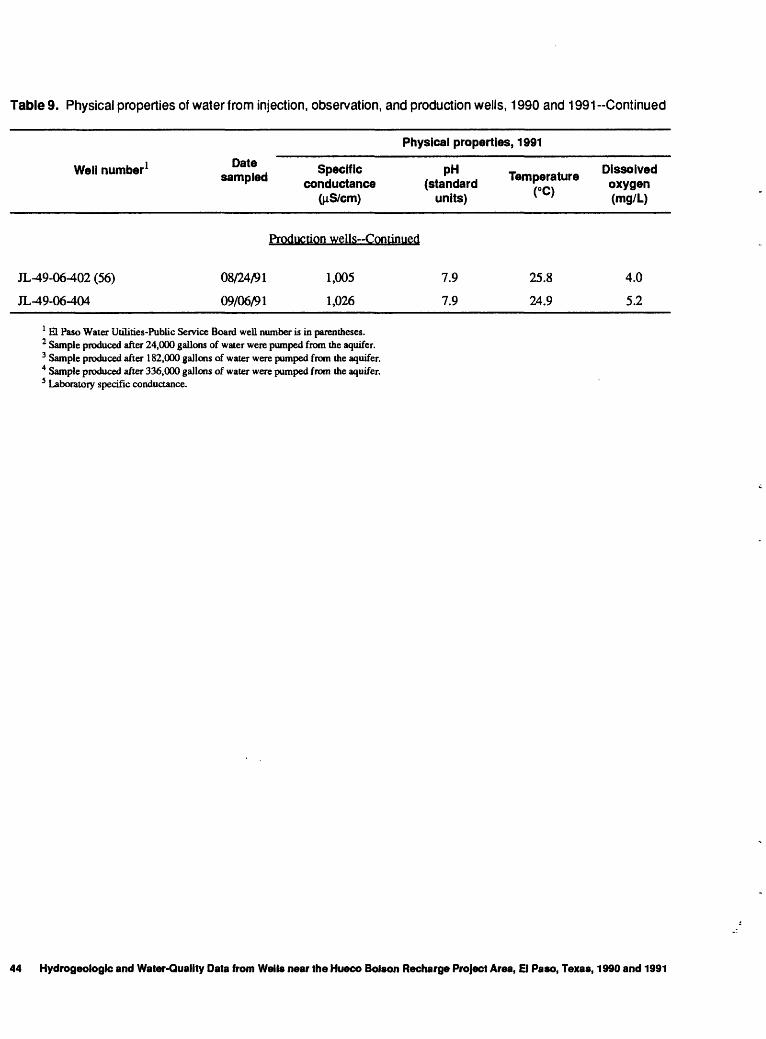
Table 9. Physical properties of water from injection, observation, and production wells, 1990 and 1991-Continued
Physical properties, 1991
We., number' J^,
jL^9-06^t02 (56) 08/24/91
JL^9-06-404 09/06/91
Specific conductance
(liS/cm)
pH (standard
units)
Production wells-Continued
1,005 7.9
1,026 7.9
Temperature
25.8
24.9
Dissolved oxygen (mg/L)
4.0
5.2
1 El Paso Water Utilities-Public Service Board well number is in parentheses.2 Sample produced after 24,000 gallons of water were pumped from the aquifer.3 Sample produced after 182,000 gallons of water were pumped from the aquifer.4 Sample produced after 336,000 gallons of water were pumped from the aquifer.5 Laboratory specific conductance.
44 Hydrogeologic and Water-Quality Data from Wells near the Hueco Bolson Recharge Project Area, El Paso, Texas, 1990 and 1991
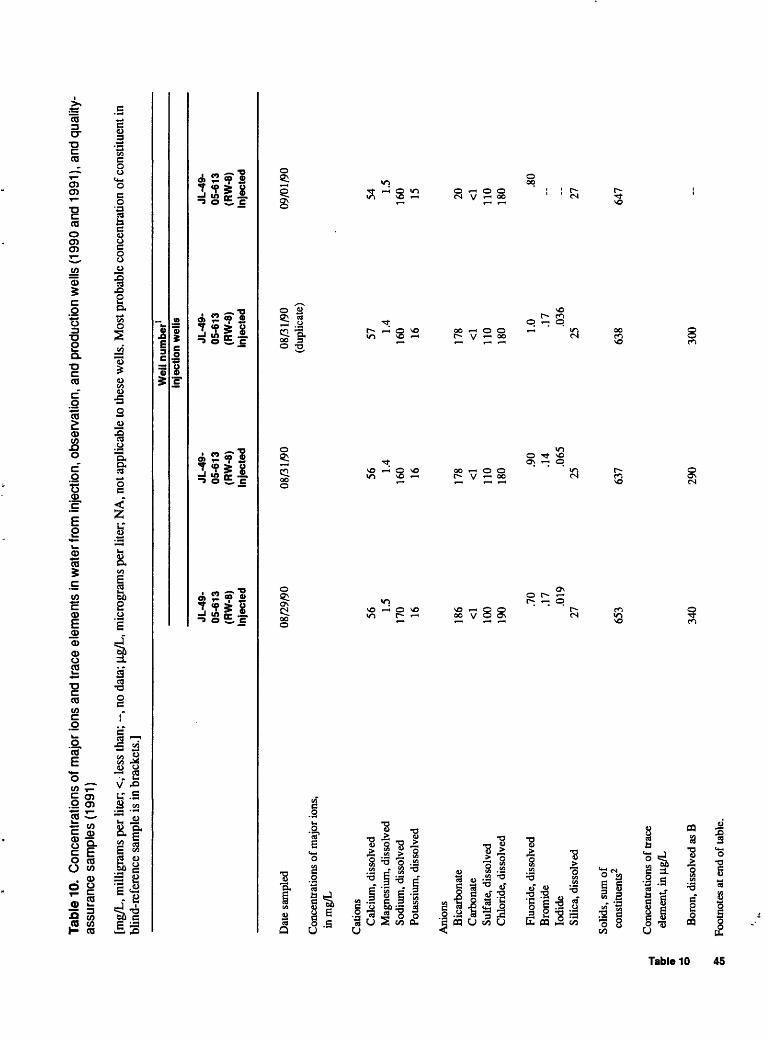
Tabl
e 10
. C
once
ntra
tions
of m
ajor
ions
and
trac
e el
emen
ts in
wat
er fr
om in
ject
ion,
obs
erva
tion,
and
pro
duct
ion
wel
ls (1
990
and
1991
), an
d qu
ality
- as
sura
nce
sam
ples
(19
91)
[mg/
L, m
illig
ram
s pe
r lite
r, <,
less
than
; --,
no d
ata;
u.g
/L, m
icro
gram
s pe
r lite
r; N
A, n
ot a
pplic
able
to th
ese
wel
ls. M
ost p
roba
ble
conc
entra
tion
of co
nstit
uent
in
blin
d-re
fere
nce
sam
ple
is in
bra
cket
s.]
51 or 9 ^
o
Dat
e sa
mpl
ed
Con
cent
ratio
ns o
f maj
or io
ns,
in m
g/L
Cat
ions
Cal
cium
, dis
solv
edM
agne
sium
, dis
solv
edSo
dium
, dis
solv
edPo
tass
ium
, dis
solv
ed
Ani
ons
Bic
arbo
nate
Car
bona
teSu
lfate
, dis
solv
edC
hlor
ide,
dis
solv
ed
Fluo
ride,
dis
solv
edB
rom
ide
Iodi
deSi
lica,
dis
solv
ed
Solid
s, s
um o
fco
nstit
uent
s2
Con
cent
ratio
ns o
f tra
ceel
emen
t, in
(ig/
L
D
T»
JL-4
9-05
-613
(RW
-8)
Inje
cted
08/2
9/90
56 1.5
170 16 186 <1 100
190 .7
0.1
7.0
1927 653
1 A
f\
JL-4
9-05
-613
(RW
-8)
Inje
cted
08/3
1/90
56 1.4
160 16 178 <1 110
180 .9
0.1
4.0
6525 637
r\f
\t\
Wel
l num
ber1
Inje
ctio
n w
ells
JL-4
9-05
-613
(RW
-8)
inje
cted
08/3
1/90
(dup
licat
e)
57 1.4
160 16 178 <1 110
180 1.
0 .17
.036
25 638
inn
JL-4
9-05
-613
(RW
-8)
Inje
cted
09/0
1/90
54 1.5
160 15 20 <1 110
180 .8
0 27 647
Foot
note
s at
end
of t
able
.

I I 8 £ o 09
I I 2. o
o I 23
v 0)
Tabl
e 10
. C
once
ntra
tions
of m
ajor
ions
and
trac
e el
emen
ts in
wat
er fr
om in
ject
ion,
obs
erva
tion,
and
pro
duct
ion
wel
ls (
1990
and
199
1), a
nd q
ualit
y-
assu
ranc
e sa
mpl
es (
1991
)-C
ontin
ued
Wel
l num
ber1
Obs
erva
tion
wel
ls
JL-4
9-
05-6
18
(OB-
5)
Dat
e sa
mpl
ed
08/2
8/90
D
epth
sam
pled
(fee
t N
A
JL-4
9-
05-6
21
(OB
-4A
)
08/2
5/90
43
0
JL-4
9-
05-6
21
(OB
-4A
)
08/2
9/90
64
0
JL-4
9-
05-6
22
(OB-
4B)
08/2
4/90
43
0
JL-4
9-
05-6
22
(OB-
4B)
08/2
9/90
69
0
JL-4
9-
05-6
25
(OB-
7A)
08/2
7/90
43
0
JL-4
9-
05-6
25
(OB-
7A)
08/2
7/90
60
5
JL-4
9-
05-6
26
(OB-
7B)
08/2
7/90
43
0
JL-4
9-
05-6
26
(OB-
7B)
08/2
8/90
60
5
JL-4
9-
06-4
05
(OB-
1)
08/2
8/90
NA
belo
w la
nd s
urfa
ce)
Con
cent
ratio
ns o
f maj
or io
ns,
inm
g/L
Cat
ions
Cal
cium
, dis
solv
ed
Mag
nesi
um, d
isso
lved
So
dium
, dis
solv
ed
Pota
ssiu
m, d
isso
lved
30 6.3
90 6.1
53 11 150 7.
4
51 11 160 7.
4
46 9.3
110 7.
0
46 9.0
110 7.
3
51 13 140 12
50 13 150 13
31 8.2
92 10
32 8.4
94 10
Bor
on, d
isso
lved
as B
Foot
note
s at
end
of t
able
.
8030
029
014
014
026
026
012
012
0
36 8.0
150 7.
1
Ani
ons
Bic
arbo
nate
99
22
0 22
2 12
8 12
8 20
7 20
9 13
9 12
9 19
3 C
arbo
nate
<1
<1
<1
<1
<1
<1
<1
<1
<1
<1
Su
lfate
, dis
solv
ed
29
99
99
65
67
100
99
47
43
82
Chl
orid
e, d
isso
lved
14
0 16
0 16
0 15
0 15
0 17
0 15
0 11
0 12
0 16
0
Fluo
ride,
dis
solv
ed
.40
.40
.40
.40
.40
.20
.30
.60
.60
.40
Bro
mid
e .1
5 .1
9 .2
1 .2
3 .1
2 .21
.2
1 .1
6 .0
3 .2
3Io
dide
.0
14
.029
.0
28
.019
.0
23
.028
.0
30
.024
.0
07
.022
Silic
a, d
isso
lved
33
34
34
35
35
34
34
33
33
34
Solid
s, s
um o
f co
nstit
uent
s2
384
623
632
486
488
622
613
400
405
573
Con
cent
ratio
ns o
f tra
ce
elem
ent,
in \i
g/L
210

Tabl
e 10
. C
once
ntra
tions
of m
ajor
ions
and
trac
e el
emen
ts in
wat
er fr
om in
ject
ion,
obs
erva
tion,
and
pro
duct
ion
wel
ls (1
990
and
1991
), an
d qu
ality
- as
sura
nce
sam
ples
(19
91)-
Con
tinue
d
Wel
l num
ber1
Prod
uctio
n w
ells
JL-4
9-
05-2
04
(41)
Dat
e sa
mpl
ed
08/3
0/90
Con
cent
ratio
ns o
f maj
or io
ns,
inm
g/L
Cat
ions
Cal
cium
, dis
solv
ed
33M
agne
sium
, dis
solv
ed
7.3
Sodi
um, d
isso
lved
13
0Po
tass
ium
, dis
solv
ed
8.5
Ani
ons
Bic
arbo
nate
16
5C
arbo
nate
<1
Sulf
ate,
dis
solv
ed
83C
hlor
ide,
dis
solv
ed
140
Fluo
ride
, dis
solv
ed
.90
Bro
mid
e .1
8Io
dide
.0
26Si
lica,
dis
solv
ed
33
Solid
s, s
um o
fco
nstit
uent
s2
517
JL-4
9-
JL-4
9-
JL-4
9-
JL-4
9-
05-3
01
05-5
01
05-6
01
05-6
02
(42)
(3
1)
(36)
(3
5)
08/2
3/90
08
/23/
90
08/3
0/90
08
/22/
90
29
34
48
150
6.2
14
13
2980
11
0 11
0 22
06.
1 3.
5 11
9.
5
140
215
156
162
<1
<1
<1
<143
68
11
0 19
080
93
13
0 40
0
.70
1.4
.70
.60
.16
.18
.23
.52
.019
.0
18
.065
.0
6133
31
30
35
347
461
530
1,11
4
JL-4
9-
JL-4
9-
JL-4
9-
JL-4
9-
05-6
03
05-6
03
05-6
04
05-6
05
(32)
(3
2)
(34)
(4
4)
08/2
1/90
08
/21/
90
08/2
2/90
09
/01/
90(d
uplic
ate)
28
28
53
527.
8 7.
8 12
10
100
100
100
120
9.0
9.0
7.5
6.6
165
165
103
93<1
<1
<1
<1
66
67
65
2890
89
19
0 24
0
.80
.80
.50
.20
.17
.17
.29
.022
.0
22
.029
33
34
32
32
416
417
511
535
JL-4
9-
05-6
05
(44)
09/0
1/90
(dup
licat
e)
52 10 120 6.
6
93 <1 28 240 .4
0.2
3.0
1731 534
Con
cent
ratio
ns o
f tra
ce§
el
emen
t, in
u.g
/L5 0
B
oron
, dis
solv
ed a
s B
3
Foot
note
s at
end
of t
able
.
110
100
9023
068
012
011
012
080
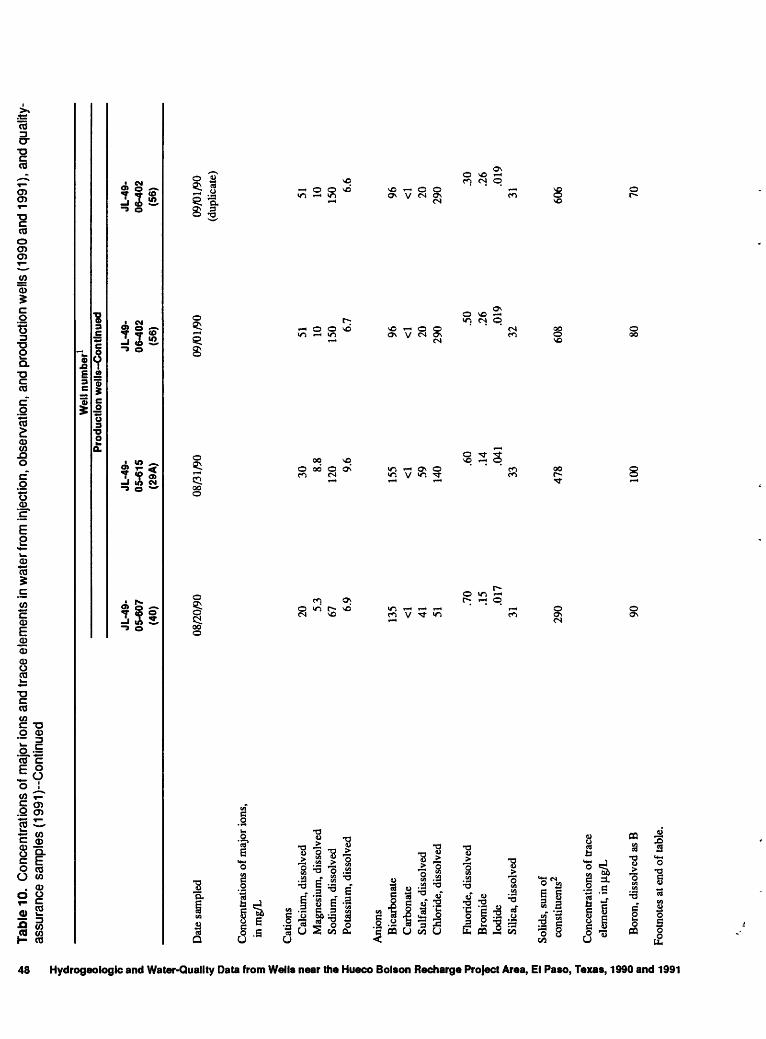
Tabl
e 10
. C
once
ntra
tions
of m
ajor
ions
and
trac
e el
emen
ts in
wat
er fr
om in
ject
ion,
obs
erva
tion,
and
pro
duct
ion
wel
ls (1
990
and
1991
), an
d qu
ality
- as
sura
nce
sam
ples
(19
91)-
Con
tinue
d
I a a 5 00 o_ i 30 I i s -P
m
Dat
e sa
mpl
ed
Con
cent
ratio
ns o
f maj
or io
ns,
inm
g/L
Cat
ions
Cal
cium
, dis
solv
edM
agne
sium
, dis
solv
edSo
dium
, dis
solv
edPo
tass
ium
, dis
solv
ed
Ani
ons
Bic
arbo
nate
Car
bona
teSu
lfate
, dis
solv
edC
hlor
ide,
dis
solv
ed
Fluo
ride,
dis
solv
edB
rom
ide
Iodi
deSi
lica,
dis
solv
ed
Solid
s, su
m o
fco
nstit
uent
s
Wel
l num
ber1
Prod
uctio
n w
ells
-Con
tinue
d
JL-4
9-
JL-4
9-
JL-4
9-
JL-4
9-
05-6
07
05-6
15
06-4
02
06-4
02
(40)
(2
9A)
(56)
(5
6)
08/2
0/90
08
/31/
90
09/0
1/90
09
/01/
90(d
uplic
ate)
20
30
51
515.
3 8.
8 10
10
67
120
150
150
6.9
9.6
6.7
6.6
135
155
96
96<1
<1
<1
<1
41
59
20
2051
14
0 29
0 29
0
.70
.60
.50
.30
.15
.14
.26
.26
.017
.0
41
.019
.0
1931
33
32
31
290
478
608
606
Con
cent
ratio
ns o
f tra
ce
elem
ent,
in
Bor
on, d
isso
lved
as B
Foot
note
s at
end
of t
able
.
9010
080
70

Tabl
e 10
. C
once
ntra
tions
of m
ajor
ions
and
trac
e el
emen
ts in
wat
er fr
om in
ject
ion,
obs
erva
tion,
and
pro
duct
ion
wel
ls (
1990
and
199
1), a
nd q
ualit
y-
assu
ranc
e sa
mpl
es (
1991
)-C
ontin
ued
s- 9
Dat
e sa
mpl
ed
Con
cent
ratio
ns o
f maj
or io
ns,
inm
g/L
Cat
ions
Cal
cium
, dis
solv
edM
agne
sium
, dis
solv
edSo
dium
, dis
solv
edPo
tass
ium
, dis
solv
ed
Ani
ons
Bic
arbo
nate
Car
bona
teSu
lfate
, dis
solv
edC
hlor
ide,
dis
solv
ed
Fluo
ride,
dis
solv
edB
rom
ide
Silic
a, d
isso
lved
JL-4
9-
05-6
13(R
W-8
)1
Inje
cted
08/2
5/91
48 2.3
160 14 203 <1 97 140 .8
0 30
JL-4
9-05
-613
(RW
-8)
inje
cted
08/2
5/91
(dup
licat
e)
471.
715
0 15 203 <1 78 120 .9
0-- 28
JL-4
9-05
-613
(RW
-8)
inje
cted
08/2
5/91
(dup
licat
e)
48 2.0
150 18 203 <1 90 140 1.
0-- 28
Wel
l num
ber1
Inje
ctio
n w
ells
JL-4
9-05
-624
(RW
-7)
inje
cted
08/2
7/91
50 2.2
160 15 204 <1 89 150 .9
0.2
231
JL-4
9-05
-624
(RW
-7)
pum
ped
3
09/0
8/91
52 1.9
150 16
223 <1 97 160 .7
0.2
129
JL-4
9-05
-624
(RW
-7)
pum
ped4
09/0
8/91
51 1.7
150 17 211 <1 81 160 .6
0.2
129
JL-4
9-
05-6
24(R
W-7
) pu
mpe
d5
09/0
8/91
53 2.0
150 17 212 <1 82 160 .7
0.2
129
Solid
s, s
um o
f
Con
cent
ratio
ns o
f tra
ce
elem
ents
, in
|4.g/
L
Alu
min
um, t
otal
as
Al
Bor
on, d
isso
lved
as
B
617
20 280
20 270
20 280
20 270
300
10 280
10 290
Foot
note
s at
end
of t
able
.
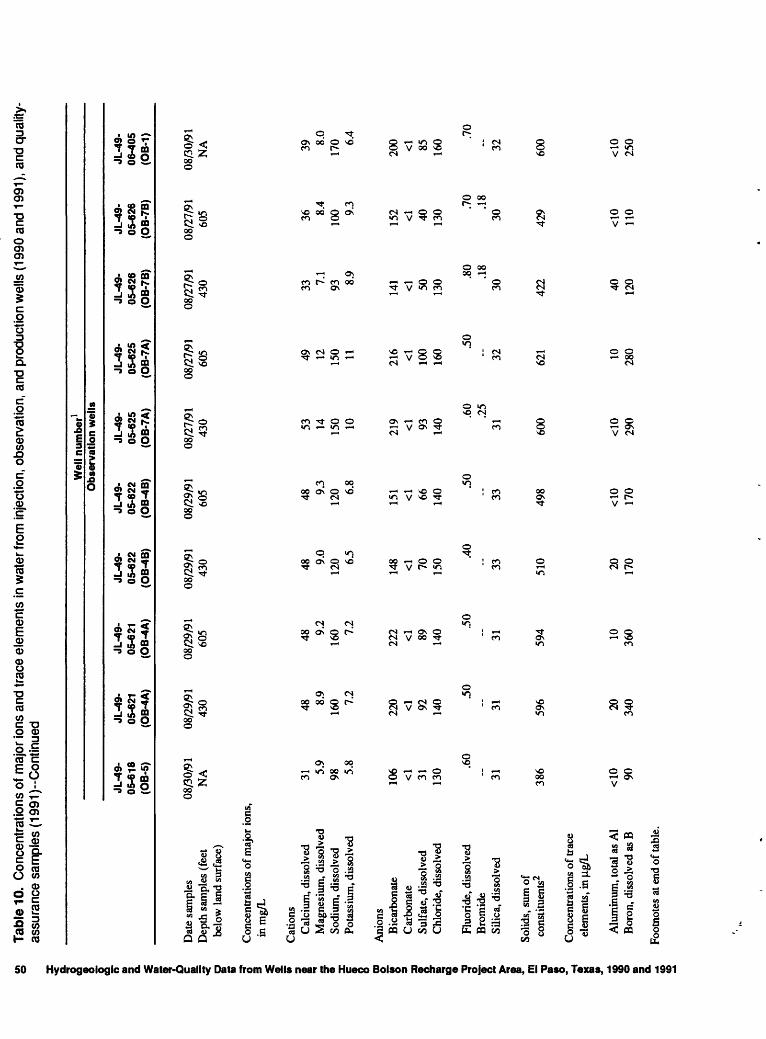
Tabl
e 10
. C
once
ntra
tions
of m
ajor
ions
and
trac
e el
emen
ts in
wat
er fr
om in
ject
ion,
obs
erva
tion,
and
pro
duct
ion
wel
ls (
1990
and
199
1), a
nd q
ualit
y-
assu
ranc
e sa
mpl
es (
1991
)~C
ontin
ued
Wel
l num
ber1
Obs
erva
tion
wel
ls
JL-4
9-
05-6
18
(OB-
5)
Dat
e sa
mpl
es
08/3
0/91
D
epth
sam
ples
(fe
et
NA
JL-4
9-
05-6
21
(OB
-4A
)
08/2
9/91
43
0
JL-4
9-
05-6
21
(OB
-4A
)
08/2
9/91
60
5
JL-4
9-
05-6
22
(OB
-4B
)
08/2
9/91
43
0
JL-4
9-
05-6
22
(OB
-4B
)
08/2
9/91
60
5
JL-4
9-
05-6
25
(OB
-7A
)
08/2
7/91
43
0
JL-4
9-
05-6
25
(OB-
7A)
08/2
7/91
60
5
JL-4
9-
05-6
26
(OB
-7B
)
08/2
7/91
43
0
JL-4
9-
05-6
26
(OB
-7B
)
08/2
7/91
60
5
JL-4
9-
06-4
05
(OB-
1)
08/3
0/91
NA
belo
w la
nd s
urfa
ce)
Con
cent
ratio
ns o
f maj
or io
ns,
inm
g/L
Cat
ions
Cal
cium
, dis
solv
ed
31
Mag
nesi
um, d
isso
lved
5.
9 So
dium
, dis
solv
ed
98
Pota
ssiu
m, d
isso
lved
5.
8
Ani
ons
Bic
arbo
nate
10
6 C
arbo
nate
<1
Su
lfat
e, d
isso
lved
31
C
hlor
ide,
dis
solv
ed
130
Fluo
ride
, dis
solv
ed
.60
Bro
mid
eSi
lica,
dis
solv
ed
31
Solid
s, s
um o
f co
nstit
uent
s238
6
Con
cent
ratio
ns o
f tra
ce
elem
ents
, in
[ig/
L
Alu
min
um, t
otal
as
Al
< 10
B
oron
, dis
solv
ed a
s B
90
48 8.9
160 7.
2
220 <1
92 140 .5
0
31 596 20 340
48 9.2
160 7.
2
222 <1
89 140 .5
0
31 594 10 360
48 9.0
120 6.
5
148 <1
70 150 .4
0
33 510 20 170
48 9.3
120 6.
8
151 <1
66 140 .5
0
33 498
53 14 150 10 219 <1
93 140 .6
0 .2
531 60
0
49 12 150 11 216 <1
100
160 .5
0
170
290
32 621 10 280
33 7.1
93 8.9
141 <1
50 130 .8
0 .1
830 422 40 120
36 8.4
100 9.
3
152 <1
40 130 .7
0 .1
830 429
39 8.0
170 6.
4
200 <1
85 160 .7
0
32 600
110
250
-t
Foot
note
s at
end
of t
able
.

Tabl
e 10
. C
once
ntra
tions
of m
ajor
ions
and
trac
e el
emen
ts in
wat
er fr
om in
ject
ion,
obs
erva
tion,
and
pro
duct
ion
wel
ls (
1990
and
199
1), a
nd q
ualit
y-
assu
ranc
e sa
mpl
es (
1991
)~C
ontin
ued
Wel
l nu
mbe
r1P
rod
uct
ion
wells
JL-4
9-
05-2
04(4
1)
JL-4
9-
05-3
03(5
3)
JL-4
9-
05-6
01(3
6)
JL-4
9-
05-6
02(3
5)
JL-4
9-
05-6
02(3
5)
JL-4
9-
05-6
03(3
2)
JL-4
9-
05-6
05(4
4)
JL-4
9-
05-6
07(4
0)
JL-4
9-
05-6
15(2
9A)
JL-4
9-
06-4
01(5
9)
Dat
e sa
mpl
ed08
/23/
91
09/0
7/91
08
/26/
91
09/1
0/91
Con
cent
ratio
ns o
f maj
or io
ns,
inm
g/L
Cat
ions
Cal
cium
, dis
solv
ed
Mag
nesi
um, d
isso
lved
So
dium
, dis
solv
ed
Pota
ssiu
m, d
isso
lved
Ani
ons
Bic
arbo
nate
C
arbo
nate
Su
lfate
, dis
solv
ed
Chl
orid
e, d
isso
lved
Fluo
ride,
dis
solv
ed
Bro
mid
e Si
lica,
dis
solv
ed
Solid
s, s
um o
f co
nstit
uent
s2
Con
cent
ratio
ns o
f tra
ce
elem
ents
, in
|ig/L
Alu
min
um, t
otal
as
Al
Bor
on, d
isso
lved
as
B
.90
35 517
<10
120
.50
33
1,69
0
<10 80
09/1
0/91
08
/25/
91
(dup
licat
e)09
/07/
9108
/24/
91
08/2
7/91
.70
.60
.60
.80
.50
.80
33 549
31 446
31 434
33 414
32 525
31 298
<10
270
<10
120
.90
33 472
09/0
9/91
34 7.7
130 8.
7
151 86 140
140 26 410 13 67 55 980
54 13 110 12 155
120
130
42 8.2
95 5.8
108 40 170
42 8.2
93 5.8
108 40 160
29 7.8
100 8.
4
168 68 84
52 9.9
110 7.
5
90 29 240
21 5.6
71 6.6
131 44 54
31 7.0
120 8.
9
149 58 140
59 9.6
110 7.
3
88 28 270 .5
0
30 558
120
120
9010
011
080
2
Foot
note
s at
end
of t
able
.

Tabl
e 10
. C
once
ntra
tions
of m
ajor
ions
and
trac
e el
emen
ts in
wat
er fr
om in
ject
ion,
obs
erva
tion,
and
pro
duct
ion
wel
ls (
1990
and
199
1), a
nd q
ualit
y-
assu
ranc
e sa
mpl
es (
1991
)-C
ontin
ued
d 8 5 *S. B i B I O s. ? sf 1 i w 3 8 ? O X A 8 CD 3T s 31 1 £9 CO
0 T3 3
I a > I p H S S1 8 to
Wel
l num
ber1
Prod
uctio
n w
ells
-Con
tinue
d
Dat
e sa
mpl
edD
ate
prep
ared
Con
cent
ratio
ns o
f maj
or io
ns,
inm
g/L
Cat
ions
Cal
cium
, dis
solv
edM
agne
sium
, dis
solv
edSo
dium
, dis
solv
edPo
tass
ium
, dis
solv
ed
Ani
ons
Bic
arbo
nate
Car
bona
teSu
lfate
, dis
solv
edC
hlor
ide,
dis
solv
ed
Fluo
ride,
dis
solv
edB
rom
ide
Silic
a, d
isso
lved
Solid
s, su
m o
fco
nstit
uent
s2
Con
cent
ratio
ns o
f tra
ceel
emen
ts, i
n ng
/L
Alu
min
um, t
otal
as
Al
Bor
on, d
isso
lved
as B
JL-4
9-06
-402
(56)
08/2
4/91
49 9.4
150 6.
2
100 <1 27 260 .6
0« 32 584
<10 90
JL-4
9-06
-402
(56)
08/2
4/91
(dup
licat
e)
48 7.4
140 5.
8
100 <1 28 270 .8
0 30 579
<10 90
JL-4
9-06
-402
(56)
08/2
4/91
(dup
licat
e)
50 8.3
150 5.
8
100 <1 24 240 .7
0 30 558
<10 90
JL-4
9-06
-404
09/0
6/91
80 14 140 7.
8
77 <1 28 360 .5
0 31 699
<10 80
Qua
lity-
assu
ranc
e sa
mpl
es
Blin
d-re
fere
nce
sam
ple
08/2
9/91
35
[33]
17
[16]
43
[44]
2.5
[2.6
]
.. 11
0 [1
04]
32
[29]
1.3
[1.1
] 9.
8 [1
0.2]
_ -. _
Blin
d-re
fere
nce
sam
ple
08/2
9/91
34
[33]
16
[16]
42
[44]
2.6
[2.6
]
.. 96 [
104]
29
[29]
1.2
[1.1
] 9.
8 [1
0.2]
_ _ _
Blin
d-re
fere
nce
sam
ple
09/1
0/91
37
[36]
17
[17]
54
[54]
3.0
[2.6
]
_11
0 [1
04]
45
[43]
1.2
[1.2
] 13
[1
3]
.. .. _
I*
El P
aso
Wat
er U
tiliti
es-P
ublic
Ser
vice
Boa
rd w
ell i
dent
ifica
tion
num
ber i
s in
par
enth
eses
.<8
B
icar
bona
te c
once
ntra
tion
conv
erte
d to
car
bona
te c
once
ntra
tion
for c
ompu
utio
n of
solid
s co
ncen
tratio
n by
div
idin
g by
2.0
3.o
n Q.
<O
Sam
ple
prod
uced
afte
r 24,
000
gallo
ns o
f wat
er w
ere
pum
ped
from
the
aqui
fer.
4 Sa
mpl
e pr
oduc
ed a
fter
182,
000
gallo
ns o
f wat
er w
ere
pum
ped
from
the
aqui
fer.
5 Sam
ple
prod
uced
afte
r 336
,000
gal
lons
of w
ater
wer
e pu
mpe
d fr
om th
e aq
uife
r.

Tabl
e 11
. C
once
ntra
tions
of n
utrie
nts
in w
ater
from
inje
ctio
n, o
bser
vatio
n, a
nd p
rodu
ctio
n w
ells
(19
90 a
nd 1
991)
, and
qua
lity-
assu
ranc
e sa
mpl
es
(199
1)
[mg/
L, m
illig
ram
s pe
r lite
r; <,
less
than
; NA
, not
app
h'ca
ble
to th
ese
wel
ls; -
-, no
dat
a. M
ost p
roba
ble
conc
entra
tion
of c
onst
ituen
t in
blin
d-re
fere
nce
sam
ple
is in
br
acke
ts.]
Wel
l num
ber1
Inje
ctio
n w
ells
JL-4
9-
05-6
13
(RW
-8)
Inje
cted
Dat
e sa
mpl
ed
08#9
/90
Con
cent
ratio
ns o
f nut
rient
s,
in m
g/L
Nitr
ite, d
isso
lved
as
N
<0.0
1
Nitr
ite p
lus n
itrat
e,
2.3
diss
olve
d as
N
Nitr
ogen
, am
mon
ia,
<.01
di
ssol
ved
as N
Nitr
ogen
, am
mon
ia p
lus
.40
orga
nic,
dis
solv
ed a
s N
Phos
phor
us, d
isso
lved
as
P .4
0
Phos
phor
us, d
isso
lved
.4
0 or
thop
hosp
hate
as
P
S1 cr A
JL-4
9-
JL-4
9-
JL-4
9-
05-6
13
05-6
13
05-6
13
(RW
-8)
(RW
-8)
(RW
-8)
inje
cted
In
ject
ed
Inje
cted
08/3
1/90
08
/31/
90
09/0
1/90
(d
uplic
ate)
<0.0
1 <0
.01
<0.0
1
2.8
2.8
2.4
.02
.02
<.01
.40
.30
.40
.38
.38
.41
.38
.35
.40
S Fo
otno
tes
at e
nd o
f tab
le.
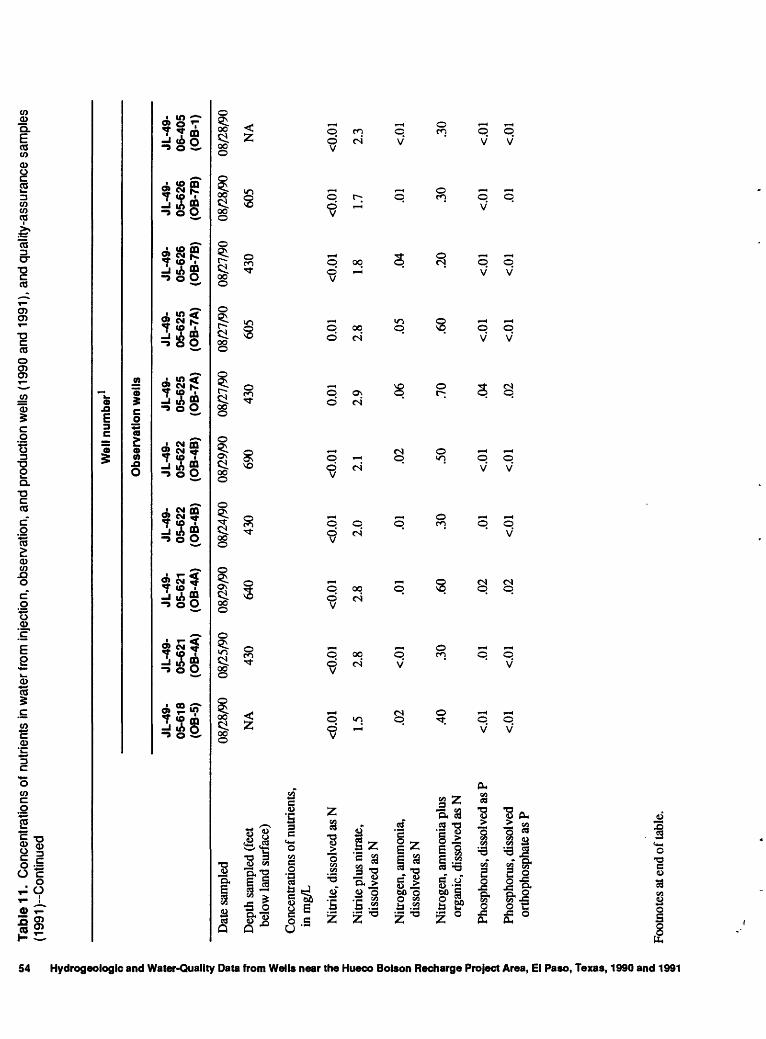
Tabl
e 11
. C
once
ntra
tions
of n
utrie
nts
in w
ater
from
inje
ctio
n, o
bser
vatb
n, a
nd p
rodu
ctio
n w
ells
(19
90 a
nd 1
991)
, and
qua
lity-
assu
ranc
e sa
mpl
es
(199
1)--
Con
tinue
d
Hydrogeologic « i I £ i « » <
< * S? !T
O 3 i «r i 9 X i
Wel
l num
ber1
Dat
e sa
mpl
ed
Dep
th s
ampl
ed (f
eet
belo
w la
nd s
urfa
ce)
Con
cent
ratio
ns o
f nut
rient
s,in
mg/
L
Nitr
ite, d
isso
lved
as
N
Nitr
ite p
lus
nitra
te,
Obs
erva
tion
wel
ls
JL-4
9-05
-618
(OB-
5)
08/2
8/90
NA
<0.0
1
1.5
JL-4
9-05
-621
(OB
-4A
)
08/2
5/90
430
<0.0
1
2.8
JL-4
9-05
-621
(OB
-4A
)
08/2
9/90
640
<0.0
1
2.8
JL-4
9-05
-622
(OB
-4B
)
08/2
4/90
430
<0.0
1
2.0
JL-4
9-05
-622
(OB
-4B
)
08/2
9/90
690
<0.0
1
2.1
JL-4
9-05
-625
(OB
-7A
)
08/2
7/90
430
0.01
2.9
JL-4
9-05
-625
(OB
-7A
)
08/2
7/90
605
0.01
2.8
JL-4
9-05
-626
(OB
-7B
)
08/2
7/90
430
<0.0
1
1.8
JL-4
9-05
-626
(OB
-7B
)
08/2
8/90
605
<0.0
1
1.7
JL-4
9-06
-405
(OB
-1)
08/2
8/90
NA
<0.0
1
2.3
CD I (Q
O ! ED
? 8
diss
olve
d as
N
Nitr
ogen
, am
mon
ia,
.02
<.01
.0
1 .0
1 .0
2 .0
6 .0
5 .0
4 .0
1 <.
01
diss
olve
d as
N
Nitr
ogen
, am
mon
ia p
lus
.40
.30
.60
.30
.50
.70
.60
.20
.30
.30
orga
nic,
dis
solv
ed a
s N
Phos
phor
us, d
isso
lved
as
P <.
01
.01
.02
.01
<.01
.0
4 <.
01
<.01
<.
01
<.01
Phos
phor
us, d
isso
lved
<.
01
<.01
.0
2 <.
01
<.01
.0
2 <.
01
<.01
.0
1 <.
01
orth
opho
spha
te a
s P
. -k Fo
otno
tes
at e
nd o
f tab
le.
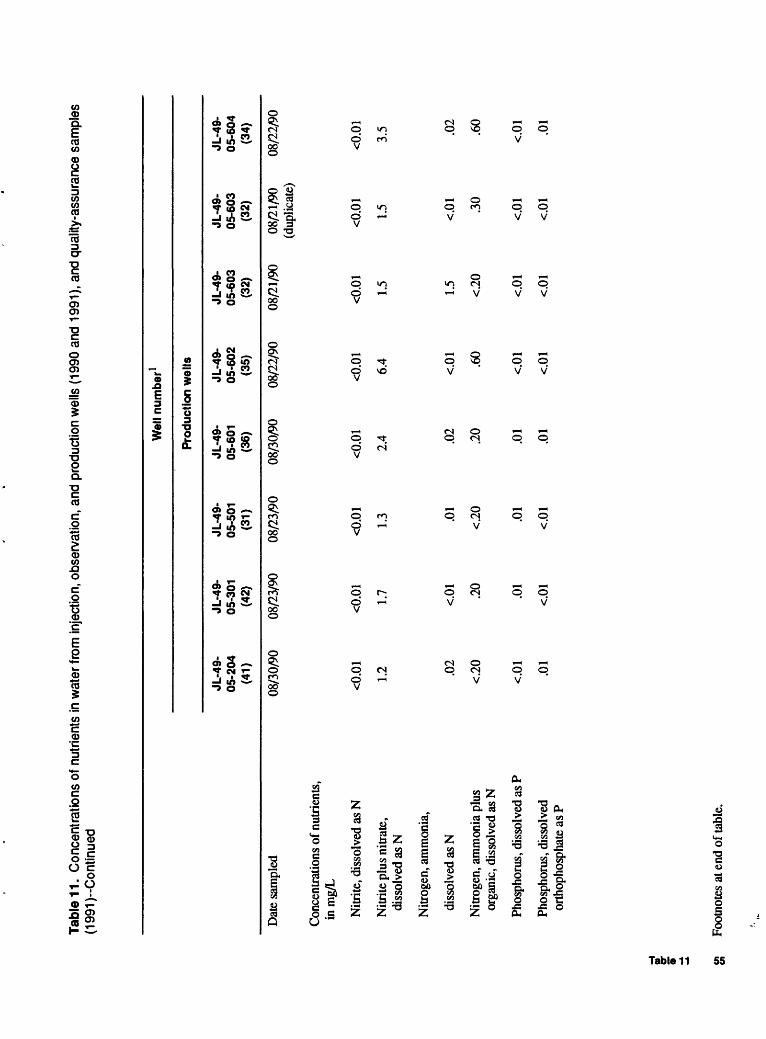
Tabl
e 11
. C
once
ntra
tions
of n
utrie
nts
in w
ater
from
inje
ctio
n, o
bser
vatio
n, a
nd p
rodu
ctio
n w
ells
(19
90 a
nd 1
991)
, and
qua
lity-
assu
ranc
e sa
mpl
es
(199
1)--
Con
tinue
d
Wel
l num
ber1
Prod
uctio
n w
ells
Dat
e sa
mpl
ed
Con
cent
ratio
ns o
f nut
rient
s,
inm
g/L
Nitr
ite, d
isso
lved
as
N
Nitr
ite p
lus
nitra
te,
diss
olve
d as
N
Nitr
ogen
, am
mon
ia,
diss
olve
d as
N
Nitr
ogen
, am
mon
ia p
lus
orga
nic,
dis
solv
ed a
s N
Phos
phor
us, d
isso
lved
as
P
Phos
phor
us, d
isso
lved
JL-4
9-
05-2
04
(41)
08/3
0/90
<0.0
1
1.2 .0
2
<.20
<.01 .0
1
JL-4
9-
JL-4
9-
05-3
01
05-5
01
(42)
(3
1)
08/2
3/90
08
/23/
90
<0.0
1 <0
.01
1.7
1.3
<.01
.0
1
.20
<.20
.01
.01
<.01
<.
01
JL-4
9-
05-6
01
(36)
08/3
0/90
<0.0
1
2.4 .0
2
.20
.01
.01
JL-4
9-
JL-4
9-
JL-4
9-
05-6
02
05-6
03
05-6
03
(35)
(3
2)
(32)
08/2
2/90
08
/21/
90
08/2
1/90
(d
uplic
ate)
<0.0
1 <0
.01
<0.0
1
6.4
1.5
1.5
<.01
1.
5 <.
01
.60
<.20
.3
0
<.01
<.
01
<.01
<.01
<.
01
<.01
JL-4
9-
05-6
04
(34)
08/2
2/90
<0.0
1
3.5 .0
2
.60
<01 .01
orth
opho
spha
te a
s P
Foot
note
s at
end
of t
able
.

Tabl
e 11
. C
once
ntra
tions
of n
utrie
nts
in w
ater
from
inje
ctio
n, o
bser
vatio
n, a
nd p
rodu
ctio
n w
ells
(19
90 a
nd 1
991)
, and
qua
lity-
assu
ranc
e sa
mpl
es
(199
1)-C
ontin
ued
Hydrogeologic 1 1 i S3 s i 1 i o X 00 o 8 3 ! 0
Wel
l num
ber1
Prod
uctio
n w
ells
-Con
tinue
d
Dat
e sa
mpl
ed
Con
cent
ratio
ns o
f nut
rient
s,in
mg/
L
Nitr
ite, d
isso
lved
as N
Nitr
ite p
lus
nitra
te,
diss
olve
d as
N
Nitr
ogen
, am
mon
ia,
diss
olve
d as
N
Nitr
ogen
, am
mon
ia p
lus
. or
gani
c, d
isso
lved
as N
Phos
phor
us, d
isso
lved
as P
JL-4
9-05
-605
(44)
09/0
1/90
<0.0
1
2.0
<.01 .3
0
<.01
JL-4
9-05
-605
(44)
09/0
1/90
(dup
licat
e)
<0.0
1
2.0
<.01 .5
0
.02
JL-4
9-05
-607
(40)
08/2
0/90
<0.0
1
2.1
<.01 .4
0
.02
JL-4
9-05
-615
(29A
)
08/3
1/90
<0.0
1
1.3 .02
.20
<.01
JL-4
9-06
-402
(56)
09/0
1/90
<0.0
1
1.8
<.01 .2
0
.03
JL-4
9-06
-402
(56)
09/0
1/90
(dup
licat
e)
<0.0
1
1.8
<.01 .4
0
<.01
Phos
phor
us, d
isso
lved
or
thop
hosp
hate
as
P
m -L Fo
otno
tes a
t end
of t
able
.<o
<o

Tabl
e 11
. C
once
ntra
tions
of n
utrie
nts
in w
ater
from
inje
ctio
n, o
bser
vatio
n, a
nd p
rodu
ctio
n w
ells
(19
90 a
nd 1
991)
, and
qua
lity-
assu
ranc
e sa
mpl
es
(199
1)--
Con
tinue
d
Dat
e sa
mpl
ed
Con
cent
ratio
ns o
f nut
rient
s,
inm
g/L
Nitr
ite, d
isso
lved
as
N
Nitr
ite p
lus
nitra
te,
diss
olve
d as
N
Nitr
ogen
, am
mon
ia,
diss
olve
d as
N
Nitr
ogen
, am
mon
ia p
lus
orga
nic,
dis
solv
ed a
s N
Phos
phor
us, d
isso
lved
as
P
Phos
phor
us, d
isso
lved
Wel
l num
ber1
Inje
ctio
n w
ells
JL-4
9-
JL-4
9-
JL-4
9-
JL-4
9-
JL-4
9-
JL-4
9-
JL-4
9-
05-6
13
05-6
13
05-6
13
05-6
24
05-6
24
05-6
24
05-6
24
(RW
-8)
(RW
-8)
(RW
-8)
(RW
-7)
(RW
-7)
(RW
-7)
(RW
-7)
Inje
cted
In
ject
ed
Inje
cted
In
ject
ed
pum
ped2
pu
mpe
d3
pum
ped4
08/2
5/91
08
/25/
91
08/2
5/91
08
/27/
91
09/0
8/91
09
/08/
91
09/0
8/91
(d
uplic
ate)
(d
uplic
ate)
<0.0
1 <0
.01
<0.0
1 <0
.01
0.03
<0
.01
<0.0
1
3.3
3.2
3.2
2.4
3.2
3.0
2.8
<.01
<.
01
<.01
<.
01
.02
<.01
<0
1
.50
.20
.40
.60
.50
.40
.50
.75
.71
.73
.72
.61
.62
.62
.75
.74
.72
.73
.59
.58
.58
orth
opho
spha
te a
s P
B o- 2 Fo
otno
tes
at e
nd o
f tab
le.

g Ta
ble
11.
Con
cent
ratio
ns o
f nut
rient
s in
wat
er fr
om in
ject
ion,
obs
erva
tion,
and
pro
duct
ion
wel
ls (
1990
and
199
1), a
nd q
ualit
y-as
sura
nce
sam
ples
(1
991)
--C
ontin
ued
5 & 0 tt g. i 1 c EL 0 0 f 3 i « i a X CD 2. g 3
30 1 5 ID ID ! 3 8 rn
Dat
e sa
mpl
ed
Dep
th s
ampl
ed (f
eet
belo
w la
nd s
urfa
ce)
Con
cent
ratio
ns o
f nut
rient
s,in
mg/
L
Nitr
ite, d
isso
lved
as N
Nitr
ite p
lus
nitra
te,
diss
olve
d as
N
Nitr
ogen
, am
mon
ia,
diss
olve
d as
N
Nitr
ogen
, am
mon
ia p
lus
orga
nic,
dis
solv
ed a
s N
Phos
phor
us, d
isso
lved
as P
Phos
phor
us, d
isso
lved
orth
opho
spha
te a
s P
JL-4
9-05
-618
(OB
-5)
08/3
0/91
NA
<0.0
1
1.6
<.01
<.20
<.01
<.01
JL-4
9-05
-621
(OB
-4A
)
08/2
9/91
430
<0.0
1
3.3
<.01 .3
0
.02
.02
JL-4
9-
JL-4
9-05
-621
05
-622
(OB
-4A
) (O
B-4
B)
08/2
9/91
08
/29/
91
605
430
<0.0
1 <0
.01
3.3
2.2
<.01
<.
01
.30
.50
.01
<.01
<.01
<.
01
Wel
l num
ber1
Obs
erva
tion
wel
ls
JL-4
9-
JL-4
9-05
-622
05
-625
(OB
-4B
) (O
B-7
A)
08/2
9/91
08
/27/
91
605
430
<0.0
1 <0
.01
2.2
3.1
<.01
<.
01
.40
<.20
<.01
.01
<.01
<.
01
JL-4
9-05
-625
(OB
-7A
)
08/2
7/91
605
<0.0
1
3.0
<.01 .4
0
.01 <.01
JL-4
9-
JL-4
9-05
-626
05
-626
(OB
-7B
) (O
B-7
B)
08/2
7/91
08
/27/
91
430
605
<0.0
1 <0
.01
1.7
1.7
.02
<.01
.50
<.20
.02
<.01
.02
<.01
JL-4
9-06
-405
(OB
-1)
08/3
0/91
NA
<0.0
1
2.8
<.01 .4
0
<.01
<.01
^ Fo
otno
tes a
t end
of t
able
.

Tabl
e 11
. C
once
ntra
tions
of n
utrie
nts
in w
ater
from
inje
ctio
n, o
bser
vatio
n, a
nd p
rodu
ctio
n w
ells
(19
90 a
nd 1
991)
, and
qua
lity-
assu
ranc
e sa
mpl
es
(199
1)--
Con
tinue
d
|
Wel
l num
ber1
Pro
duct
ion
wel
ls
JL-4
9-
05-2
04
(41)
JL-4
9-
05-3
03
(53)
JL-4
9-
05-6
01
(36)
JL-4
9-
05-6
02
(35)
JL-4
9-
05-6
02
(35)
JL-4
9-
05-6
03
(32)
JL-4
9-
05-6
05
(44)
JL-4
9-
05-6
07
(40)
JL-4
9-
05-6
15
(29A
)
JL-4
9-
06-4
01
(59)
Dat
e sa
mpl
ed
Con
cent
ratio
ns o
f nut
rient
s,
inm
g/L
Nitr
ite, d
isso
lved
as
N
Nitr
ite p
lus
nitra
te,
diss
olve
d as
N
Nitr
ogen
, am
mon
ia,
diss
olve
d as
N
Nitr
ogen
, am
mon
ia p
lus
orga
nic,
dis
solv
ed a
s N
Phos
phor
us, d
isso
lved
as
P
Phos
phor
us, d
isso
lved
or
thop
hosp
hate
as
P
08/2
3/91
09
/07/
91
08/2
6/91
09
/10/
91
09/1
0/91
08
/25/
91
09/0
7/91
08
/24/
91
08/2
7/91
09
/09/
91(d
uplic
ate)
<0.0
1
1.2 .01
<.20
<0.0
1 .6 .20
.01
0.01
<0
.01
<0.0
1 <0
.01
<0.0
1 <0
.01
0.01
<0
.01
2.6
1.9
1.8
1.5
2.0
2.2
1.3
2.3
.40
.02
.30
.20
.30
.01
.30
.30
.01
.60
.02
.40
<* Fo
otno
tes
at e
nd o
f tab
le.
<D

Tabl
e 11
. C
once
ntra
tions
of n
utrie
nts
in w
ater
from
inje
ctio
n, o
bser
vatio
n, a
nd p
rodu
ctio
n w
ells
(19
90 a
nd 1
991)
, and
qua
lity-
assu
ranc
e sa
mpl
es
M 9
91 ^
-Con
tinue
d(1
991)
--C
ontin
ued
1 ' 1 1 , ! ? _ r" P D
ate
sam
pled
» f D
ate
prep
ared
i : C
once
ntra
tions
of n
utrie
nts,
: in
mg/
Li !
Nitr
ite, d
isso
lved
as N
f : N
itrite
plu
s nitr
ate,
| di
ssol
ved
as N
' N
itrog
en, a
mm
onia
,1
diss
olve
d as
Ni
Nitr
ogen
, am
mon
ia p
lus
orga
nic,
dis
solv
ed a
s N
i Ph
osph
orus
, dis
solv
ed a
s P
i. Ph
osph
orus
, dis
solv
edr
orth
opho
spha
te a
s P
D i
Wel
l num
ber1
Prod
uctio
n w
ells
-Con
tinue
d
JL-4
9-
JL-4
9-
JL-4
9-
,,06
-402
06
-402
06
-402
«r
"7T
"fJ
fi-4
O4
(56)
(5
6)
(56)
0t
>W4
08/2
4/91
08
/24/
91
08/2
4/91
09
/06/
91
(dup
licat
e)
(dup
licat
e)
<0.0
1 <0
.01
<0.0
1 <0
.01
1.8
1.8
1.8
2.0
<.01
<.
01
<.01
<.
01
.30
<.20
<.
20
.30
.01
<.01
<.
01
<.01
<.01
<.
01
<.01
<.
01
Qua
lity-
assu
ranc
e sa
mpl
es
Blin
d-
Blin
d-re
fere
nce
refe
renc
esa
mpl
e sa
mpl
e
08/2
9/91
08
/29/
91
0.06
[0
.06]
0.
06
[0.0
6]
.52
[.58]
.5
3 [.5
8]
.21
[.20]
.2
1 [.2
0]
.50
[.55]
.6
0 [.5
5]
.47
[.49]
.4
8 [.4
9]
.34
[.36]
.3
3 [.3
6]
Blin
d-re
fere
nce
sam
ple
09/1
0/91
0.20
[0
.20]
.88
[.97]
.50
[.50]
.90
[.82]
.58
[.62]
.47
[.48]
I E
l Pas
o W
ater
Util
ities
-Pub
lic S
ervi
ce B
oard
wel
l ide
ntif
icat
ion
num
ber i
s in
par
enth
eses
.!
2 Sa
mpl
e pr
oduc
ed a
fter
24,
000
gallo
ns o
f wat
er w
ere
pum
ped
from
the
aqui
fer.
3 Sa
mpl
e pr
oduc
ed a
fter
182
,000
gal
lons
of w
ater
wer
e pu
mpe
d fr
om th
e aq
uife
r.1
4 Sa
mpl
e pr
oduc
ed a
fter
336
,000
gal
lons
of
wat
er w
ere
pum
ped
from
the
aqui
fer.
i > * > > i i

« _* M
Tabl
e 12
. C
once
ntra
tions
of s
elec
ted
cons
titue
nts
in w
ater
from
inje
ctio
n, o
bser
vatio
n, a
nd p
rodu
ctio
n w
ells
as
dete
rmin
ed u
sing
fiel
d co
lorim
etric
m
etho
ds,
1990
and
199
1
[mg/
L, m
illig
ram
s per
lite
r; <,
less
than
; --,
no d
ata;
u,g
/L, m
icro
gram
s per
lite
r; N
A, n
ot a
pplic
able
to th
ese w
ells]
JL-4
9-
05-6
13
(RW
-8)
inje
cted
Wel
l num
ber
Inje
ctio
n w
ells
JL-4
9-
05-6
13
(RW
-8)
Inje
cted
JL-4
9-
05-6
13
(RW
-8)
inje
cted
Dat
e sa
mpl
ed
Con
cent
ratio
ns, i
n m
g/L
Chl
orin
e, fr
ee, t
otal
as
Cl2
Nitr
ate,
tota
l as N
Nitr
ite, t
otal
as N
Nitr
ogen
, am
mon
ia,
tota
l as N
Con
cent
ratio
ns, i
n u.
g/L
Iron,
tota
l as F
e
Iron,
ferr
ous
as F
e
08/2
9/90
0.05
1.6 .04
20 10
08/3
1/90
0.08
2.5 .0
4
40
09/0
1/90
0.02
2.8 .0
1
20
2 Fo
otno
tes
at e
nd o
f tab
le.

Ir I I m 21
Tabl
e 12
. C
once
ntra
tions
of s
elec
ted
cons
titue
nts
in w
ater
from
inje
ctio
n, o
bser
vatio
n, a
nd p
rodu
ctio
n w
ells
as
dete
rmin
ed u
sing
fiel
d co
lorim
etric
m
etho
ds,
1990
and
199
1--C
ontin
ued
Irogeologic 0 3. 1 O c SL 1 B jf 3 | 3 i ? o X i 00 9. w o 3
3D
Wel
l num
ber1
Obs
erva
tion
wel
ls
Dat
e sa
mpl
ed
Dep
th s
ampl
ed (
feet
belo
w la
nd s
urfa
ce)
Con
cent
ratio
ns, i
n m
g/L
Chl
orin
e, fr
ee, t
otal
as
Cl2
Nitr
ate,
tota
l as
N
Nitr
ite, t
otal
as
N
Nitr
ogen
, am
mon
ia,
tota
l as
N
JL-4
9-05
-618
(OB
-5)
08/2
8/90
NA 0.01 1.3 .0
3
<.01
JL-4
9-05
-621
(OB
-4A
)
08/2
5/90
430
<0.0
1
2.4 .0
4
<.01
JL-4
9-05
-621
(OB
-4A
)
08/2
9/90
640
0.03
2.4 .0
9
<.01
JL-4
9-05
-622
(OB
-4B
)
08/2
4/90
430
0.05
2.1 .0
4
<.01
JL-4
9-05
-622
(OB
-4B
)
08/2
9/90
690
0.07
1.9 .0
2
<.01
JL-4
9-05
-625
(OB
-7A
)
08/2
7/90
430
0.04
2.6 .0
5
<.01
JL-4
9-05
-625
(OB
-7A
)
08/2
7/90
605
0.02
2.3 .0
9
<.01
JL-4
9-05
-626
(OB
-7B
)
08/2
7/90
430
0.04
2.6 .0
5
<.01
JL-4
9-05
-626
(OB
-7B
)
08/2
8/90
605
0.04 1.3 .0
8
<.01
JL-4
9-06
-405
(OB
-1)
08/2
8/90
NA 0.08 1.9 .0
7
<.01
Con
cent
ratio
ns, i
n u,
g/L
Iron
, tot
al a
s Fe
Iron
, fer
rous
as
Fe
20
<10
100 30
30
<10
20 30
20 20
30 10
20 30
30 10
20 20
70 30
-L Fo
otno
tes a
t end
of t
able
.(O to
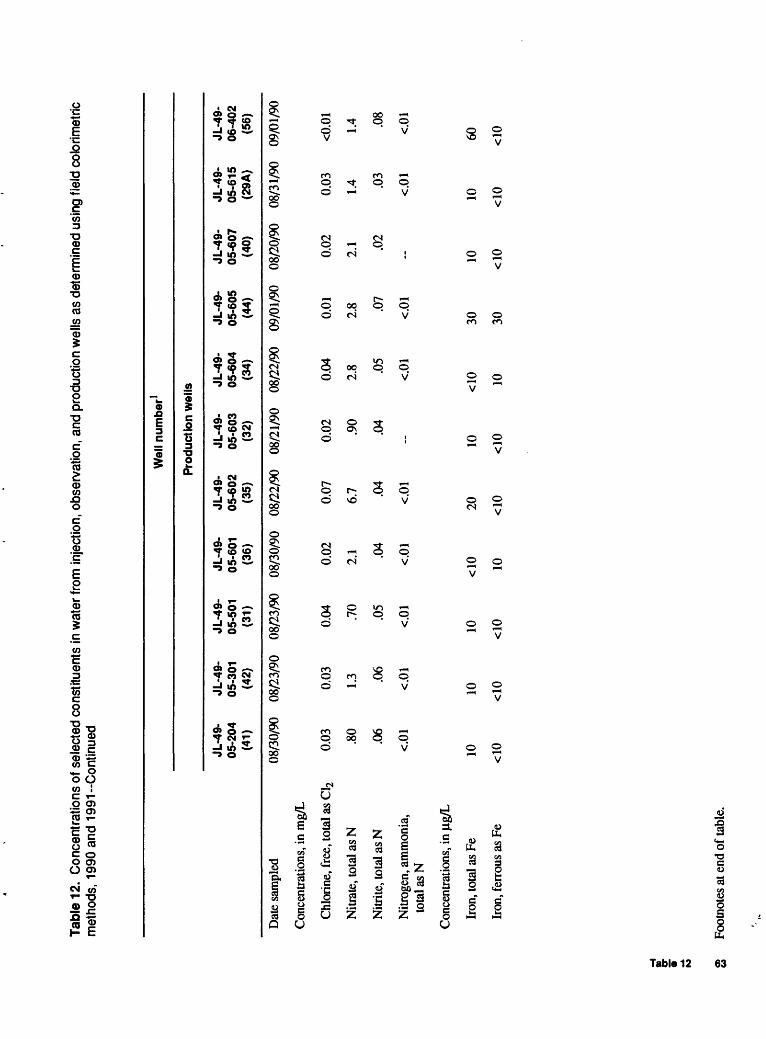
Tabl
e 12
. C
once
ntra
tions
of s
elec
ted
cons
titue
nts
in w
ater
from
inje
ctio
n, o
bser
vatio
n, a
nd p
rodu
ctio
n w
ells
as
dete
rmin
ed u
sing
fiel
d co
brim
etric
m
etho
ds,
1990
and
199
1--C
ontin
ued
Dat
e sa
mpl
ed
Con
cent
ratio
ns, i
n m
g/L
Chl
orin
e, f
ree,
tota
l as
Cl2
Nitr
ate,
tota
l as
N
Nitr
ite, t
otal
as
N
Nitr
ogen
, am
mon
ia,
tota
l as
N
Con
cent
ratio
ns, i
n u,
g/L
Iron
, tot
al a
s Fe
Iron
, fer
rous
as
Fe
Wel
l num
ber1
Prod
uctio
n w
ells
JL-4
9-
JL-4
9-
JL-4
9-
JL-4
9-
JL-4
9-
JL-4
9-
JL-4
9-
JL-4
9-
05-2
04
05-3
01
05-5
01
05-6
01
05-6
02
05-6
03
05-6
04
05-6
05
(41)
(4
2)
(31)
(3
6)
(35)
(3
2)
(34)
(4
4)
08/3
0/90
08
/23/
90
08/2
3/90
08
/30/
90
08/2
2/90
08
/21/
90
08/2
2/90
09
/01/
90
0.03
0.
03
0.04
0.
02
0.07
0.
02
0.04
0.
01
.80
1.3
.70
2.1
6.7
.90
2.8
2.8
.06
.06
.05
.04
.04
.04
.05
.07
<m
<m
<.oi
<.o.
<.oi
- <.0
! <.o
i
10
10
10
<10
20
10
<10
30
<10
<10
<10
10
<10
<10
10
30
JL-4
9-
05-6
07
(40)
08/2
0/90
0.02
2.1 .0
2
- 10 <10
JL-4
9-
05-6
15
(29A
)
08/3
1/90
0.03 1.4 .0
3
<.01
10 <10
JL-4
9-
06-4
02
(56)
09/0
1/90
<0.0
1
1.4 .08
<.01
60 <10
8 Fo
otno
tes
at e
nd o
f tab
le.
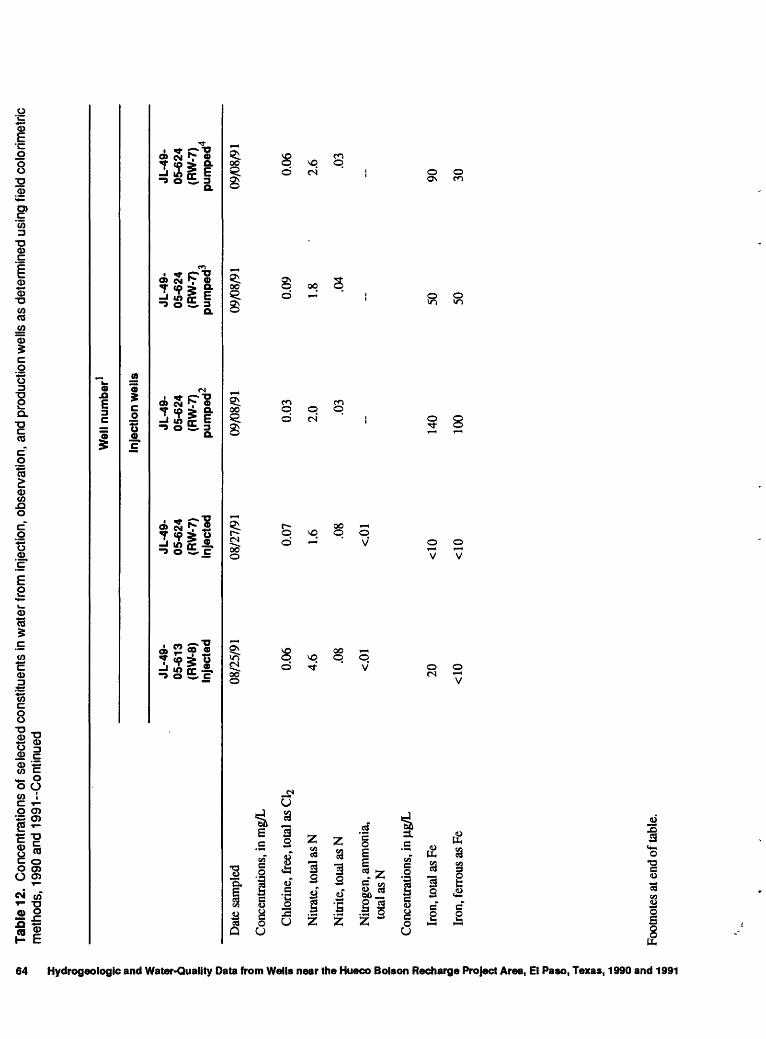
I m 2?
Tabl
e 12
. C
once
ntra
tions
of s
elec
ted
cons
titue
nts
in w
ater
from
inje
ctio
n, o
bser
vatio
n, a
nd p
rodu
ctio
n w
ells
as
dete
rmin
ed u
sing
fiel
d co
lorim
etric
m
etho
ds,
1990
and
199
1-C
ontin
ued
1 I s 0 B 1 5 | S? s i i sr 3 S i X § o
2. 0 s 30 1
Dat
e sa
mpl
ed
Con
cent
ratio
ns, i
n m
g/L
Chl
orin
e, f
ree,
tota
l as
C12
Nitr
ate,
tota
l as
N
Nitr
ite, t
otal
as
N
Nitr
ogen
, am
mon
ia,
tota
l as
N
Con
cent
ratio
ns, i
n u.
g/L
Iron
, tot
al a
s Fe
JL-4
9-05
-613
(RW
-8)
Inje
cted
08/2
5/91
0.06
4.6 .0
8
<.01
20
JL-4
9-05
-624
(RW
-7)
inje
cted
08/2
7/91
0.07
1.6 .08
<.01
<10
Wel
l num
ber1
Inje
ctio
n w
ells
JL-4
9-05
-624
(RW
-7)
pum
ped
2
09/0
8/91
0.03
2.0 .0
3
140
JL-4
9-05
-624
(RW
-7)
pum
ped3
09/0
8/91
0.09
1.8 .0
4
50
JL-4
9-05
-624
(RW
-7)
pum
ped4
09/0
8/91
0.06
2.6 .0
3
90
Iron
, fer
rous
as
Fe10
050
30
J
Foot
note
s at
end
of t
able
.<o

Tabl
e 12
. C
once
ntra
tions
of s
elec
ted
cons
titue
nts
in w
ater
from
inje
ctio
n, o
bser
vatio
n, a
nd p
rodu
ctio
n w
ells
as
dete
rmin
ed u
sing
fiel
d co
lorim
etric
m
etho
ds,
1990
and
199
1-C
ontin
ued
Dat
e sa
mpl
ed
Dep
th s
ampl
ed (
feet
be
low
land
sur
face
)
Con
cent
ratio
ns, i
n m
g/L
Chl
orin
e, fr
ee, t
otal
as
C12
Nitr
ate,
tota
l as N
Nitr
ite, t
otal
as N
Nitr
ogen
, am
mon
ia,
tota
l as
N
Con
cent
ratio
ns, i
n u,
g/L
Iron
, tot
al a
s Fe
Iron
, fer
rous
as
Fe
S1 cr 0
Wel
l num
ber1
Obs
erva
tion
wel
ls
JL-4
9-
JL-4
9-
JL-4
9-
JL-4
9-
JL-4
9-
JL-4
9-
05-6
18
05-6
21
05-6
21
05-6
22
05-6
22
05-6
25
(OB
-5)
(OB
-4A
) (O
B-4
A)
(OB
-4B
) (O
B-4
B)
(OB
-7A
)
08/3
0/91
08
/29/
91
08/2
9/91
08
/29/
91
08/2
9/91
08
/27/
91
NA
43
0 60
5 43
0 60
5 43
0
0.05
0.
16
0.04
0.
11
0.07
0.
08
1.5
4.4
-- 2.
2 --
2.7
.04
.09
.05
.07
.04
.01
<.01
--
<.01
20
10
30
20
<10
20
<10
<10
<10
10
10
10
JL-4
9-
JL-4
9-
JL-4
9-
JL-4
9-
05-6
25
05-6
26
05-6
26
06-4
05
(OB
-7A
) (O
B-7
B)
(OB
-7B
) (O
B-1
)
08/2
7/91
08
/27/
91
08/2
7/91
08
/30/
91
605
430
605
NA
0.07
--
-- 0.
15
2.7
1.5
1.3
4.1
.01
.07
.06
.05
<.01
<.
01
<.01
40
10
30
20
10
10
30
<10
Foot
note
s at
end
of t
able
.
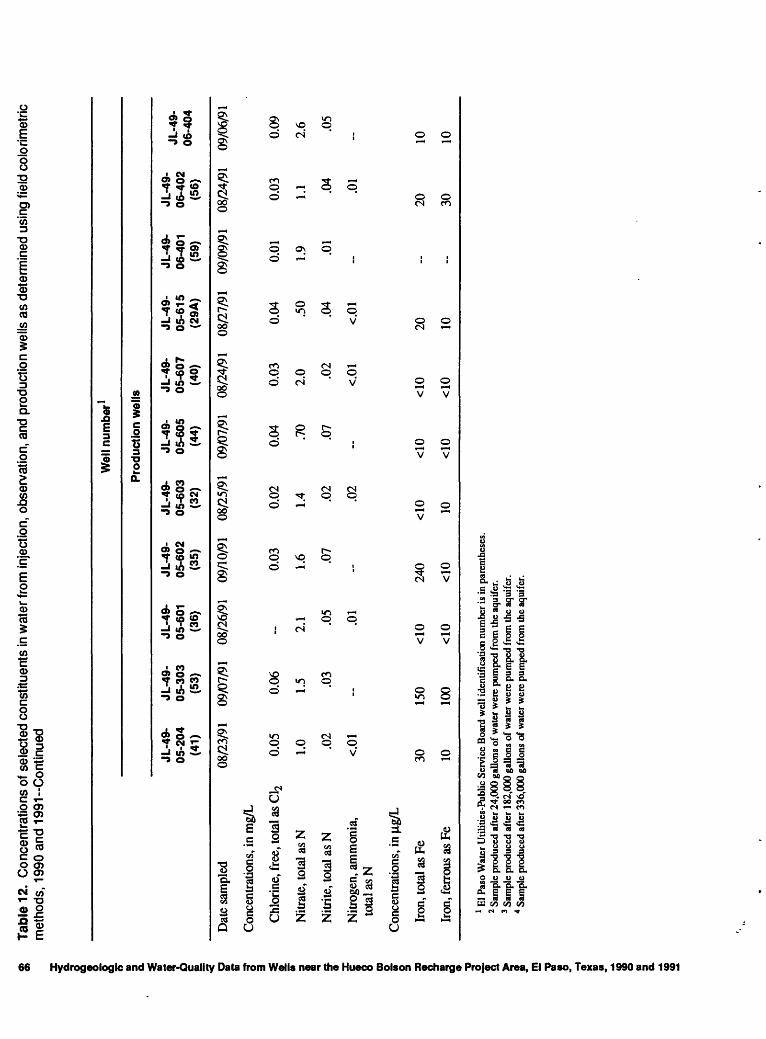
I m
Tabl
e 12
. C
once
ntra
tions
of s
elec
ted
cons
titue
nts
in w
ater
from
inje
ctio
n, o
bser
vatio
n, a
nd p
rodu
ctio
n w
ells
as
dete
rmin
ed u
sing
fiel
d co
lorim
etric
m
etho
ds,
1990
and
199
1-C
ontin
ued
Hydrogeologic
01 1 1 O 01 o? |f 3 £ 83 X §c CD O « s a
? § 01 (3 <D
Wel
l num
ber1
Prod
uctio
n w
ells
Dat
e sa
mpl
ed
Con
cent
ratio
ns, i
n m
g/L
Chl
orin
e, fr
ee, t
otal
as
C12
Nitr
ate,
tota
l as
N
Nitr
ite, t
otal
as
N
Nitr
ogen
, am
mon
ia,
tota
l as
N
Con
cent
ratio
ns, i
n u.
g/L
Iron
, tot
al a
s Fe
Iron
, fer
rous
as
Fe
JL-4
9-05
-204
(41)
08/2
3/91
0.05
1.0 .02
<.01
30 10
JL-4
9-05
-303
(53)
09/0
7/91
0.06
1.5 .0
3
150
100
JL-4
9-05
-601
(36)
08/2
6/91
2.1 .0
5
.01
<10
<10
JL-4
9-05
-602
(35)
09/1
0/91
0.03
1.6 .0
7
240
<10
JL-4
9-05
-603
(32)
08/2
5/91
0.02
1.4 .0
2
.02
<10 10
JL-4
9-05
-605
(44)
09/0
7/91
0.04 .7
0
.07
<10
<10
JL-4
9-05
-607
(40)
08/2
4/91
0.03
2.0 .0
2
<.01
<10
<10
JL-4
9-05
-615
(29A
)
08/2
7/91
0.04 .5
0
.04
<.01
20 10
JL-4
9-06
-401
(59)
09/0
9/91
0.01
1.9 .01
~ -
JL-4
9-06
-402
(56)
08/2
4/91
0.03
1.1 .0
4
.01
20 30
JL-4
9-
09/0
6/91
0.09
2.6 .0
5
10 10
1 E
l Pas
o W
ater
Util
ities
-Pub
lic S
ervi
ce B
oard
wel
l ide
ntif
icat
ion
num
ber
is in
par
enth
eses
.2
Sam
ple
prod
uced
aft
er 2
4,00
0 ga
llons
of
wat
er w
ere
pum
ped
from
the
aqui
fer.
3 Sa
mpl
e pr
oduc
ed a
fter
182
,000
gal
lons
of
wat
er w
ere
pum
ped
from
the
aqui
fer.
4 Sa
mpl
e pr
oduc
ed a
fter
336
,000
gal
lons
of
wat
er w
ere
pum
ped
from
the
aqui
fer.
01 a. to
2
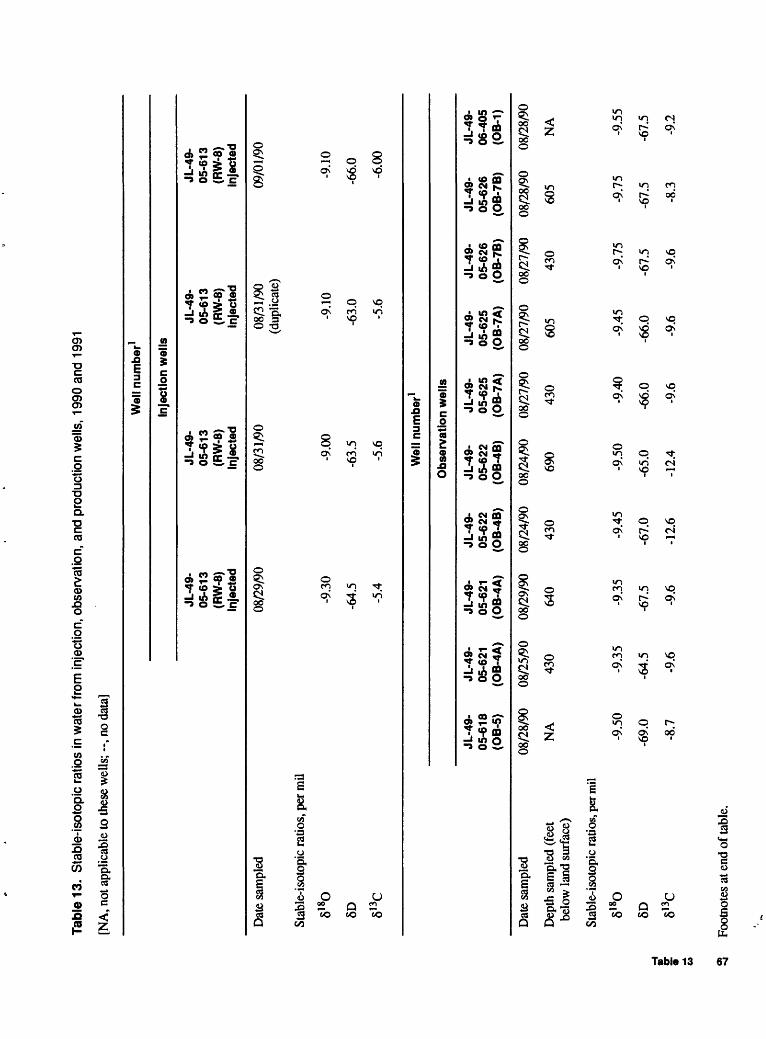
Tabl
e 13
. S
tabl
e-is
otop
ic ra
tios
in w
ater
from
inje
ctio
n, o
bser
vatio
n, a
nd p
rodu
ctio
n w
ells
, 19
90 a
nd 1
991
[NA
, not
app
licab
le to
thes
e w
ells
; --,
no d
ata]
Wel
l num
ber1
Inje
ctio
n w
ells
Dat
e sa
mpl
ed
Stab
le-is
otop
ic r
atio
s, p
er m
il
8180
8D 813C
JL-4
9-
05-6
13
(RW
-8)
inje
cted
08/2
9/90
-9.3
0
-64.
5
-5.4
JL-4
9-
05-6
13
(RW
-8)
inje
cted
08/3
1/90
-9.0
0
-63.
5
-5.6
JL-4
9-
05-6
13
(RW
-8)
inje
cted
08/3
1/90
(d
uplic
ate)
-9.1
0
-63.
0
-5.6
JL-4
9-
05-6
13
(RW
-8)
inje
cted
09/0
1/90
-9.1
0
-66.
0
-6.0
0
Wel
i num
ber1
Obs
erva
tion
wel
ls
JL-4
9-
05-6
18
(OB
-5)
Dat
e sa
mpl
ed
08/2
8/90
Dep
th s
ampl
ed (
feet
N
A
belo
w la
nd s
urfa
ce)
Stab
le-is
otop
ic ra
tios,
per m
il
818O
-9
.50
8D
-69.
051
2
813C
-8
.7_i w
JL-4
9-
JL-4
9-
JL-4
9-
05-6
21
05-6
21
05-6
22
(OB
-4A
) (O
B-4
A)
(OB
-4B
)
08/2
5/90
08
/29/
90
08/2
4/90
430
640
430
-9.3
5 -9
.35
-9.4
5
-64.
5 -6
7.5
-67.
0
-9.6
-9
.6
-12.
6
JL-4
9-
JL-4
9-
05-6
22
05-6
25
(OB
-4B
) (O
B-7
A)
08/2
4/90
08
/27/
90
690
430
-9.5
0 -9
.40
-65.
0 -6
6.0
-12.
4 -9
.6
JL-4
9-
JL-4
9-
05-6
25
05-6
26
(OB
-7A
) (O
B-7
B)
08/2
7/90
08
/27/
90
605
430
-9.4
5 -9
.75
-66.
0 -6
7.5
-9.6
-9
.6
JL-4
9-
JL-4
9-
05-6
26
06-4
05
(OB
-7B
) (O
B-1
)
08/2
8/90
08
/28/
90
605
NA
-9.7
5 -9
.55
-67.
5 -6
7.5
-8.3
-9
.2
Foot
note
s at
end
of t
able
.
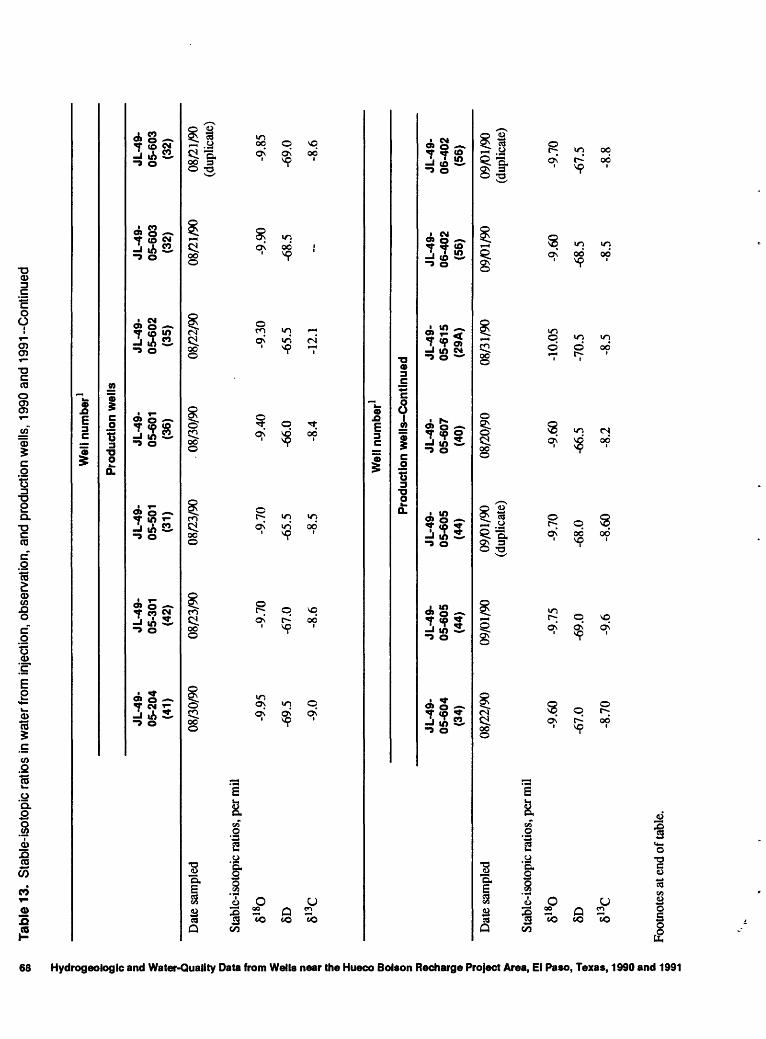
Tabl
e 13
. S
tabl
e-is
otop
ic r
atio
s in
wat
er fr
om in
ject
ion,
obs
erva
tion,
and
pro
duct
ion
wel
ls,
1990
and
199
1-C
ontin
ued
1 & g s 0 tt a S5 IB » s s? tt ? 1 s 2.
w i f X o 2. > § I 1 CO o 1 f s m i 51 X » i o tt a.
Wel
l num
ber1
Prod
uctio
n w
ells
Dat
e sa
mpl
ed
Stab
le-is
otop
ic ra
tios,
per m
il81
80
8D 813C
JL-4
9-05
-204
(41)
08/3
0/90
-9.9
5
-69.
5
-9.0
JL-4
9-05
-301
(42)
08/2
3/90
-9.7
0
-67.
0
-8.6
JL-4
9-05
-501
(31)
08/2
3/90
-9.7
0
-65.
5
-8.5
JL-4
9-05
-601
(36)
. 08/
30/9
0
-9.4
0
-66.
0
-8.4
Wel
l num
ber1
JL-4
9-05
-602
(35)
08/2
2/90
-9.3
0
-65.
5
-12.
1
JL-4
9-05
-603
(32)
08/2
1/90
-9.9
0
-68.
5
~
JL-4
9-05
-603
(32)
08/2
1/90
(dup
licat
e)
-9.8
5
-69.
0
-8.6
Prod
uctio
n w
ells
-Con
tinue
d
Dat
e sa
mpl
ed
Stab
le-is
otop
ic ra
tios,
per m
il81
80
8D 813C
JL-4
9-05
-604
(34)
08/2
2/90
-9.6
0
-67.
0
-8.7
0
JL-4
9-05
-605
(44)
09/0
1/90
-9.7
5
-69.
0
-9.6
JL-4
9-05
-605
(44)
09/0
1/90
(dup
licat
e)
-9.7
0
-68.
0
-8.6
0
JL-4
9-05
-607
(40)
08/2
0/90
-9.6
0
-66.
5
-8.2
JL-4
9-05
-615
(29A
)
08/3
1/90
-10.
05
-70.
5
-8.5
JL-4
9-06
-402
(56)
09/0
1/90
-9.6
0
-68.
5
-8.5
JL-4
9-06
-402
(56)
09/0
1/90
(dup
licat
e)
-9.7
0
-67.
5
-8.8

Tabl
e 13
. S
tabl
e-is
otop
ic ra
tios
in w
ater
from
inje
ctio
n, o
bser
vatio
n, a
nd p
rodu
ctio
n w
ells
, 19
90 a
nd 1
991-
Con
tinue
d
Dat
e sa
mpl
ed
Stab
le-is
otop
ic r
atio
s, p
er m
il
6180
6D
Dat
e sa
mpl
ed
Dep
th s
ampl
ed (
feet
belo
w la
nd s
urfa
ce)
Stab
le-is
otop
ic r
atio
s, p
er m
il
8180
6D51 tr <B
JL-4
9-05
-613
(RW
-8)
inje
cted
08/2
5/91
-9.3
5
-65.
0
JL-4
9-
JL-4
9-05
-618
05
-621
(OB
-5)
(OB
-4A
)
08/3
0/91
08
/29/
91
NA
43
0
-9.7
5 -9
.20
-67.
5 -6
4.5
JL-4
9-05
-613
(RW
-8)
inje
cted
08/2
5/91
(dup
licat
e)
-9.3
0
-65.
0 JL-4
9-05
-621
(OB
-4A
)
08/2
9/91
605
-9.2
0
-65.
5
JL-4
9-05
-613
(RW
-8)
Inje
cted
08/2
5/91
(dup
licat
e)
-9.3
0
65.0
JL-4
9-05
-622
(OB
-4B
)
08/2
9/91
430
-9.4
5
-67.
0
Wel
l num
ber1
Inje
ctio
n w
ells
JL-4
9-05
-624
(RW
-7)
inje
cted
08/2
7/91
-9.3
5
-65.
5
Wel
l num
ber1
Obs
erva
tion
wel
ls
JL-4
9-
JL-4
9-05
-622
05
-625
(OB
-4B
) (O
B-7
A)
08/2
9/91
08
/27/
91
605
430
-9.5
0 -9
.30
-66.
5 -6
5.0
JL-4
9-05
-624
(RW
-7)
pum
ped2
09/0
8/91
-9.2
5
-65.
5
JL-4
9-05
-625
(OB
-7A
)
08/2
7/91
605
-9.1
0
-64.
5
JL-4
9-05
-624
(RW
-7)
pum
ped3
09/0
8/91
-9.0
5
-65.
0
JL-4
9-
JL-4
9-05
-626
05
-626
(OB
-7B
) (O
B-7
B)
08/2
7/91
08
/27/
91
430
605
-9.7
0 -9
.65
-67.
5 -6
8.0
JL-4
9-05
-624
(RW
-7)
pum
ped4
09/0
8/91
-9.2
5
-66.
0 JL-4
9-06
-405
(OB
-1)
08/3
0/91
NA
-9.4
0
-66.
0
g Fo
otno
tes
at e
nd o
f tab
le.
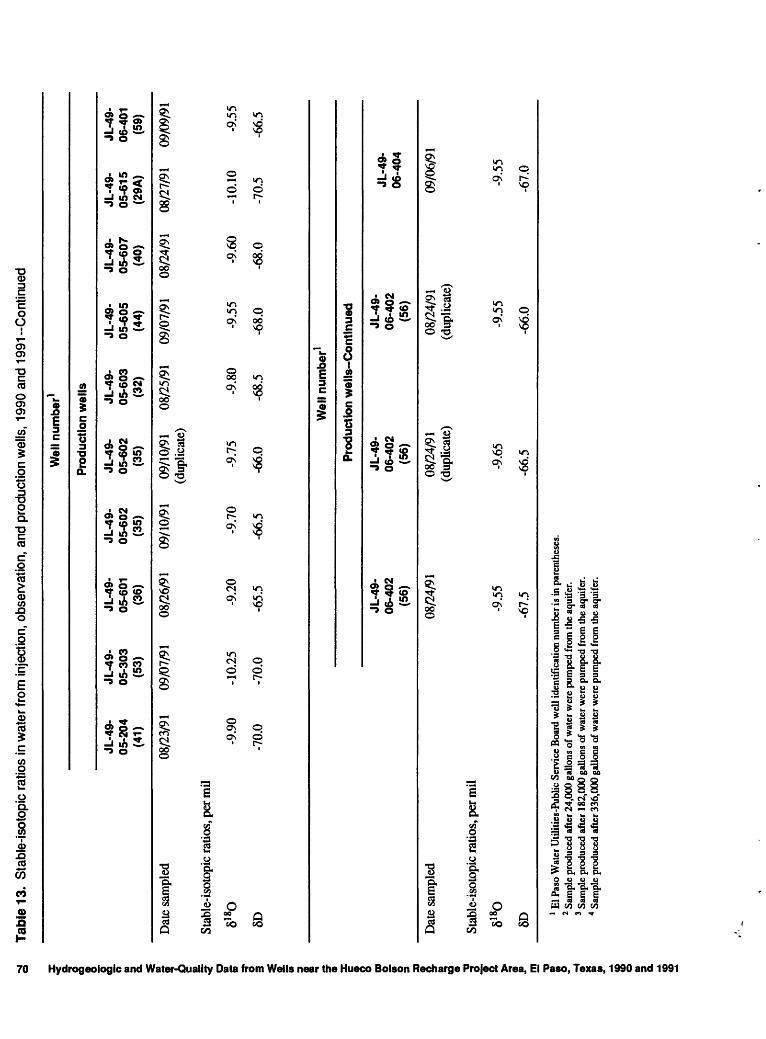
Tabl
e 13
. S
tabl
e-is
otop
ic r
atio
s in
wat
er fr
om in
ject
ion,
obs
erva
tion,
and
pro
duct
ion
wel
ls,
1990
and
199
1-C
ontin
ued
x
"a i g § a 03 a f | $ =f o I 5" 1 X §c DO 2. 0 3 I c3 o I I 1 m
Wel
l num
ber1
Prod
uctio
n w
ells
JL-4
9-
JL-4
9-05
-204
05
-303
(41)
(5
3)
Dat
e sa
mpl
ed
08/2
3/91
09
/07/
91
Stab
le-is
otop
ic ra
tios,
per m
il
818O
-9
.90
-10.
25
8D
-70.
0 -7
0.0
JL-4
9-05
-601
(36)
08/2
6/91
-9.2
0
-65.
5
JL-4
9-
JL-4
9-05
-602
05
-602
(35)
(3
5)
09/1
0/91
09
/10/
91(d
uplic
ate)
-9.7
0 -9
.75
-66.
5 -6
6.0
JL-4
9-
JL-4
9-
JL-4
9-05
-603
05
-605
05
-607
(32)
(4
4)
(40)
08/2
5/91
09
/07/
91
08/2
4/91
-9.8
0 -9
.55
-9.6
0
-68.
5 -6
8.0
-68.
0
Wel
l num
ber1
JL-4
9-05
-615
(29A
)
08/2
7/91
-10.
10
-70.
5
JL-4
9-06
-401
(59)
09/0
9/91
-9.5
5
-66.
5
Prod
uctio
n w
ells
-Con
tinue
d
Dat
e sa
mpl
ed
Stab
le-is
otop
ic ra
tios,
per m
il81
80
8D
JL-4
9-06
-402
(56)
08/2
4/91
-9.5
5
-67.
5
JL-4
9-06
-402
(56)
08/2
4/91
(dup
licat
e)
-9.6
5
-66.
5
JL-4
9-06
-402
(56)
08/2
4/91
(dup
licat
e)
-9.5
5
-66.
0
JL-4
9-06
-404
09/0
6/91
-9.5
5
-67.
0
1 El P
aso
Wat
er U
tiliti
es-P
ublic
Ser
vice
Boa
rd w
ell i
dent
ific
atio
n nu
mbe
r is
in p
aren
thes
es.
2 Sa
mpl
e pr
oduc
ed a
fter
24,
000
gallo
ns o
f wat
er w
ere
pum
ped
from
the
aqui
fer.
3 Sa
mpl
e pr
oduc
ed a
fter
182
,000
gal
lons
of w
ater
wer
e pu
mpe
d fr
om th
e aq
uife
r.4
Sam
ple
prod
uced
aft
er 3
36,0
00 g
allo
ns o
f wat
er w
ere
pum
ped
from
the
aqui
fer.
0) g.
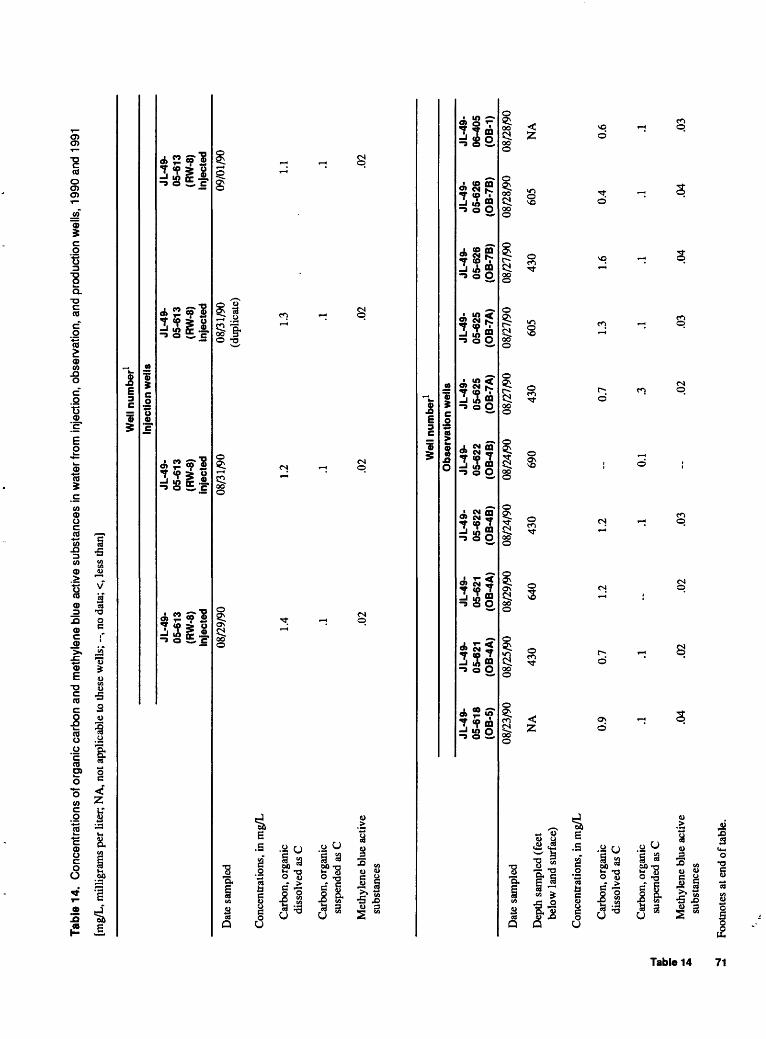
8- »
Tab
le 1
4. C
once
ntra
tions
of o
rgan
ic c
arbo
n an
d m
ethy
lene
blu
e ac
tive
subs
tanc
es in
wat
er fr
om in
ject
ion,
obs
erva
tion,
and
pro
duct
ion
wel
ls,
1990
and
199
1
[mg/
L, m
illig
ram
s per
lite
r, N
A, n
ot a
pplic
able
to th
ese
wel
ls; --
, no
data
; <, l
ess
than
]
Dat
e sa
mpl
ed
Con
cent
ratio
ns, i
n m
g/L
Car
bon,
org
anic
di
ssol
ved
as C
Car
bon,
org
anic
su
spen
ded
as C
Met
hyle
ne b
lue
activ
e su
bsta
nces
Dat
e sa
mpl
ed
Dep
th s
ampl
ed (
feet
be
low
land
sur
face
)
Con
cent
ratio
ns, i
n m
g/L
Car
bon,
org
anic
di
ssol
ved
as C
Car
bon,
org
anic
su
spen
ded
as C
Wel
l num
ber1
Inje
ctio
n w
ells
JL-4
9-
JL-4
9-
05-6
13
05-6
13
(RW
-8)
(RW
-8)
Inje
cted
in
ject
ed
08/2
9/90
08
/31/
90
1.4
1.2
.1 .1
.02
.02 W
ell n
umbe
r1O
bser
vatio
n w
ells
JL-4
9-
JL-4
9-
JL-4
9-
JL-4
9-
JL-4
9-
JL-4
9-
05-6
18
05-6
21
05-6
21
05-6
22
05-6
22
05-6
25
(OB
-5)
(OB
-4A
) (O
B-4
A)
(OB
-4B
) (O
B-4
B)
(OB
-7A
)
08/2
3/90
08
/25/
90
08/2
9/90
08
/24/
90
08/2
4/90
08
/27/
90
NA
43
0 64
0 43
0 69
0 43
0
0.9
0.7
1.2
1.2
--
0.7
.1 .1
- .1
0.1
.3
JL-4
9-
05-6
13
(RW
-8)
Inje
cted
08/3
1/90
(d
uplic
ate)
1.3 .1 .0
2
JL-4
9-
JL-4
9-
05-6
25
05-6
26
(OB-
7A)
(OB
-7B
)
08/2
7/90
08
/27/
90
605
430
1.3
1.6
.1 .1
JL-4
9-
05-6
13
(RW
-8)
Inje
cted
09/0
1/90
1.1 .1 .0
2
JL-4
9-
JL-4
9-
05-6
26
06-4
05
(OB
-7B
) (O
B-1
)
08/2
8/90
08
/28/
90
605
NA
0.4
0.6
.1 .1
Met
hyle
ne b
lue
activ
e su
bsta
nces
.04
.02
.02
.03
.02
.03
.04
.04
.03
3
Foot
note
s at
end
of t
able
.

Tabl
e 14
. C
once
ntra
tions
of o
rgan
ic c
arbo
n an
d m
ethy
lene
blu
e ac
tive
subs
tanc
es in
wat
er fr
om in
ject
ion,
obs
erva
tion,
and
pro
duct
ion
wel
ls,
1990
and
199
1--
Con
tinue
d
1 3 <o * s tT 0) a i | o i 2 ? B ? 3 i « i X i CD jl g 1 O 1 r » rn -0 i s1 s _* Q> i
Dat
e sa
mpl
ed
Con
cent
ratio
ns, i
n m
g/L
Car
bon,
org
anic
diss
olve
d as
C
Car
bon,
org
anic
susp
ende
d as
C
Met
hyle
ne b
lue
activ
esu
bsta
nces
JL-4
9-
JL-4
9-
JL-4
9-05
-204
05
-301
05
-501
(41)
(4
2)
(31)
08/3
0/90
08
/23/
90
08/2
3/90
0.6
0.4
0.6
<.l
.1 .1
.04
.05
.05
Wel
l num
ber1
Prod
uctio
n w
ells
JL-4
9-05
-601
(36)
08/3
0/90
0.7 .1 .0
3
Wel
l num
ber1
JL-4
9-05
-602
(35)
08/2
2/90
1.2 .2 <.02
JL-4
9-05
-603
(32)
08/2
1/90
0.3 .1 .0
5
JL-4
9-05
-603
(32)
08/2
1/90
(d
uplic
ate)
0.6 .1 .0
5
Prod
uctio
n w
ells
-Con
tinue
d
Dat
e sa
mpl
ed
Con
cent
ratio
ns, i
n m
g/L
Car
bon,
org
anic
diss
olve
d as
C
Car
bon,
org
anic
susp
ende
d as
C
Met
hyle
ne b
lue
activ
esu
bsta
nces
r*
. .
. if..i_i
JL-4
9-
JL-4
9-
JL-4
9-05
-604
05
-605
05
-605
(34)
(4
4)
(44)
08/2
2/90
09
/01/
90
09/0
1/90
(d
uplic
ate)
1.1
0.3
0.4
.2 <.02
<.
02
<.02
JL-4
9-05
-607
(40)
08/2
0/90
1.3 .1 .0
6
JL-4
9-05
-615
(29A
)
08/3
1/90
0.4 .1 .0
3
JL-4
9-06
-402
(56)
09/0
1/90
0.5 .1 <.02
JL-4
9-06
-402
(56)
09/0
1/90
(d
uplic
ate)
0.4 .1
<.02
Foot
note
s at
end
of t
able
.

Tabl
e 14
. C
once
ntra
tions
of o
rgan
ic c
arbo
n an
d m
ethy
lene
blu
e ac
tive
subs
tanc
es in
wat
er fr
om in
ject
ion,
obs
erva
tion,
and
pro
duct
ion
wel
ls,
1990
and
199
1--
Con
tinue
d
Wel
l num
ber1
Infe
ctio
n w
ells
Dat
e sa
mpl
ed
Con
cent
ratio
ns, i
n m
g/L
Car
bon,
org
anic
to
tal a
s C
Car
bon,
org
anic
di
ssol
ved
as C
JL-4
9-05
-613
(RW
-8)
Infe
cted
08/2
5/91
1.4
1.6
JL-4
9-
JL-4
9-05
-613
05
-613
(RW
-8)
(RW
-8)
Infe
cted
In
fect
ed
08/2
5/91
08
/25/
91
(dup
licat
e)
(dup
licat
e)
1.4
1.4
1.4
1.5
JL-4
9-05
-624
(RW
-7)
inje
cted
08/2
7/91
1.6
2.6
JL-4
9-
JL-4
9-
JL-4
9-05
-624
05
-624
05
-624
(RW
-7)
(RW
-7)
(RW
-7)
pum
ped2
pu
mpe
d3
pum
ped4
09/0
8/91
09
/08/
91
09/0
8/91
1.8
1.5
1.2
1.3
1.2
1.1
Wel
l num
ber1
Obs
erva
tion
wel
ls
Dat
e sa
mpl
ed
Dep
th s
ampl
ed (
feet
be
low
land
sur
face
)
Con
cent
ratio
ns, i
n m
g/L
Car
bon,
org
anic
to
tal a
s C
Car
bon,
org
anic
di
ssol
ved
as C
JL-4
9-
JL-4
9-05
-618
05
-621
(OB
-5)
(OB
-4A
)
08/3
0/91
08
/29/
91
NA
43
0
0.2
0.8
.3
.8
JL-4
9-
JL-4
9-
JL-4
9-05
-621
05
-622
05
-622
(OB
-4A
) (O
B-4
B)
(OB
-4B
)
08/2
9/91
08
/29/
91
08/2
9/91
605
430
605
0.5
0.5
0.8
.6
.5
. .4
JL-4
9-05
-625
(OB
-7A
)
08/2
7/91
430
0.5 .6
JL-4
9-
JL-4
9-
JL-4
9-
JL-4
9-05
-625
05
-626
05
-626
06
-405
(OB
-7A
) (O
B-7
B)
(OB
-7B
) (O
B-1
)
08/2
7/91
08
/27/
91
08/2
7/91
08
/30/
91
605
430
605
NA
0.6
0.4
0.2
0.5
.5
.4
.2
.4
Foot
note
s at
end
of t
able
.
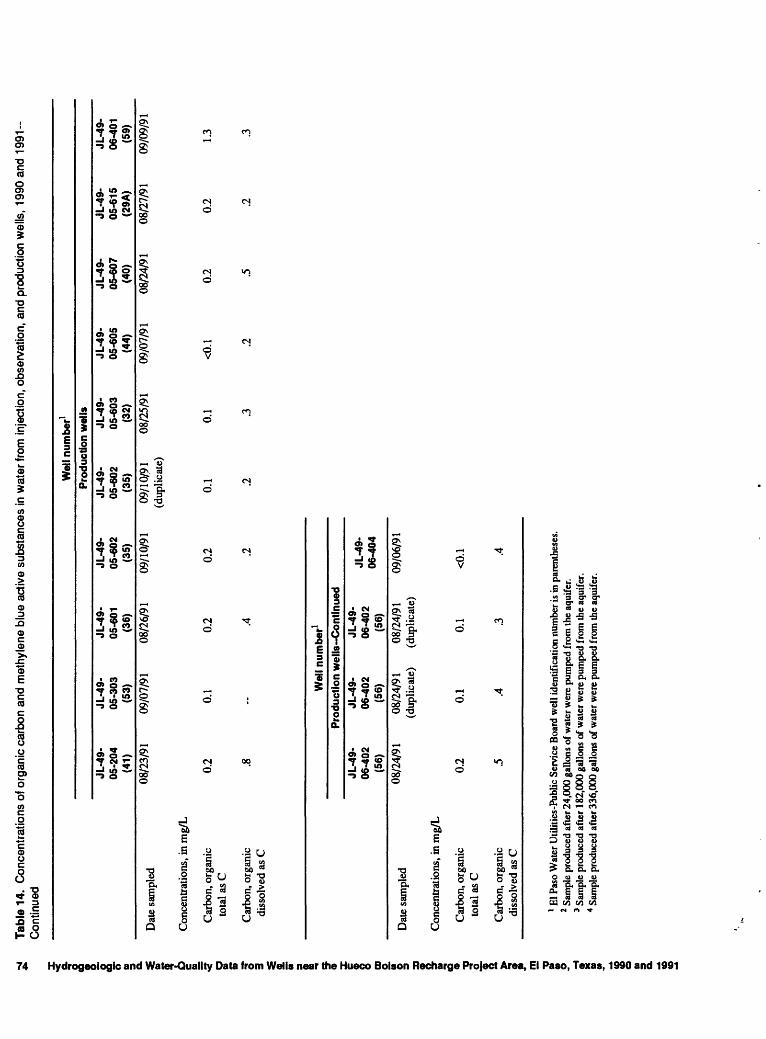
2>
Tabl
e 14
. C
once
ntra
tions
of o
rgan
ic c
arbo
n an
d m
ethy
lene
blu
e ac
tive
subs
tanc
es in
wat
er fr
om in
ject
ion,
obs
erva
tion,
and
pro
duct
ion
wel
ls,
1990
and
199
1-
Con
tinue
d^
. .
., ,...
! 8 & o" 0 o,
5
Dat
e sa
mpl
ed
1 O
Con
cent
ratio
ns, i
n m
g/L
S. «?
Car
bon,
org
anic
§?
tota
l as C
S jjC
Car
bon,
org
anic
3 di
ssol
ved
as C
I 5* 3 S f X X DO
JL-4
9-
05-2
04
(41)
08/2
3/91
0.2 .8
JL-4
9-
05-3
03
(53)
09/0
7/91
0.1
--
JL-4
9-
05-6
01
(36)
08/2
6/91
0.2 .4
JL-4
9-
05-6
02
(35)
09/1
0/91
0.2 .2
Wel
l num
ber1
Prod
uctio
n w
ells
JL-4
9-
JL-4
9-
JL-4
9-
JL-4
9-
JL-4
9-
JL-4
9-
05-6
02
05-6
03
05-6
05
05-6
07
05-6
15
06-4
01
(35)
(3
2)
(44)
(4
0)
(29A
) (5
9)09
/10/
91
08/2
5/91
09
/07/
91
08/2
4/91
08
/27/
91
09/0
9/91
(d
uplic
ate)
0.1
0.1
<0.1
0.
2 0.
2 1.
3
.2
.3 .2
.5
.2
.3
Wel
l num
ber1
Prod
uctio
n w
ells
-Con
tinu
edJL
-49-
06-4
02(5
6)
JL-4
9-06
-402
(56)
JL-4
9-06
-402
(56)
JL-4
9-06
-404
I m
Dat
e sa
mpl
ed
Con
cent
ratio
ns, i
n m
g/L
Car
bon,
org
anic
to
tal a
s C
Car
bon,
org
anic
di
ssol
ved
as C
08/2
4/91
0.2
08/2
4/91
08
/24/
91
(dup
licat
e)
(dup
licat
e)09
/06/
91
0.1 .4
0.1
.4
1 El P
aso
Wat
er U
tiliti
es-P
ublic
Ser
vice
Boa
rd w
ell i
dent
ifica
tion
num
ber
is in
par
enth
eses
.2
Sam
ple
prod
uced
aft
er 2
4,00
0 ga
llons
of w
ater
wer
e pu
mpe
d fr
om th
e aq
uife
r.3
Sam
ple
prod
uced
aft
er 1
82,0
00 g
allo
ns o
f w
ater
wer
e pu
mpe
d fr
om th
e aq
uife
r.4
Sam
ple
prod
uced
aft
er 3
36,0
00 g
allo
ns o
f wat
er w
ere
pum
ped
from
the
aqu
ifer.
0
g. <o
<o
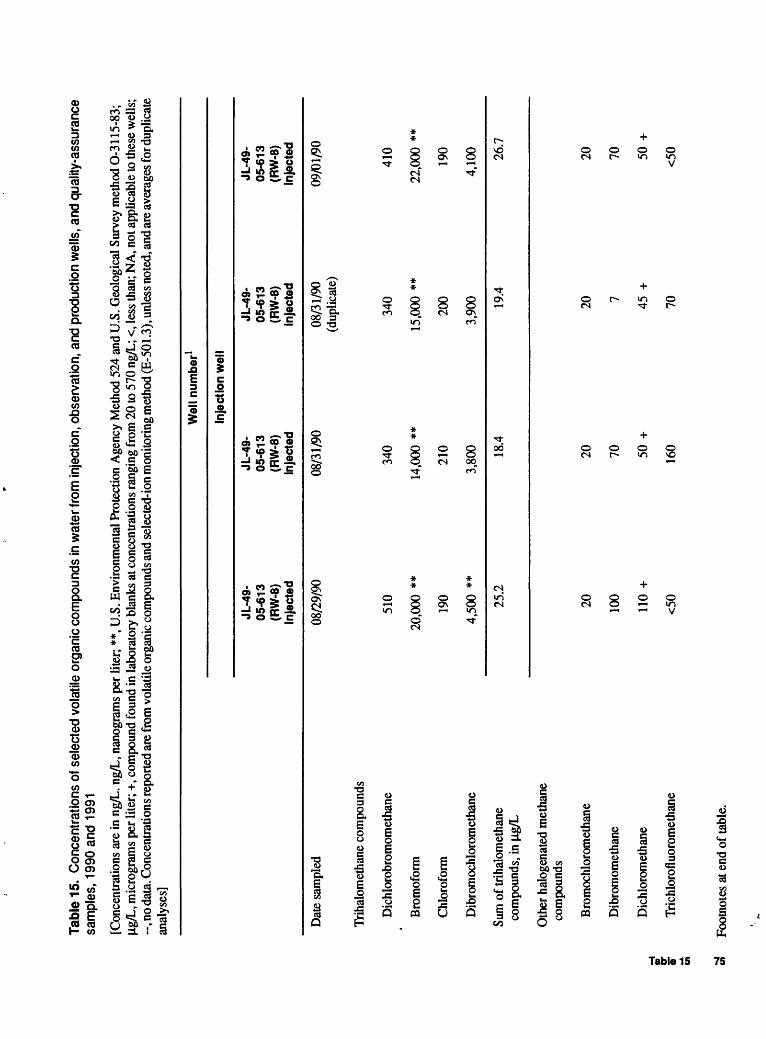
Tabl
e 15
. C
once
ntra
tions
of s
elec
ted
vola
tile
orga
nic
com
poun
ds in
wat
er fr
om in
ject
ion,
obs
erva
tion,
and
pro
duct
ion
wel
ls, a
nd q
ualit
y-as
sura
nce
sam
ples
, 19
90 a
nd 1
991
[Con
cent
ratio
ns a
re in
ng/
L. n
g/L,
nan
ogra
ms
per l
iter;
**, U
.S. E
nviro
nmen
tal P
rote
ctio
n A
genc
y M
etho
d 52
4 an
d U
.S. G
eolo
gica
l Sur
vey
met
hod
O-3
115-
83;
u.g/
L, m
icro
gram
s pe
r lite
r; +,
com
poun
d fo
und
in la
bora
tory
bla
nks
at c
once
ntra
tions
rang
ing
from
20
to 5
70 n
g/L;
<, l
ess
than
; NA
, not
app
licab
le to
thes
e w
ells
; --
, no
data
. Con
cent
ratio
ns re
porte
d ar
e fr
om v
olat
ile o
rgan
ic c
ompo
unds
and
sele
cted
-ion
mon
itorin
g m
etho
d (£
-501
.3),
unle
ss n
oted
, and
are a
vera
ges f
or d
uplic
ate
anal
yses
]
£
«
Wel
l num
ber1
Inje
ctio
n w
ell
Dat
e sa
mpl
ed
Trih
alom
etha
ne c
ompo
unds
Dic
hlor
obro
mom
etha
ne
Bro
mof
orm
Chl
orof
orm
Dib
rom
ochl
orom
etha
ne
Sum
of t
rihal
omet
hane
co
mpo
unds
, in
u.g/
L
Oth
er h
alog
enat
ed m
etha
ne
com
poun
ds
Bro
moc
hlor
omet
hane
Dib
rom
omet
hane
Dic
hlor
omet
hane
Tric
hlor
oflu
orom
etha
ne
JL-4
9-
05-6
13
(RW
-8)
Inje
cted
08/2
9/90
510
20,0
00 *
*
190
4,50
0 **
25.2
20 100
110
+
<50
JL-4
9-
05-6
13
(RW
-8)
Inje
cted
08/3
1/90
340
14,0
00 *
*
210
3,80
0 18.4
20 70 50 +
160
JL-4
9-
05-6
13
(RW
-8)
Inje
cted
08/3
1/90
(d
uplic
ate)
340
15,0
00 *
*
200
3,90
0 19.4
20 7 45 +
70
JL-4
9-
05-6
13
(RW
-8)
Inje
cted
09/0
1/90
410
22,0
00 *
*
190
4,10
0 26.7
20 70 50 +
<50
en Fo
otno
tes
at e
nd o
f tab
le.
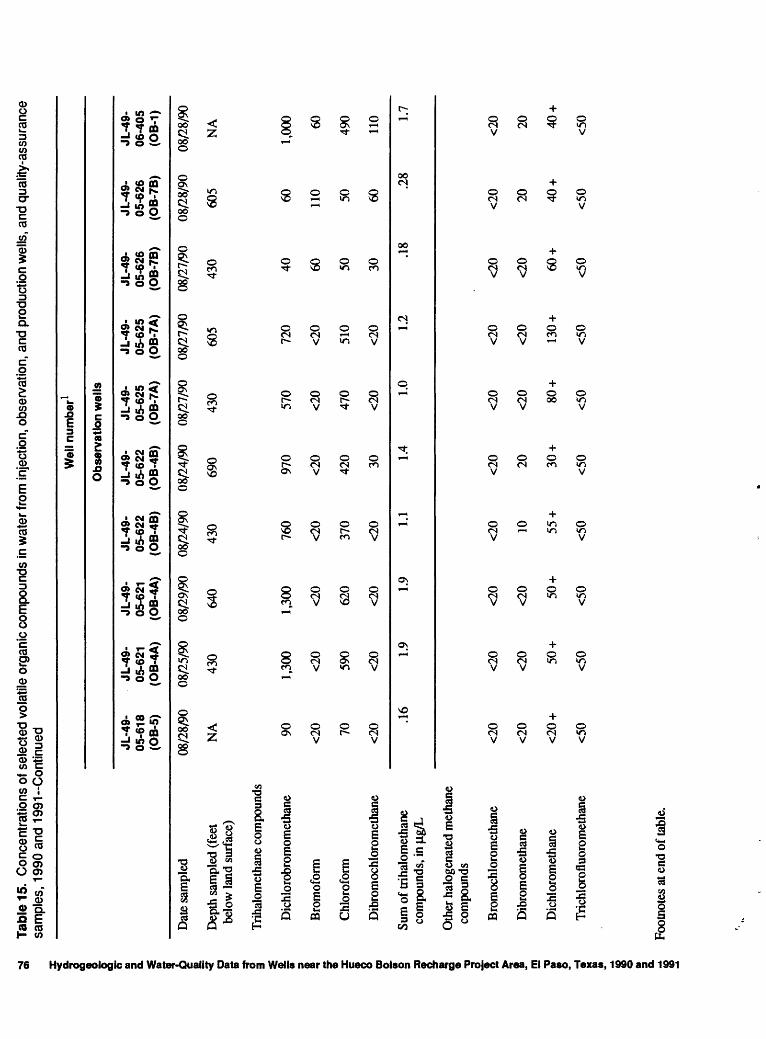
Tabl
e 15
. C
once
ntra
tions
of s
elec
ted
vola
tile
orga
nic
com
poun
ds in
wat
er fr
om in
ject
bn, o
bser
vatio
n, a
nd p
rodu
ctio
n w
ells
, and
qua
lity-
assu
ranc
e sa
mpl
es,
1990
and
199
1--C
ontin
ued
< ! 8 g 0 tt a 1 I o 0) sr | ! sr 3 2 f X CD O_ sr § 31 1 i T> 5 1 1 m o
ai S 5* X 0) o 0) a
Wel
l num
ber1
Obs
erva
tion
wel
ls
Dat
e sa
mpl
ed
Dep
th sa
mpl
ed (f
eet
belo
w la
nd s
urfa
ce)
Trih
alom
etha
ne c
ompo
unds
Dic
hlor
obro
mom
etha
ne
Bro
mof
orm
Chl
orof
orm
Dib
rom
ochl
orom
etha
ne
Sum
of t
rihal
omet
hane
com
poun
ds, i
n (ig
/L
Oth
er h
alog
enat
ed m
etha
neco
mpo
unds
Bro
moc
hlor
omet
hane
Dib
rom
omet
hane
Dic
hlor
omet
hane
Tric
hlor
oflu
orom
etha
ne
JL-4
9-05
-618
(OB
-5)
08/2
8/90
NA 90 <20 70 <20 .1
6
<20
<20
<20
+
<50
JL-4
9-05
-621
(OB
-4A
)
08/2
5/90
430
1,30
0
<20
590
<20 1.
9
<20
<20 50
+
<50
JL-4
9-05
-621
(OB
-4A
)
08/2
9/90
640
1,30
0
<20
620
<20 1.9
<20
<20 50 +
<50
JL-4
9-05
-622
(OB
-4B
)
08/2
4/90
430
760
<20
370
<20 1.1
<20 10 55 +
<50
JL-4
9-05
-622
(OB
-4B
)
08/2
4/90
690
970
<20
420 30 1.4
<20 20 30
+
<50
JL-4
9-05
-625
(OB
-7A
)
08/2
7/90
430
570
<20
470
<20 1.
0
<20
<20 80 +
<50
JL-4
9-05
-625
(OB
-7A
)
08/2
7/90
605
720
<20
510
<20 1.
2
<20
<20
130
+
<50
JL-4
9-05
-626
(OB
-7B
)
08/2
7/90
430 40 60 50 30
.18
<20
<20 60 +
<50
JL-4
9-05
-626
(OB
-7B
)
08/2
8/90
605 60 110 50 60
.28
<20 20 40 +
<50
JL-4
9-06
-405
(OB
-1)
08/2
8/90
NA
1,00
0 60 490
110 1.
7
<20 20 40 +
<50
Si Fo
otno
tes
at e
nd o
f tab
le.
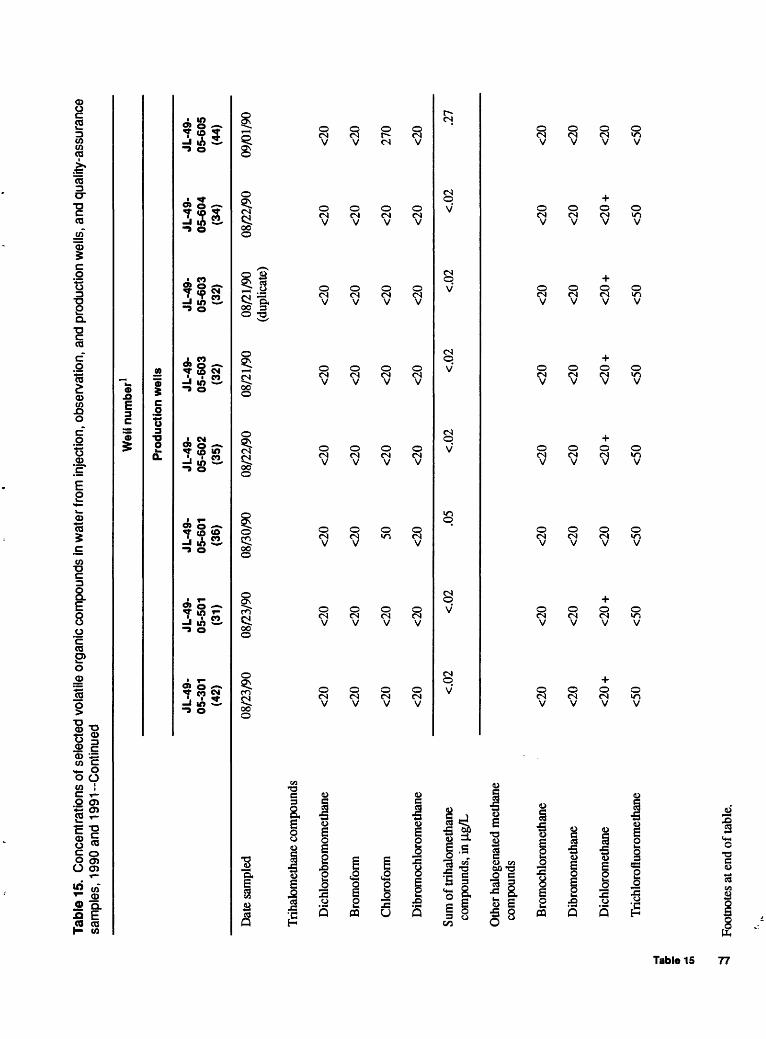
Tabl
e 15
. C
once
ntra
tions
of s
elec
ted
vola
tile
orga
nic
com
poun
ds in
wat
er fr
om in
ject
ion,
obs
erva
tion,
and
pro
duct
ion
wel
ls, a
nd q
ualit
y-as
sura
nce
sam
ples
, 19
90 a
nd 1
991-
Con
tinue
d
Wel
l num
ber1
Prod
uctio
n w
ells
Dat
e sa
mpl
ed
Trih
alom
etha
ne c
ompo
unds
Dic
hlor
obro
mom
etha
ne
Bro
mof
orm
Chl
orof
orm
Dib
rom
ochl
orom
etha
ne
Sum
of t
rihal
omet
hane
co
mpo
unds
, in
u,g/
L
Oth
er h
alog
enat
ed m
etha
ne
com
poun
ds
Bro
moc
hlor
omet
hane
Dib
rom
omet
hane
Dic
hlor
omet
hane
Tric
hlor
oflu
orom
etha
ne
5*
_t Ol
JL-4
9-
05-3
01
(42)
08/2
3/90
<20
<20
<20
<20 <.
02
<20
<20
<20
+
<50
JL-4
9-
05-5
01
(31)
08/2
3/90
<20
<20
<20
<20 <.
02
<20
<20
<20
+
<50
JL-4
9-
05-6
01
(36)
08/3
0/90
<20
<20 50 <20 .0
5
<20
<20
<20
<50
JL-4
9-
05-6
02
(35)
08/2
2/90
<20
<20
<20
<20 <.
02
<20
<20
<20
+
<50
JL-4
9-
05-6
03
(32)
08/2
1/90
<20
<20
<20
<20 <.
02
<20
<20
<20
+
<50
JL-4
9-
05-6
03
(32)
08/2
1/90
(d
uplic
ate)
<20
<20
<20
<20 <.
02
<20
<20
<20
+
<50
JL-4
9-
05-6
04
(34)
08/2
2/90
<20
<20
<20
<20 <.
02
<20
<20
<20
+
<50
JL-4
9-
05-6
05
(44)
09/0
1/90
<20
<20
270
<20 .2
7
<20
<20
<20
<50
Foot
note
s at
end
of t
able
.
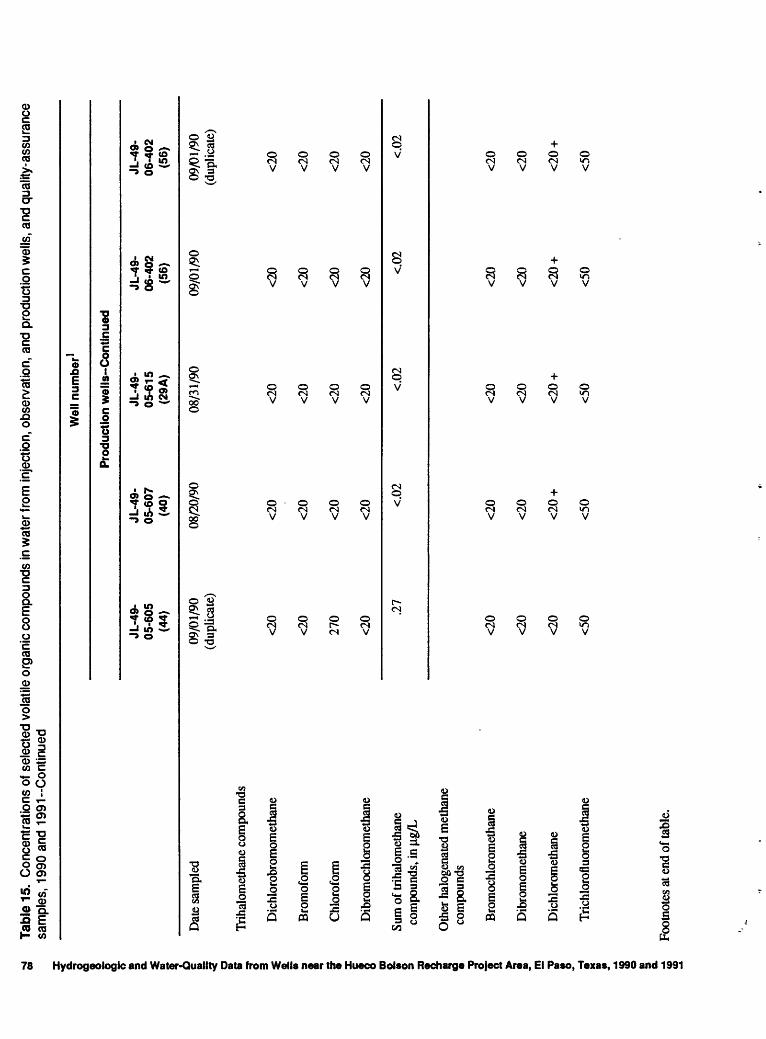
Tabl
e 15
. C
once
ntra
tions
of s
elec
ted
vola
tile
orga
nic
com
poun
ds in
wat
er fr
om in
ject
bn, o
bser
vatio
n, a
nd p
rodu
ctio
n w
ells
, and
qua
lity-
assu
ranc
e sa
mpl
es,
1990
and
199
1-C
ontin
ued
lydrogeologi o a a. 1 § *
S 3- om Well I 1 ? § 00 » >n Recharge P o I s ta m -Q
ta 8 i V 0,
Dat
e sa
mpl
ed
Trih
alom
etha
ne c
ompo
unds
Dic
hlor
obro
mom
etha
ne
Brom
ofor
m
Chl
orof
orm
Dib
rom
ochl
orom
etha
ne
Sum
of U
ihal
omet
hane
com
poun
ds, i
n }i
g/L
Oth
er h
alog
enat
ed m
etha
ne
com
poun
ds
Bro
moc
hlor
omet
hane
Dib
rom
omet
hane
Dic
hlor
omet
hane
Tric
hlor
ofl u
orom
etha
ne
Wel
l num
ber1
Prod
uctio
n w
ells
-Con
tinue
d
JL-4
9-
JL-4
9-
JL-4
9-
JL-4
9-
05-6
05
05-6
07
05-6
15
06-4
02(4
4)
(40)
(2
9A)
(56)
09/0
1/90
08
/20/
90
08/3
1/90
09
/01/
90(d
uplic
ate)
<20
<20
<20
<20
<20
<20
<20
<20
270
<20
<20
<20
<20
<20
<20
<20
.27
<.02
<.
02
<.02
<20
<20
<20
<20
<20
<20
<20
<20
<20
<20
+ <2
0 +
<20
+
<50
<50
<50
<50
JL-4
9-
06-4
02(5
6)
09/0
1/90
(dup
licat
e)
<20
<20
<20
<20 <.
02
<20
<20
<20
+
<50
^ Fo
otno
tes
at e
nd o
f tab
le.

Tabl
e 15
. C
once
ntra
tions
of s
elec
ted
vola
tile
orga
nic
com
poun
ds in
wat
er fr
om in
ject
ion,
obs
erva
tion,
and
pro
duct
ion
wel
ls, a
nd q
ualit
y-as
sura
nce
sam
ples
, 19
90 a
nd 1
991-
Con
tinue
d
Qua
lity-
assu
ranc
e sa
mpl
es
Dat
e pr
epar
ed
Trih
alom
etha
ne c
ompo
unds
Dic
hlor
obro
mom
etha
ne
Bro
mof
orm
Chl
orof
orm
Dib
rom
ochl
orom
etha
ne
Sum
of t
rihal
omet
hane
co
mpo
unds
, in
\ig/L
Oth
er h
alog
enat
ed m
etha
ne
com
poun
ds
Bro
moc
hlor
om et
hane
Dib
rom
omet
hane
Dic
hlor
omet
hane
Tric
hlor
oflu
orom
etha
ne
Rea
gent
- M
atrix
- w
ater
w
ater
sp
ike
spik
e
08/2
2/90
09
/01/
90
190
250
260
350
230
2260
220
340
.9
1.2
240
280
240
300
200
+ 29
0 +
42
190
Trip
bl
ank
08/2
0/90
<20
<20
<20
<20 <.
02
<20
<20 30
+
<50
Trip
bl
ank
09/0
1/90
<20
<20
<20
<20 <.
02
<20
<20 30
+
<50
Equ
ipm
ent
blan
k
09/0
1/90
<20
<20
<20
<20 <.
02
<20
<20 30
+
<50
to Fo
otno
tes
at e
nd o
f tab
le.

Tabl
e 15
. C
once
ntra
tions
of s
elec
ted
vola
tile
orga
nic
com
poun
ds in
wat
er fr
om in
ject
ion,
obs
erva
tion,
and
pro
duct
ion
wel
ls, a
nd q
ualit
y-as
sura
nce
sam
ples
, 19
90 a
nd 1
991-
Con
tinue
d
1 1 5" 03 a 1 1 S:
S i 1 | f X 03 O « s 31 1 a (S ? i j m fO
Dat
e sa
mpl
ed
Trih
alom
etha
ne c
ompo
unds
Dic
hlor
obro
mom
etha
ne
Bro
mof
orm
Chl
orof
orm
Dib
rom
ochl
orom
etha
ne
Sum
of t
rihal
omet
hane
com
poun
ds, i
n u.
g/L
Oth
er h
alog
enat
ed m
etha
neco
mpo
unds
Bro
moc
hlor
omet
hane
Dib
rom
omet
hane
Dic
hlor
omet
hane
Tric
hlor
oflu
orom
etha
ne
JL-4
9-05
-613
(RW
-8)
inje
cted
08/2
5/91
740
20,0
00 *
*
400
6,70
0 **
27.8
20 80 50 +
<50
JL-4
9-05
-624
(RW
-7)
Inje
cted
08/2
7/91
820
26,0
00 *
*
380
7,40
0 **
34.6
~ ~
<20
+
_
Wel
l num
ber1
Inje
ctio
n w
ells
JL-4
9-05
-624
(RW
-7)
pum
ped
3
09/0
8/91
50 <20
280
<20 .3
3
<20
<20
230
+
<50
JL-4
9-05
-624
(RW
-7)
pum
ped4
09/0
8/91
60 <20
290
<20 .3
5
<20
<20
220
+
<50
JL-4
9-05
-624
(RW
-7)
pum
ped
09/0
8/91
90 <20
270
<20 .3
6
<20
<20
200
+
<50
s « Fo
otno
tes
at e
nd o
f tab
le.

Tabl
e 15
. C
once
ntra
tions
of s
elec
ted
vola
tile
orga
nic
com
poun
ds in
wat
er fr
om in
ject
ion,
obs
erva
tion,
and
pro
duct
ion
wel
ls, a
nd q
ualit
y-as
sura
nce
sam
ples
, 19
90 a
nd 1
991-
Con
tinue
d
Wel
l num
ber1
Obs
erva
tion
wel
ls
Dat
e sa
mpl
ed
Dep
th s
ampl
ed (
feet
be
low
land
sur
face
)
Trih
alom
etha
ne c
ompo
unds
Dic
hlor
obro
mom
etha
ne
Bro
mof
orm
Chl
orof
orm
Dib
rom
ochl
orom
etha
ne
Sum
of t
rihal
omet
hane
co
mpo
unds
, in
jig/L
Oth
er h
alog
enat
ed m
etha
ne
com
poun
ds
Bro
moc
hlor
omet
hane
Dib
rom
omet
hane
Dic
hlor
omet
hane
Tric
hlor
oflu
orom
etha
ne
JL-4
9-
05-6
18
(OB
-5)
08/3
0/91
NA
150
<20
110
<20 .2
6
<20
<20 90 +
<50
JL-4
9-
05-6
21
(OB
-4A
)
08/2
9/91
430
560
<20
430
<20 .9
9
<20
<20 90 +
<50
JL-4
9-
05-6
21
(OB
-4A
)
08/2
9/91
605
530
<20
400
<20 .9
3
<20
<20
100
+
<50
JL-4
9-
05-6
22
(OB
-4B
)
08/2
9/91
430
950
<20
470
<20 1.
4
<20
<20
110
+
<50
JL-4
9-
05-6
22
(OB
-4B
)
08/2
9/91
605
900
<20
480
<20 1.
4
<20
<20 90 +
<50
JL-4
9-
05-6
25
(OB
-7A
)
08/2
7/91
430
190
<20
360
<20 .5
5
<20
<20
100
+
<50
JL-4
9-
05-6
25
(OB
-7A
)
08/2
7/91
605
350
<20
340
<20 .6
9
<20
<20
110
+
<50
JL-4
9-
05-6
26
(OB
-7B
)
08/2
7/91
430
60 <20 70 <20 .1
3
<20
<20 70
+
<50
JL-4
9-
05-6
26
(OB
-7B
)
08/2
7/91
605
130
110 90 60
.39
<20 20 100
+
<50
JL-4
9-
06-4
05
(OB
-1)
08/3
0/91
NA
700
<20
470
<20 1.
2
<20
<20
130
+
<50
-* Fo
otno
tes
at e
nd o
f tab
le.

Tabl
e 15
. C
once
ntra
tions
of s
elec
ted
vola
tile
orga
nic
com
poun
ds in
wat
er fr
om in
ject
ion,
obs
erva
tion,
and
pro
duct
ion
wel
ls, a
nd q
ualit
y-as
sura
nce
sam
ples
, 19
90 a
nd 1
991-
Con
tinue
d
I 8 S 0 u g. s 1 o e S. 1 ff | 1 £ w ^ X i DO ° 8 3 3D 1 s (Q O |2. 1JO m T)
D> S 1D JM U O.
Dat
e sa
mpl
ed
Trih
alom
etha
ne c
ompo
unds
Dic
hlor
obro
mom
etha
ne
Bro
mof
orm
Chl
orof
orm
Dib
rom
ochl
orom
etha
ne
Sum
of t
rihal
omet
hane
com
poun
ds, i
n (ig
/L
Oth
er h
alog
enat
ed m
etha
neco
mpo
unds
Bro
moc
hlor
omet
hane
Dib
rom
omet
hane
Dic
hlor
omet
hane
Tric
hlor
oflu
orom
etha
ne
JL-4
9-
JL-4
9-
JL-4
9-05
-204
05
-303
05
-601
(41)
(5
3)
(36)
08/2
3/91
09
/07/
91
08/2
6/91
<20
20
<20
<20
<20
<20
<20
140
50
<20
20
<20
<.02
.1
8 .0
5
<20
<20
<20
<20
<20
<20
40 +
30
+
40 +
<50
<50
<50
JL-4
9-05
-602
(35)
09/1
0/91
<20
<20
<20
<20 <.
02
<20
<20 50 <50
Wel
l num
ber1
Prod
uctio
n w
ells
JL-4
9-
JL-4
9-05
-603
05
-605
(32)
(4
4)
08/2
5/91
09
/07/
91
<20
<20
<20
<20
<20
210
<20
<20
<.02
.21
<20
<20
<20
<20
30
100
+
<50
<50
JL-4
9-05
-607
(40)
08/2
4/91
<20
<20
<20
<20 <.
02
<20
<20 40 +
<50
JL-4
9-05
-615
(29A
)
08/2
7/91
<20
<20
<20
<20 <.
02
<20
<20 40 +
<50
JL-4
9-06
-401
(59)
09/0
9/91
<20
<20
<20
<20 <.
02
<20
<20
120
+
<50
JL-4
9-06
-402
(56)
08/2
4/91
80 <20 50 20
.15
<20
<20 50
+
<50
- Fo
otno
tes a
t end
of t
able

Tabl
e 15
. C
once
ntra
tions
of s
elec
ted
vola
tile
orga
nic
com
poun
ds in
wat
er fr
om in
ject
ion,
obs
erva
tion,
and
pro
duct
ion
wel
ls, a
nd q
ualit
y-as
sura
nce
sam
ples
, 19
90 a
nd 1
991-
-Con
tinue
d
Dat
e sa
mpl
ed
Dat
e pr
epar
ed
Trih
alom
etha
ne c
ompo
unds
Dic
hlor
obro
mom
etha
ne
Bro
mof
orm
Chl
orof
orm
Dib
rom
ochl
orom
etha
ne
Sum
of t
rihal
omet
hane
co
mpo
unds
, in
u,g/
L
Oth
er h
alog
enat
ed m
etha
ne
com
poun
ds
Bro
moc
hlor
omet
hane
Dib
rom
omet
hane
Dic
hlor
omet
hane
Tric
hlor
oflu
orom
etha
ne
Wel
l num
ber1
Prod
uctio
n w
ells
- C
ontin
ued
JL-4
9-
06-4
04
09/0
6/91
<20
<20
<20
<20 <.
02
<20
<20 30 <50
Qua
lity-
assu
ranc
e sa
mpl
es
Rea
gent
-
wat
er
spik
e
08/2
7/91
491
504
427
424 1.
8
442
447
449
+
331
Mat
rix-
wat
er
spik
e
09/1
0/91
390
400
320
370 1.
5
340
350
320
+
240
Trip
bl
ank
08/2
7/91
<20
<20
<20
<20 <.
02
<20
<20 30
+
<50
Trip
bl
ank
08/3
0/91
<20
<20
<20
<20 <.
02
<20
<20 50
+
<50
Equ
ipm
ent
blan
k
08/2
7/91
<20
<20
<20
<20 <.
02
<20
<20 50
+
<50
1 El P
aso
Wat
er U
tiliti
es-P
ublic
Ser
vice
Boa
rd w
ell i
dent
ifica
tion
num
ber i
s in
par
enth
eses
.2 C
orre
cted
val
ue, c
ompo
und
foun
d in
mat
rix
wat
er u
sed
for
spik
e.3
Sam
ple
prod
uced
aft
er 2
4,00
0 ga
llons
of w
ater
had
bee
n pu
mpe
d fr
om th
e aq
uife
r.4
Sam
ple
prod
uced
aft
er 1
82,0
00 g
allo
ns o
f w
ater
had
bee
n pu
mpe
d fr
om th
e aq
uife
r.5
Sam
ple
prod
uced
aft
er 3
36,0
00 g
allo
ns o
f wat
er h
ad b
een
pum
ped
from
the
aqui
fer.
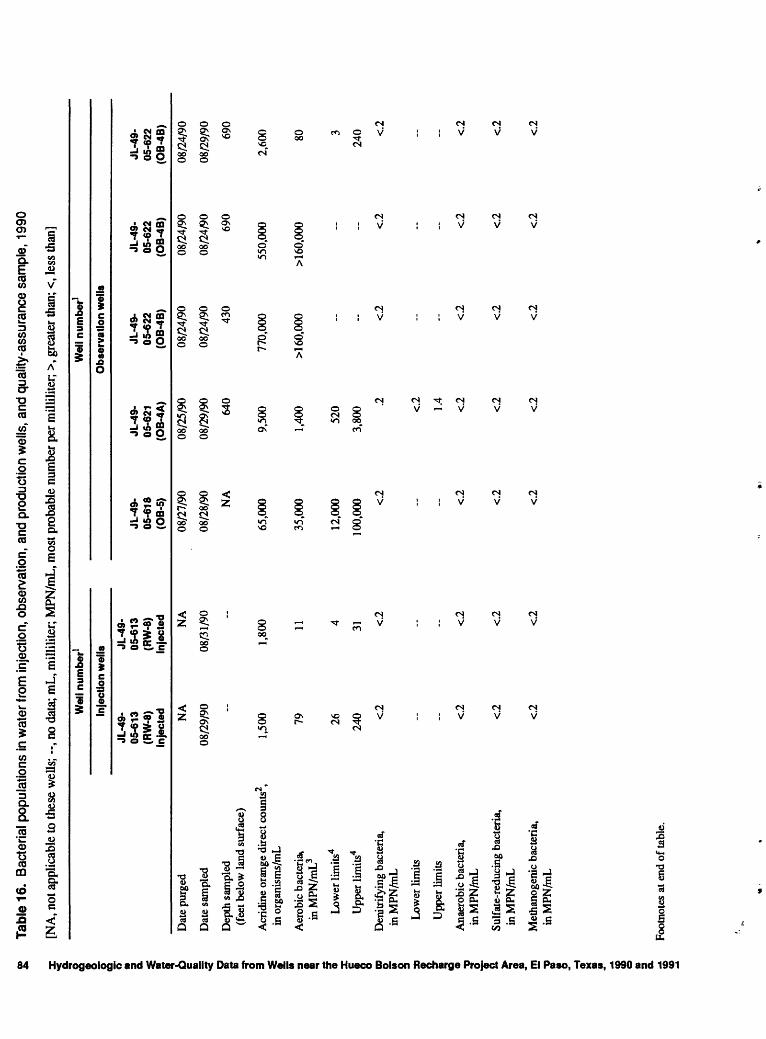
Tabl
e 16
. B
acte
rial p
opul
atio
ns in
wat
er fr
om in
ject
ion,
obs
erva
tion,
and
pro
duct
ion
wel
ls, a
nd q
ualit
y-as
sura
nce
sam
ple,
199
0
1o. <2 g o s 0 a i 6 S 1n i i » 3 8 a z 00 § o 3 3D 1 a TJ 1
I I m jo S 5* 8
[NA
, not
app
licab
le to
thes
e w
e
Dat
e pu
rged
Dat
e sa
mpl
ed
Dep
th s
ampl
ed(f
eet b
elow
land
sur
face
)
Acr
idin
e or
ange
dir
ect c
ount
s2,
in o
rgan
ism
s/m
L
Aer
obic
bac
teria
*in
MPN
/mL3
Low
er li
mits
4
Upp
er li
mits
4
Den
itrif
ying
bac
teria
,in
MPN
/mL
Low
er li
mits
Upp
er li
mits
Ana
erob
ic b
acte
ria,
in M
PN/m
L
Sulf
ate-
redu
cing
bac
teri
a,in
MPN
/mL
Met
hano
geni
c ba
cter
ia,
in M
PN/m
L
lls; -
-, no
dat
a; m
L, m
illili
ter;
MPN
/mL,
mos
t pro
babl
e nu
mbe
r per
mill
ilite
r; >,
gre
ater
than
; <, l
ess
than
]
Wel
l num
ber1
Wel
l num
ber1
Inje
ctio
n w
ells
O
bser
vatio
n w
ells
JL-4
9-
JL-4
9-05
-613
05
-613
JL
-49-
JL
-49-
JL
-49-
JL
-49-
(RW
-8)
(RW
-8)
05-6
18
05-6
21
05-6
22
05-6
22in
ject
ed
inje
cted
(O
B-5
) (O
B-4
A)
(OB
-4B
) (O
B-4
B)
NA
N
A
08/2
7/90
08
/25/
90
08/2
4/90
08
/24/
90
08/2
9/90
08
/31/
90
08/2
8/90
08
/29/
90
08/2
4/90
08
/24/
90
NA
64
0 43
0 69
0
1,50
0 1,
800
65,0
00
9,50
0 77
0,00
0 55
0,00
0
79
11
35,0
00
1,40
0 >1
60,
000
>160
,000
26
4 12
,000
52
0
240
31
100,
000
3,80
0
<.2
<.2
<.2
.2
<.2
<.2
<-2
1.4
<.2
<.2
<.2
<.2
<.2
<.2
<.2
<.2
<.2
<.2
<.2
<.2
<.2
<.2
<.2
<.2
<.2
<.2
JL-4
9-05
-622
(OB
-4B
)
08/2
4/90
08/2
9/90 690
2,60
0 80 3
240 <.
2
-- -- <.2
<.2
<.2
^
Foot
note
s at
end
of t
able
. <o

Tabl
e 16
. B
acte
rial p
opul
atbn
s in
wat
er fr
om in
ject
ion,
obs
erva
tbn,
and
pro
duct
ion
wel
ls, a
nd q
ualit
y-as
sura
nce
sam
ple,
199
0-C
ontin
ued
Wel
l num
ber1
Obs
erva
tion
wel
ls-C
ontin
ued
Dat
e pu
rged
Dat
e sa
mpl
ed
Dep
th s
ampl
ed
(fee
t bel
ow la
nd s
urfa
ce)
Acr
idin
e or
ange
di
rect
cou
nts2
, in
org
anis
ms/
mL
Aer
obic
bac
teri
a,
inM
PN/m
L3
Low
er li
mits
4
Upp
er li
mits
4
Den
itrif
ying
bac
teri
a,
in M
PN/m
L
Low
er li
mits
Upp
er li
mits
Ana
erob
ic b
acte
ria,
in
MPN
/mL
Sulf
ate-
redu
cing
bac
teri
a,
inM
PN/m
L
Met
hano
geni
c ba
cter
ia,
in M
PN/m
L
JL-4
9-
JL-4
9-
05-6
25
05-6
26
(OB
-7A
) (O
B-7
B)
08/2
6/90
08
/26/
90
08/2
7/90
08
/28/
90
605
605
190,
000
140,
000
>1 6
0,00
0 >1
60,
000
.. - <.2
<.2
-- <.2
<.2
<.2
<.2
<.2
<2
JL-4
9-
06-4
05
(OB
-1)
08/2
8/90
08/2
8/90 NA
2,40
0
2,30
0
880
6,10
0
790 26
2,40
0 <.2
<.2
<.2
Wel
l num
ber1
Prod
uctio
n w
ells
JL-4
9-
JL-4
9-
05-2
04
05-6
03
(41)
(3
2)
08/3
0/90
08
/21/
90
08/3
0/90
08
/21/
90
359-
515
335-
506
and
508-
656
2,20
0 10
,000
180
24,0
00
67
8,90
0
470
64,0
00
<.2
<.2
- <.2
<.2
<.2
<.2
<.2
<.2
JL-4
9-
05-6
04
(34)
08/2
2/90
08/2
2/90
325-
500
and
501-
802
18,0
00
9,40
0
3,20
0
28,0
00 <.2
-- - <.2
<.2
<.2
Qua
lity-
as
sura
nce
sam
ple
Equ
ip
men
t B
lank N
A
08/2
1/90 -
800 <.
2
- - <.2
~ - <2
<.2
<.2
|
1 El P
aso
Wat
er U
tiliti
es-P
ublic
Ser
vice
Boa
rd w
ell i
dent
ifica
tion
num
ber i
s in
par
enth
eses
.2
The
num
bers
of b
acte
ria r
epot
ted
are
belo
w th
e m
inim
um n
umbe
r req
uire
d fo
r st
atis
tical
val
idity
of t
he a
crid
ine
oran
ge d
irec
t cou
nts
met
hod.
3 Th
e M
PN is
def
ined
as
the
num
ber o
f bac
teri
a th
at, m
ore
prob
ably
than
any
oth
er n
umbe
r, w
ould
giv
e th
e re
sults
sho
wn
by th
e m
ultip
le-tu
be b
acte
rial
det
erm
inat
ions
. The
MPN
was
cal
cula
ted
for
each
of t
he fi
ve-t
ube
bact
eria
l det
erm
inat
ions
usi
ng m
etho
ds d
escr
ibed
in A
mer
ican
Pub
lic H
ealth
Ass
ocia
tion
(198
5, p
. 88
0-88
2).
4 Th
e lo
wer
and
upp
er li
mits
of t
he M
PN a
re th
e 95
-per
cent
con
fiden
ce li
mits
of t
he d
istri
butio
n.