hydrogen storage in nanostructured light metal hydrides
TRANSCRIPT

The global energy issues can be solved by the abundantly available hydrogen on earth. Light metals are a compact and safe medium for storing hydrogen. This makes them attrac-tive for vehicular use. Unfortunately, hydrogen uptake and release is slow in light metals at practical temperature and pressure conditions. Catalysts are known to accelerate both processes. This book presents three mechanisms for catalyst actions: as grain refining agents, as a hydrogen vacancy for-mation facilitator, and (in its conventional role) as a hydrogen molecule splitter. Moreover, plentiful hydrogen vacancies are reported from experimental observations in nano-structured light metal hydrides. For specific storage systems, guidelines to select the optimal catalyst are developed based on the exploitable mechanisms.
Hydrogen Storagein
Nanostructured Light Metal Hydrides
by
Sarita Singh
ISBN 978 90 902 4112 8

Hydrogen Storage
in
Nanostructured Light Metal Hydrides

This work is part of the Sustainable Hydrogen Program of the DelftCenter of Sustainable Energy.
Hydrogen Storage
in
Nanostructured Light Metal Hydrides
Proefschrift
ter verkrijging van de graad van doctoraan de Technische Universiteit Delft,
op gezag van de Rector Magnificus prof. dr. ir. J.T. Fokkema,voorzitter van het College voor Promoties,
in het openbaar te verdedigen op woensdag 6 mei 2009 om 10.00 uur
door
Sarita Singh
Master of Science in Physics, Indian Institute of Technology Madrasgeboren te Haridwar, India
Dit proefschrift is goedgekeurd door de promotor:Prof. dr. F. M. Mulder
Copromotor:Dr. S.W.H. Eijt
Samenstelling promotiecommissie:Rector Magnificus VoorzitterProf. dr. F.M. Mulder Technische Universiteit Delft, promotorDr. S.W.H. Eijt Technische Universiteit Delft, copromotorProf. dr. B. Dam Technische Universiteit DelftProf. dr. J.J.C. Geerlings Technische Universiteit DelftProf. dr. P.H.L. Notten Technische Universiteit EindhovenProf. dr. I.M. de Schepper Technische Universiteit DelftProf. dr. A. Schmidt-Ott Technische Universiteit DelftProf. dr. E.H. Brück Technische Universiteit Delft, reservelid
Keywords:Hydrogen storage, neutron diffraction, grain refinement, hydrogen vacancy, phasetransformation, density functional theory.
Cover:Neutron diffraction patterns showing the development of different phases uponheating and deuterium loading of TiCl3-catalyzed NaAlH4 over time.
This research was carried out at:Fundamental Aspects of Materials and EnergyDepartment Radiation, Radionuclides & ReactorsFaculty of Applied SciencesDelft University of Technology
Copyright ©2009 S. Singh
ISBN 978 90 902 4112 8
Printed in the Netherlands by Ipskamp Drukkers

To my parents
for believing in my decisions which made everything possible


Table of contents
List of abbreviations and symbols xi
Acknowledgments xix
1 Introduction 1
1.1 A history of hydrogen for energy . . . . . . . . . . . . . . . . 21.2 Need for a hydrogen economy . . . . . . . . . . . . . . . . . 51.3 Hydrogen storage challenges . . . . . . . . . . . . . . . . . . 71.4 Aim of this thesis . . . . . . . . . . . . . . . . . . . . . . . . . 9
2 Methods 15
2.1 Ball milling . . . . . . . . . . . . . . . . . . . . . . . . . . . . . 152.2 Thin film synthesis . . . . . . . . . . . . . . . . . . . . . . . . 17
2.2.1 Sputtered deposition . . . . . . . . . . . . . . . . . . . 172.2.2 Pulsed laser deposition . . . . . . . . . . . . . . . . . 19
2.3 X-ray diffraction . . . . . . . . . . . . . . . . . . . . . . . . . . 212.4 Electron microscopy . . . . . . . . . . . . . . . . . . . . . . . 232.5 Hydrogen release and uptake . . . . . . . . . . . . . . . . . . 252.6 Neutron diffraction . . . . . . . . . . . . . . . . . . . . . . . . 26
2.6.1 Coherent and incoherent scattering . . . . . . . . . . 302.6.2 Elastic scattering . . . . . . . . . . . . . . . . . . . . . 312.6.3 Neutron diffractometer . . . . . . . . . . . . . . . . . 342.6.4 GSAS . . . . . . . . . . . . . . . . . . . . . . . . . . . . 36
2.7 Ab initio calculations . . . . . . . . . . . . . . . . . . . . . . . 392.7.1 Density functional theory . . . . . . . . . . . . . . . . 40
2.8 Positron depth profiling . . . . . . . . . . . . . . . . . . . . . 43
vii

TABLE OF CONTENTS
3 Mg thin films 49
3.1 Experimental details . . . . . . . . . . . . . . . . . . . . . . . 503.2 Plasma sputter deposited films . . . . . . . . . . . . . . . . . 52
3.2.1 Structural characterization . . . . . . . . . . . . . . . 523.2.2 Pd as a hydrogen splitter at the surface . . . . . . . . 543.2.3 Pd reduces hydrogen sorption temperatures . . . . . 553.2.4 Storage properties . . . . . . . . . . . . . . . . . . . . 583.2.5 Positron analysis . . . . . . . . . . . . . . . . . . . . . 60
3.3 Pulsed laser deposited films . . . . . . . . . . . . . . . . . . . 643.3.1 XRD characterization . . . . . . . . . . . . . . . . . . 643.3.2 Microstructure studies . . . . . . . . . . . . . . . . . . 67
3.4 Conclusions . . . . . . . . . . . . . . . . . . . . . . . . . . . . 71
4 Catalyzed and uncatalyzed NaAlH4 73
4.1 Experimental details . . . . . . . . . . . . . . . . . . . . . . . 754.2 Results . . . . . . . . . . . . . . . . . . . . . . . . . . . . . . . 77
4.2.1 Uncatalyzed NaAlH4 . . . . . . . . . . . . . . . . . . 774.2.2 Catalyzed NaAlH4 . . . . . . . . . . . . . . . . . . . . 81
4.3 Discussion . . . . . . . . . . . . . . . . . . . . . . . . . . . . . 854.3.1 Effect of grain sizes on reversibility . . . . . . . . . . 854.3.2 Hydrogen vacancy formation . . . . . . . . . . . . . . 864.3.3 Grain refinement by the TixAl1−x and NaCl particles 894.3.4 Comparison with Ti-metal catalyzed NaAlH4 . . . . 914.3.5 Hydrogen-deuterium exchange in NaH . . . . . . . . 94
4.4 Conclusions . . . . . . . . . . . . . . . . . . . . . . . . . . . . 95
5 Ab initio calculations on NaH 97
5.1 Computational procedure . . . . . . . . . . . . . . . . . . . . 985.2 Results and discussion . . . . . . . . . . . . . . . . . . . . . . 100
5.2.1 Migration energies and diffusion coefficients . . . . . 1005.2.2 Formation energies for a variety of defects . . . . . . 1055.2.3 Mechanism for abundant vacancies in nano-NaH . . 107
5.3 Conclusions . . . . . . . . . . . . . . . . . . . . . . . . . . . . 111
viii

TABLE OF CONTENTS
6 Si destabilized MgH2 113
6.1 Experimental description . . . . . . . . . . . . . . . . . . . . 1166.2 Powder samples . . . . . . . . . . . . . . . . . . . . . . . . . . 1176.3 Thin film samples . . . . . . . . . . . . . . . . . . . . . . . . . 120
6.3.1 Mg2Si formation in H2 and He atmospheres . . . . . 1206.3.2 Different pathways for Mg2Si formation . . . . . . . 1236.3.3 Possible mechanism for the irreversibility of Mg2Si . 126
6.4 Conclusions . . . . . . . . . . . . . . . . . . . . . . . . . . . . 127
7 TiF3 catalyzed MgH2 129
7.1 Experimental procedure . . . . . . . . . . . . . . . . . . . . . 1307.2 Results . . . . . . . . . . . . . . . . . . . . . . . . . . . . . . . 132
7.2.1 In situ neutron diffraction on TiF3 catalyzed Mg . . . 1327.3 Discussion . . . . . . . . . . . . . . . . . . . . . . . . . . . . . 140
7.3.1 Role of MgF2 as a grain refiner . . . . . . . . . . . . . 1407.3.2 Deuterium vacancies during desorption in MgDx . . 140
7.4 Conclusions . . . . . . . . . . . . . . . . . . . . . . . . . . . . 141
A Fitted patterns on catalyzed NaAlH4 143
B TiF3 catalyzed MgD2: Fitted patterns 147
Summary 150
Samenvatting 156
Bibliography 163
List of publications 177
About the author 179
ix


List of abbreviations and symbols
Abbreviations
2D Two dimensional3D Three dimensionalAFC Alkaline fuel cellbcc Body centered cubicCIF Crystallographic information fileDFT Density functional theoryDIFC Diffractometer constantDOE Department of EnergyDOS Density-of-statesEIA Energy Information AdministrationEOS Equation of statefcc Face centered cubicFIB Focused ion beamGE General ElectricGEM GEneral MaterialsGGA Generalized gradient approximationGM General MotorsGSAS General structure analysis systemhcp Hexagonal closed packedHRTEM High resolution TEMIAHE International Association of Hydrogen EnergyICSD Inorganic crystal structure databaseIEA International Energy AgencyLDA Local density approximationLPG Liquefied petroleum gasNHA National Hydrogen AssociationOECD Organization for Economic Co-operation and DevelopmentOPEC Organization of the Petroleum Exporting Countrieso-Ps Ortho-positroniumPAW Projector-augmented wavePEM Proton exchange membranePLD Pulsed laser deposition
xi

LIST OF ABBREVIATIONS AND SYMBOLS
ppm Parts per millionPP PseudopotentialPSD Plasma sputter depositionPVD Physical vapor depositionQMS Quadrupole mass spectrometerrpm Revolutions per minuteRT Room temperatureSAD Selected area diffractionsc Simple cubicSE Schrödinger equationSEM Scanning electron microscopeTEM Transmission electron microscopyTOF Time-of-flightUS-PP Ultra-soft pseudopotentialsVASP Vienna ab initio simulation packageVEP Variable energy positronXAFS X-ray absorption fine structureXRD X-ray diffraction
Chemical notation
Al AluminumAl(BH4)3 Aluminum tris(tetrahydridoborate)Al2O3 AluminaAr ArgonAu GoldBaReH9 Barium rhenium nonahydrideCl ChlorineCo CobaltCu CopperCH4 MethaneCsCl Cesium chlorideD Deuterium atomD2 DeuteriumGa GalliumH Hydrogen atomH2 HydrogenH2O WaterHe HeliumKBH4 Potassium tetrahydridoborateLaNi5H6 Lanthanum nickel hydrideLi LithiumLiH Lithium hydride
xii

LIST OF ABBREVIATIONS AND SYMBOLS
LiAlH4 Lithium aluminum hydrideLiBH4 Lithium tetrahydridoborateLiTiOx Lithium titanium oxideMg MagnesiumMgD2 Magnesium deuterideMgF2 Magnesium fluorideMgH2 Magnesium hydrideMg2Ni Magnesium nickelMgO Magnesium oxideMgPd Magnesium palladiumMg2Pd Dimagnesium monopalladiumMg2Si Magnesium silicideMg2FeH6 Magnesium iron hydrideMg2NiH4 Magnesium nickel hydrideNa SodiumNaAlH4 Sodium aluminum tetrahydrideNa3AlH6 Sodium aluminum hexahydrideNaBH4 Sodium tetrahydridoborateNaCl Sodium chlorideNaH Sodium hydrideNb NiobiumNb2O5 Niobium oxideNd NeodymiumNd:YAG Neodymium-doped yttrium aluminum garnetNOx Nitrogen oxideO Oxygen atomO2 OxygenPd PalladiumPdAg Palladium silverPdH0.7 Palladium hydrideSi SiliconTa TantalumTi TitaniumTiAl3 Titanium aluminideTiCl3 Titanium chlorideTiF3 Titanium fluorideTiH2 Titanium hydrideTi(OBu)4 Tetrabutyl titanateV VanadiumV2O5 Vanadium oxideW TungstenY3Al5O12 Yttrium aluminum garnet
xiii

LIST OF ABBREVIATIONS AND SYMBOLS
Fundamental constants
c Speed of lighth Planck’s constanth Planck’s constant divided by 2πkB Boltzmann constantNA Avogadro’s constant
Greek symbols
Γ Number of transitions per second between the statesδ Dirac delta functionǫ Exchange correlation energy per electronθ Scattering angleκ Bulk modulusλ Wavelengthµ Chemical potentialν0 Vibrational frequencyξ Diffusion correlation factor depends on the unit cell geometryπ “Pi”, the ratio of a circle’s circumference to its diameterρ Particle densityσ Scattering cross-sectionσtot Total scattering cross-sectionτ Kinetic energyΦ Flux of incoming neutronsχ Concentration of defectsψ Wave functionΨ Total wave functionω Vibrational frequency multiplied by 2πΩ Solid angle in a scattering system
Latin symbols
a1, a2, a3 Basis vectors of a unit cellb Scattering length of a bound nucleib1, b2, b3 Reciprocal vectors of a unit celld Interplanar spacing in a crystald Position vector of atoms within a unit cellD Diffusion coefficientD0 Pre-exponential factor in diffusion equatione Electron
xiv

LIST OF ABBREVIATIONS AND SYMBOLS
e+ PositronE EnergyEf Formation energy of a defect∆ES Energy window for the S parameter∆EW Energy window for the W parameterf Electron form factorF Structure factor of a unit cellg Grain sizeG Universal functional of electron densityG Reciprocal lattice vectorH Hamiltonian operator∆H Enthalpy changeI Number of detected neutrons per secondJ∞ Equilibrium hydrogen permeation fluxk Force constantk Wave vectorK Scherrer constantl1, l2, l3 Integer multipliers of the lattice vectorsl Lattice vector of a crystal latticeL Distance between the moderator source and the detectorLi Distance between the moderator source and the sampleLf Distance between the sample and the detectorm Massm0 Rest massM Molecular massn Integerna Number of atomsN Number of nucleip Pressurep Momentumq ChargeQ Scattering vectorr Space variableR Radius of a grainR Position vector of an atom in a crystalRw Weighted residual in Rietveld refinements Distance of an equilibrium hydrogen atom to a vacancy positionS Shape parameter in positron analysisS Spin of the nucleusT Temperaturet Time variablet1, t2, t3 Integer multipliers of the reciprocal lattice vectorsu Thermal displacement of an atomU Exponent in Debye-Waller factor for isotropic thermal movement
xv
LIST OF ABBREVIATIONS AND SYMBOLS
Uiso Parameter in GSAS, equals to Uv Volume of a unit cell per atomv0 Volume of a unit cellV Interaction potential of a nucleus with another nucleus or electronVbias Bias voltageW Wing parameter in positron analysisxd, yd, zd Coordinates of an atom in a unit cellX Peak shape (broadening) parameter in XRDX, Y, Z Global coordinatesZ Atomic number
Subscripts
c Related to hydrogen contentcal Related to calculated intensitycoh Related to coherent scatteringd Related to index of nucleuseff Related to effective interaction potentialf Related to final stage in a neutron scattering eventF Related to Fermi energyg Related to Band gapH Related to Hydrogenhkl Related to Miller indicesi Related to initial stage in a neutron scattering eventI Related to interstitial hydrogenin Related to input in VASPincoh Related to incoherent scatteringint Related to interfacel Related to index of unit cell in real spacem Related to migration of an atomn Related to neutronN Related to number of nucleiobs Related to observed Intensityout Related to output in VASPV Related to hydrogen vacancyx Real-valued stoichiometric numberxc Related to exchange correlation energy
xvi


Acknowledgments
Preparing this thesis involved many people—and I feel indebtedto all of them. My first thanks go to Stephan Eijt for invitingme to pursue this PhD at the department of Radiation, Reactors
& Radionuclides. His guidance, valuable suggestions, and appreciationgave me confidence and improved the quality of this project. I feel gladthat I had the opportunity to work with Fokko Mulder. It was truly ajoyful and unique learning experience. Fokko’s enthusiasm, detail orien-tation, politeness, and cheerfulness frequently rejuvenated my interest inresearch. Thank you Fokko for becoming my promotor. I am grateful tothe members of my examination committee for the time they dedicatedreading the thesis and their valuable comments.
I am thankful to our management assistants Marianne van Baaren,Nicole Banga, and Ellen Tettelaar for taking care of all administrativetasks, which allowed me to fully concentrate on my work. I thank WalterLegerstee for solving the technical issues that I came across during theexperiments. Many thanks go to Vasili Svechnikov for performing TEMmeasurements, the results of which put an attribute to my research work.I acknowledge the help I received from Jouke Heringa in computer re-lated issues. I thank to Marnix Wagemaker for his help at ISIS duringGEM experiments and the fruitful discussions he provided. I appreciateYulia’s helpful nature, which made me adjust quickly in my new envi-ronment when I started my PhD. Thank you Leon for your assistancein generating Matlab graphs as well as for your friendship. Further, Iam thankful to Anna for refreshing the atmosphere in the office with hercharming smile. Hartelijk bedankt Lucas voor jou hulp in de vertaling van de
samenvatting van deze proefschrift in het Nederlands.
xix

ACKNOWLEDGMENTS
Thank you, my dear friends, Emanuela, Carmen & Carlos, Reshmi &Biju, and Marcela & Wijnand for making my stay in Delft pleasant by justbeing there. I cherish the time we spent together—the nice dinners, themany laughs, the games, and enjoyable outings.
I am thankful to Prof. G. Srinivasan from Raman Research Institute inBangalore and Prof. V. Balakrishnan from Indian Institute of TechnologyMadras for their motivating lectures, encouraging discussions, recom-mendations, and confidence in me and my work.
I thank Thomas’ family—his parents, Yvonne, Shahram, Yonas, andHelene—for providing me a comfortable at-home feeling far away frommy native home. Danke schön Thomas for your company, patience, emo-tional support, and particularly your crucial suggestions on this book.
Last but not least, I express my gratitude to my parents for the reasonI mentioned in my dedication—and for many more. I thank my brothersAkshay and Jitendra for their love, care, and constant feedback, whichhelped me grow professionally. I am pleased to mention my nephewAkash and niece Tanya for bringing happiness into my life at every mo-ment I think of them.
Delft, February 2009
xx

1Introduction
Hydrogen is the simplest element consisting of only one protonand one electron. It is represented by the letter “H”. Hydrogengas consists of diatomic molecules, where each of the molecules
comprises two hydrogen atoms, commonly expressed as H2. Hydrogenexists as a gas at standard temperature and pressure. It is a colorless,odorless, tasteless gas, and it is lighter than air. Hydrogen is the mostabundant element in the universe. On earth, it is mostly bound in com-pounds such as water, i.e., H2O, or hydrocarbons like natural gas, whichconsists primarily of methane (CH4). Hydrogen is also found in biomass,which includes all plants and animals. However, H2 as a gas is not abun-dant on earth.
Like natural gas, hydrogen is an energy carrier. It can store and de-liver energy in an easily usable form by burning with oxygen. Burningof hydrogen with air gives water as a by product, making it a clean fuel.Because of its high energy content, hydrogen has the potential to powercars, trucks, buses and other vehicles, homes, offices, factories, and evenportable electronic equipment, such as laptops and computers. Realizingthe potential of hydrogen as an energy carrier requires many discoveries,which started with the discovery of hydrogen itself.
1

CHAPTER 1. INTRODUCTION
1.1 A history of hydrogen for energy
Hydrogen was first identified by British scientist Henry Cavendish in1766, and he called it inflammable air, a gas forming water (H2O) whenburned [1]. In 1783, a French chemist Antoine Lavoisier reproducedCavendish’s findings that water is produced on burning the inflammable
air, and named the gas as Hydrogen [2, 3]. The name Hydrogen was de-rived from the Greek words—hydro and genes, meaning water and born of,respectively. The discovery that hydrogen weighs fourteen times lighterthan air made scientists interested to use hydrogen as a buoyant in aero-nautical balloons. Alexandre Cesar Charles, a French scientist, used hy-drogen to fill a balloon for a manned flight in the same year, i.e., 1783.This flight was the first manned flight in a hydrogen filled balloon [4].
In 1800, the splitting of water into H2 and O2 with electricity was dis-covered by William Nicholson, an English chemist, by placing the leadsfrom a battery into H2O, while attempting to reproduce the electric bat-tery invented by the Italian physicist Alessandro Volta. This phenomenonwas named as electrolysis. Nicholson became the first man to produce achemical reaction by electricity [5]. This discovery forced Sir WilliamGrove to think reverse of the electrolysis, to generate electricity from thereaction of O2 with H2, should also be possible. His thought led to thediscovery of the first fuel cell in 1839, which later made him famous asthe Father of the Fuel Cell. However, the term fuel cell was later coined in1889 by chemists Ludwig Mond and Charles Langer, as they attemptedto build the first practical device using air and industrial coal gas [4, 6].
In 1923, a paper by the Scottish scientist J.B.S. Haldane ignited a prac-tical interest in hydrogen as a fuel in Europe after World War I. Thispaper offered the first proposal of the hydrogen-based renewable energyeconomy. Haldane emphasized the probable scarcity of fossil fuels andthe eventual necessity of an alternative source of energy at a time whenthe use of fossil fuels, especially coal was popular [7]. He also pointedout that liquid hydrogen produces three times as much heat per poundas petrol (hydrocarbon fuel). He also mentioned that hydrogen would bea clean fuel—without any emission of smoke. Only later it became clearthat burning H2 in air can produce NOx as a pollutant.
2

1.1. A HISTORY OF HYDROGEN FOR ENERGY
In the following years the interest in hydrogen as a fuel grew evenfurther. The German engineer Rudolf Erren converted trucks, buses, sub-marines and internal combustion engines to run on hydrogen. At thattime, hydrogen was a popular supplement fuel in large dirigibles in bothGermany and England [3,4]. German Ferdinand von Zeppelin promotedthe idea of rigid airships lifted by hydrogen that later were called Zep-pelins. In 1931, an airship named Hindenburg, which was inflated byhydrogen, was built. After ten successful trans-Atlantic flights from Ger-many to the United States, the Hindenburg met a disaster. It burnedinto flames while landing in Lakehurst, Naval Air Station in Manch-ester Township, New Jersey, United States, on May 6, 1937. This acci-dent claimed the life of thirty-six people. This disaster created a negativepublic image of hydrogen gas as being extremely dangerous. However,the most recent analysis of the fire mentions that the fabric covering theairship was the cause for the fire rather than the hydrogen gas [8, 9].
During World War II, the Australian government considered the useof industrial hydrogen to meet the increasing fuel demand and mitigatethe risk of being cut-off of the fossil fuel supply. However, this interestdid not survive for long. The Allied victory made cheap oil and gasolineavailable again, and this led to the death of the interest in hydrogen asfuel [3].
Around 1950, the interest in hydrogen revived again in the contextof fuel cells. In 1959, Francis Thomas Bacon built the Bacon Cell, whichwas capable of producing 6 kW of power and enough to power a weldingmachine. Bacon played a major role in the development of a fuel cell. Heimplemented a number of modifications to the original design of the fuelcell by Grove. He replaced the platinum electrodes with less expensivenickel gauze electrodes. He also substituted the sulphuric acid electrolytewith aqueous potassium hydroxide, a substance less corrosive to the elec-trodes [10]. It was the first alkaline fuel cell (AFC). In late 1959, HarryKarl Ihrig, an engineer for the Allis—Chalmers Manufacturing Company,demonstrated the first fuel cell-powered vehicle [4].
Beginning in the late 1950s and early 1960s, interest in the fuel cell re-newed. NASA (National Aeronautics and Space Administration) wanted
3

CHAPTER 1. INTRODUCTION
to power a series of upcoming manned space flights. Batteries, solar en-ergy, and nuclear power had already been ruled out due to heavy weight,high cost, and high risk, respectively. The fuel cell was considered asa possible solution for an alternative power source by NASA. Sponsor-ships by NASA for the efforts to develop a practical working fuel cellsthat could be used during the space flights, resulted into the develop-ment of the first proton exchange membrane (PEM) fuel cell. GE (Gen-eral Electric) scientists, Willard Thomas Grubb and Leonard Niedrach,modified the original fuel cell design by using a sulphonated polystyreneion-exchange membrane as the electrolyte, and depositing platinum ontothis membrane, respectively. This modified fuel cell ultimately becameknown as the Grubb-Niedrach fuel cell. GE and NASA developed this tech-nology together resulting in its use on the Gemini space project, whichwas the first commercial use of a fuel cell.
In the early 1960s, the Bacon patents for the AFC were licensed by theaircraft engine manufacturer Pratt & Whitney. Pratt & Whitney improvedthe original Bacon design by reducing the weight and designing a longer-lasting fuel cell than the GE PEM design. This improvement resultedin Pratt & Whitney winning a contract from NASA to supply these fuelcells to the Apollo spacecraft. Alkali cells have since been used on mostsubsequent manned United States space missions [11].
The idea of a hydrogen economy was developed already in the 1970s byJohn O’M. Bockris, an Australian electrochemist, who was working as aconsultant with GM (General Motors). His ambitious energy concept in-volved that the cities of the United States could be supplied with energyderived from the sun and the energy stored using hydrogen. However,GM did not pursue the technology to any significant degree. Neverthe-less, Bockris continued his campaign, and the phrase hydrogen economy,became an important concept [3].
Roger Evan Billings is another important figure in developing the hy-drogen energy. In 1966, at the age of only 16 years Roger Billings modifieda car model of Ford to run on hydrogen and converted many late modelautomobiles to run on hydrogen using their internal combustion engines.Billing is still actively participating in hydrogen energy development [12].
4

1.2. NEED FOR A HYDROGEN ECONOMY
Further, the fuel crisis in 1973 raised the scientific interest in hydrogen.This led to the creation of organizations such as the International Asso-ciation for Hydrogen Energy (IAHE) in 1974 and the National HydrogenAssociation (NHA) in 1989 [4]. By the early 1980s, the hydrogen economywas thought to be on its way, but the interest in hydrogen disappeared thefollowing decade after a significant drop in the oil prices [3]. During thenext decade, the hydrogen research continued to develop slowly.
In the last decade, issues like global warming, growing energy de-mand, and dependence on imported oil gained political attention andpushed the hydrogen research further. The next sections will highlightin more detail the need of a hydrogen economy, current developmentsand the remaining challenges mainly in the hydrogen storage research,related to this thesis.
1.2 Need for a hydrogen economy
As mentioned earlier, fossil fuels in the form of coal, oil, and naturalgas are the major sources to satisfy energy needs of our society since theindustrial revolution, i.e., the 18th century. Further, the world’s energydemand for energy is increasing, projected to be doubled by 2030 [13](see Figure 1.1), mainly due to the industrialization of developing coun-tries such as China and India. In addition, fossil fuels are finite reservesthat are progressively difficult to recover. The use of fossil fuels for en-ergy needs in the future endangers the environment, as burning of fossilfuels produces green house gases that result into global warming. Fur-ther, most countries cannot produce enough oil to meet demands, so theyimport it from oil-rich countries—OPEC (Organization of the PetroleumExporting Countries), creating an economic political dependence. Theseare some key factors which lead countries throughout the world to lookfor alternative energy resources that are renewable, abundant, secure, en-vironmentally benign, and cost effective.
One of the solutions to deal with the above mentioned issues is tomove to renewable energy resources such as solar, wind, hydro, andgeothermal power energy. In view of the intrinsic intermittent nature
5

CHAPTER 1. INTRODUCTION
En
erg
y u
sag
e p
er y
ear
[10
18J]
1990 1995 2000 2005 2010 2015 2020 2025 20300
100
200
300
400
500
600
700
OECD Non-OECD Total world
Time [year]
History Projection
Figure 1.1 – Estimated growth of demand of energy by the world pop-ulation [13]. OECD stands for Organization for Economic Co-operationand Development.
of these sources, a fuel as energy carrier and effective energy storage be-fore use of the energy is required. Hydrogen is attractive as a clean fuel(exhaust water only) because of its high energy content and because itcan be produced from only water H2O, which is abundant, and energy.Only 8 kg of hydrogen, equivalent to 24 kg of petrol, is needed for thecombustion engine version in on-board vehicles to cover 400—500 km ofdistance without refilling the tank [14]. However, hydrogen is a gas at am-bient temperature and pressures, and 8 kg of hydrogen occupy a volumeof 90 m3, corresponding to a balloon of roughly 6 m in diameter. Thisposes a challenge to use it for on-board applications in practice, becausecompact hydrogen storage is required [14].
6

1.3. HYDROGEN STORAGE CHALLENGES
1.3 Hydrogen storage challenges
One of main challenges to move to the hydrogen economy is to store itin a compact, safe, energy efficient, and cost effective way. Hydrogencan be stored in a number of ways such as in tanks as compressed gas(>400 bar) or as a liquid. Hydrogen can also be stored in materials, andis then subsequently released upon heating the materials. Storing hy-drogen in a solid is very attractive because in this way larger quantitiesof hydrogen can be stored in smaller volumes at low pressures and attemperatures close to room temperature. Metal hydrides can be used forhydrogen storage. A number of metal hydrides exist such as ionic hy-drides (LiH, MgH2, and NaH), complex hydrides (Mg2NiH4, NaAlH4),metallic interstitial hydrides (PdH0.7, LaNi5H6), and chemical hydrides(NaBH4). A good metal hydride should possess a number of qualitiessuch as a high hydrogen content (expressed in wt.%), fast reversible H2
absorption, operating temperatures not far from ambient, safe operationconditions, and cost effectiveness for commercial considerations. One ofthe most basic requirements is to have a high hydrogen content, which issatisfied by light-element (low-Z) hydrides, making them potential can-didates for hydrogen storage (see Figure 1.2). MgH2 and NaAlH4 areamong the potential hydrides which possess a high hydrogen content.MgH2 shows 7.6 wt.% of hydrogen storage capacity, and NaAlH4 canstore up to 5.5 wt.% of hydrogen [15].
Potential candidates and practical issues
Despite of a number of advantages such as high hydrogen content, cheapcost, easy availability, and easy manufacturing, pure MgH2 can not beused for practical application because of its slow sorption kinetics andhigh operational temperature, i.e., >280 °C. A significant progress hasbeen made in recent years to improve the sorption kinetics in MgH2 bymaking nano-crystalline particles in combination with suitable catalysts1
[16–20]. Further, MgH2 also shows a long-term cycling stability up to 2000cycles [21]. However, the high desorption temperatures of MgH2 urges
1MgH2 shows superior kinetics upon addition of Nb, V, Nb2O5, or V2O5 as a catalyst.
7

CHAPTER 1. INTRODUCTION
♦
0 5 10 15 20 25
Hydrogen capacity [wt.%]
Vo
lum
etr
ic H
2 d
en
sity
[kg
m-3]
0
20
40
60
80
100
120
140
160
LiBH4
Pressurized H2
in steel and composite material tank
Liquid H2
tank system
Al(BH4)
3
LiH
LiAlH4
NaBH4
MgH2
NaAlH4
KBH4
Mg2NiH
4
Mg2FeH
6
BaReH9
LaNi5H
6
FeTiH1.7
Hydrocarbons(gasoline, LPG, natural gas)
DOE targets 2010
DOE targets 2015
Figure 1.2 – A comparison of metal hydrides, pressurized tanks, liq-uid hydrogen tanks, and hydrocarbons is presented [15]. MgH2 andNaAlH4 are examples of a few potential candidates for hydrogen stor-age because of their relatively high hydrogen capacity. LPG stands forliquefied petroleum gas. The US Department of Energy (DOE) materialtargets for 2010 and 2015 are shown by dashed lines. The DOE mate-rial targets do not include the weight of the tank containing the metalhydrides.
one to look for systems which can be operated at lower temperatureswhile still having the high hydrogen content. Such an approach leads, forexample, to different compounds like NaAlH4, which shows a reversiblecapacity of 4.5 wt.% at temperatures in the range of 80—150 °C with theaddition of suitable catalysts2 [22, 23].
Another approach to deal with the high desorption temperature ofMgH2 is to combine MgH2 with other binary hydrides or elements which
2NaAlH4 is irreversible without addition of a catalyst. Among many different cata-lysts, Ti-based compounds make the reaction reversible.
8

1.4. AIM OF THIS THESIS
can lead to a significant increase in the equilibrium pressure, i.e., loweringof the overall enthalpy for dehydrogenation [24]. Such a second approachto address the thermodynamic constraints is to combine, for example,MgH2 with Si. The enthalpy of formation is reduced because now Mg2Siis formed upon H2 release. The desorption of MgH2 in the presence ofSi indeed leads to increased equilibrium H2 pressure at 300 °C, but at theexpense of a certain decrease in the hydrogen capacity to 5.0 wt.% [24].
1.4 Aim of this thesis
In these two promising approaches, many light metal hydrides neverthe-less suffer from slow reaction kinetics, making it difficult to use them forapplications. It is important to know the factors which affect the reactionkinetics in order to improve them. Several factors which can influencethe reaction kinetics, such as the dimensions of particles and grain sizes,defects like atom vacancies and grain boundaries, and appropriate cat-alysts and their homogeneous dispersion. For example, the presence ofa hydrogen bond splitter facilitates the reaction kinetics. Further, nano-dimension (<150 nm) grains provide a shorter diffusion path for H atoms,as compared to micro-dimension grains (≥1 µm) distances. This resultsin relatively fast sorption. In addition to the smaller grain sizes, vacanciesand grain boundaries further facilitate the diffusion in metals (solids).
Grain refinement and vacancies in catalyzed light metal hydrides
A homogeneous mixing of the catalysts and the reduction of particles andgrains to nano-dimensions (<150 nm) can be achieved simultaneouslyusing high energy ball milling. However, as will be shown in this thesisand was previously shown for MgH2 in [20, 25], some of the hydridesgrow in sizes during hydrogen cycling although the initial particle (grain)sizes are nanoscopic. Because the nanoscale dimensions of particles thendisappear, this will present a barrier on H2 cycling, and may affect thereaction kinetics. Therefore, a mechanism is needed, which can facilitatethe maintenance of grain sizes to a nano-dimension during H2 cycling.
9

CHAPTER 1. INTRODUCTION
One promising mechanism by which various additives could controlthe grain growth during the hydrogen cycling is presented in this thesis.In particularly, two model system MgH2 and NaAlH4 were investigated.The presented mechanism to arrest the grain sizes can probably be appli-cable to the more general field of metal hydrides for reversible hydrogenstorage.
In the field of metal hydrides, a well established concept for the roleof the catalysts is that they help in splitting the hydrogen bond at thesurface of the material. It is thus intrinsically assumed that breaking hy-drogen bonds is the rate limiting step in the sorption kinetics. If the(de)hydrogenation kinetics is dependent only on the hydrogen splittingat the surface, the addition of a hydrogen splitter alone would be suffi-cient to improve the reaction kinetics. Transition metals are known to actas catalysts, and are known to be good hydrogen molecule splitters. In-terestingly, there is no unique catalyst, i.e., hydrogen splitter for all lightmetal hydrides. Different metal hydrides require different catalysts. Forexample, TiCl3 shows superior catalytic activity for NaAlH4 by makingthe reaction reversible and increasing the kinetics simultaneously. Thatnot just any hydride forming transition metal can be used may indicatethat these catalysts (additives) play an additional role besides dissociatingH2 during sorption reactions.
Grain refiner An additional role of the catalyst as a grain refiner is intro-duced in this thesis. It is suggested that the added catalysts (additives)form a new compound (alloy) by reacting with the other elements avail-able. Subsequently, these alloys act as nucleation centers for the phases(metal or metal hydride) formed during H2 sorption, and in this wayrestrict the growth of crystallites. The phase that acts as a nucleationcenter is known as the grain refiner, and the process is called grain refine-ment [26,27]. One of the prerequisite of the grain refining action to occuris to have a good structural and chemical lattice matching between thenucleus and the growing phase (metal or metal hydride).
Such additional formation makes it very likely that only a certaingroup of catalysts will work for a certain (complex) metal hydride. Not
10
1.4. AIM OF THIS THESIS
every catalyst will give rise to an alloy which shares the same crystal-lographic structure with the hydride or with the other occurring phasesduring the hydrogen cycling. Besides a good lattice matching, a suffi-cient concentration and a good dispersion of these nucleation centers isrequired to have an effective grain refining action. Further, the result-ing size of the metal or metal hydride phase depends on the amount ofnucleation centers. A high density of nucleation centers leads to finergrains.
Hydrogen vacancies Due to the altered characteristics such as the sur-face to volume ratios and the influence of interface and surface ener-gies, the thermodynamics of H2 sorption in small crystallites may be al-tered [20, 28]. For this reason, depending on gas (H2 or D2) pressure andtemperature, small crystallites may contain hydrogen vacancies, whichfurther facilitate the reaction kinetics. A possible origin of these vacan-cies can be related to interfaces, nanostructure, or the catalyst. There-fore, grain refiners facilitate the reversibility by keeping crystallites small,reducing the diffusion path and in addition improve diffusion by pro-viding vacancies and shorter diffusion path in the nano-sized crystallites(<150 nm).
Synopsis
The structural evolution at the nanoscale was investigated during hydro-gen release and uptake for light-weight metal hydrides using advancedcharacterization techniques and theoretical studies. In particular MgH2
and NaAlH4 were considered to be the model systems. Advanced anal-ysis methods such as X-ray and neutron diffraction, electron microscopy,and positron depth profiling were applied. Moreover, ab initio calcula-tions based on density functional theory were performed. A basic intro-duction of the techniques and methods used for the work is presented inChapter 2.
Pd-capped Mg thin film studies show that the Pd catalyst acts as hy-drogen bond splitter. The impact of the presence of a Pd cap-layer onthe hydrogen sorption kinetics and temperatures of uptake and release is
11

CHAPTER 1. INTRODUCTION
much higher than that of the nano-columnar grain structure. A marten-sitic like phase transformation from Mg to MgH2 occurs with an orien-tation relationship of Mg (0002)||MgH2 (110). Additionally, electronicstructure changes of metal hydride thin films used as hydrogen switch-able mirrors and hydrogen sensors can be obtained using the positrondepth profiling technique.
The following chapters show results and discussion to support theideas that the catalyst acts as grain refiner for TiCl3-catalyzed NaAlH4,Nb2O5-catalyzed and Si-destabilized MgH2, and TiF3-catalyzed MgD2.Further, this study also shows experimentally observed hydrogen va-cancy formation in Na3AlH6, NaH, and in MgD2 nano-crystallites. Abinitio calculations show that vacancies increase the reaction kinetics bydecreasing the migration barriers; and consequently increase the diffu-sion. A model of the interface of NaH with NaCl, the latter acting as anucleation center, was evaluated as one way to explain the large amountof hydrogen vacancies in nano-NaH observed experimentally in TiCl3-doped NaAlH4 upon hydrogen cycling. The calculated low interface en-ergies support the view that NaH grows easily on NaCl nucleation cen-ters, and assists the idea of the role of NaCl as grain refiner for NaH.Additionally, local transformations associated with the solid state reac-tions for Mg-Si bilayer thin films capped with Pd were also studied.
In conclusion, this study shows that key ingredients to improve thereaction reversibility and kinetics are the maintenance of crystallite sizesto the nanoscale and the presence of vacancies during hydrogen cycling.Therefore, a right choice of a catalyst, which from its reaction productscan provide a grain refining action, is needed for light-metal hydrides toimprove the reaction kinetics.
12


2Methods
Tailoring the particle size to nano-dimensions is one of the possibleways to overcome the barriers, such as slow reaction kinetics andirreversibility, for practical applications of hydrogen storage ma-
terials. Ball milling is a commonly used technique to achieve nanoscaleparticle as well as grain sizes. The technique also allows an easy mixingwith catalysts, and enables scaling up to industrial applications. Thinfilm synthesis is another technique to achieve nanostructured materials.Additionally, thin films offer a number of advantages such as a control onthe interface, a control over the layer thickness and a flexibility to tailorboth the composition and the degree of crystallization. Both methods,ball milling and thin film synthesis, have been used to prepare materials,and a number of techniques were used to study these samples for thisresearch.
2.1 Ball milling
The technique involves crushing and disintegration of powders by highenergy collisions with the grinding balls in the grinding bowl of a plan-etary ball mill. The grinding bowl, containing the grinding balls and thematerial to be ground, rotates about its own axis on a main supporting
15

CHAPTER 2. METHODS
Rotation of thegrinding bowl
t tottoooooooRoRRoRRoRRRRoRRRRRRRRRRRRRRRR
Mov
emen
t of th
e s
uppo
rtin
g di
sk
Figure 2.1 – Schematic diagram showing the working principle of ballmilling [29].
disc, which is rotating rapidly in the opposite direction (see Figure 2.1).The motion results into large centrifugal forces which act upon the grind-ing balls and the material. In planetary action, the centrifugal forces al-ternately add and subtract. With this configuration, the centrifugal forcecauses the material and grinding balls to separate from the inner wall ofthe grinding bowl at a certain speed. The grinding balls cross the bowlwith a high speed and hit the opposite bowl wall covered with the mate-rial, and grind the material due to the impact against the inner wall. Thereduction of particle and grain sizes in the powder is mainly due to thefrictional effect, caused by the movement of balls along the inner walls ofthe grinding bowl, and the impact effect, caused by balls hitting the op-posite wall of the grinding bowl [29]. The resulting average size dependson the number of balls, the size of the balls, the rotational speed, and thetime of grinding. These parameters should be chosen carefully in orderto obtain the desired sizes.
A Fritsch Pulversette 6 planetary monomill was used to prepare nanos-tructured powders and a homogeneous mixing of catalysts. A stainlesssteel bowl of 80 ml and 32 stainless steel balls with a diameter of 10 mmwere used. A sufficient amount of the powder to be ground (2—3 g) was
16

2.2. THIN FILM SYNTHESIS
placed on top of the grinding balls in the bowl. The assembly of theclosed bowl, containing balls and the powder to be ground, was weighedin order to set a counterweight to compensate for the mass imbalancebefore the milling. The powder was ground for a period for 60 min witha 15 min pause time after 15 min rotation with a rotational speed of400 rpm.
The handling of all powders was done in the glove box containing Ar-gon (Ar) as a working inert gas with the O2 and H2O content of ≤0.1 ppm.All powders (except the hydrides) and equipment such as balls, bowl, andspatula, etc., were baked out in a vacuum oven at 60 °C for a few hours be-fore bringing them into the glove box. The lid of the bottle (empty or filledwith powders) was opened slightly before keeping it in the antechamber,and flushing was done slowly. All bottles in the glove box containingpowders were closed tightly and further sealed with a Parafilm (aroundthe lid) to make sure that they are sealed after use.
After the milling process, the bowl was emptied in the glove box. Forfurther cleaning, 2—3 g of Alumina or aluminum oxide (Al2O3) powder(0.5 µm)1 was milled for 10 min with the same number of balls at 400 rpm.After the milling, the bowl was emptied in the glove box or fume hood,and further washed with water.
TiCl3-catalyzed and uncatalyzed NaAlH4 samples were prepared inthe laboratory of Prof. Dr. J. Huot, Université du Québec à Trois Rivières,Québec, Canada using Spex 8000 and similar procedures (see Section 4.1).
2.2 Thin film synthesis
Two types of film deposition methods, plasma sputter deposition andpulsed laser deposition techniques, were used to prepare the films.
2.2.1 Sputtered deposition
Plasma sputter deposition (PSD) is a physical vapor deposition (PVD)method. PSD is a very versatile tool to control the layer thickness, which
1For a better cleaning, a crystallite size of Al2O3 powder of ≥1 µm is recommended.
17

CHAPTER 2. METHODS
depends on the preparation conditions [30]. In this technique, ejectionof atoms occurs from a target upon collision of energetic noble gas ions,and these ejected atoms travel and are deposited onto a substrate placedopposite of the target (see Figure 2.2). In sputter deposition, a noblegas such as Ar is ionized by electrons, which are emitted from a fila-ment. These ions will bombard the target, which is at a high negativepotential, resulting into ejection of atoms from the target. The removedatoms, having substantial kinetic energies, are deposited on the substratemaintained at a relatively positive potential. The ejected atoms have awide distribution of energy, typically as high as a few of electron volts.Not all ejected ions reach the substrate, only ions with sufficient energywill reach the substrate. The energy with which these ions arrive at thesubstrate depends on the distance to the target in combination with theworking Ar pressure during the process.
Figure 2.2 shows the setup used to prepare the sputtered thin films.An Ar plasma at a pressure in the range of typically (1—3)×10−6 bar wascreated using a bundle of electrons, which were emitted from a tungsten(W) filament using a current of 3.5 A. A voltage of 70 V was used onthe magnet coils to straighten the ejected electrons into a bundle. A highnegative potential was imposed on a target up to −500 to −1000 V, andthe voltage on the substrate was in the range of 0 to −200 V i.e., at apotential relatively positive to the target potential. The temperature atthe substrate was in the range of approximately 30—50 °C dependingon the deposition conditions. The distance between the target and thesubstrate was maintained to 10 mm. The application of −500 V for 5 mingives a thickness of 50—100 nm of Palladium (Pd) depending on the Arpressure. These thicknesses were different for other target materials suchas Magnesium (Mg) and Silicon (Si) targets (see Ref. [31]).
The cleaning process of a target was performed before each film de-position using Ar bombardment; the substrate was screened by a shutter.After cleaning the target, the shutter was removed and a film of desiredmaterial was deposited on the substrate.
18

2.2. THIN FILM SYNTHESIS
e-e-
Shutter
Substrate
Magnet
Target 3(Pd)
Target 1 (Mg)
Target 2(Si)
Filament (W)
Plasma (Ar)
Y
X
Target 2(Si)
Target 3(Pd)
Target 1(Mg)
To pumps
Shutter
Substrate
Ar inlet
Y
Z
Plasma (Ar)
Figure 2.2 – Schematic diagram of plasma sputter deposition setup.
2.2.2 Pulsed laser deposition
Pulsed laser deposition (PLD) technique is one of the newer techniquesfor depositing thin films. The PLD technique differs from sputtering intwo main features, namely (i) the high energy of the evaporated speciesinvolves both neutral atoms and ions; and (ii) the discontinuity of thedeposition process corresponding to high instantaneous deposition rates[32]. Thus, laser deposition favors the formation of non-equilibrium films,as previously also observed for metal hydride films [33, 34]. The PLDconfiguration contains a high-power laser located outside the vacuumdeposition chamber. External lenses are used to focus the laser beamonto the target surface, which acts as a evaporation source. A solid state
19

CHAPTER 2. METHODS
Laser
Mirror
Focusing lens
Target
Substrate
Target holder
Pulsed laserbeam
Figure 2.3 – Illustration of the pulsed laser deposition setup.
Nd3+:YAG (1064 nm) or Nd:Y3Al5O12 (Neodymium-doped yttrium alu-minum garnet) laser is used for PLD. The YAG laser can deliver up toroughly 2 J pulse−1 at a pulse repetition rate of close to 30 Hz. The en-ergy of the laser beam absorbed by the material is converted into thermal,chemical, and mechanical energy, resulting into electronic excitation oftarget atoms, ablation, and plasma formation. Evaporated species suchas neutral atoms, molecules, electrons, ions, atom clusters, micro sizedparticulates, and molten droplets form a plume above the target. Theplume is highly directional, and its contents are pushed to the substrateand form a film after condensation [32].
An in-house built PLD setup (see Figure 2.3) was used.2 The setupcontains a Surelite pulsed Q-switched Nd: YAG laser, producing laserpulses of 5—7 ns with an incident energy of 0.45 J pulse−1. An Ar pres-sure in the chamber was maintained in the range of (1—4)×10−7 bar toget an appropriate cone of the plasma plume. The laser pulses are redi-
2The setup allows to deposit two films simultaneously.
20
2.3. X-RAY DIFFRACTION
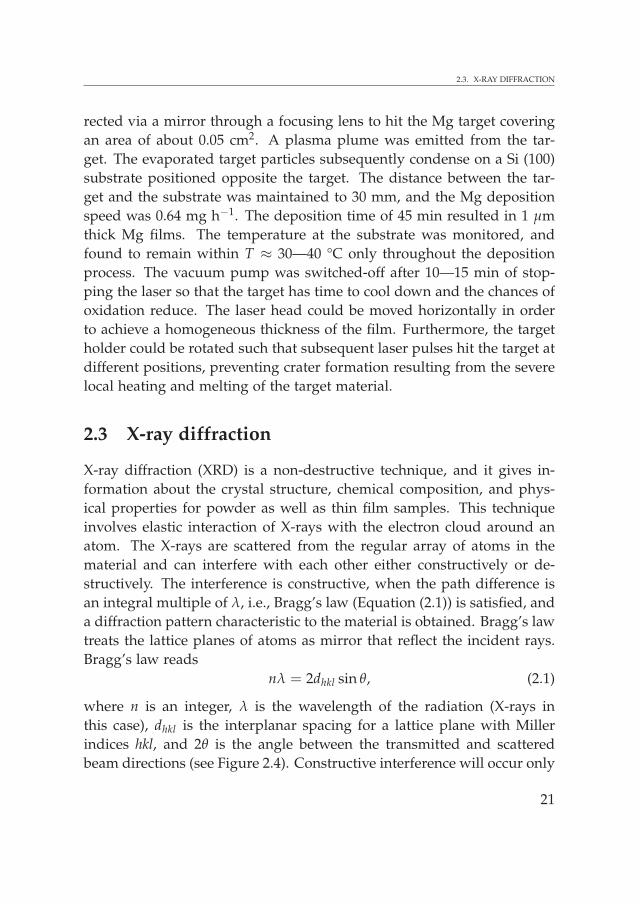
rected via a mirror through a focusing lens to hit the Mg target coveringan area of about 0.05 cm2. A plasma plume was emitted from the tar-get. The evaporated target particles subsequently condense on a Si (100)substrate positioned opposite the target. The distance between the tar-get and the substrate was maintained to 30 mm, and the Mg depositionspeed was 0.64 mg h−1. The deposition time of 45 min resulted in 1 µmthick Mg films. The temperature at the substrate was monitored, andfound to remain within T ≈ 30—40 °C only throughout the depositionprocess. The vacuum pump was switched-off after 10—15 min of stop-ping the laser so that the target has time to cool down and the chances ofoxidation reduce. The laser head could be moved horizontally in orderto achieve a homogeneous thickness of the film. Furthermore, the targetholder could be rotated such that subsequent laser pulses hit the target atdifferent positions, preventing crater formation resulting from the severelocal heating and melting of the target material.
2.3 X-ray diffraction
X-ray diffraction (XRD) is a non-destructive technique, and it gives in-formation about the crystal structure, chemical composition, and phys-ical properties for powder as well as thin film samples. This techniqueinvolves elastic interaction of X-rays with the electron cloud around anatom. The X-rays are scattered from the regular array of atoms in thematerial and can interfere with each other either constructively or de-structively. The interference is constructive, when the path difference isan integral multiple of λ, i.e., Bragg’s law (Equation (2.1)) is satisfied, anda diffraction pattern characteristic to the material is obtained. Bragg’s lawtreats the lattice planes of atoms as mirror that reflect the incident rays.Bragg’s law reads
nλ = 2dhkl sin θ, (2.1)
where n is an integer, λ is the wavelength of the radiation (X-rays inthis case), dhkl is the interplanar spacing for a lattice plane with Millerindices hkl, and 2θ is the angle between the transmitted and scatteredbeam directions (see Figure 2.4). Constructive interference will occur only
21

CHAPTER 2. METHODS
C dhkl
D B
Aθθ
θ
A
D
C
θd
hkl
DC+CB = nλ
Incidentwaves
Reflectedwaves
Figure 2.4 – Schematic showing Bragg’s Law.
when the path difference between the waves scattered from successivelayers of atoms is a multiple of the wavelength of the incident beam, andgives rise to Bragg reflections only in certain well defined directions. Forexample, if a single crystal is placed in the beam, then the scattered beamsare observed in any directions for which Bragg’s Law is satisfied by someset of Bragg planes.
A XRD sample holder having a Kapton covering, with a thicknessof approximately 25 µm, was used to avoid air contact with the sample.The Kapton covering was fixed using a two component glue after a thor-ough cleaning of all the parts using ethanol. Subsequently, the sampleholder was checked for an air tight closing. For XRD, all samples werehandled in a glove box containing Ar as the working gas. The powderwas leveled using a glass plate. Most of the samples were characterizedusing an Bruker-AXS Type D5005 diffractometer with the Cu Kα (1.54 Å)wavelength at the department of DelftChemTech at Delft University ofTechnology.
A few samples were characterized using Co Kα (1.79 Å) with a sim-ilar type of diffractometer at the Department of Mechanical, Maritimeand Materials Engineering at Delft University of Technology. For this re-search, XRD was mainly done to confirm the structure and phases presentin a sample. All XRD diffraction data were treated with Rietveld refine-ment using an interface software program [35]. Mostly, samples were
22

2.4. ELECTRON MICROSCOPY
measured in the 2θ range of 25—85° with a step size of 0.05°. Further,information about the particle sizes were also obtained from peak broad-ening using a formula (Equation (2.2)), where centidegree was convertedto radians, based on the Scherrer’s equation,
g =18000Kλ
Xπ, (2.2)
where g is the grain or crystallite size in Å, λ is the wavelength of X-rays in Å, K is the Scherrer constant, and X is the profile coefficient incentidegree, which was used to fit the broadening of the peak shape.In this approach, however, the effect of strains on the line broadeningis taken care of by another dependence of broadening on the d-spacing.Strain broadening is linear in d-spacing while crystallite size broadeningvaries with d2.
2.4 Electron microscopy
Electron microscopy is based on the interaction of an electron beam withthe material to be investigated, and gives local information about thestructure, morphology, and composition of the material. Electron mi-croscopy comprises of different methods, which are used on the basisof the question to be answered. Techniques like transmission electronmicroscopy (TEM) and selected area diffraction (SAD) are used to learnabout the structure of a sample at the microscopic scale. Transmissionelectron microscope can be used to obtain information in real space orimaging mode and reciprocal space or diffraction mode, almost simulta-neously, making TEM a special technique to study materials on nanoscaledimension. The electron interactions with matter are classified as elasticinteractions and inelastic interactions. In elastic interactions, no transferof energy from the electron to the sample occurs. In this case, the electroneither passes without any interaction (direct beam) or is scattered by thepositive potential inside the electron cloud (diffracted beam).
23

CHAPTER 2. METHODS
Transmission electron microscopy
TEM utilizes the signals from elastically scattered electrons—either in thedirect or diffracted beams. There are different use of transmission elec-tron microscope such as bright field TEM and dark field TEM, high res-olution TEM (HRTEM), and SAD mode. Bright or Dark field TEM areused to detect the crystalline areas, defects and grain boundaries, phaseanalysis and particle size. HRTEM is a good tool for a direct visualizationof the local atomic scale structures and defects.
In this study, both bright and dark field TEM experiments were car-ried out on a number of samples, thin films as well as powders, usinga Philips CM30T microscope at 300 kV. Thin film samples were gluedwith the epoxy glue in between 2 silicon (or glass) plates, and this sand-wiched type formation was thinned down by polishing with 15, 6, 3, 1,and 0.5 µm grade sandpaper. Focused ion beam (FIB) specimens (initialdimensions: 15 µm×5 µm) were cut with ions at 30 kV, with the finalspecimen thickness 100—120 nm. The cut specimens were placed witha micro-manipulator onto a carbon holey grid and examined in TEM.Further, powder specimens were dispersed ultrasonically in 70% ethanol,and then dropped onto the holey carbon grid.
Selected area diffraction
SAD gives local insights into the lattice parameter and crystal symme-try, crystal orientation, and phase analysis. The diffraction mode can beachieved by using a diffraction lens in the transmission electron micro-scope. SAD, similar to XRD, is caused by constructive interference ofscattered waves, and based on the fundamental Bragg’s Law. However,SAD differs from XRD in many terms such as the involved wavelengthof electrons, i.e., 0.0197 Å for 300 keV electrons, is much shorter than thatof X-rays. The diffraction angles in electron diffraction are, therefore,very small i.e., 0—2°, while XRD involves a range of 0—180°. Electronsinteract with both the nucleus and the electrons of the scattering atomsthrough Coulomb forces, resulting in a stronger interaction of electronswith matter than X-rays. This leads to high intensity diffracted electron
24

2.5. HYDROGEN RELEASE AND UPTAKE
beams, and the exposure times in the order of a few seconds only, whileit usually takes minutes or hours to obtain an XRD diffraction pattern.SAD patterns can, therefore, directly be seen on the viewing screen of theelectron microscope. Thus, orienting a crystal along a direction can easilybe achieved by tilting the specimen, while observing the correspondingchanges in the SAD pattern simultaneously. However, the strong inter-action also has its disadvantages, as it leads to multiple scattering, andinfluences the intensities of the reflections. These effects make structuredetermination from SAD more difficult and less reliable than that fromXRD data.
A similar microscope, i.e., CM30T microscope was used for SAD ex-periments to study the samples, and images were obtained on cross-sections of the films using a beam spot size equivalent to about the thick-ness of the film.
2.5 Hydrogen release and uptake
Hydrogen desorption measurements were carried out to quantify the re-leased hydrogen from metal hydrides using an in-house built setup calledHYDRA (see Figure 2.5). The valve 4 divides the setup into its chargingand discharging compartments. The sample was placed in the samplecell, which contains a sample holder that is in contact with an electricalheater (480 °C) and cooling system (−173 °C) using liquid nitrogen. Theheater is isolated from the outer atmosphere by vacuum. The tempera-ture of sample can be varied by using the heater and liquid nitrogen, andis monitored by using a K-type (Chromel—Alumel) thermocouple. A gasinlet was used to charge the sample. The maximum gas pressure whichcan be applied using this setup is up to 10 bar, and can be measured usingthe pressure meter M0 ranging from 1 to 120 bar. The setup has two setsof rotary pumps and turbo(molecular) pumps to approach the vacuumdown to 10−3 mbar and in the range of 10−4—10−10 mbar, respectively.The released hydrogen gas was detected using a quadrupole mass spec-trometer, which was tuned to the mass of desired ions (hydrogen in thiscase) allowing accurate determination of the amount of released hydro-
25

CHAPTER 2. METHODS
gen gas. Simultaneously, the pressure of the released hydrogen gas wasmonitored using pressure meters M1 ranging from 10−4 to 0.1 mbar andM2 ranging from 0.1 to 1000 mbar. The released hydrogen was allowedto pass through a Pd filter to separate the hydrogen gas from the otherpossibly released gases such as H2O or O2 upon heating the metal hy-dride, and was further detected in the quadrupole mass spectrometer.The quadrupole mass spectrometer filters ions based on their mass-to-charge ratio. The amount of hydrogen atoms desorbed from the metalhydride can, therefore, be sensitively determined by quadrupole massspectrometer. The hydrogen content Hc (in wt.%) of the metal hydridecan be subsequently determined using the formula
Hc =
(
MH · (NH/NA)
m
)
× 100, (2.3)
where MH is the molecular mass of hydrogen in g mol−1, NH is thetotal number of released hydrogen atoms, NA is Avogadro’s number(6.0223×10²³ atoms per mole), and m is the initial mass of the metal hy-dride sample.
2.6 Neutron diffraction
Neutron diffraction experiments can be used to investigate crystal struc-tures in a similar manner as X-ray diffraction. Like X-rays, they see in-dividual atoms, but they see each atom and its isotope roughly equallyclearly, independent of the atomic number Z. Neutrons interact withthe nucleus of the atom as their neutrality allows them to penetrate in-side the atoms, while X-rays interact with the electrons in the atom andsee the shape of the electron cloud. The decision to use neutrons ratherthan X-rays depends on the atoms involved for structural studies. Theproperty of neutrons to interact with the nuclei rather than the numberof electrons in the electron cloud make them perfect to probe hydrogen,enabling them to investigate the hydrogen storage materials, and “see”hydrogen next to heavier elements.
Besides a number of advantages of neutrons over other techniques,neutron scattering techniques have some limitations such as in general
26

2.6. NEUTRON DIFFRACTION
Gas inlet
Rotarypump
Turbopump
Quadrupole
Quadrupole
Turbopump
Rotarypump
Samplecell
M0 M2M1
Pd filter
P
2322
3
1 2 4 5
6
9
7 8
10
Discharging compartmentCharging compartment
Figure 2.5 – Schematic illustration of the HYDRA setup showing itscharging and discharging compartments.
neutrons are difficult to produce as compared to X-rays. This results ina relatively limited neutron flux that is available from neutron sources.As a consequence grams of sample are needed, and measurements cantake minutes in favorable circumstances, but hours or up to days in lessfavorable circumstances.
In neutron diffraction, the neutron interacts with the nucleus of atomselastically with no energy transfer from neutrons to the sample duringthe process. However, diffraction involves a transfer in the momentumto the lattice and the long range order of atoms in the material. In thediffraction experiment, a neutron beam irradiates the material that is un-der investigation. These neutrons interact with the atoms of the materialand some of the neutrons get scattered by the nucleus. Mathematically, aneutron with a wave vector ki and energy Ei incident on the sample, and
27

CHAPTER 2. METHODS
Incidentneutrons Scattered
neutrons
Samplek
i, E
i
kf, E
f
Detector
Neutronsource
Q,kf
ki
Scattering triangle
ωθ2
Figure 2.6 – Schematic illustration describing a neutron scattering event.
the neutron wavelength can be deduced using the expression
λi =2π
|ki|. (2.4)
After the scattering event, the neutron is depicted with the vector kf withthe energy Ef. The key variables in a neutron scattering experiment arethe momentum and energy transfer3 of the neutron to the target material,which is represented as
hω = Ei − Ef =h2
2mn
(
k2i − k2
f)
, (2.5)
hQ = h (ki − kf) , (2.6)
where mn is the mass of neutron, h is Planck’s constant divided by 2π,the quantity Q is the scattering vector. The vector relationship betweenQ, ki, and kf can be illustrated in the so-called scattering triangle (seeFigure 2.6). The scattered neutrons are captured in a detector, which is ata certain angle placed relatively far from the sample, making a solid angledΩ (see Figure 2.6). In the scattering measurements, the quantity that ismeasured is the partial differential cross-section, which gives the fractionof neutrons of incident energy Ei scattered into an element of solid angle
3For diffraction, there is no change in energy of the neutron, i.e., no energy transfer.
28

2.6. NEUTRON DIFFRACTION
dΩ with an energy between Ef and Ef + dEf. Mathematically, the partialdifferential cross-section is denoted as
d2σ
dΩdEf=
I
ΦdEfdΩ, (2.7)
where I is the number of scattered neutrons per second and Φ is flux ofthe incident neutrons. The partial differential cross-section includes alsothe inelastic events.
The number of elastically4 scattered neutrons into the solid angle dΩ
counted in the detector is given in terms of differential cross-section
dσ
dΩ=
∞∫
0
(
d2σ
dΩdEf
)
dEf =I
ΦdΩ, (2.8)
which is obtained by integrating Equation (2.7). Further, the total scatter-ing cross-section, a fraction of the total number of neutrons scattered persecond in all directions, is defined as
σtot =∫
all directions
(
dσ
dΩ
)
dΩ. (2.9)
For elastic scattering, the differential cross-section can be calculatedby knowing the probability of a transition from the state defined by thewave vector ki to the state defined by the wave vector kf. This probabilityis given by Fermi’s golden rule
Γki→kf =2π
h
∣
∣
∣
∣
∫
ψ∗kf
V (r) ψkidr
∣
∣
∣
∣
2
ρkf (E) , (2.10)
where Γki→kf are the transitions per second from the initial to the finalstage, V (r) is the interaction potential that causes the transition, in thiscase the interaction between the incident neutron and the target sample,and ρkf (E) is the density of final scattering states per unit energy range.
Now, Equation 2.8 can be rewritten as(
dσ
dΩ
)
ki→kf
=Γki→kf
ΦdΩ. (2.11)
4No transfer of energy to the target sample.
29

CHAPTER 2. METHODS
2.6.1 Coherent and incoherent scattering
The neutron-nucleus scattering is isotropic, and can be characterized by asingle parameter, i.e., the scattering length b.5 The scattering length b canbe complex, and the sign of the real part, negative or positive, dependson the type of nucleus and the energy on of the incident neutron in thescattering process. The imaginary part of b represents absorption, captureof thermal neutrons, which is often, but not always, very small.
Generally, not only different atoms have different scattering lengths,but also each isotope has different scattering lengths. Additionally, thescattering length depends on the spin of the neutron and the nuclearisotope (the latter can be zero). The neutron has a spin 1/2, and supposethe spin of a nucleus is S. Then every non-zero spin nucleus has twovalues of the scattering length, i.e., S + 1/2 or S − 1/2. However, for thenucleus with a zero spin, the neutron-nucleus system can only have spin1/2, i.e., one value of the scattering length.
The interaction potential V (r) due to the lth nucleus for the case ofscattering due to more than one nuclei arranged in a rigid array is givenas
V (r) =2πh2
mn∑
l
blδ (r − Rl) , (2.12)
where N is the number of nuclei arranged in a rigid array, Rl is the po-sition vector of the lth nucleus, and bl is the scattering length of the lthnucleus. Using Equation (2.10), Equation (2.11), and Equation (2.12), thedifferential cross-section can be written as the sum two terms
dσ
dΩ=
(
dσ
dΩ
)
coh+
(
dσ
dΩ
)
incoh, (2.13)
where the coherent cross-section is
(
dσ
dΩ
)
coh=∣
∣
∣bl
∣
∣
∣
2∣
∣
∣
∣
∣
∑l
exp (iQ · Rl)
∣
∣
∣
∣
∣
2
, (2.14)
5In XRD, b is replaced by an electronic form factor f (Q).
30
2.6. NEUTRON DIFFRACTION
and the incoherent cross-section is(
dσ
dΩ
)
incoh= ∑
l
[
|bl |2 −∣
∣
∣bl
∣
∣
∣
2]
, (2.15)
where (dσ/dΩ)incoh is the differential cross-section for coherent scatteringand (dσ/dΩ)coh is the differential cross-section for incoherent scattering.Coherent scattering involves a strong interference between waves scat-tered from each nucleus present in the crystal that have a well defined bl .The coherent scattering will then show strong constructive and destruc-tive interferences resulting in e.g., Bragg peaks. This scattering potentialis proportional to b, thus the coherent scattering cross-section is propor-
tional to∣
∣
∣b∣
∣
∣
2. On the other hand, there is no constructive or destructive
interference in the incoherent scattering at all because it depends on thedeviations of the scattering length from the average.
2.6.2 Elastic scattering
In order to evaluate Equation (2.14), a number of terms related to crystallattices and their reciprocal lattices is required before dealing with thecoherent scattering for a rigid perfect crystal. Repetition of a unit cell pe-riodically in space leads to construction of a perfect crystal. The unit cell,the building block of the crystal, can be defined by the set of three non-coplanar basis vectors a1, a2, and a3 and has a volume v0 = |a1 · (a2 × a3)|.The lattice vector corresponds to the directions in the crystal, and is de-noted as follows
l = l1a1 + l2a2 + l3a3, (2.16)
where l1, l2, and l3 are integers, known as cell indices. For the unit cellcontaining just one lattice site, every site in the crystal can be given by thelattice vectors l (Rl = l). For more atoms in the unit cell, the positions ofthe atoms with in a unit cell can be denoted by vectors d as
Rld = l + d, (2.17)
where d is the position vector to the dth atom within the lth cell, whereeach unit cell contains na atoms.
31

CHAPTER 2. METHODS
For every crystal defined by a vector l as in Equation (2.16), a recipro-cal lattice with vectors G can be defined in such a way that
exp (iG · l) = 1 ∀ l, (2.18)
while G can be written as
G = t1b1 + t2b2 + t3b3, (2.19)
where t1, t2, and t3 are the integers, and b1, b2, and b3 are the basic vectorsof the reciprocal lattice given by
b1 = 2π(a2 × a3)
v0, b2 = 2π
(a3 × a1)
v0, b3 = 2π
(a1 × a2)
v0. (2.20)
From Equation (2.20), the volume of the unit cell of the reciprocal latticecan be given as
|b1 · (b2 × b3)| =(2π)3
v0. (2.21)
Using the terms defined in Equation (2.16), Equation (2.19), and Equa-tion (2.21), Equation (2.14) can be re-written as
(
dσ
dΩ
)
coh= N
(2π)3
v0∑G
δ (Q − G) |FN (Q)|2 , (2.22)
where FN (Q) is the nuclear structure factor of the unit cell, which isdefined as
FN (Q) = ∑d
bd exp (iQ · d) . (2.23)
For crystals for the study, the Debye-Waller factors should be consid-ered, as the position of atoms are shifted from their equilibrium positionat the temperature above T = 0 K. This shift in position due to thermalmotion is given by a time-dependent term as follows
32

2.6. NEUTRON DIFFRACTION
Rld = d + l + u
(
l
d
)
, (2.24)
where d is the position vector to the dth atom within the lth cell, wherethe each unit cell contains na atoms, and u is the displacement from theequilibrium position.
The last term in Equation 2.24 is taken as the thermal average of thethermal displacement, and results as an extra factor in the structure factor.The Debye-Waller factor for an isotropic thermal movement is describedas
exp [−2U(Q)] , (2.25)
where 2U(Q) is given as
2U (Q) =⟨
[Q · u]2⟩
=13
Q2 ⟨u2l
⟩
. (2.26)
The structure factor in the Equation (2.23) can now be written as
FN (Q) = ∑d
bd exp(iQ · d) exp [−Ud (Q)] , (2.27)
with
Ud (Q) =12
⟨[
Q · u
(
l
d
)]2⟩
. (2.28)
The nuclear structure factor contain information about the intensity ofhkl reflection. This means that the intensity depends on the content ofthe unit cell. The atomic positions in the unit cell can be defined asd = xda1 + yda2 + zda3 (0 ≤ xd, yd, zd ≤ 1). Now, the structure factor, i.e.,Equation (2.27), can be re-written as
F (Q = G) =na
∑d=1
bd (G) exp(i2π (hxd + kyd + lzd)) exp [−Ud (Q)] .
The structure factor can become zero for certain positions (xd, yd, zd) andcertain values of hkl, and there will not be neutron scattering for those setof values, but the Laue’s conditions are still fulfilled [36, 37].
33
CHAPTER 2. METHODS
It can be deduced from the Equation (2.1) that two ways can be usedin order to probe the reciprocal space. First method involves a monochro-matic beam of neutrons of the known wavelength, λ, which incidents onthe sample. The elastically scattered neutrons are measured as a functionof scattering angle, 2θ. The second method is known as the time-of-flight(TOF), in which the sample is irradiated with a pulsed white beam con-taining neutrons of many different wavelengths. The neutrons travel aknown distance, L, from a source to the sample to the (fixed) detector,which is positioned at an angle 2θ, and their arrival times at the detectorare recorded. From θ, L, and the arrival times t, the wavelength λ can becalculated.
2.6.3 Neutron diffractometer
A neutron diffractometer, the GEneral Materials diffractometer (GEM)(see Figure 2.8) at the ISIS Facility, Oxfordshire, United Kingdom (UK),was used in order to study the crystallographic positions of the atomswithin the unit cell of a crystalline material. GEM is the most advancedTOF materials neutron diffractometer in the world at the moment [38].Neutrons are produced at ISIS by the spallation process. This processinvolves a spallation neutron source, a tantalum target, which is bom-barded by pulses of highly energetic protons from a powerful accelera-tor. The neutrons are emitted from the highly excited nuclei of the tar-get atoms, and a neutron pulse is emitted as a result of the collisionalong with a modest heat production in the neutron target. Each highenergy proton bombarded to the target results in the production of ap-proximately 15 neutrons on average. Neutrons that are produced in thisprocess generally have high energies and velocities, and are slowed downusing hydrogenous moderators around the target making them useful forcondensed matter studies. The high energy neutrons repeatedly collidewith the hydrogen nuclei and exploits the large scattering cross-sectionof hydrogen for the slowing down of neutrons. These neutrons with re-duced energy, but still in short intense pulses. The so-called moderatedneutrons are guided to the instruments that are grouped around the tar-get [39].
34

2.6. NEUTRON DIFFRACTION
Detector
Moderator
2
Li
Lf
θk
ik
f
λn = h
mn
(Li+L
f)
t
~~~~~
~
~~~~
Figure 2.7 – Schematic of a neutron diffractometer for a pulsed(accelerator-based) neutron source [39].
Figure 2.7 shows a schematic diagram of a typical pulsed neutrondiffractometer at a pulsed neutron source. The TOF technique does notrequire the use of a monochromator as it involves the determination ofthe wavelength of the neutrons. The neutrons travel a known distance L =Li + Lf, from the source to the sample to the detector, which is fixed. Thedetector is positioned at an angle 2θ, and the arrival times of neutrons arerecorded at the detector. In other words, the differential cross-section ismeasured as a function of Q with the detector at a fixed scattering angle,2θ, and Q (or d-spacing) is scanned for a wide range of wavelengths forincident neutrons .
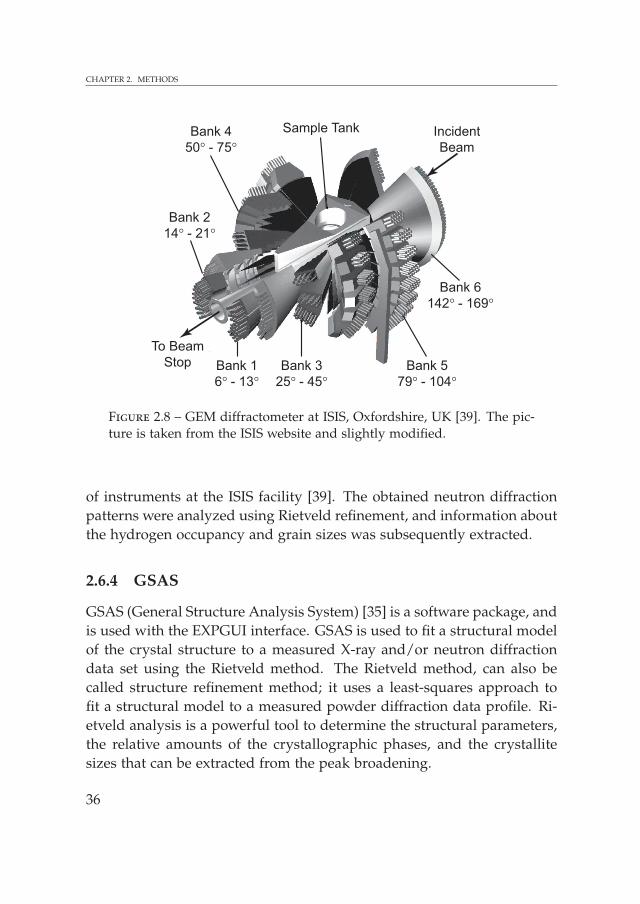
GEM combines an extraordinary neutron count rate with a very largeQ range. GEM has very good resolution in the backward angle detec-tors with ∆Q/Q = 0.2 − 0.3% because of its relatively long incident flightpath of 17 m and the use of large 2θ. GEM has 7290 neutron detectors,which are fixed, and grouped into 7 banks, each with a different range ofaccessible d-spacing (see Figure 2.8). Due to the high signal to noise ra-tios, it is possible to work with fully protonated materials although thesegive a high diffraction background due to incoherently scattered neu-trons. For a diffractometer like GEM, the inelastic scattering is assumedto be relatively small and has no influence on the data analysis becauseit gives a smooth and low background. The ISIS website provides moreinformation on the neutron scattering technique and the different types
35
CHAPTER 2. METHODS
Sample Tank
Bank 6142° - 169°
Bank 579° - 104°
Bank 450° - 75°
Bank 325° - 45°
Bank 214° - 21°
Bank 16° - 13°
IncidentBeam
To BeamStop
Figure 2.8 – GEM diffractometer at ISIS, Oxfordshire, UK [39]. The pic-ture is taken from the ISIS website and slightly modified.
of instruments at the ISIS facility [39]. The obtained neutron diffractionpatterns were analyzed using Rietveld refinement, and information aboutthe hydrogen occupancy and grain sizes was subsequently extracted.
2.6.4 GSAS
GSAS (General Structure Analysis System) [35] is a software package, andis used with the EXPGUI interface. GSAS is used to fit a structural modelof the crystal structure to a measured X-ray and/or neutron diffractiondata set using the Rietveld method. The Rietveld method, can also becalled structure refinement method; it uses a least-squares approach tofit a structural model to a measured powder diffraction data profile. Ri-etveld analysis is a powerful tool to determine the structural parameters,the relative amounts of the crystallographic phases, and the crystallitesizes that can be extracted from the peak broadening.
36

2.6. NEUTRON DIFFRACTION
A known crystal structure is required, which contains informationabout the structural parameters such as its unit cell, the atom positions,occupancy, space group, and thermal parameters. Further, a variety ofinstrumental parameters that describe the experimental conditions suchas peak broadening, position of the sample, etc. are also required. Anumber of background functions can be used to fit the background withan adjustable number of terms. Different background functions are de-veloped and have a different theory to fit different shapes. However, thefirst function "Chebyschev polynomial" is a good option for the vast ma-jority of Rietveld refinements. Subsequently, the software is allowed tooptimize (refine) a small subset of these parameters—a minimal numberof parameters to fit the diffraction pattern. Additional relevant parame-ters can thereafter be selected to be refined, until a good fit is obtained.The goodness of fit can be determined by the reduced chi-square valueand more exactly by the weighted residual for powder diffraction Rw.The residual is a measure of the agreement between the crystallographicmodel and the experimental diffraction data. For a good fit, the valueshould be less than 0.04. Rw can be represented as follows
Rw =
(
∑ w (|Iobs| − |Ical|)2
∑ w|Iobs|2
)12
, (2.29)
where Iobs is the observed intensity and Ical is the calculated intensity.In practice, for the fitting, after creation of the GSAS experiment file
using EXPGUI, a fair amount of information about the sample was pro-vided before starting the refinement. For each phase, a "CrystallographicInformation File (CIF)" which contained information about unit cell pa-rameters, the space group, atom positions, and thermal parameter foratoms was added in the "Phase" panel, by clicking on the button "AddPhase". Afterward, a diffraction data set was loaded using a histogramby clicking "Add Histogram" in the "Histogram" panel. For GEM neutrondata analysis, three histograms were added in the following sequence de-tector Bank 4: Histogram 1; Bank 5: Histogram 2; Bank 6: Histogram 3.6
6Please see Figure 2.8 for the range of banks.
37

CHAPTER 2. METHODS
To load a histogram, two types of files are loaded. The first is a file con-taining the powder diffraction data, often called a GSAS raw data file(usually using the extension .RAW, .GSA or .GSAS) and the second fileis an instrument parameter file (.INS or .INST) that defines what type ofdata is included in the raw file (X-ray or neutron, constant wavelengthor time of flight, etc.) as well as the starting values for the diffractome-ter constants and peak shape parameters. The first function "Chebyschevpolynomial" was used to fit the background functions. After the inser-tion of phases, histograms, and the background function, the fitting wasstarted.
First, the background was fitted using an appropriate number of terms.After the background function fit, the position of peaks were fitted. Thelattice parameters were refined in order to fit the position of peaks to theobserved data. An instrumental parameter "difc", was included to com-pensate for the offset in the peak location. Constraints on the "difc" wereforced in such a way that difc should be the same for all phases in one his-togram, and should maintain a certain ratio to other histograms. Techni-cally, DIFC (diffractometer constant) is related to the effective path lengthof the neutrons in GEM. Slight variation of the sample position causessignificant changes in DIFC for the different banks. For GEM data, thebank 4 (50°—75°): bank 5 (79°—104°): bank 6 (142°—169°)::10.094: 9.08:4.0 should maintain this ratio while fitting all histograms at one time. Inthe case of multiple phases, phase fractions were refined with respect toone phase fraction, i.e., one phase was given a fixed value and the otherpresent phases were allowed to vary. However, the fraction of one phaseshould be the same in all histograms, therefore, a constraint was set insuch a way that one phase will have one value in all histograms.
After varying a set of parameters, the fit showed that the profile shapedid not fit well to the simulated data, indicating that the peak shape(broadening) parameter needed to be fit. For the GEM data, "gam-2"was allowed to vary, while for the laboratory X-ray diffractometer the X
was varied to get the peak shape right.7 These parameters are relatedto a particle size broadening. Further, fitting of thermal parameters and
7Type 2 profile function was used.
38

2.7. AB INITIO CALCULATIONS
the hydrogen site occupancy improved the fit further. These parametersinfluence the intensity of the peaks. The temperature factors are related tothe vibrational amplitude of the atoms around their equilibrium position.The parameter "Uiso" in GSAS equals U(Q) which occurs in the Debye-Waller factor (see Equations (2.25) and (2.26)), and is used to express theisotropic thermal motion of an atom. This is proportional to
⟨
u2⟩ and hasÅ2 as a unit, where
⟨
u2⟩
is the mean square displacement of an atom. Theco-ordinate positions of atoms, which influence the peak intensity, werenot needed to vary.8
2.7 Ab initio calculations
Ab initio calculations predict the physical properties of a system from theknowledge of only the constituent atoms and their positions. The changein the positions of the atomic nuclei leads to a corresponding changein the energy of a system giving information about the equilibrium orground state geometry of the system. The energy of a system in electronicstructure calculations can be calculated by solving the time-independentSchrödinger equation (SE)
Hψ = Eψ, (2.30)
where H is a Hamiltonian operator, ψ is a wave function, and E arethe energy eigen values. However, solving the Schrödinger equation formany electron systems is a computationally intensive process. The den-sity functional theory (DFT), developed by Kohn and Sham [40], is basedon the theory of Hohenberg and Kohn [41], and helps to solve this N-body Schrödinger equation. The theory is based on the electron densitydistribution ρ (r) over position vector r, instead of the many-electron wavefunction Ψ (r1, r2, r3, . . .), where Ψ is the total wave function. This theoryinvolves some specific approximations in order to solve the Hamiltonianequation. The Born-Oppenheimer approximation [42] is one of them,based on the fact that the mass of nuclei and electrons have a large dif-ference and the nuclei can be considered stationary. The difference in the
8See the GSAS manual for details [35].
39

CHAPTER 2. METHODS
masses allows to split the Hamiltonian into nuclear and electronic parts,and to represent the wave function as the product of the electronic andnuclear parts. Consequently, the Schrödinger equation can be separatedinto nuclear and electronic parts. The electronic Schrödinger equation issolved as a function of the nuclear coordinates in order to find the relaxedatomic positions at equilibrium such as around vacancies and interfaces,or the local force constants related to lattice vibrations.
2.7.1 Density functional theory
Hohenberg and Kohn [41] derived that the ground-state energy of a sys-tem in the presence of static external potential V (r), i.e., due to the atomicnuclei can be written as
E [ρ (r)] =∫
V (r) ρ (r) dr +12
∫ ∫ ρ (r) ρ(
r′)
|r − r′ | drdr
′+ G [ρ (r)] , (2.31)
where ρ (r) is the density and G [ρ (r)] is a universal functional of thedensity [41]. Kohn and Sham wrote the term F [ρ] in two parts
G [ρ (r)] ≡ τ [ρ (r)] + Exc [ρ (r)] , (2.32)
where τ [ρ (r)] is the kinetic energy of a system of non-interacting elec-trons with density ρ (r), and Exc [ρ (r)] is the exchange and correlationenergy of an interacting system with electron density ρ (r) [40].
Kohn-Sham suggested that ρ (r) can be calculated using the followingequation
ρ(r) =N
∑j=1
ψ∗j (r)ψj(r), (2.33)
and the wave function can be obtained by solving the one-particle SE[
− h2
2m∇2 + Veff(r)
]
ψj(r) = ǫjψj(r), (2.34)
40

2.7. AB INITIO CALCULATIONS
where Veff(r) is given as
Veff(r) = V(r) +∫ ρ
(
r′)
|r − r′ |dr
′+ Vxc(r), (2.35)
where Vxc(r) is the exchange-correlation (xc) potential [43] expressed as
Vxc(r) =δExc
δρ(r). (2.36)
In order to express Exc energy as a functional of the density, the DFTrequires an approximation such as the local density approximation (LDA)or the generalized gradient approximation (GGA).
The LDA assumes that the electron density is varying slowly [40], andthe energy is a functional of local electron density only
ELDAxc =
∫
ρ(r)ǫxc (ρ) dr, (2.37)
where ǫxc (ρ) dr is the exchange and correlation energy per electron of auniform electron gas density (ρ).
The GGA has made an extension to the LDA by considering also thegradient of the electron density. Therefore, GGA is a functional of den-sity and the density gradient. Mathematically, GGA exchange-correlationenergies can be written as
EGGAxc = Exc[ρ(r),∇ρ(r)]. (2.38)
VASP
VASP (Vienna Ab-initio Simulation Package) [44] is one of the packagesused to solve Kohn-Sham equations (one-electron SE). Basically, VASPdeals with different types of algorithms to achieve the energy minimiza-tion. Generally, there is one overall outer loop in the main part of theprogram in which the charge density is optimized with respect to con-vergence in the energy, and one inner loop in which the wave functionsare calculated. The working of VASP can be explained as described in theflow chart (see Figure 2.9).
41

CHAPTER 2. METHODS
ρin(r)
Solve Kohn-Sham Equation
YesNo
ρout
(r)=Σ |ψj(r)|2
|E(ρout
)-E(ρin)|<ε ρ
out → ρ
Calculate Effective Potential
ρout
→ ρin
Figure 2.9 – A flow chart showing the successive steps in VASP and thecriterion for convergence of the calculations.
VASP uses a number of input files and writes the results in output files[44]. POSCAR, POTCAR, KPOINTS, and INCAR are the files, which arenecessary for all calculations. The POSCAR file contains the informationabout the unit cell, i.e., the lattice parameter, the lattice vectors, atomiccoordinates, and the number of atoms, for each atomic species, in the unitcell. The POSCAR files gives an option to specify if a selective number ofatoms should be move by mentioning selective dynamics before the atomiccoordinate positions.9
The POTCAR file contains the pseudopotential for each atom presentin the periodic table. VASP uses ultra-soft Vanderbilt pseudopotentials(US-PP) or the projector-augmented wave (PAW) method to describe theinteraction between the ions and electrons. VASP uses periodic bound-
9See the VASP manual for details [44].
42

2.8. POSITRON DEPTH PROFILING
ary conditions on the unit cell or supercell. The KPOINTS file definesthe k-point grid over which the wave-functions are solved within the firstBrillouin Zone using the Bloch’s theorem. The number of the k-pointsin the reciprocal unit cell is important for the accuracy of calculation,and depends on the nature of the system. A metallic system requiressubstantially larger k-points grid than that for semiconductors or insula-tors. The number of k-points also depends on the smearing method thatis used, once not all methods converge at the same speed. In additionthe error is not transferable at all, i.e., a 9 × 9 × 9 k-points grid leads toa completely different error for face-centered cubic (fcc), body-centeredcubic (bcc), and simple cubic (sc). Therefore, absolute convergence withrespect to the number of k-points is necessary [44].
The INCAR file is the central input file of VASP, which determineswhat needs to be done, for example, in the calculations with or withoutionic relaxation. After performing a calculation, output files are writ-ten, such as OSZICAR, CONTCAR, and DOSCAR containing informa-tion about the total energies, relaxed coordinates, and density of states,respectively.
2.8 Positron depth profiling
The positron (e+) is the antiparticle of the electron, and is, therefore, alsocalled antielectron. The positron has an electric charge of +e, a spinof 1/2, and the same mass as an electron. Collimated, monoenergeticbeams of positrons, with energies ranging from electron volts to kilo elec-tron volts are very useful to study a set of key properties in condensedmatter physics. When a low-energy (up to tens of keV) positron inter-acts with condensed matter, annihilation with an electron occurs in thesub-nanosecond timescale, resulting most often in the production of twogamma ray photons, which can be detected. This timescale gives accessto important physical phenomena. The positron observables are reflectedin the temporal, spatial and energetic distributions of the annihilation ra-diation. Before a positron reaches the annihilation stage, it undergoes anumber of steps after implantation in a material.
43

CHAPTER 2. METHODS
Samplesurface
Positron(e+)
Annihilation
γ−rays
DiffusionThermalization
e-
e+
Figure 2.10 – Schematic diagram showing the positron annihilation pro-cess in the sample [46].
First, positrons lose their energy rapidly to electron excitations, in-cluding target atom ionizations and collective plasmon-like process, untilthey reach thermal equilibrium with the sample, reached usually within afew picoseconds. Then the positron continues to move based on quantumdiffusion at or around thermal equilibrium. The diffusing positrons canget trapped in lattice defects which are attractive potential wells [45]. Theultimate fate for all positrons is to annihilate with an electron, resulting intwo gamma-rays (see Figure 2.10). The annihilation event obeys conser-vation of the momentum and energy, resulting in two gamma-rays with atotal energy equivalent to 1022 keV in the center-of-mass coordinate sys-tem based on the mass-energy equivalence. Therefore, the annihilationproduces energy in the form of the two gamma-rays, each of 511 keV,emitted in opposite directions to conserve the momentum, which is zeroin the center-of-mass frame.
However, the electron has some momentum in the laboratory coor-dinate system, as it is orbiting an atom resulting a Doppler shift in theenergy and momentum of the gamma-ray, while a thermal positron car-ries a very low (negligible) momentum. This leads to a shift of opposite
44

2.8. POSITRON DEPTH PROFILING
S =B
A+B+C
W =D+F
D+E+FED F
Ew
∆ ∆
∆2Es
BA C
508 511 514
E [keV]
No
rma
lize
d in
ten
sity
Ew
518504
510 512
Figure 2.11 – Schematic representation of the definition of the shape (S)and wing (W) parameters [47].
sign in the energy of the two gamma-rays proportional to the momentumof the electron, leading to a Doppler-shift broadening of the 511 keV an-nihilation photo-peak. The energy spectrum of the emitted gamma-rays,which carries information about the electron momentum distribution, iscollected during the experiment. Positron annihilation in single crystalsprovides a direct image of the electronic structure of metals and semi-conductors, nano-crystals, near interfaces and surfaces upon annihilationwith electrons. The positive charge of positron makes it, furthermore,sensitive to detect atomic scale defects. Vacancy concentrations of suitabledefects in which the positron can settle can be detected down to the ppm
scale. Its incident kinetic implantation energy can easily be tuned, en-abling depth-profiling studies of a large variety of sub-micron thin films.
45

CHAPTER 2. METHODS
Positrons are non-destructive, allowing in situ studies on a wide range ofmaterials with respect to temperature.
The positron Doppler broadening of annihilation radiation (511 keV)was measured at the VEP (Variable Energy Positron) beam in-house builtsetup using positrons with a kinetic energy in the range of 0—25 keV.Positrons are produced using a 22Na source and moderated using tung-sten foils. Energy windows of |δE| < 0.88 keV and 2.57 keV<|δE| <6.62 keVwere used in the Doppler broadened 511 keV photo peak for S and W,respectively [48, 49] (see Figure 2.11). Since the S is the signature of rel-atively low momentum electrons, it provides a measure of annihilationwith valence electrons, providing sensitivity to the electronic structureand the presence of vacancies. W indicates larger deviations of the pho-ton energy, i.e., the annihilation electron momentum is larger, therefore,W is a measure for positron annihilation with semi core electrons, pro-viding chemical sensitivity to the positron trapping site via detection ofdeeper lying core electrons orbitals.
46


3Mg thin films
The reduction in the particle and crystallite size of metal hydridesto the nanoscale has a significant effect on the kinetics of hydro-gen uptake and release. Further, the addition of catalysts can
improve the reaction kinetics significantly. Thin film synthesis can beused to achieve films containing nano-dimension crystallites besides ballmilling. For example, Higuchi et al. [50, 51] reported that Mg thin filmsprepared using magnetron sputtering grow in the form of columns. Theirstudy provided clear indications that Pd facilitates the dissociation of H2
at the surface, and lowers the hydrogen desorption temperatures signifi-cantly. Further, they also showed that the lowest desorption temperatureswere observed for a sandwiched configuration of Mg films in betweentwo Pd layers. That configuration also showed a columnar growth, butwith narrower columns as compared to the case of a single top layeredPd film. They suggested that higher stress levels might have occurreddue to the multilayer systems, and are responsible for the low desorptiontemperatures.
Therefore, it is important to investigate and clarify the role of the Pdcatalyst and of the nanostructures on the sorption temperatures and ki-netics during hydrogen cycling, as described in this chapter. Further, thestructural transformations upon hydrogenation of Mg thin films cappedwith Pd are also studied in this chapter. The films were synthesized
49

CHAPTER 3. MG THIN FILMS
using two different deposition methods, namely PSD and PLD. TEM,SAD, and XRD reveal the formation of MgPd and Mg2Si (magnesium sili-cide) alloys, and further show the details of the phase transformation of(hexagonal closed-packed) hcp-Mg to rutile-MgH2. The hydrogen sorp-tion studies show that the Mg films can be loaded up to 4 wt.% alreadyat 200 °C for an applied pressure of 2.5 bar for 2 h. The full capacity of7.6 wt.% can be reached with the application of 10 bar pressure for 24 hat this low temperature. Additionally, the hydrogen sorption studies alsorevealed a peeling-off of the Pd-cap layer at temperatures higher than250 °C, leading to a significant decrease in the apparent storage capacity.This indicates the importance of the Pd catalyst for the hydrogen sorptionprocess. Further, the permeation studies showed that the hydrogen trans-port kinetics is rate limited by the dissociation of hydrogen molecules atthe sample surface, and indicate that the Pd catalyst acts as a H2 splitterat the surface. Moreover, the change in the electronic structure upon hy-drogenation can be extracted from positron studies, which also showedthe occurrence of Mg-Pd alloy formation and the hcp-Mg to rutile-MgH2
transformation.
3.1 Experimental details
Mg thin films with a thickness of around 0.5 and 1 µm were deposited us-ing PSD and PLD techniques. In the PSD, Argon gas and a mixture of Ar+ H2 gases, within a pressure range from (1—3)×10−6 bar, were used forthe plasma, which was created using an electron gun. Hereafter, a highnegative potential on the target, −1000 V and −500 V on Mg (99.9%) andon Pd targets, respectively, was applied. During the sputtering, heavyAr+ ions hit the target, knock out Mg atoms and deposit these on thesubstrate (For details, see Section 2.2.1). A Pd target was placed on thetop of the shutter to enable the deposition of a Pd thin film on top of theMg film in the same set up, avoiding possible oxidation [30]. The filmswere deposited on a Si (100) or on a glass substrate. PLD, the other tech-nique, was used to deposit Mg films on a Si (100) substrate positionedopposite the target (For details, see Section 2.2.2). After deposition of Mg
50

3.1. EXPERIMENTAL DETAILS
films, the samples were transferred to the PSD setup for capping the Mgfilms with a Pd layer with a thickness of about about 50—100 nm.
The as prepared PLD films were characterized by X-ray diffractionwith the Cu Kα wavelength, 1.54 Å, using a Bruker-AXS Type D5005diffractometer. Co Kα radiation, wavelength of 1.79 Å, was used to charac-terize the sputter deposited films using another Bruker-AXS Type D5005diffractometer. Cross-sectional TEM was carried out on selected films tostudy the structural properties of the films using a Philips CM30T mi-croscope at 300 kV. Additionally, SAD images were obtained on cross-sections of the films using a beam spot size equivalent to about the thick-ness of the film.
Hydrogen permeation experiments were carried out to study the hy-drogen kinetics and permeation through the films using a standard hy-drogen permeation set up with a quadrupole mass spectrometer (QMS),a Pfeiffer QME 200, as a sensitive hydrogen detector. For these experi-ments, films were prepared on a highly permeable 50 µm thick PdAg25substrate instead of Si (001).
Hydrogen loading was carried out in a hydrogen oven in the pressurerange of 2.5 to 10 bar and at temperatures ranging from 25 to 400 °C for2 to 24 h. The thicknesses of the sputter deposited films were determinedusing a Dektak-8 profilometer with an accuracy of roughly 0.05 µm. Theknown film thickness and area were used to determine the amount of Mgdeposited, needed in the extraction of its hydrogen capacity. The densitiesof these flat films were assumed to be 1.7 g cm−3, i.e., close to the densityof bulk Mg. The weight of these films was also checked by weighinga few selected samples before and after the deposition. The depositedamount of Mg for laser deposited films with an area of 1.3 cm2, on theother hand, was only determined using the weighing method directly,within an accuracy of 0.015 mg for Mg films with a typically weight of0.20 mg. Their partially porous character and the presence of micron scalechunk particles on top of these films prohibits a reliable use of the firstmethod. The hydrogen contents of the loaded films were obtained fromsubsequent hydrogen desorption measurements using the HYDRA setup(see Section 2.5). Hydrogen desorption spectra and the main desorption
51

CHAPTER 3. MG THIN FILMS
temperatures were determined in heating runs using a linear variation ofsample temperature at roughly 5 °C min−1, carried out in a vacuum ofapproximately 10−7 bar. The composition of the gas released from thesample was regularly checked and determined using a QMS.
The positron Doppler broadening of annihilation radiation (511 keV)was measured using positrons with a kinetic energy in the range of 0—25 keV (see Section 2.8). The S parameter depth profiles were analyzedusing the VEPFIT software package. This program solves the full positronimplantation-diffusion problem for a system of layers, and the calculatedS curves were fitted to the experimental data. The fitting parameters suchas the S parameter of the respective layer, the thickness of the film, andthe positron diffusion length for each layer with a given mass densitywere allowed to vary.
3.2 Plasma sputter deposited films
3.2.1 Structural characterization
The films were characterized after the preparation by XRD using Co Kα
radiation. Generally, the sputtered films (using Ar gas plasma) show apreferred orientation of hexagonal a3-axis, Mg (0002), perpendicular tothe Si (001) substrate. This confirms that the Mg films grow according tothe commonly observed growth mode with the Mg hexagonal basal planeparallel to the Si substrate plane [52,53]. Microstructural properties of thefilms were studied using TEM. Figure 3.1 shows a cross-sectional TEMimage of a sputtered film before hydrogenation. The boundary betweenthe Mg and Pd layers is very apparent. A clear columnar structure is visi-ble for the sample in Figure 3.1, which extends throughout the film thick-ness. Each column contains grain boundary defects, while the columnshave a number of different orientations, discernible by gray shading ofcolumns, relative to each other. This small variation in the orientation ofthe columns relative to each other leads to a small spread in the corre-sponding diffraction spots in SAD. These different orientations could becaused by rotations of the columns during the growth of the films, in-dicating the presence of open space between the columns enabling such
52

3.2. PLASMA SPUTTER DEPOSITED FILMS
a
0.2 µm 0.2 µm
b
Mg
Si
Pd
MgH2
Figure 3.1 – Cross-sectional TEM images of (a) as prepared; and (b)hydrogenated Mg films on a silicon (001) substrate prepared in the samebatch by plasma sputtered deposition using an argon gas plasma.
motions. Sputtered films were hydrogenated at 200 °C at 2.5 bar of hy-drogen pressure in an oven for 2 h. The hydrogenation resulted in a clearreduction of defects and release of stresses during the phase transforma-tion of the hcp-Mg to the tetragonal (rutile)-MgH2, leading to a bettervisibility of the columns (Figure 3.1)
Likely, this is caused by the passage of the Mg and MgH2 phaseboundary, leading to a recrystallization and a relaxation of the crystalstructure, and a corresponding removal of crystal lattice defects. Inelasticneutron scattering measurements on ball milled MgH2 powder showeda similar result, i.e., a release of stresses of ball milled Mg powder uponhydrogenation [54]. The XRD showed that a martensitic-like phase trans-formation from Mg to MgH2 occurs with an orientation relationship ofMg (0002)||MgH2 (110), similar to as mentioned by Higuchi et al. [51].SAD on sputtered films before and after hydrogenation confirms the for-mation of rutile-MgH2 upon hydrogenation of Mg films. The SAD diffrac-tion patterns (not shown) show a series of spots, corresponding to grainshaving different orientations (of the order of ten). This is caused by (a)
53

CHAPTER 3. MG THIN FILMS
the three orientations defined by symmetry in which the hcp-Mg (0002)structure converts into the rutile-MgH2 (110); (b) small rotations of indi-vidual columns relative to each other; and (c) loss of epitaxy relative tothe Si (001) substrate, as also observed for PLD films (see section 3.3.2).
3.2.2 Pd as a hydrogen splitter at the surface
Hydrogen permeation experiments were carried out on the sputter de-posited Mg films to reveal the nature of the hydrogen kinetics, surface ordiffusion controlled, and the effects of Pd capping Mg films. The time-resolved permeation (not shown) through Mg films on PdAg25 substrateswas followed upon application of a hydrogen pressure of approximately50 mbar on the upper Mg side of the films. The study demonstrated thatthe presence of a Pd capping layer improves the hydrogen kinetics andpermeation substantially [30]. Notably, the use of Pd cap layer showedan increase in the observed equilibrium fluxes J∞ by a factor of the orderof 103 compared to bare Mg films.
At 250 °C, the hydrogen permeation through the activated nanostruc-tured Mg layers stabilized within less than 500 s to reach its equilibriumflux J∞, which is 4 times faster than without a Pd cap layer. The hydro-gen transport kinetics for both bare Mg films as well as for Pd capped Mgfilms was observed to be rate-limited by the hydrogen dissociation at thesample surfaces. Namely, the equilibrium flux J∞ showed a power lawdependence on the applied hydrogen pressure p on one side of the film,with an exponent typically close to 1 (for example, see Figure 3.2(a)). BareMg films showed a similar behavior as shown in Figure 3.2(a), however,with largely reduced equilibrium fluxes J∞ at the applied temperaturesabove 300 °C.
The PdAg25 substrates, on the other hand, showed a very fast hydro-gen transport kinetics, limited by diffusion through the film; the perme-ation here follows a power law dependence with an exponent of closeto 1/2 (see Figure 3.2(b)), obeying Sievert’s law [55]. The Mg films wereapparently too thin to show kinetics limited by diffusion, and kinetics islimited by the surface dissociation (H2 splitting) process.
54

3.2. PLASMA SPUTTER DEPOSITED FILMS
15.6
15.8
16.0
16.2PdAg25||Mg||Pd
at 200 ˚C
Slope = 1.2 ± 0.1
log
10(J
∞)
log10
(p)
2.1 2.2 2.3 2.4 2.72.5 2.6 2.8
a
17.6
17.8
18.0
18.2
18.4
Slope = 0.61 ± 0.08
PdAg25at 200 ˚C
log
10(J
∞)
log10
(p)
1.6 1.7 1.8 1.9 2.0 2.1 2.2 2.3
b
Figure 3.2 – Equilibrium hydrogen permeation flux (J∞ in hydrogenmolecules cm−2 s−1) plotted against equilibrium hydrogen pressure (pin mbar) at a temperature of 200 °C for (a) a PdAg25||Mg||Pd multi-layer; and (b) a bare PdAg25 substrate. The membranes were externallyactivated.
3.2.3 Pd reduces hydrogen sorption temperatures
Further, a number of samples were studied for which hydrogen was in-corporated into the films during the sputter deposition. This was achieved
55

CHAPTER 3. MG THIN FILMS
by using a gas mixture of Ar and H2 having a ratio of 1:1 at a pres-sure range between (1—3)×10−6 bar. Electron microscopy images showedthat the films contain generally more grains, while keeping the columnargrowth. Furthermore, the average width of the columns decreases from100 nm to 40 nm upon application of a bias voltage on the substrate in therange between 0 to −100 V. These changes are attributed to resputteringof Mg atoms during deposition of the films.
This seems to be consistent with a reorientation of the grains fromthe preferred Mg (0002) growth to a preferred Mg (1010) orientation ob-served for samples prepared at the highest applied bias voltage of −100 V,as shown in Figure 3.3. The XRD pattern for samples prepared using amixed Ar + H2 plasma clearly show the presence of a MgH2(110) diffrac-tion peak besides the stronger Mg (0002) peak, showing that the reactivesputtering leads to incorporation of hydrogen in the films.
The area of MgH2 (110) peak, nevertheless, reduces significantly rel-ative to the area of Mg (0002) peak in the bias voltage range from 0 to−75 V. Figure 3.4(a) shows that this is consistent with the incorporatedhydrogen fraction (in wt.%) determined in the subsequent hydrogen des-orption experiments. The figure shows a substantial decrease in the hy-drogen fraction from 3.0 wt.% (at 0 V) to 0.2 wt.% (for bias voltages largerthan −25 V). The 3.0 wt.% is equivalent to x ≈ 0.8 on the average for theMgHx film. The increased width of the Mg (0002) diffraction peak in thishigh voltage range indicates that this is accompanied by a reduction inMg grain sizes. SAD images confirmed these structural changes, as at 0 Va polycrystalline character is observed, while at −75 V partial amorphiza-tion occurs. The combination of these observations shows the importanceof the resputtering process. This possibly enables the easier escape ofhydrogen from these films through the presence of defects and a largeramount of grain boundaries.
The more polycrystalline character of the film has a significant im-pact on the hydrogen desorption temperature for bare Mg films (see Fig-ure 3.4(b)), resulting in a systematic reduction from 410 °C down to 370 °Cupon increasing the applied substrate bias voltage. Such easier hydrogendesorption can originate from modifications at the sample surface and
56

3.2. PLASMA SPUTTER DEPOSITED FILMS
[°]
30 605040
(0 V)
(-12.5 V)
(-25 V)
(-50 V)
(-75 V)
(-100 V)
Mg
MgH2
(11
0)
(10
1)
(00
02
)(10
10
)
(10
11)
θ2
Figure 3.3 – XRD patterns (using Co Kα) of Mg films prepared usingreactive Ar and H2 sputtering at different bias voltages on the substrate,showing the presence of both MgH2 and Mg diffraction peaks.
at the grain boundaries. The presence of a large amount of defects ismost likely affecting the hydrogen migration energy, which may attain alower value. Consequently, hydrogen desorption can occur at the lowerobserved temperatures.
Capping the film with a Pd top layer, on the other hand, has a farmore important effect on the hydrogen desorption temperature. The lat-ter decreases to about 200 °C, and remains nearly independent of appliedsubstrate bias voltage. This clearly shows that, for these 1 µm thin Mgfilms, the catalytic activity of the Pd cap layer is the dominant factor indetermining the hydrogen kinetics and sorption temperatures rather thanthe nanostructured character of the film.
57

CHAPTER 3. MG THIN FILMS
0 20 40 60 80 100
-Vbias
[V]
0.0
1.0
2.0
3.0
H2 c
on
ten
t [w
t.%
]a
180
220
360
400
Pd-cap layer
no cap layer
-Vbias
[V]
Tem
pe
ratu
re [
°C]
0 20 40 60 80 100
b
Figure 3.4 – (a) Hydrogen fraction (in wt.%) incorporated in Mg filmsduring plasma deposition using a mixed Ar and H2 plasma; and (b)hydrogen desorption temperature versus substrate bias voltage for bareand Pd-capped sputter deposited Mg films prepared using a mixed Arand H2 plasma.
3.2.4 Storage properties
Hydrogen loading of sputter deposited films were done at various tem-peratures in the range of 25—400 °C under 2.5 bar hydrogen pressure for
58

3.2. PLASMA SPUTTER DEPOSITED FILMS
2 h in an oven to investigate the role of the Pd-cap layer further, usingsimilarly prepared pristine samples for each loading temperature. For afew films, a hydrogen pressure of 10 bar was used at 24 h for the loading.Subsequently, the absorbed hydrogen fraction was determined by hydro-gen desorption measurements. Figures 3.4(b) and 3.5 show the presenceof the Pd catalyst reduces the onset of the hydrogen release and uptaketemperatures to 200 °C.
A maximum hydrogen capacity was already achieved at 220 °C un-der 2.5 bar of hydrogen pressure for 2 h. The theoretical maximum ofthe hydrogen capacity of 7.6 wt.% was achieved at 220 °C using 10 barhydrogen pressure for 24 h, corresponding to a full conversion of Mg toMgH2. Loading at 280 °C or higher, on the other hand, reduces the re-versible hydrogen fraction significantly (see Figure 3.5). This reduction inthe hydrogen fraction at higher temperature might have resulted becauseof the partial detachment of Pd layer from the Mg layer, which was ob-served for temperatures above 270 °C, as shown in the optical microscopeimage (see Figure 3.6).
This delamination of the Pd layer might have been caused becauseof the difference in the thermal coefficients of expansion of the Pd andMg [56]. The major cause for the delamination, however, seems to be thelarge expansion in volume of close to 31% for the Mg film upon hydro-genation, and the release of the corresponding build up of stresses at theMgH2–Pd interface. This was verified in a reference experiment, in whichsamples prepared in the same batch were exposed to 2.5 bar of pressurein different gas atmospheres, hydrogen and (inert) He, at 250 °C for 3 h.
A clear delamination of the layer was observed in the case of the hy-drogen exposed sample, while the helium (He) exposed sample did notshow any sign of delamination. This is also confirmed by positron studieson such types of films (see Section 3.2.5). Clearly, after the detachmentof the Pd layer, the hydrogen molecules need to dissociate at the Mg sur-face rather than at a neat Pd surface. Therefore, the hydrogen gas has toovercome a correspondingly larger energy barrier in order to dissociate,leading to the observed lower absorbed hydrogen fraction, or, equiva-lently, higher loading temperatures (see Figure 3.5). These observations
59

CHAPTER 3. MG THIN FILMS
140 180 220 260 3000
1
2
3
4
5
6
7
8H
2 c
on
ten
t [w
t.%
]
Peeling-off ofPd-cap layer
10 bar, 24 h Theoreticalmaximum
Temperature [°C]
2.5 bar, 2 h
Figure 3.5 – Hydrogen uptake for sputter deposited Pd-capped Mg filmsover a range of loading temperatures, showing that the maximum up-take of approximately 7.6 wt.% (MgHx, x ≈ 2) is reached at 220 °C and10 bar. Heating above 250 °C resulted in a lower hydrogen uptake dueto peeling-off of the Pd cap layer.
show that the Pd cap layer plays an important role as a catalyst to dissoci-ate H2 molecules at the sample surfaces, leading to significantly reducedsorption temperatures.
3.2.5 Positron analysis
Positron studies were performed to investigate the metal (Mg) to insulator(MgH2) electronic structure transition. Positron depth-profiling studieswere carried out on as prepared and hydrogenated Pd-capped Mg filmsprepared on a glass substrate. Additionally, this study gave an insight inthe partial delamination of Pd-cap layers at higher temperatures and inthe Pd-Mg alloy (Mg2Pd) formation.
60
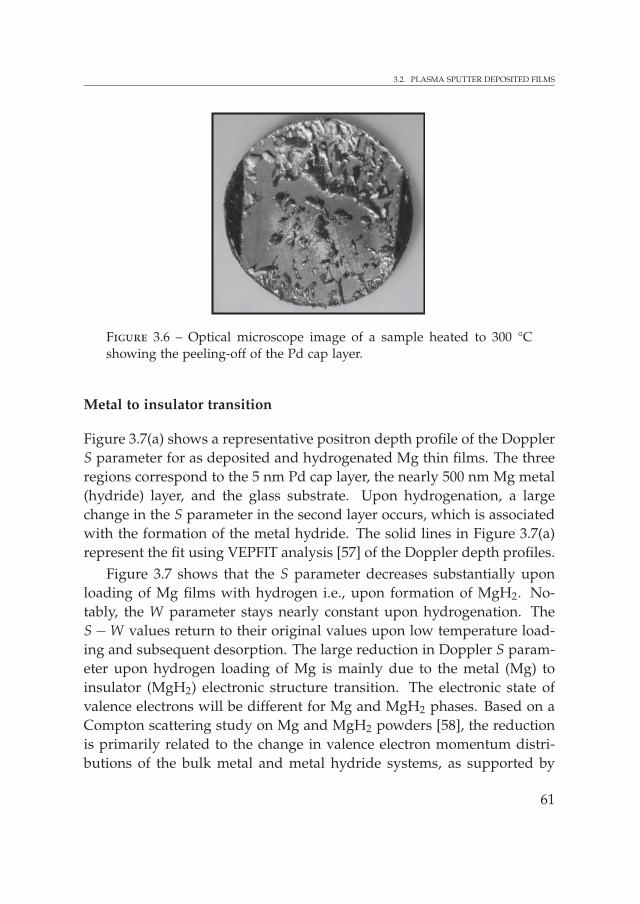
3.2. PLASMA SPUTTER DEPOSITED FILMS
Figure 3.6 – Optical microscope image of a sample heated to 300 °Cshowing the peeling-off of the Pd cap layer.
Metal to insulator transition
Figure 3.7(a) shows a representative positron depth profile of the DopplerS parameter for as deposited and hydrogenated Mg thin films. The threeregions correspond to the 5 nm Pd cap layer, the nearly 500 nm Mg metal(hydride) layer, and the glass substrate. Upon hydrogenation, a largechange in the S parameter in the second layer occurs, which is associatedwith the formation of the metal hydride. The solid lines in Figure 3.7(a)represent the fit using VEPFIT analysis [57] of the Doppler depth profiles.
Figure 3.7 shows that the S parameter decreases substantially uponloading of Mg films with hydrogen i.e., upon formation of MgH2. No-tably, the W parameter stays nearly constant upon hydrogenation. TheS − W values return to their original values upon low temperature load-ing and subsequent desorption. The large reduction in Doppler S param-eter upon hydrogen loading of Mg is mainly due to the metal (Mg) toinsulator (MgH2) electronic structure transition. The electronic state ofvalence electrons will be different for Mg and MgH2 phases. Based on aCompton scattering study on Mg and MgH2 powders [58], the reductionis primarily related to the change in valence electron momentum distri-butions of the bulk metal and metal hydride systems, as supported by
61

CHAPTER 3. MG THIN FILMS
0 5 10 15 200.52
0.56
0.60
0.64
0.68Mg/MgH
2Glass substrate
Average depth [nm]
As preparedHydrogenated
Pd
E [keV]
S p
ara
me
ter
[-]
MgH2
(reference)
5 500
a
S parameter [-]
0.02
0.03
0.04
0.05
0.06
0.52 0.56 0.60 0.64 0.68
W p
ara
me
ter
[-]
As preparedHydrogenated
b
A - Pd D - Mg
E - MgH2
G - Mg2Pd
B - Glass C - Mg (annealed)
F - MgH2 (reference)
AB
C
FE D
G
Figure 3.7 – (a) Doppler S parameter depth profiles for as deposited Pdcapped Mg films and subsequent hydrogen loading. The decrease in theS parameter value shows the metal (Mg) to insulator (MgH2) transition;and (b) corresponding S − W parameter diagram. The S − W point forMgH2 (reference) was estimated, see text, while the S − W point for Mg(reference) was obtained on a well-annealed Mg bulk sample.
62

3.2. PLASMA SPUTTER DEPOSITED FILMS
the calculated momentum distributions of valence electrons in Mg andMgH2. The fraction of valence electrons in the experimental momentuminterval of |p| < 3.5 × 10⁻³m0c (|δES| < 0.88 keV), used in the Dopplerstudy, is estimated from the calculations about 7% lower for MgH2 rela-tive to Mg [59]. The estimation was done using the theoretical momentumdistributions convoluted with the resolution of 1.2 keV of the Dopplerbroadening measurements. This is close to the decrease of about 4.5%seen in positron experiments as discussed below.
This difference can be discerned in the depth profile, as can be seenin the S and W parameter. Figure 3.7 shows a large change in the S pa-rameter ∆S = −0.03 S, while the W parameter ∆W = 0 remains nearlyconstant. The estimated change in Doppler S parameter for the com-plete transformation of Mg to MgH2 is ∆S = −0.045 S, since a phasefraction of approximately 63% (5 wt.% hydrogen loading) of the Mg filmonly was converted to MgH2. This fraction was extracted from the XRDon Pd-capped Mg films before and after hydrogenation. The value of∆S = −0.045 S is close to the reduction of about 5% reported by Chec-chetto et al. [60]. The remaining difference with ∆S = −0.07 S estimatedfrom the ab initio calculations can be related to the details of the spatialoverlap of the positron wave function with the valence electron orbitals,which are not included in these calculations, or to positron trapping insmall vacancy clusters at the boundaries of columns in the Mg films.Positron trapping in hydrogen vacancies in the MgH2 cannot strictly beexcluded at this point, although the hydrogen vacancy formation energyfor MgH2 is relatively high, 1.6 eV for a neutral vacancy [61]. Therefore,appreciable vacancy concentrations in MgH2 are not expected in the tem-perature interval considered in this study.
MgPd alloy formation
Further, the positron studies gave additional information about the for-mation of Mg-Pd alloy at the Mg–Pd interface. The XRD patterns onthe same film showed the formation of Mg2Pd due to Pd diffusion intothe underlying Mg, occurring already at temperatures of 210 °C. Positrondepth-profiles and S − W diagrams on the thin film samples show a cor-
63

CHAPTER 3. MG THIN FILMS
responding large shift in the S − W parameters at low positron implan-tation depths from the Pd toward the Mg–Pd characteristic S − W point(Figures 3.7 and 3.8, points A and G), revealing the cap layer transforma-tion to Mg2Pd.
Further, a high fraction of ortho-positronium (o-Ps) with a slow decaywith positron implantation energy was observed for the samples whichwere loaded at 230 °C and unloaded up to 330 °C. The o-Ps was formedat the interface of Pd cap and Mg layer [59]. This indicates that a par-tial delamination of the 5 nm cap layer occurred for hydrogen cycling inthe higher temperature range around 300 °C, leading to a loss of its cat-alytic activity and an incomplete desorption of hydrogen from the metalhydride layer. In summary, positron depth profiling, therefore, not onlyprovides insight in the role and transformation of the catalyst used topromote hydrogen storage in metal hydrides, but may also be helpful forin situ monitoring of the catalyst and metal hydride layers [62].
3.3 Pulsed laser deposited films
3.3.1 XRD characterization
Pulsed laser deposition method is another technique, which was used toprepare Mg films of similar thickness (1µm). XRD measurements on asprepared laser deposited Mg films show three diffraction peaks corre-sponding to the Mg (0002), Mg (1011), and Mg (1010) orientations (seeFigure 3.9), while a single Mg (0002) diffraction peak was observed forsputter deposited Mg films. This indicates that laser deposited films aretextured in nature with differently oriented grains in which the (0002),(1011), (1010) crystal planes are parallel to the silicon (001) substrate, re-spectively. Apparently, the energetically ejected material and the discon-tinuity of the laser deposition process give rise to such textured films.Subsequently, the Pd-capped films were loaded at 250 °C and 2.5 bar for10 h. The XRD studies (see Figure 3.9) showed only MgH2 peaks uponhydrogenation, indicating the full transformation of the Mg crystallitesinto MgH2 under these loading conditions. In contrast, the XRD patternof films that were hydrogenated at 150 °C and 2.5 bar for 10 h showed
64

3.3. PULSED LASER DEPOSITED FILMS
0 5 10 15 200.52
0.56
0.60
0.64
0.68
E [keV]
S p
ara
me
ter
[-]
As preparedH
2 loading (230 °C)
Average depth [nm]
Mg/MgH2
Glass substratePd
Unloading (300 °C)Unloading (330 °C)
5 500
a
0.52 0.56 0.60 0.64 0.68
0.02
0.03
0.04
0.05
0.06
S parameter [-]
W p
ara
me
ter
[-]
b
A - Pd D - Mg
E - MgH2
G - Mg2Pd
B - Glass C - Mg (annealed)
F - MgH2 (reference)
A
B
C
FE D
G
As preparedH
2 loading (230 °C)
Unloading (300 °C)Unloading (330 °C)
Figure 3.8 – (a) Doppler S parameter depth profiles for a Pd-cap Mgfilm for a selected sample before and after H2 loading, and subsequentdesorption up to 300 and 330 °C; and (b) the corresponding S − W pa-rameter diagram.
65

CHAPTER 3. MG THIN FILMS
605550453525 30 40
[°]
(a) Mg
(b) MgH2
00
02
110
10
1
20
0
211
00
02
(a) As prepared
(b) After hydrogenation
(c) After dehydrogenation
10
10
10
11
10
12
112
0
10
10
10
11
10
12
112
0
(c) Mg
θ2
Figure 3.9 – XRD patterns (using Cu Kα) of laser deposited (a) as pre-pared Mg film; (b) MgH2 film obtained by hydrogenation at 250 °C and2.5 bar for 10 h; and (c) after dehydrogenation, showing that the originalMg structure is retrieved.
a weak Mg (0002) peak along with MgH2 peaks. This indicates that Mgwas transformed only partially into MgH2 under these loading condi-tions. Dehydrogenation up to 300 °C of the films, which were loaded at250 °C, resulted in a transformation back to the original Mg structure (seeFigure 3.9), suggesting that H2 cycling is feasible. However, the absorbedH2 content reduced close to 30% after only a few cycles. This is likely re-lated to the onset of detachment of the top Pd layer, observed previouslyfor the sputtered deposited films (see Figure 3.6 and 3.5), inducing a clearshift in the H2 sorption temperatures to higher values.
66

3.3. PULSED LASER DEPOSITED FILMS
3.3.2 Microstructure studies
Electron microscopy showed that laser deposited Mg films grow in quitea similar manner as sputter deposited films, showing a similar colum-nar structure extending throughout the thickness of the films (see Fig-ure 3.10). The laser deposited Pd-capped Mg films showed a thick MgOlayer at the interface of Mg and Pd. The latter was formed during thetransfer of Mg film samples from a PLD setup to the sputter depositionsetup to deposit the Pd cap layer. Such a thick MgO layer acts in generalas an undesirable barrier to hydrogen absorption. Figure 3.10 shows apenetration of Pd in some parts of the film due to porosity of the de-posited Mg film. Additionally, the laser deposited Mg films showed thepresence of large chunks on the surface of the film, which were createdalong with the atomically dispersed evaporation plume when the laserbeam hit the target material. Subsequently, these chunks were depositedon the substrate or films, as was also observed in scanning electron mi-croscope (SEM) imaging of as prepared Mg films, similar to the study ofMosaner et al. [33]. The crystal structure and composition of the chunksand their behavior toward hydrogen absorption could not be determinedin the electron microscopy studies. The density of the chunks can be re-duced significantly by increasing the distance between the target and thesubstrate, as observed in SEM images (not shown).
Additionally, a variety of grains with slightly different orientationsis present inside the film (see Figures 3.10 and 3.11). Furthermore, Fig-ure 3.10(a) shows the presence of strains in the columns, and the columnsare less well defined as compared to sputter deposited films (Figure 3.1).Still, these columns contain a significant number of polycrystalline andgrain boundary defects. These defects may facilitate hydrogen absorp-tion because they may reduce the migration energy, as discussed for thesputter deposited films prepared under an application of substrate biasvoltage in section 3.2.3. Figure 3.10 shows that the columns are better visi-ble after hydrogenation at 250 °C at 2.5 bar for 10 h, which is similar to thesputter deposited films. This is caused by release of stresses in the filmduring the transformation of the hcp-Mg into tetragonal MgH2. After hy-drogenation, electron microscopy studies on a typical laser deposited film
67
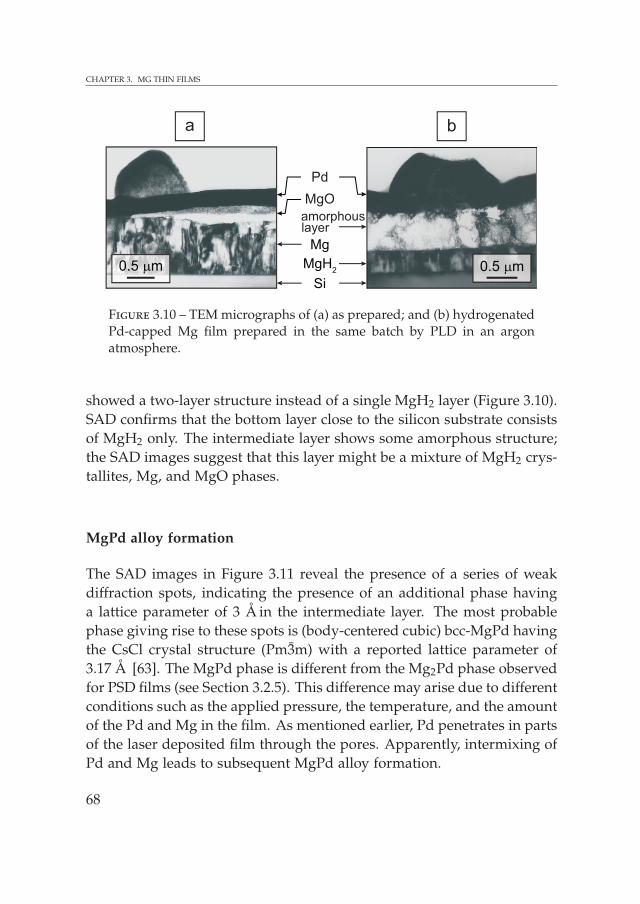
CHAPTER 3. MG THIN FILMS
0.5 µm
a b
0.5 µm
MgO
Mg
Si
Pd
MgH2
amorphouslayer
Figure 3.10 – TEM micrographs of (a) as prepared; and (b) hydrogenatedPd-capped Mg film prepared in the same batch by PLD in an argonatmosphere.
showed a two-layer structure instead of a single MgH2 layer (Figure 3.10).SAD confirms that the bottom layer close to the silicon substrate consistsof MgH2 only. The intermediate layer shows some amorphous structure;the SAD images suggest that this layer might be a mixture of MgH2 crys-tallites, Mg, and MgO phases.
MgPd alloy formation
The SAD images in Figure 3.11 reveal the presence of a series of weakdiffraction spots, indicating the presence of an additional phase havinga lattice parameter of 3 Å in the intermediate layer. The most probablephase giving rise to these spots is (body-centered cubic) bcc-MgPd havingthe CsCl crystal structure (Pm3m) with a reported lattice parameter of3.17 Å [63]. The MgPd phase is different from the Mg2Pd phase observedfor PSD films (see Section 3.2.5). This difference may arise due to differentconditions such as the applied pressure, the temperature, and the amountof the Pd and Mg in the film. As mentioned earlier, Pd penetrates in partsof the laser deposited film through the pores. Apparently, intermixing ofPd and Mg leads to subsequent MgPd alloy formation.
68

3.3. PULSED LASER DEPOSITED FILMS
MgPd(rings)
MgH2
Si
Si
MgPd(rings)
a b
c d
Mg
Figure 3.11 – SAD images of laser deposited films. (a) and (b) as pre-pared Mg film; (c) and (d) hydrogenated film, revealing the the presenceof MgH2 and weak spots of bcc-MgPd formed in the intermediate layerof the hydrogenated film.
The diffraction pattern in Figure 3.11 of an as-prepared film corre-sponds to nearly single crystalline hcp-Mg with a small spread of diffrac-tion spots. The latter suggests that the columns are slightly rotated withrespect to each other, as found previously for the sputter deposited films.SAD on the hydrogenated Mg films shows diffraction spots from MgH2,a trivial contribution from the Si (001) substrate, and weak spots from thebcc MgPd phase (see Figure 3.11). SAD at a significantly narrower focusof the incident electron beam, enabling to selectively probe the 150 nmthin bottom layer was also performed. This demonstrated that the bot-tom layer consists of fully hydrogenated MgH2 (110). The SAD results
69

CHAPTER 3. MG THIN FILMS
show that the hcp-Mg structure is rearranged into the tetragonal MgH2
structure obeying closely the orientation relationship [2110] Mg||[111]Si||[111] MgH2; Mg (0002) ||Si (002)||MgH2 (110) upon hydrogena-tion. Furthermore, Figure 3.11 shows that hydrogenation is accompaniedby a loss of epitaxy, as the MgH2 (110) plane is not exactly parallel tothe Si (002) plane, while the [111] MgH2 direction stays nearly parallel to[111] Si.
There are indications that the two-layer structure (see Figure 3.10)with a bottom layer consisting of ordered MgH2 is related to a possiblestart of the hydrogenation process at the interface of the Mg film withthe Si substrate. Such a hydrogenation process starting at the interfacewith the substrate recently was observed for Mg2Ni layers [64, 65]. Thisprocess involves dissociation of hydrogen molecules at the Pd surface,and a subsequent diffusion of hydrogen atoms through the Mg film tothe Si substrate, enabling the nucleation of the MgH2 phase at the Mg–Siinterface.
Mg2Si alloy formation
The formation of a Mg2Si phase was also observed at the Mg–Si interfacein this type of films (see Figure 3.12) at higher temperatures. An XRDpattern was obtained for a sample in which the Mg film was peeled-off from the Si (001) substrate upon hydrogen desorption up to 400 °C,which shows clearly the presence of Mg2Si. Mg2Si formation at Mg–Siinterfaces reportedly may occur for temperatures above roughly 200 °C[66, 67]. Mg2Si itself is, in principle, an interesting system for hydrogenstorage, as was recently suggested by Vajo et al. [24]. The low formationof enthalpy ∆H = −36.4 kJ mol−1 H2 in the reaction (see Equation (3.1))infers that hydrogen plateau pressures of the order of 1 bar could bereached near room temperature (see Chapter 6)
MgH2 +12
Si 12
Mg2Si + H2. (3.1)
70

3.4. CONCLUSIONS
30 40 50 60 70
2
(111
)
(20
0)
(22
0)
(311
)
(311
)(4
00
)
Mg2Si
Si
/♦♦(1
11)
(22
0)
θ [°]
♦
/♦
0
50
100
150
200
250
Inte
nsi
ty
Figure 3.12 – XRD pattern (using Co Kα) for a sample for which theMg film was peeled-off from the substrate during H2 desorption up to400 °C, showing the formation of Mg2Si at the Mg–Si interface.
3.4 Conclusions
Pd-cap layers play a key role as a catalyst in enhancing the rate-limitingdissociation of H2 molecules at the sample surface of Mg films, loweringthe H2 sorption temperatures significantly. While the desorption temper-atures decrease with a reduction in column width for bare Mg films, theuse of a Pd-cap layer is the dominant factor in determining the H2 kineticsand H2 sorption temperatures. H2 cycling studies on PLD films showedthat the maximum absorbed hydrogen fraction reduces clearly within afew H2 cycles only, which relates to the observed delamination of thePd layer. The formation of Mg-Pd and Mg-Si alloys was observed at thePd–Mg and Mg–Si interfaces for temperatures above 200 °C, resulting inthe formation of Mg2Pd, bcc-MgPd and Mg2Si, which may possibly affectthe hydrogenation processes. Further, positron studies on the PSD filmsconfirm the Mg (metal) to MgH2 (insulator) transformation, and revealthe delamination of ultra-thin Pd-cap layers and Mg-Pd alloys formation.
71


4Catalyzed and uncatalyzed NaAlH4
Crystallites of nano-size dimensions reduce the required transportdistances of hydrogen and metal ions. Further, the presence ofvacancy-related defects may facilitate the diffusion of atoms in
metal hydrides. Therefore, one possible approach to improve the re-versibility of the sorption reactions is the maintenance of crystallite sizesto the nanoscale during hydrogen cycling. Further, the presence of highvacancy concentrations is expected to improve the reaction kinetics inlight-metal hydrides. NaAlH4, catalyzed with titanium (Ti) metal and Tibased compounds such as TiCl3 and Ti(OBu)4, is known to show a rela-tively large reversible hydrogen capacity, practically: 4.5 wt.%, at a mod-erately low operating temperature (150 °C) [14, 22, 23, 68–71]. NaAlH4
releases hydrogen in two steps (see Equation (4.1)) upon heating, involv-ing an intermediate phase Na3AlH6 (sodium aluminum hexahydride) inthe first step, and NaH (sodium hydride) in the second step, with theformation of Al (aluminum) in both steps:
NaAlH4 13 Na3AlH6 + 2
3 Al + H2 (100 °C) (3.7 wt.%) ,Na3AlH6 3NaH + Al + 3
2 H2 (150 °C) (1.9 wt.%) .(4.1)
The significance of the role of these catalysts is well known, but themechanism by which these catalysts enhance the cycling kinetics of hy-drogen and reversibility of reaction has been, and still is, an intriguing
73

CHAPTER 4. CATALYZED AND UNCATALYZED NAALH4
question [72, 73]. A number of different theories about the possible localenvironment and the role of Ti have been suggested [74, 75]. It is indi-cated that Ti dwells on the surface of the material enabling dissociationof hydrogen molecules, and substitutes for Na possibly facilitating the de-composition reactions. It may attract a large number of H atoms [76–78]or induces an increased hydrogen vacancy formation [79–81]. However,previous studies established firmly that Ti is in an environment of Alatoms [74, 75]. Possible mechanisms to be considered should, therefore,be consistent with this finding.
In order to reveal information on the mechanism on a microscopiclevel, an in situ neutron diffraction approach was used. An essential as-pect is that the reversibility of reactions requires a migration of hydrogenand metal species over distances typically of the order of the sizes of thecrystallites. Small crystallite sizes, therefore, may clearly facilitate themass transport of hydrogen (H), Al, and sodium (Na) atoms, yieldingNa3AlH6 and NaAlH4 in the absorption reactions. Thus, it is importantto study the evolution of grain sizes for the catalyzed and the uncatalyzedNaAlH4. Protonated catalyzed NaAlH4 were compared with uncatalyzedNaAlH4 using in situ neutron diffraction, and the phase transformationsduring hydrogen release and deuterium reloading were studied.
Based on the experimental results, an interesting large reduction ofparticle sizes was observed in the catalyzed material. A probable mech-anism by which the TiCl3 enhances the reversibility and cycling kinet-ics is suggested in this chapter. In this mechanism, the importance ofgrain refinement, the phenomenon of maintaining crystallite sizes smalldown to nanometer during the cycling process, is discussed. Further,the detected hydrogen site occupation provides new insights into thehydrogen migration through the mixed phase structures. In particular,quantitative information on hydrogen-vacancy formation and hydrogen-deuterium exchange was deduced from the Rietveld analysis of the neu-tron scattering data. Pronounced hydrogen vacancy formation was ob-served which can play a crucial role in the hydrogen diffusion and pos-sibly also the Al and Na diffusion through the particles during hydrogenrelease and D2 uptake. The in situ neutron diffraction study on TiCl3-
74

4.1. EXPERIMENTAL DETAILS
catalyzed NaAlH4 [82] revealed that crystallite sizes of Na3AlH6 (ap-proximately 200 nm), NaH and Al (approximately 120 nm) remain smallduring hydrogen cycling, in striking contrast to the large sizes (≥1 µm)observed for uncatalyzed NaAlH4. The maintenance of small crystallitesizes is caused by grain refinement, i.e., arresting grain sizes, induced bythe formed TiAlx and NaCl (sodium chloride) compounds, acting as nu-cleation centers for Al and NaH, respectively. Interestingly, TiAl3 and Alshare the same Al lattice planes in their crystallographic structure withonly a small lattice mismatch, a prerequisite for effective grain refine-ment. A similar structure match occurs for NaCl and NaH. Moreover, theneutron study revealed significant hydrogen vacancy formation in bothNa3AlH6 and NaH upon decomposition of TiCl3-catalyzed NaAlH4. Aclear, unexpected and interesting H-D exchange in NaH1−x was observedupon reloading of Na3AlH6 with deuterium. This chapter emphasizes theimportance of grain refining for achieving reversibility and faster kineticsof the hydrogen sorption processes, with a crucial additional role playedby the catalyst besides being a splitter for hydrogen molecules.
4.1 Experimental details
A catalyzed sample was prepared by ball milling protonated NaAlH4 and2 mol% TiCl3 powders with a purity of 99.9999% in a Spex 8000 apparatusfor 15 min. Both, NaAlH4 and TiCl3, were obtained from Sigma Aldrich.A high energy milling was used, which ensures that 15 min was sufficientfor a good distribution of the catalyst with a minimum amount of NaAlH4
decomposition. The alanate was ball milled with a ball to powder massratio of 10:1. As a reference, an uncatalyzed NaAlH4 powder was pre-pared in the same manner without addition of TiCl3. Both samples wereloaded into quartz tubes under an argon atmosphere, which were subse-quently connected to a gas-handling system for use in the in situ neutrondiffraction measurements at GEM diffractometer, ISIS, Oxfordshire, UK.
In the neutron studies, the catalyzed and uncatalyzed NaAlH4 wereheated until the hydrogen release started. A constant flow of hydrogengas at a pressure of 1—2 bar was maintained during hydrogen desorp-
75

CHAPTER 4. CATALYZED AND UNCATALYZED NAALH4
tion at 100 °C in the catalyzed NaAlH4 in order to work under realisticpressure conditions relevant for future applications. In the uncatalyzedNaAlH4, a similar approach was taken, but the sample needed highertemperatures for the first decomposition step to start, accompanying theobserved melting of NaAlH4 phase, in contrast to the catalyzed NaAlH4.Additionally, a sudden increase in the hydrogen release rate occurredafter the onset of the first decomposition step, which did not allow themaintenance of a controlled hydrogen flow.
Deuterium gas was used to study the reloading behavior in the cat-alyzed and uncatalyzed NaAlH4. For the catalyzed NaAlH4, a deu-terium pressure of 10 bar was applied after the first decomposition at100 °C to monitor the D2 uptake by Na3AlH6−x by exchanging H2 andD2, or by filling hydrogen vacancies in the structure. After the comple-tion of the second decomposition step, involving the formation of NaHand Al from Na3AlH6, a 10 bar D2 was applied at 150 °C for reloading.Na3Al(H,D)6 was formed from NaH with Al upon the addition of D2 at150 °C. Subsequently, Na(H,D) and Al were formed upon the decompo-sition of Na3Al(H,D)6 at 150 °C.
A neutron diffraction pattern was acquired at every 10 min during theprocedures described above [38], amounting to a total of 89 spectra forthe catalyzed and 30 spectra for the uncatalyzed NaAlH4. All diffractionspectra were fitted by Rietveld refinement analysis using the GSAS andthe Sequentz programs [35, 83]. The patterns collected in the differentdetector banks were fitted simultaneously, and the phase fractions, latticeparameters, hydrogen site occupancies, and line widths were allowed tovary freely. The grain sizes were calculated directly from the broadeningof the fitted profile using an equation based on Scherrer’s formula. Inthis way, the extracted grain sizes from the diffraction line broadening forthe catalyzed and uncatalyzed NaAlH4 crystallites after the ball millingfound to be the same, i.e., approximately 110 nm.
Additionally, as a reference, protonated NaAlH4 was ball milled with2 mol% Ti metal powder in a Spex 8000 apparatus for 120 min. Thislonger milling time was needed because the Ti-metal is less brittle thanTiCl3. After the ball milling, grain sizes of NaAlH4 were approximately
76

4.2. RESULTS
50 nm extracted from the diffraction line broadening. Ex situ X-raydiffraction was performed on the Ti-catalyzed sample using a Bruker-AXS Type D5005 diffractometer at the Cu Kα wavelength.
4.2 Results
In situ neutron diffraction measurements were carried out on uncatalyzedand TiCl3-catalyzed NaAlH4, and the diffraction patterns were obtainedduring hydrogen cycling. The evolution of different phases over timein the diffraction patterns is shown in the colored plots, i.e., Figure 4.1and Figure 4.2, for the respective samples, after subtraction of the fittedincoherent background due to protons.
4.2.1 Uncatalyzed NaAlH4
In the reference uncatalyzed NaAlH4, four different phases, as expected,namely NaAlH4, Al, Na3AlH6, and NaH, were observed during the des-orption process. The evolution of the phase fractions of these four phasesover time, as extracted from the Rietveld analysis, is presented in Fig-ure 4.3. The neutron diffraction pattern on the ball milled uncatalyzedNaAlH4 powder at room temperature showed a partial decomposition ofNaAlH4, revealed by the presence of a small amount of both Al (approx-imately 8%) and Na3AlH6 (approximately 3%). Upon heating this sam-ple, a small increase in the released hydrogen pressure to approximately350 mbar was observed at 150 °C, indicating the onset of the first decom-position step. The phase fractions of Al and Na3AlH6 phases significantlyincreased upon further heating to 190 °C accompanied by the release ofhydrogen gas. At 190 °C, all the Bragg peaks associated with the NaAlH4
phase disappeared abruptly due to the melting of NaAlH4. However,the Bragg peaks related to the Na3AlH6 and Al phases were still present.Incoherent scattering of neutrons due to hydrogen (protons) contributessignificantly to the background in the diffraction patterns. The observeddecrease in the background levels during hydrogen desorption, there-fore, provided a further measure for the release of hydrogen. The second
77

CHAPTER 4. CATALYZED AND UNCATALYZED NAALH4
0 50 250200100 150
2.5
1.5
2.0
3.0
d-s
pa
cin
g [
Å]
Al
NaHNaAlH4
Na3AlH
6
Time [min]
a
0 50 100 150 200 2500
50
100
150
200
250
Time [min]
A:desorption
(step I)
B:NaAlH
4
melting
C:desorption
(step II)
D:D
2 loading
Tem
pera
ture
[°C
]
b
Figure 4.1 – (a) Neutron diffraction spectra during hydrogen desorp-tion for uncatalyzed NaAlH4. The incoherent background due to hy-drogen was subtracted. The horizontal axis represents a small sectionof the d-spacing range measured. Bragg reflections of four differentphases (NaAlH4, Al, Na3AlH6, and NaH) were detected in uncatalyzedNaAlH4; (b) corresponding change in temperature is plotted over timedescribing the hydrogen release and deuterium loading steps.
78

4.2. RESULTS
0 200 400 600 800
2.5
1.5
2.0
3.0
d-s
pa
cin
g [
Å]
Al
Na(H,D)
NaH
Na3AlH
6
NaAlH4
Time [min]
a
0 200 400 600 800
Tem
pera
ture
[°C
]
Time [min]
A:desorption
(step I)
B:desorption
(step II)
C:D
2
loading
D:desorption
(step II)
b
50
100
150
0
Figure 4.2 – (a) Neutron diffraction patterns plotted over time, showingthe growth and decay of the different occurring phases, NaAlH4, Al,Na3AlH6, NaCl, and Na(H,D), during dehydriding and rehydriding ofTiCl3-catalyzed NaAlH4. The incoherent background was subtracted.The horizontal axis represents a small section of the total d-spacing rangemeasured; (b) corresponding change in temperature is plotted over timedescribing the hydrogen release and deuterium loading steps.
79

CHAPTER 4. CATALYZED AND UNCATALYZED NAALH4
Time [min]
A: 25—190 °C
(step I)
B:NaAlH
4
Melting
C: 230 to250 °C(step II)
D: 150 °C + D
2
NaHAlNaAlH4
Na3AlH
6
Pha
se fr
actio
n [-
]
0.2
0.6
1.0
0.4
0.8
0
0 100 200150 25050
Figure 4.3 – Evolution of the phase fractions of NaAlH4, Na3AlH6, NaH,and Al during hydrogen release in the uncatalyzed NaAlH4. The plotis divided into four intervals A—D; A: hydrogen desorption from roomtemperature to 190 °C; B: Melting of NaAlH4 at 190 °C and the formationof Al and Na3AlH6 (with imposed fixed ratio of 2:1); C: second decom-position step in the temperature range of 230—250 °C; and D: trial of D2loading using a 10 bar pressure at 150 °C and subsequent desorption.
decomposition step, involving formation of NaH and Al phases at theexpense of Na3AlH6, commenced at 230 °C and completed at 250 °C. Fol-lowing the completion of the second decomposition step, an attempt wasmade to reload the uncatalyzed NaAlH4 with a 10 bar deuterium pres-sure at 150 °C, which was unsuccessful. No peaks related to Na3Al(H,D)6
formation could be discerned in the diffraction patterns, confirming theknown irreversible behavior of the uncatalyzed NaAlH4.
80

4.2. RESULTS
4.2.2 Catalyzed NaAlH4
Figure. 4.4 shows the evolution of five different phases, extracted fromthe neutron diffraction spectra by Rietveld analysis, over time in the cat-alyzed NaAlH4.1 Further, a complete reversibility of the second step wasobserved in this case upon hydrogen cycling at 150 °C. No peaks re-lated to Ti, its hydride or alloys such as TixAl1−x, TiAl3 or TiCl3 wereobserved. The first decomposition step started at 100 °C, and the flowof the released hydrogen was maintained to 1—2 bar pressure. TheTiCl3-catalyzed NaAlH4 transformed completely into Na3AlH6 and Alin 270 min, with no signs of NaCl formation yet. The decomposition ofNa3AlH6 into NaH and Al started at 150 °C, and completed in 150 minwith the further release of hydrogen. Bragg peaks of NaCl were observedat this step. The decomposition products NaH and Al completely trans-formed back into Na3Al(H,D)6 upon application of 10 bar of deuteriumpressure at 150 °C. Subsequent desorption of Na3Al(H,D)6 resulted in theformation of Na(H,D) and additional Al.
Clearly, the uncatalyzed and TiCl3 catalyzed NaAlH4 behave differ-ently with respect to their reversibility. Reversibility involves mass trans-port of metal ions and hydrogen. Small crystallites, therefore, will clearlyfacilitate the mass transfer. Considering this fact, the evolution of grainsizes was monitored and compared for both kinds of sample. The grainsizes were calculated from the peak broadening using detailed Rietveldrefinement analysis. The dependence of the width of diffraction peakson d-spacing is consistent with grain size-induced broadening and rulesout significant strain broadening. After ball milling, the grain sizes ob-tained in this manner for catalyzed and uncatalyzed NaAlH4 were ap-proximately 110 nm. In uncatalyzed NaAlH4, the NaH and Al peakswere not broadened, indicating the presence of large grains. The esti-mated grain size is ≥1 µm, corresponding to the resolution limit of thebackscattering bank of GEM for diffraction line broadening. For catalyzedNaAlH4, on the contrary, the grain sizes of NaH and Al were only approx-imately 120 nm, i.e., small and remarkably similar, with modest changesin the size during the various reactions (see Figure 4.5).
1See the fitted patterns in Appendix A.
81

CHAPTER 4. CATALYZED AND UNCATALYZED NAALH4
0 200 400 600 800
Pha
se fr
actio
n [-
]
Time [min]
A: 25—100 °C
(step I)
B:150 °C(step II)
C:150 °C
+ D2
NaH NaClAl
D:150 °C(step II)
NaAlH4
Na3AlH
6
0.2
0.6
1.0
0.4
0.8
0
Figure 4.4 – Growth and decay of NaAlH4, Na3AlH6, NaH, Al, and NaClin terms of extracted phase fractions over time for the TiCl3-catalyzedNaAlH4 during cycling. The four intervals, A—D, in the plot signify; A:First desorption step at 100 °C; B: Second decomposition step at 150 °C;C: 10 bar D2 loading at 150 °C; D: Subsequent desorption after D2 loadingat 150 °C.
The grain sizes of NaCl and Na3Al(H,D)6 were approximately 40 nmand 200 nm, respectively. Hydrogen vacancies facilitate the diffusion ofhydrogen and metal species, making their presence an important param-eter to study. Therefore, the hydrogen occupancy was monitored bydetailed Rietveld analysis of the neutron diffraction patterns. The ex-tracted hydrogen site occupancy effectively represents the coherent cross-section at the hydrogen site, and therefore, can vary either due to hydro-gen vacancy formation or due to exchange of hydrogen with deuteriumafter D2 exposure (see Figure 4.6), as the coherent neutron scatteringlengths of hydrogen and deuterium are different and are of opposite sign
82

4.2. RESULTS
500 600 700 800
Gra
in s
ize
[nm
]
Time [min]
Al
B:150 °C(step II)
C:150 °C
+ D2
D:150 °C(step II)
0
100
200
50
150
250
500 600 800 850
Time [min]
Gra
in s
ize
[nm
]
NaH
B:150 °C(step II)
C:150 °C
+ D2
D:150 °C(step II)
0
100
200
50
150
250
Figure 4.5 – Evolution of grain sizes of Al and NaH over time for theTiCl3-catalyzed NaAlH4, showing a striking similarity in the sizes and aslight variation in the average size of approximately 120 nm.
83

CHAPTER 4. CATALYZED AND UNCATALYZED NAALH4
0 200 400 600 800
Time [min]
HV
NaAlH4
NaH
Na3AlH
6
A: 25—100 °C
(step I)
B:150 °C(step II)
C:150 °C
+ D2
D:150 °C(step II)
-0.5
0.0
0.5
1.0
1.5b
coh(H
+D
)b
coh(H
) [-
]
Figure 4.6 – Variation of the effective coherent scattering length bcoh atthe hydrogen sites normalized to bcoh(H) for NaAlH4, Na3AlH6, andNaH, respectively, over time for the TiCl3-catalyzed NaAlH4. In the in-terval of A and B, bcoh(H+D)/bcoh(H) decreases due to hydrogen va-cancy formation, while in the region C and D, the large reduction inthe relative bcoh is due to a combined effect of hydrogen vacancy andhydrogen-deuterium exchange. The time intervals A—D represent; A:first desorption at 100 °C; B: second desorption at 150 °C; C: loadingdeuterium with 1 bar pressure at 150 °C; D: subsequent pumping out ofdeuterium at 150 °C.
(bcoh(H) = −3.74 fm and bcoh(D) = 6.67 fm). The hydrogen sites remainedfully occupied in uncatalyzed NaAlH4, maintaining the stoichiometry forNaAlH4, Na3AlH6, and NaH over time. On the other hand, Na3AlH6 andNaH showed a considerable lowering in the hydrogen site occupancy inthe catalyzed NaAlH4 sample. Figure 4.6 represents the results in termsof the observed effective scattering length bcoh normalized to scatteringlength of hydrogen bcoh(H) = −3.74 fm for a fully occupied H site.
84

4.3. DISCUSSION
4.3 Discussion
4.3.1 Effect of grain sizes on reversibility
The neutron diffraction results clearly showed that the desorption andthe rehydrogenation behavior of catalyzed and uncatalyzed NaAlH4 is, asexpected, remarkably different. The hydrogen was released smoothly inTiCl3-catalyzed NaAlH4 for both reaction steps at a reaction time scale ofthe order of 150 min. On the other hand, the first reaction step in the un-catalyzed NaAlH4 showed abrupt hydrogen release and involved meltingof the NaAlH4 phase before complete transformation was reached. Fur-ther, the second reaction step was completely reversible upon D2 loadingfor catalyzed NaAlH4 under 10 bar at 150 °C. On the contrary, the uncat-alyzed NaAlH4 could not be reloaded under the same temperature andpressure conditions.
While the above phenomena have been observed in earlier studies,a remarkable correlation between the grain sizes and the rehydrogena-tion reactions is observed here, which was not reported before in stud-ies related to NaAlH4. The decomposition products of the uncatalyzedNaAlH4, such as Na3AlH6, Al, and NaH, showed a clear growth in thegrain sizes to values, ≥1 µm, upon heating. In fact, the NaAlH4 phasealso showed a clear growth in the grain size from approximately 110 nmto 280 nm upon raising the temperature to 160 °C—annealing—before theonset of the first decomposition step.
On the other hand, the TiCl3-catalyzed NaAlH4 showed maintainednano-size grains during the hydrogen cycling. The catalyzed NaAlH4
showed a successful loading by D2 in the second reaction step, and NaHand Al showed grain sizes of approximately 120 nm. This clearly indi-cates that the grain size is an important factor in the rehydrogenationstep. This can be easily understood since reversible hydrogen chargingin these materials requires the transport of H, Al, and Na ions, as well asmixing at the atomic level after phase separation has occurred. Clearly, asmall size of crystallites reduces the diffusion distance, and so enhancesthe kinetics of reloading [84–86]. Noticeably, a partial reversibility ofthe hydrogen sorption was attained [87] for NaAlH4 particles of only a
85

CHAPTER 4. CATALYZED AND UNCATALYZED NAALH4
few nanometers on a surface-oxidized carbon nanofiber support. Hereno transition metal catalyst was added, while the support is described ashaving no chemical reactions with the alanate during sorption or catalyticactivity itself. When correct, this further indicates the large relevance ofthe diffusion distance. Apart from the diffusion distance aspect, smallcrystallites also appear to exhibit significant hydrogen vacancy concen-trations, as described in the following section.
4.3.2 Hydrogen vacancy formation
The role of hydrogen vacancies for hydrogen migration has been widelystudied in interstitial metal hydrides. The hydrogen sorption kinetics incrystalline solids is largely influenced by the presence of vacancies, andis further enhanced by the presence of grain boundaries. Nanoscopicmetal hydride crystallites may contain large amount of vacancies [20],this may facilitate the hydrogen sorption kinetics. While recent theoret-ically studies on the role and presence of vacancies in NaAlH4 and itsdecomposition products have focused on metal vacancies [88, 89], herethe occurrence of a significant hydrogen vacancy formation is shown ex-perimentally for TiCl3-catalyzed NaAlH4. Figure. 4.6 shows the develop-ment of the effective coherent scattering lengths bcoh(H + D)/bcoh(H) forNaAlH4, Na3AlH6, and NaH over time for the catalyzed NaAlH4.
A hydrogen vacancy concentration of roughly 20% was observed forNa3AlH6 from the beginning to the end of time interval “A” and “B” inFigure 4.6, determined from the decrease in effective scattering length.This reduction is deduced from Rietveld refinement fitting, but is alsodirectly observable from the relative change in the Bragg peak intensi-ties for Na3AlH6−x compared to stoichiometric Na3AlH6 (see Figure 4.7).A decrease of 20% in the effective coherent scattering lengths bcoh(H +
D)/bcoh(H) was observed for NaH1−x, which is due to a combination ofthe effects of hydrogen vacancies and the presence of deuterium in NaH.For NaH, the effect of deuterium on the effective scattering of NaH cannot be excluded, as a 10 bar of deuterium pressure was applied after thecompletion of the first decomposition step. A calculation of this effect ofdeuterium on the effective scattering for NaH shows that a minimum of
86

4.3. DISCUSSION
Na3AlH
6
Na3AlH
5.2
NaH0.8
Na3AlH
3.2D
2.8
NaH0.6
D0.4
NaCl
NaAlH4
Al
Calculated
d-spacing [Å]1.0 1.5 2.0 2.5 3.0
a
1.0 1.5 2.0 2.5 3.0
NaAlH4
Na3AlH
5.2 + Al
NaH0.8
+ Al + NaCl
Na3AlH
3.2D
2.8 + Al + NaCl
NaH0.6
D0.4
+ Al + NaCl
Observed
d-spacing [Å]
b
Figure 4.7 – (a) For clarity, simulated patterns extracted from Rietveldrefinement are shown for all occurring phases separately (bottom totop: NaAlH4, Al, Na3AlH6, Na3AlH5.2, NaH0.8, NaCl, Na3AlH3.2D2.8,NaH0.6D0.4) for catalyzed NaAlH4, illustrating the effects of hydrogenvacancy formation in Na3AlH6−x and H-D exchange in NaH1−x onthe Bragg peak intensities. The simulated spectra for Na3AlH5.2 andNa3AlH3.2D2.8 were normalized against the strongest peak of Na3AlH6at a d-spacing of 2.755 Å; (b) The fitted observed neutron diffraction pat-terns for the respective phases are shown for reference. The spectra areplotted after subtraction of the incoherent background due to hydrogen.
3—5% concentration of hydrogen vacancies is still present in NaH. Here,the changes in the Bragg peak intensities were not easily deduced bythe eye from the neutron diffraction patterns. The intensities of the evenindex NaH1−x Bragg peaks rise according to
I ∝ |Fhkl |2 ∝ (bcoh(Na) + (1 − x)bcoh(H))2 = (3.74x − 0.11)2 (4.2)
or I ∝ (x − 0.03)2 for hkl even with hydrogen vacancy fraction x. Never-theless, a combination of Rietveld refinement and a clearly observed H-D
87

CHAPTER 4. CATALYZED AND UNCATALYZED NAALH4
exchange at such a low temperature of 150 °C in NaH, provide a prooffor the presence of large amount of hydrogen vacancy formation in NaHfor catalyzed TiCl3-NaAlH4.
The observed abundant unoccupied hydrogen sites may well facili-tate hydrogen diffusion through the sample, as was reported by Schim-mel et al. in the case of nanostructured and catalyzed MgH2−x [20]. Thepresence of vacancies facilitates the hydrogen diffusion by decreasing themigration energy for hydrogen. On the contrary, no change in the hy-drogen site occupancies from the stoichiometric value, was observed forNaAlH4, Na3AlH6, and NaH for uncatalyzed NaAlH4. Previous studiesproposed that the prevention of phase separation and its related strainsand interfacial energy in nanoscale crystals leads to vacancy formation innano-crystalline (approximately 120 nm) MgH2−x [20]. Similarly, strongstructural changes were observed as a result of the prevention of intra-nanocrystallite phase separation for small particle size in Li-insertioncompounds with sizes in the range 7—120 nm [28]. Such phase sepa-ration related effects may also occur here for the nano-crystalline reactionproducts, Na3AlH6 and NaH, promoting hydrogen vacancy formation.The large amount of vacancy formation in Na3AlH6 may be due to alow formation energy for a vacancy, either related to size effects, or tothe presence of Ti, as suggested in recent ab-intio studies on Na3AlH6
and NaAlH4 [80] showing that low hydrogen vacancy formation ener-gies indeed can be reached. Palumbo et al. [79] recently showed thepresence of local relaxation dynamics in the decomposition of NaAlH4
using anelastic spectroscopy, indicating hydrogen vacancy formation inNa3AlH6. A mechanism for the vacancy formation was described basedon the weakening of the local H–Al bonds, which was linked to the pres-ence of Ti. A model to explain the increased hydrogen transport was alsoproposed [79].
The situation in NaAlH4 for hydrogen sorption is more complicatedthan that for nano-crystalline MgH2−x because of the involvement of alarge number of phases. Nevertheless, it is proposed that the large va-cancy densities in the catalyzed NaAlH4 appear to be induced by thenanoscale of the Na3AlH6 crystallites, while the Ti-catalyst may play a
88

4.3. DISCUSSION
key role in the initial vacancy formation in Na3AlH6, as suggested by abinitio calculations and by anelastic spectroscopy studies. Ti, however, isnot expected to play such a role for the NaH crystallites, since earlierTEM studies [90] demonstrated that for the NaH–Al state the Ti is en-tirely located in the TixAl crystallites. For NaH, a model to explain wasevaluated the large amount of vacancies (see Chapter 5).
4.3.3 Grain refinement by the TixAl1−x and NaCl particles
As already mentioned in the beginning of this chapter, crystallites ofnano-size are important for reversibility and possibly also for hydrogenvacancy formation. Starting with nano-size crystals can be done easilysuch as by grinding the powder in a ball mill. However, maintaining thecrystallite size small during the loading and unloading process is chal-lenging and very important, as the crystallite otherwise generally growin size during hydrogen cycling.
Studies on solidification of liquid aluminum [26, 27] have shown thatTiAl3 acts as a grain refiner—prevention of agglomeration—for Al crystal-lites. Small TiAl3 crystallites enhance the nucleation of solid aluminum.When a sufficient amount of nucleation centers (see Figure 4.8) is presentin a well dispersed configuration, they do not allow the Al grains to growbeyond a certain size [26,27]. On the other hand, the absence of sufficientnucleation centers may lead to superheating [91] before a structural phasetransition take place, yielding relatively large Al crystallites. The neutronexperiment also showed that the uncatalyzed NaAlH4 could be heatedeven above its standard melting temperature of 180 °C, before the majordecomposition and melting occurs, resulting in large Al and Na3AlH6
crystallites.Previous synchrotron X-ray diffraction and XAFS (X-ray absorption
fine structure) studies on 6—10 mol% TiCl3 catalyzed NaAlH4 clearlyshowed the presence of TixAl1−x, Ti dissolved in Al, alloys after cy-cling [74, 92, 93]. A TEM study on NaAlH4 catalyzed with 4 mol% TiCl3
revealed TiAl3 formation with hydrogen desorption [90]. Therefore, itis expected that TixAl1−x formation also occurred in the present experi-ment. However, such TixAl1−x phase was not detected in the diffraction
89

CHAPTER 4. CATALYZED AND UNCATALYZED NAALH4
Figure 4.8 – A schematic picture showing that the high density of nucle-ation centers (NaCl /TixAl1−x) leads to finer grains.
patterns, possibly, because of the small amount of the catalyst and theoverlap of the TixAl1−x Bragg peaks with the Al metal Bragg peaks.
One of the important conditions for the grain refining action to hap-pen is to have a good lattice matching between the substrate, nucleationcenter, and the adherent material. In view of the known grain refineraction of TiAl3 for Al, the presence of TixAl1−x, which has a distortedAl crystal structure, is responsible for arresting the crystallite sizes ofAl to a certain size and preventing the agglomeration of Al crystallites.Interestingly, NaH and NaCl share the same rock salt crystal structurewith a reasonably small lattice mismatch of close to 15%, see Table 4.1.Table 4.2 shows the structural parameters, extracted from the Rietveldrefinement, for the other occurring phases during sorption reactions ofTiCl3-catalyzed ball milled NaAlH4
This may facilitate NaCl to act as a grain refiner for NaH and viceversa. NaCl grew simultaneously with NaH during the second decompo-sition step. After the complete formation of NaCl, approximately 40 nmin grain size, NaCl may act as grain refiner for Na(H,D) and stabilizethe size of NaH crystallite in the last decomposition. Based on crystallitesizes and phase concentrations, approximately 1—2 NaCl crystallites per
90

4.3. DISCUSSION
Table 4.1 – Obtained structural parameters of the NaH and NaCl con-taining phases observed during sorption reactions of TiCl3-catalyzed ballmilled NaAlH4.
NaH [Fm3m]Lattice parameter at 150 °C a1, a2, a3 = 4.91 ÅAtom site in Wyckoff notation Na: 4a (0, 0, 0)
H: 4b (0.5, 0.5, 0.5)Occupancy Na: 1.000
H: 1.000 down to 0.72
NaCl [Fm3m]Lattice parameter at 150 °C a1, a2, a3 = 5.673 ÅAtom site in Wyckoff notation Na: 4a (0, 0, 0)
Cl: 4b (0.5, 0.5, 0.5)Occupancy Na: 1.000
Cl: 1.000
NaH crystallite were estimated to form, which seems adequate for the ac-tivity as nucleation centers and to prevent NaH crystallite agglomerationbeyond approximately 120 nm. Further, the observed sizes of the result-ing Na3AlH6 crystallites—average approximately 200 nm, matches wellwith the combined volume of 3 NaH and 1 Al crystallite with a diameterof approximately 120 nm each.
4.3.4 Comparison with Ti-metal catalyzed NaAlH4
Haiduc et. al showed that doping of NaAlH4 with either TiCl3 or Ti(OBu)4
results in different Ti-compounds upon hydrogen desorption [94]. Thiswas a motivation to study also the evolution of grain sizes of 2 mol%Ti-metal catalyzed NaAlH4 by ex situ XRD after hydrogen desorption,enabling a comparison with TiCl3-catalyzed NaAlH4. The results showthat the grain refining action may well depend on the amount, type, and
91

CHAPTER 4. CATALYZED AND UNCATALYZED NAALH4
Table 4.2 – The structural parameters for NaAlH4, Na3AlH6, and Al ex-tracted from the Rietveld refinement during sorption reactions of TiCl3-catalyzed ball milled NaAlH4.
NaAlH4 [I41/a]Lattice parameter at 100 °C a1, a2 = 5.044 Å, a3 = 11.434 ÅAtom site in Wyckoff notation Na: 4a (0, 0.2500, 0.1250)
Al: 4b (0, 0.2500, 0.6250)H: 16f (0.2340, 0.3860, 0.5500)
Occupancy Na: 1.000Al: 1.000H: 1.000
Na3AlH6 [P21/n]Lattice parameter at 100 °C a1 = 5.449 Å, a2 = 5.536 Å, a3 = 7.802 ÅAtom site in Wyckoff notation Na1: 2a (0, 0, 0.5)
Na2: 2b (-0.006, 0.4601, 0.2518)Al: 4e (0, 0, 0)H1: 4e (0.091, 0.041, 0.215)H2: 4e (0.234, 0.328, 0.544)H3: 4e (0.165, 0.266, 0.944)
Occupancy Na1: 1.000Na2: 1.000Al: 1.000H1, H2, H3: 1.000 down to 0.82
Al [Fm3m]Lattice parameter at 100 °C a1, a2, a3 = 4.064 ÅAtom site in Wyckoff notation Al: 4a (0, 0, 0)Occupancy Al: 1.000
92

4.3. DISCUSSION
Table 4.3 – Comparison of the grain sizes of the NaAlH4, NaH, andAl phases during sorption reactions in TiCl3-catalyzed and Ti-catalyzedNaAlH4.
Sample Sample treatment Grain size [nm]
NaAlH4 NaH Al
TiCl3-catalyzed NaAlH4 Ball milled 110150 °C 120 120150 °C + D2, 150a
Ti-catalyzed NaAlH4 Ball milled 500.5 h at 150 °C 100 2202 h at 170 °C 120 2208 h at 180 °C 100 190
aSee Figure 4.5
structure of the Ti alloys formed. In contrast to TiCl3-catalyzed NaAlH4,the Al and NaH crystallites for Ti-catalyzed NaAlH4 showed a growth ofa factor of 4 and 2, respectively, compared with the initial grain size ofNaAlH4 after the ball milling (Table 4.3).
The observed growth may be due to the dispersion of Ti in the TixAl1−x
may be different relative to TiCl3-catalyzed NaAlH4, where the TiCl3 cata-lyst may be dispersed more homogeneously, resulting in smaller Al crys-tallites. Further, growth in NaH crystallite size to a factor of 2 comparedwith the initial grain size of NaAlH4 in the absence of NaCl confirmsthe grain refining action of NaCl. Interestingly, the NaH crystallites donot show any further growth at higher temperature over prolonged time(Table 4.3). This may indicate that the presence of nanoscale Al crystal-lites, stabilized by TixAl1−x alloys, imposes a morphology in which NaHcrystallites cannot grow upon annealing.
93

CHAPTER 4. CATALYZED AND UNCATALYZED NAALH4
4.3.5 Hydrogen-deuterium exchange in NaH
The evolution of the effective scattering lengths bcoh(H + D)/bcoh(H) ofthe Na3AlH6 and NaH phases (Figure 4.6) show a further significant re-duction during D2 loading of NaH together with Al in the time interval“C”. Interestingly, this large reduction in bcoh(H + D)/bcoh(H) is primar-ily related to hydrogen-deuterium (H-D) exchange [95] upon D2 loading.This reduction is not due to an increase in amount of H vacancies in nano-NaH. The negative values of observed bcoh(H + D)/bcoh(H) are caused bythe opposite sign of scattering length of D2 with respect to bcoh(H). Ad-ditionally, the H-D exchange in NaH is clearly visible by the appearanceof additional, even indexed, Bragg peaks in the neutron diffraction pat-terns of Na(H,D), as shown in Figure 4.7. The incorporated deuteriumfraction x in NaH1−xDx can be sensitively monitored by the rise of theeven-indexed peaks upon H-D exchange (see Equation (4.3)) in the neu-tron diffraction peaks
I ∝ (bcoh(Na) + (1 − x)bcoh(H) + xbcoh(D))2 = (10.41x − 0.11)2 (4.3)
or I ∝ (x − 0.01)2 for even hkl. The NaH diffraction exhibits onlyodd-indexed peaks. The presence of odd-indexed peaks only in NaH iscaused by accidental extinction of the even-indexed peaks because thecoherent neutron scattering lengths of Na (+3.62 fm) and H (−3.74 fm)are almost equal, but are opposite in sign. The formation of Na3Al(H,D)6 in the region “C” is expected; however, the exchange of deuteriumwith hydrogen in nano-NaH lattice is surprising. NaH is known to be arather stable compound, with a very low hydrogen equilibrium pressureof about 0.01 mbar at 150 °C [96]. This infers that, despite the stability ofNaH, H-D exchange happens fairly rapidly for such NaH nano-particle.Clearly, the presence of abundant H-vacancies in nano-NaH, as detectedhere, are essential for H-D exchange to happen on the observed timescaleof approximately 100 min at a relatively low temperature. The presence ofvacancies reduces the characteristic diffusion time by lowering the migra-tion energy for hydrogen. Further, this might suggest that NaH crystal-lites play a role in dissociating hydrogen molecules at their surfaces [97].
94

4.4. CONCLUSIONS
In contrast, the uncatalyzed-NaAlH4 did not show any exchange of hy-drogen with deuterium in NaH. In view of the above discussion, a plau-sible reason for the absence of H-D exchange in the uncatalyzed NaAlH4
sample is due to the absence of vacancies in the large NaH crystallites.
4.4 Conclusions
TiCl3 catalyzed and nanostructured NaAlH4 has superior reversible hy-drogen sorption behavior as compared to uncatalyzed NaAlH4. Thisstudy showed clear differences in the crystallite sizes of the occurringphases in the catalyzed and uncatalyzed NaAlH4. Uncatalyzed NaAlH4
showed large crystallites, with sizes ≥1 µm, for all occurring phases dur-ing the desorption, making it irreversible for deuterium loading. Onthe other hand, the catalyzed NaAlH4 showed the presence of nano-crystallites of NaH and Al with the size of approximately 120 nm, whichwere maintained during the unloading and loading cycling.
The grain refining action of the reaction products TixAl1−x and NaClfor Al and NaH, respectively, is responsible for maintaining the grainsizes to nano-dimension. The nanostructured NaH and Na3AlH6 phasesshowed the presence of abundant hydrogen vacancies, which leads to H-D exchange in nano-NaH at a relatively low temperature of about 150 °C.Nano-size crystallite dimensions reduce the required transport distancesof hydrogen and metal ions, while the presence of vacancies facilitates iondiffusion. Therefore, the maintenance of crystallite sizes at the nanoscaleduring hydrogen cycling and the tailoring of vacancy concentrations arekey ingredients for the improvement of the kinetics and reversibility ofhydrogenation reactions in light-metal hydrides.
95


5Ab initio calculations on NaH
Agood hydrogen storage system should have satisfactorily fast
hydrogen release and uptake kinetics, while meeting the otherstringent storage conditions such as high gravimetric and volu-
metric densities. Moreover, it should also show high reversibility. Thepresence of crystal defects is known to have a significant influence on thediffusion of atoms and ions [98–100]. They will, therefore, affect the masstransport in the materials in a direct manner, which is of large signifi-cance for the reversibility of the hydrogenation reactions. Therefore, itbecomes important to study the presence and the formation of vacanciesin the hydrogen storage materials.
A number of recent studies on hydrogen storage and (lithium) Li-ionmaterials, nano-MgH2−x and nano-LixTiO2, show that nano-sized crys-tallites may contain very high hydrogen vacancy concentrations and alargely increased lithium solubility [20, 28, 101]. For NaAlH4, recent ex-perimental and calculation studies shed light on the presence and their ef-fect on the reaction kinetics and reversibility [79,81]. The neutron diffrac-tion studies [82] (see Chapter 4) showed pronounced hydrogen-vacancyformation in the resulting decomposition products Na3AlH6−x (approx-imately 20%) and NaH1−x (≥3%) in the TiCl3-catalyzed and nanostruc-tured NaAlH4 (see Chapter 4). This study also suggested a further im-portant role of TiCl3 as a grain refiner, besides acting as a hydrogen split-
97

CHAPTER 5. AB INITIO CALCULATIONS ON NAH
ter [23, 68, 102]. Further, in the nano-NaH1−x phase, an unexpected, clearand relatively fast H-D exchange was also observed. In contrast, thisexchange was absent in vacancy deprived large crystallites of undopedNaAlH4. It is believed that the transport kinetics and H-D exchange isdirectly related to the presence of abundant vacancy defects in the nano-NaH phase.
This chapter presents ab initio calculations of the vacancy mediatedhydrogen migration energies in bulk NaH and at the NaH (001) surface.In particular, the relevant migration energies were studied in detail, asthey control the diffusion and magnitude of the diffusion coefficient foratomic hydrogen in the presence of hydrogen vacancies (HV) in the NaHlattice. Further, the formation energies for various hydrogen defects, va-cancies HV and interstitials HI, in the NaH lattice were obtained in allpossible charged states (+1, 0, −1) [80]. Various charge states of the de-fects need to be considered, as the defects introduce additional energylevels in the band structure of this ionic salt host material consisting ofNa+ and H− ions. Finally, a model on the interface of NaH with NaCl,the latter acting as a nucleation center, was evaluated to explain the largeamount of hydrogen vacancies in nano-NaH observed experimentally inthe TiCl3-doped NaAlH4 upon hydrogen cycling. The model shows thatthe formation of an in-between (face-centered cubic) fcc-Na layer is pre-ferred, providing a source for the detected high vacancy concentrations.Notably, mechanisms explaining the relatively fast hydrogen transportin the NaH nano-particles involving Ti can be largely excluded, as it isknown that Ti is not incorporated in the NaH nano-particles [103].
5.1 Computational procedure
Ab initio calculations, based on DFT [40, 41], were carried out using theUSPP and GGA [104, 105]. The calculations were implemented in theVASP code [44]. Ultra-soft potentials with the valence states 3s for Na, 1sfor H, 3s and 3p for Cl (Chlorine) were used. The geometry optimizationcalculations were performed with a 200 eV and 219.242 eV energy cut-off for NaH and NaCl, respectively, with the convergence criteria set at
98

5.1. COMPUTATIONAL PROCEDURE
2×10⁻⁵ eV atom−1. The Brillouin zone was sampled using a Monkhorst-Pack sampling technique [106]. A 5×5×5 grid was used for bulk NaH,Na, and NaCl using a 64 atom supercell, while 6×6×1, and 9×9×1 k-point grids were used for the NaH surface (001) (160 atoms) and NaCl–NaH (001) (320 atoms and 40 atoms) interface calculations, respectively.The equilibrium atomic positions after relaxation of the structure werecalculated starting from bulk positions using the refined crystallographicdata of Refs. [107, 108] (obtained from ICSD database), and the unit cellparameters were validated by optimizing the unit cell. The calculatedunit cell parameters showed minor and expected deviations relative to theexperimental values for bulk single crystals of 3% for NaH (experimen-tally 4.89 Å, calculated 4.73 Å), 4% for fcc-Na (expected 5.33 Å, calculated5.10 Å), and 3% for NaCl (experimentally 5.63 Å, calculated 5.47 Å). Theband gap, Eg, of 3.51 eV for bulk NaH deduced from these calculationsis 3% smaller than obtained in a recent other DFT-based study [109], em-ploying PAW potentials. This small difference may be the result of thelarger lattice parameter of 4.82 Å, and the other potentials for the inter-action between ions and electrons used in the latter study. A very similaroverall electron energy density-of-states (DOS) was obtained.
After calculating the equilibrium structure and total energy of the per-fect crystal, a hydrogen vacancy (HV) was introduced into an otherwiseperfect lattice. The formation energies for hydrogen-related defects in allcharged states (+1, 0, −1) for bulk NaH were calculated. This energy wascompared with the energy to create a vacancy at the NaH (001) surfaceto examine the influence of nanoscale dimensions on the formation en-ergy for a vacancy. Further, migration energies were calculated to studythe diffusion through bulk NaH and the near-surface layers of NaH. Ad-ditionally, the migration energy for an isolated hydrogen atom in fcc-Nawas also studied. All bulk and interface calculations were performed withand without relaxation of selected Na atoms around the defect, while thesurface calculations were done without relaxation of atoms. The energycosts to introduce a defect into a perfect lattice, i.e., the formation energyof the respective defect Ef, was calculated as follows [110, 111]:
Ef = E(defectq) − E(bulk) ± µH + qEF, (5.1)
99

CHAPTER 5. AB INITIO CALCULATIONS ON NAH
where the first and second term are the total energies of supercells withand without a defect, respectively. µH is the chemical potential of hydro-gen at T = 0 K, which is fixed to half of the energy of an H2 molecule,i.e., 2.21 eV. The sign of the µH term is positive if a hydrogen vacancy iscreated and negative in case a hydrogen interstitial is created. The lastterm in Equation (5.1) relates to charged defects, q is the charge of thedefect and EF is the energy of the reservoir with which these charges areexchanged, i.e., the Fermi energy level or the electron chemical potential.The equilibrium concentration χ of a defect at a given temperature T,with the Boltzmann constant kB, can be calculated using
χ = exp
(
−Ef
kBT
)
. (5.2)
Further, the energy and relaxed geometry for a set of different interfaceswere calculated , including the Na–NaH (30 atoms), NaCl–Na (30 atoms)and NaCl–NaH (40 atoms) (001) interfaces, motivated by the growth ofNaH on NaCl crystallites acting as nucleation centers, as described bySingh et al. [82]. The interface energy (Eint) is defined as the difference inthe energy of an interface system relative to the energies of the involvedbulk crystals, as given in Equation (5.3) below
Eint = E(interface system) − ∑ E(bulk crystals). (5.3)
5.2 Results and discussion
5.2.1 Migration energies and diffusion coefficients
The hydrogenation kinetics of a hydrogen storage material is often rate-limited by a diffusion-controlled reaction and transport, determining theeffective velocity at which the hydrogen atoms can diffuse through thesolid matrix. A hopping model was used to imitate the vacancy-mediatedhydrogen diffusion in fcc-NaH.
Based on the hopping diffusion model, a hydrogen atom (neighbor-ing a vacancy) is thermally excited, and vibrates around its equilibrium
100

5.2. RESULTS AND DISCUSSION
position. This vibrational motion has a frequency ν0, which is materialdependent, and is typically of the order of 1012 s−1 to 1013 s−1. For eachof the vibrational cycles, a finite and small probability of hopping intothe neighboring vacant lattice site exists, which depends on the relativemagnitude of the energy barrier height Em (the migration energy) and thethermal vibrational energy kBT. The diffusing atom needs to cross thisEm in order to reach the vacancy by pushing the surrounding atoms apartand squeezing through. This process is facilitated, when more than oneneighboring lattice sites are vacant. However, these calculations considerthe tractable case of hopping into an isolated hydrogen vacancy, which isstrictly valid in the limit of low vacancy concentrations.
Mathematically, the model is represented by the expressions givenin Equation (5.4) below for the diffusion constant, where the factor 1/6takes care of the 3D bidirectional motion in the fcc-sublattice, and s isthe distance, which a diffusing atom covers to reach the vacancy (seeFigure 5.1 for the case of NaH). The concentration of vacancies χ is inthermal equilibrium given by the Equation (5.2). The diffusion constantdefined in Equation (5.4) and Equation (5.5) can be used to calculate thecharacteristic diffusion time t, given in Equation (5.6), for hydrogen tomove out of or into a grain of radius R
D =16
s2ν0χ exp(−Em
kBT
)
, (5.4)
D0 =16
s2ν0, (5.5)
t =R2
6D. (5.6)
These equations are strictly valid for the diffusion of an isolated vacancysolely, since the related diffusion motion of the hydrogen atoms is corre-lated because the chance of hopping back into the original lattice positionis larger than towards other positions. This can be accounted for by acorrelation factor ξ which is of order ≤1, which has been discarded here.For the comparison with experiments, the primary interest is in obtainingthe correct order of magnitude of the diffusion time scale, rather than amodel dependent exact value.
101

CHAPTER 5. AB INITIO CALCULATIONS ON NAH
X
Y
VP
O
O
Em
r
V
X
Y
P
Figure 5.1 – A schematic diagram showing the hydrogen path to a neigh-boring hydrogen vacancy used in the calculations. The selected 10 Naatoms neighboring the vacancy were allowed to relax. Small gray circlesrepresent hydrogen atoms and black large circles represent Na atoms.The big open circle containing “V” represents an isolated hydrogen va-cancy.
For NaH, the migration energy for the hydrogen vacancy was cal-culated in all possible charged states with and without selective atomicrelaxation. This was achieved by calculating the cohesive energy of the63 atoms supercell for different positions of hydrogen on the path towardthe hydrogen vacancy moving along the 〈110〉 NaH diagonal (see Fig-ure 5.1). The neighboring 10 Na atoms around the vacancy were allowedto relax. The hydrogen migration energy Em in the presence of a vacancywas deduced from the resulting curve as shown in Figure 5.2 for a neutralvacancy. Em is the difference in energy at point O and at the saddle pointP, and is 0.94 eV for the case of a neutral vacancy. This is significantlylower than for the case of a direct-exchange of hydrogen with one of itsneighboring hydrogen atoms, i.e., in absence of a vacancy, with a calcu-lated migration energy of 4.05 eV. Further, the attempt frequency fromthe same curve by a parabolic fit near the equilibrium position O wasestimated, using Equation (5.7) with k the force constant of the locallyharmonic hydrogen vibration
102

5.2. RESULTS AND DISCUSSION
0.0 0.4 0.8 1.2 1.6
-167.6
-167.2
-166.8
Em= 0.94 eV
r [Å]
Ene
rgy
[eV
] = 1.74×10¹³ s-1ν
0
PO
Figure 5.2 – Calculated total energy as a function of hydrogen posi-tion along the direct path of hydrogen toward the neighboring hydrogenvacancy in bulk NaH. The local minimum at point O was fitted by aparabola for the estimation of the local hydrogen vibration frequency.
E =12
kr2, (5.7)
ν0 =1
2π
√
k
m. (5.8)
The lattice point O corresponds to a local minimum, and point P is a sad-dle point, which was verified by calculating the total energy as a functionof displacement of the hydrogen atom in directions perpendicular to theline connecting the lattice point O and saddle point P. Notably, the ob-tained frequencies of 17—18 THz (Table 5.1) are situated in the lower partof the high frequency interval of hydrogen dominated vibrations in thephonon DOS for bulk NaH calculated by Ke et al. [109].
The hopping model was used to assess the diffusion coefficients forthe various types of vacancies. Subsequently, the characteristic diffusiontime was deduced for hydrogen to cover a given distance, correspond-ing to an average NaH grain size of 60 nm in radius (see Table 5.1).For the neutral vacancy, the thus found time, which is needed for hy-
103

CHAPTER 5. AB INITIO CALCULATIONS ON NAH
Table 5.1 – Migration energy for hydrogen in the presence of variouscharged vacancies (+1, 0, −1) in NaH including local structure relax-ation, and characteristic diffusion time for hydrogen to cover a diffusiondistance of 60 nm at a temperature of 150 °C.
Type of vacancy ν0 × 1013 Em D t
[s−1] [eV] [nm2 s−1] [s]
H0V 1.74 0.94 0.63 950
H+V 1.72 0.57 1.7×10⁴ 0.21
H−V 1.77 1.17 1.29×10⁻³ 4.5×10⁵
drogen to cover this distance at 150 °C for the experimentally observedvacancy concentration of 3% (minimum) is 950 s. This is in agreement,to at least within the correct order of magnitude, with the time scale ofH-D exchange observed in neutron diffraction measurements [82]. Themigration energy of 4 eV, in absence of vacancies, clearly leads to negligi-ble hydrogen diffusion at this temperature and time scales, showing thatvacancies are crucial for H-D exchange in NaH at 150 °C.
As expected for isolated hydrogen atoms in fcc-Na, the hydrogen dif-fusion is here much faster with a diffusion time of the order of 6.7×10⁻⁴ sonly, showing the high mobility of hydrogen in fcc-Na. These calculationsfurther show that the positively charged vacancy H+
V has the lowest mi-gration energy among the three possible types of isolated vacancies inNaH. Therefore, once they are formed, H+
V will induce the fastest hy-drogen diffusion rate. In order to cover the distance of a grain radius at150 °C, a H+
V vacancy concentration of only 5.6×10⁻⁶ would be neededin order to attain a diffusion time of the order of 950 s. Based on theformation energy of 0.68 eV, as presented in more detail in the next sec-tion, an equilibrium concentration of 7.1×10⁻⁹ at 150 °C is derived, i.e.,still lower by 2—3 orders of magnitude. Nevertheless, this shows that,once they are formed, these positively charged vacancies will be highlymobile, and can easily travel macroscopic distances at suitable hydrogencycling temperatures resulting into a significant increase in the reaction
104

5.2. RESULTS AND DISCUSSION
kinetics in light-metal hydrides. Notably, the diffusion time would besomewhat larger for the case of deuterium atoms, used for example inmonitoring the H-D exchange processes, by of the order of
√2 as of their
higher mass.Considering the effect of the local hydrogen migration energy, it is
remarkable that these calculations on the unrelaxed NaH (001) surfaceindicate that hydrogen moves more easily inwards, deeper into the NaHsubsurface region, than outwards to the top NaH layer. The obtainedmigration energy for a hydrogen atom to move from the second layer tothe top NaH layer is, namely, 1.37 eV in the presence of a neutral vacancy,while Em for the reverse motion from the top layer inwards to the belowlayer is only 1.22 eV, induced by the weaker binding of the hydrogen atomin the topmost layer.
5.2.2 Formation energies for a variety of defects
Clearly, the formation energy of hydrogen vacancies is an important fac-tor in determining the vacancy concentrations present in the material.This formation energy, together with a vacancy specific hydrogen migra-tion energy, will be the dominant factor in determining the activationenergy for diffusion, and correspondingly, the hydrogen kinetics. There-fore, this section focuses on the formation energies of hydrogen vacan-cies and interstitials in the various charge states. Further, a model rele-vant for explaining large vacancy concentrations in metal hydride nano-particles in general was evaluated. It was found that this mechanism caninduce the high hydrogen vacancy concentrations in the specific case ofNaH nano-particles resulting during the hydrogen desorption reactionsof TiCl3-doped NaAlH4.
Table 5.2 presents the formation energies of neutral and charged va-cancies in bulk NaH before and after structural relaxation. Interestingly,the vacancy formation energy for a positive vacancy H+
V is substantiallylower than that of the negatively charged and neutral vacancies, and ismost affected by a structural relaxation in which Na atoms, neighboringthe positively charged vacancy, show a distinct outward relaxation. Theformation energies of hydrogen vacancies and interstitials in their three
105

CHAPTER 5. AB INITIO CALCULATIONS ON NAH
Table 5.2 – Formation energies of the H vacancy in the various chargedstates in bulk NaH and at the NaH (001) surface, calculated with theFermi energy at 0 eV, i.e., equal to the top of the valence band.
Type of vacancy Formation Energy [eV]
Bulk Surface
unrelaxed relaxed unrelaxed
H0V 2.66 2.61 2.47
H+V 1.18 0.68 3.21
H−V 4.98 4.93 3.59
charge states are plotted in Figure 5.3 as a function of Fermi level po-sition in the NaH band gap. The zero of the Fermi level is set at thevalence-band maximum. Figure 5.3 shows that the combination of apositively charged vacancy H+
V with a negatively charged hydrogen in-terstitial H−
I , satisfying the charge neutrality condition, has the lowestformation energy, indicating that this combination is the most probableto occur. However, the formation energy of this vacancy-interstitial pair is1.53 eV, which is still too high to explain the high vacancy concentrationsand the fast H-D exchange time scales as observed in neutron diffractionexperiments.
Further, the formation energy of an isolated hydrogen vacancy at theNaH (001) surface was calculated, since surfaces play an important rolein nano-particles as of their largely increased surface-to-volume ratios.These calculations show that indeed the energy of creating a neutral va-cancy at the NaH surface in its topmost layer is more favorable than inthe bulk, with a vacancy formation energy of 0.2 eV lower than that ofthe bulk value. Nevertheless, this effect is too small to account for theobserved high hydrogen vacancy concentrations.
The hydrogen vacancy formation at the unrelaxed NaCl–NaH inter-face at the intermediate Na lattice parameter of 5.10 Å was also consid-ered. The formation energy for an isolated neutral hydrogen vacancy at
106
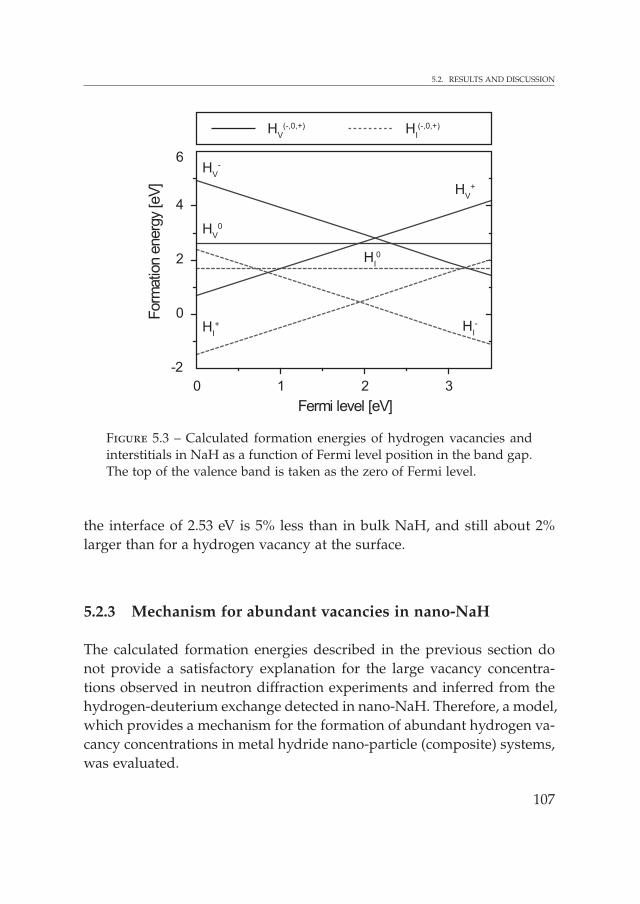
5.2. RESULTS AND DISCUSSION
Fermi level [eV]
HI-H
I+
HI0
0 1 2 3
For
mat
ion
ener
gy [e
V]
-2
0
2
4
6
HV
+
HV
-
HV
0
HV
(-,0,+) HI(-,0,+)
Figure 5.3 – Calculated formation energies of hydrogen vacancies andinterstitials in NaH as a function of Fermi level position in the band gap.The top of the valence band is taken as the zero of Fermi level.
the interface of 2.53 eV is 5% less than in bulk NaH, and still about 2%larger than for a hydrogen vacancy at the surface.
5.2.3 Mechanism for abundant vacancies in nano-NaH
The calculated formation energies described in the previous section donot provide a satisfactory explanation for the large vacancy concentra-tions observed in neutron diffraction experiments and inferred from thehydrogen-deuterium exchange detected in nano-NaH. Therefore, a model,which provides a mechanism for the formation of abundant hydrogen va-cancy concentrations in metal hydride nano-particle (composite) systems,was evaluated.
107

CHAPTER 5. AB INITIO CALCULATIONS ON NAH
NaCl–Na–NaH growth model
In the TiCl3-doped NaAlH4 system, NaCl is formed simultaneously withNaH in the second desorption step [82]. The small and abundant NaClcrystallites very likely act as nucleation centers for subsequent growthof NaH, since NaH and NaCl share the same rock-salt crystallographicstructure and a similar ionic bonding at a fair lattice matching. Thesefactors will promote an easy growth of NaH on NaCl nucleation cen-ters. This was examined by calculating the interface energy for a cube-on-cube growth with NaH (100)–NaCl (100). The lattice mismatch forNaH–NaCl, fcc-Na–NaCl, fcc-Na–NaH as deduced from the calculationsof the respective bulk equilibrium lattice parameters is 13.5%, 6.7%, and7.3% for the (001)–(001) interfaces. While other orientations, such as NaH(111)–NaCl (200), may provide a better lattice matching, the occurrenceof such an interface is not likely. This is because the atomic bonding is byfar less favorable and the resulting interface involves the creation of theenergetically unfavorable polar NaH (111) termination. For example, aMgO (100) termination is often observed with the nucleation and growthof embedded nanovoids [112] and nano-particles [113, 114] following ionimplantation and thermal annealing, showing its large stability. On theother hand, the unfavorable MgO (111) termination is not detected in theelectron microscopy studies.
Still, the relatively largest mismatch (13.5%) for the likely case of cube-on-cube growth of NaH on a NaCl (001) surface indicates that possibly anenergetically favorable growth may occur with the formation of a narrowinterlayer of fcc-Na [115], with a thickness of a few nanometers at most,in-between the NaH and NaCl domains, providing a better matching forthe subsequent NaCl–Na and Na–NaH interfaces and a lowering of thelocal strain in the more gradual growth. Fcc-Na is expected to stabilize infavor of the bcc structure of bulk Na, because of its good lattice matching,while the difference in cohesive energies is very small. Evaluation of theexistence of such a driving force to form a narrow interlayer of fcc-Nawas done by calculating the interface energies for the NaCl–NaH, NaCl–Na, and Na–NaH interfaces. The interface energies were calculated insuch a way that the induced strain energy due to the lattice mismatch is
108

5.2. RESULTS AND DISCUSSION
minimized by a relaxation of the lattice in the direction perpendicular tothe interface plane [116], for a set of different fixed lattice parameters inthe interface plane. The interface energy is defined as the difference withrespect to the energy of the relaxed equilibrium tetragonal bulk systemsat a particular fixed lattice parameter in the interface plane [116].
In this way, the interface energy for the NaCl (001)–NaH (001) inter-face of 0.038 J m−2 was obtained. Similarly, the interface energies forthe NaCl–Na and Na–NaH interfaces are found to be 0.24 J m−2 and0.28 J m−2, respectively. All these interface energies are quite low, in par-ticular considering the given lattice mismatches, since typical interfaceenergies for cube-on-cube systems with a small lattice mismatch are typ-ically in the range of 1—2 J m−2. For example, the interface energy fora Au (001)–MgO (001) interface, with a small lattice mismatch of 3.2%only, is in the range between 1.5 and 2 J m−2, see Ref. [117]. The interfaceenergies obtained in these calculations give information primarily aboutthe energy needed to form the different chemical bondings of atoms atthe interface. These calculations show that this chemical interface energyis minimum for the NaH–NaCl interface. However, there it is accom-panied by a large tetragonal distortion of the NaH lattice to adjust tothe NaCl in-plane lattice parameter of 5.47 Å, with a deformation en-ergy of roughly 0.16 eV per NaH pair relative to equilibrium fcc-NaH.On the other hand, while the formation of the NaCl–Na and Na–NaHinterfaces requires relatively more energy to create the chemical bondingas compared to the NaH–NaCl interface, the energy of deformation forNa is very small (0.008—0.010 eV per Na atom). Na indeed is easily de-formable, as it has by far the lowest bulk modulus. The value of the bulkmodulus is obtained from the equation of state (EOS), which expressesthe energy E as a function of the lattice parameter a or volume per Naatom v = 1
4 a3 for an fcc crystal. The bulk modulus κ is defined by equa-tion (5.9) (Ref. [118]) evaluated at the calculated fcc equilibrium latticeparameter
κ = v∂2E
∂v2 =49a
∂2E
∂a2 . (5.9)
The values for the bulk moduli of NaH, NaCl, and fcc-Na calculated in
109

CHAPTER 5. AB INITIO CALCULATIONS ON NAH
this way are 26.5 GPa, 32.2 GPa, and 9.8 GPa, respectively. These valuesare in close agreement with theoretical and experimental bulk modulifor NaH [119], NaCl [120], and Na [121], reported in the literature. Thelarge difference in the bulk modulus of Na relative to NaH and NaClconfirms that the formation of an intermediate Na layer will aid sig-nificantly to minimize the elastic part of the interface energy, as Na iseasily deformable. These calculations indicate, therefore, that fcc-Na islikely to form in-between NaCl and NaH upon growth of Na(H) on topof the NaCl small crystallites, as this will lower the overall interface en-ergy needed. Moreover, this also allows for the growth of a more gradualinterface region reducing the local strain arising from the larger latticemismatch between NaCl and NaH.
This proposes that, initially during the second desorption step, fcc-Na indeed grows on the NaCl crystallites while maintaining the fcc (rocksalt) crystal structure [115], and subsequently NaH is formed on top. Thethin fcc-Na interlayer effectively contains abundant hydrogen vacancies.The high mobility of hydrogen in the fcc-Na lattice will provide a path-way for fast hydrogen or deuterium transport toward or from the NaH1−x
nano-particles during H-D exchange or hydrogen sorption processes. TheNaCl–Na–NaH growth model, therefore, provides a plausible mechanismexplaining the high concentration of hydrogen vacancies1 and H-D ex-change in NaH observed experimentally. A direct consequence is thatthis will only occur effectively for sub-micrometer sized NaH grains andin the presence of NaCl, consistent with currently available experimen-tal data. Notably, based on this model, the H-D exchange will mainly bethrough the fcc-Na thin layer between NaH and NaCl crystallites, becauseit is the major source of the hydrogen vacancies. In [82] the diffractionshows clearly separate NaCl and NaH phases, i.e., the lattices have dif-ferent dimensions. A fcc-Na interlayer with cell dimensions stretchingfrom NaH to NaCl will be taken as contributing to the NaH (and NaCl)diffraction pattern(s) for those Na fractions that have positional parame-
1Assuming a thickness of approximately 1 nm for the fcc-Na interlayer and a contactarea of roughly 10% of the surface of a NaH crystallite (R ≈ 60 nm) with the neighboringNaCl (R ≈ 20 nm), nucleation centers, leads to an estimated hydrogen vacancy fractionχ of approximately 0.5%.
110

5.3. CONCLUSIONS
ters that are within the range of the thermal displacement factors (tem-perature factors). Based on the actual temperature factors for Na in NaH,it is estimated that about 1/4 of the Na interlayer contributes to the NaHdiffraction pattern, 1/4 to NaCl and ∼1/2 to a (invisible) background.
5.3 Conclusions
These calculations clearly show that the presence of hydrogen vacanciessignificantly affects the hydrogen migration energy in NaH, resulting infaster diffusion, and enabling H-D exchange in nano-NaH as observedupon decomposition of ball-milled TiCl3-doped NaAlH4. The estimatedrate of the vacancy-mediated hydrogen transport based on diffusion the-ory is consistent with observed H-D exchange reaction rates. The forma-tion energies for intrinsic hydrogen vacancy-interstitial pairs are too highto explain the observed high hydrogen vacancy concentrations inside theNaH phase.
A model to provide an insight into the mechanisms leading to thepresence of abundant hydrogen vacancies was evaluated. The calculatedlow fcc-Na–NaCl and NaH–fcc-Na (001) interface energies show that arational mechanism to induce abundant hydrogen vacancies by promot-ing the growth of an fcc-Na interlayer between NaH crystallites and theNaCl nucleation centers is rational. The calculated low interface energiessupport the view that NaH grows easily on NaCl nucleation centers, andassist the idea of the role of NaCl as grain refiner for NaH.
111


6Si destabilized MgH2
Light-metal hydrides are attractive materials for hydrogen storagebecause of their relatively large storage capacity [14, 122–124].However, most of the high capacity hydrides are very stable, and
release hydrogen at relatively high temperatures, i.e., above 250 °C. Oneof the approaches to address this thermodynamic constraint is to com-bine the existing hydrides with suitable element, a binary compound orwith complex hydrides and form new compounds or alloys upon de-hydrogenation [24] for specific combination. This approach is expectedto increase equilibrium hydrogen pressures by lowering of the overallenthalpy for the modified dehydrogenation reaction, and it effectivelydestabilizes the composite hydrides.
A well known and promising metal hydride, i.e., MgH2, suffers fromhigh operation temperatures. It has an equilibrium pressure of 1 bar at280 °C. An approach to destabilize MgH2 in the presence of Si led to anincrease in the equilibrium hydrogen pressure from 1.8 bar to more than7.5 bar at 300 °C [24]. This occurs at the expense of an expected decreasein the hydrogen capacity to 5.0 wt.% due to Si addition. Upon heating aMgH2-Si mixture, the hydrogen can be released in a single dissociationstep with the formation of Mg2Si instead of Mg [24, 102, 125, 126]
MgH2 +12
Si 12
Mg2Si + H2. (6.1)
113

CHAPTER 6. SI DESTABILIZED MGH2
However, a major challenge remains to make the reaction reversible, i.e.,forming MgH2 from Mg2Si upon hydrogenation. So far only one studyreported the successful loading near room temperature of Mg2Si duringball milling while applying in situ hydrogen pressures up to 20 bar [126].This study therefore indicates that the irreversibility of reaction (6.1) maybe due to very slow kinetics for a significant hydrogenation to occur. Fur-ther, the maintenance of crystallite sizes to nano-dimensions, and possi-bly also the presence of vacancies by ball milling throughout the cyclingfacilitated the reaction kinetics and led to a successful loading of Mg2Si.
In line with the previous studies reported in this thesis, the grain sizesneed to remain small during the hydrogen cycling to facilitate reversibil-ity. Therefore, suitable grain refining agents are needed, which may arrestthe crystallites sizes at the nanoscale during the hydrogen cycling reac-tion [82]. This was a motivation to investigate the evolution of crystallitesizes and their effect during the hydrogenation of Mg2Si using a grainrefiner agent. Nb2O5 was an obvious choice, as it is known to show thesuperior catalytic activity for MgH2 [20, 25, 101, 127]. In particular, the re-action products Nb and/or MgO were anticipated to act as possible grainrefiner for Mg2Si. Figure 6.1 shows the fairly good lattice matching ofthe cubic Nb and MgO with Mg2Si. In this study, two types of samples,powders as well as films, were investigated.
Nb2O5-catalyzed MgH2-Si powder Powder samples were used to studythe evolution of grain sizes of the occurring phases. The grain sizes wereextracted from the broadening of the peaks using GSAS on the obtainedex situ XRD patterns before and after the milling of the powder mixture,after the dehydrogenation, and subsequent hydrogenation steps. The de-tailed study on the size evolution showed that very small grain sizes ofMgH2 of approximately 10 nm can be achieved by milling in the presenceof Si for 30 min only. The Si also reaches small crystallite sizes of 100 nm.Nano-Mg2Si (80 nm) was formed during desorption in the temperaturerange of 25—320 °C of the Nb2O5-catalyzed MgH2-Si mixture. Despite ofthe nano-dimensions of the crystallites; however, the Mg2Si could not bereloaded successfully with hydrogen.
114
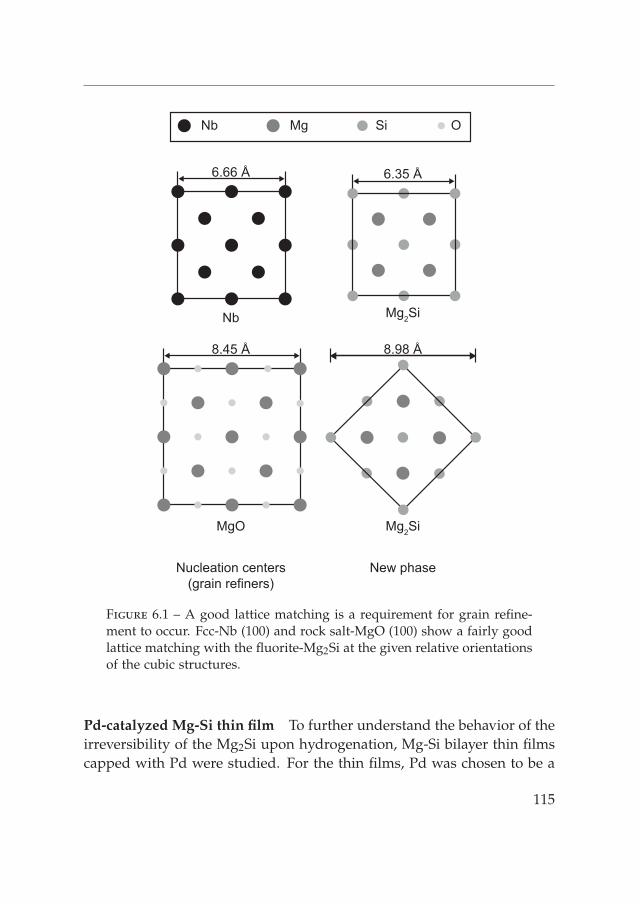
8.45 Å
MgO
6.66 Å
Nb
6.35 Å
Mg2Si
8.98 Å
Mg2Si
Nucleation centers(grain refiners)
New phase
ONb Mg Si
Figure 6.1 – A good lattice matching is a requirement for grain refine-ment to occur. Fcc-Nb (100) and rock salt-MgO (100) show a fairly goodlattice matching with the fluorite-Mg2Si at the given relative orientationsof the cubic structures.
Pd-catalyzed Mg-Si thin film To further understand the behavior of theirreversibility of the Mg2Si upon hydrogenation, Mg-Si bilayer thin filmscapped with Pd were studied. For the thin films, Pd was chosen to be a
115

CHAPTER 6. SI DESTABILIZED MGH2
catalyst for a number of reasons. Pd has shown good catalytic activity asa H2 splitter [102], and it is easy to deposit a Pd-cap layer on top of a Mg-Si bilayer, which further avoids oxidation of the Mg layer. A number oftechniques such as positron depth profiling, TEM, SAD, and XRD wereused to clarify the (lack of) reactivity of Mg2Si with hydrogen. Thesetechniques were employed to gain insight into the structural transforma-tions associated with the solid state reactions. Similarly deposited filmswere heated up to 207 °C under either 10 bar of H2 or He atmospheresfor 24 h to study the reaction path for Mg2Si formation in the presence orthe absence of hydrogen.
6.1 Experimental description
Powder samples were synthesized using the ball milling technique, whilethe thin film samples were prepared using the PSD technique.
Powder samples The powder samples were synthesized by grinding thepowders MgH2, Si, and 2 mol% Nb2O5 with a MgH2: Si weight ratio of(2:1) in a Fritsch Pulversette 6 planetary monomill with a ball to powderratio of close to 96:1 (128 g of balls:1.328 g of the mixture) for periodsof 15 up to 120 min with a rotational speed of 400 rpm. A stainless steelbowl (80 ml) and 32 balls with a diameter of 10 mm were used. The MgH2
powder of purity 98% was bought from ABCR GmbH & Co., while Si andNb2O5, each with the purity of 99.99%, were bought from Sigma Aldrich.
For desorption a sample which had been ball milled for 2 h was heatedin the temperature range from −173 °C to 320 °C at a rate of 0.3 °C min−1
for 15 h. For subsequent rehydrogenation, the sample was placed under10 bar of H2 pressure at a number of selected temperatures in the range of25 to 320 °C for 5—15 h to investigate its reloading behavior. The amountof absorbed H2 was investigated by performing subsequent desorptionmeasurements using the HYDRA setup.
The ex situ X-ray diffraction was performed on individual as-receivedMgH2, Si, and Nb2O5 powders, the milled mixture, the desorbed sample,and the reloaded sample. Cu Kα radiation was used on a Bruker-AXS
116

6.2. POWDER SAMPLES
Type D5005. All diffraction patterns were fitted by Rietveld refinementusing GSAS, and the grain sizes of the various occurring phases werecalculated after each treatment from the broadening of the peaks usingthe Scherrer formula (see Section 2.3).
Thin film samples Mg-Si bilayer films capped with Pd were depositedon glass substrates by the PSD technique (see Section 2.2.1) using an Arplasma in the pressure ranging from (1—3)×10−6 bar. Mg (purity 99.9%)and Si wafer (purity 99.99%) targets were used; subsequently, a Pd-caplayer was deposited. Similarly prepared films were heated up to 207 °Cunder 10 bar of H2 or He pressure for 24 h using the HYDRA setup (seeSection 2.5).
The positron Doppler broadening of annihilation radiation (511 keV)was measured on the as prepared, He treated, and H2 treated films usingpositrons with a kinetic energy in the range of 0—25 keV. The techniquewill show the changes (if there is any) in the electronic structure andphase probed by the positron, and possibly vacancy formation, upon hy-drogenation. The S parameter depth profiles were analyzed using theVEPFIT software package (see Section 2.8).
The films were characterized by XRD using a Bruker-AXS Type D5005diffractometer at the Cu Kα wavelength. Further, TEM and SAD studieswere carried out on both selected powder and thin film samples using aPhilips CM30T microscope at 300 kV.
6.2 Powder samples
Microstructural studies
The XRD pattern obtained for the ball milled (2 h) sample shows thepresence of the MgH2, Si, and Mg0.33Nb1.67O3 phases (see Figure 6.2).A detailed study of the size evolution of the phases with milling timeshowed that the crystallite sizes for MgH2 were reduced from 160 nm toroughly 10 nm in only 30 min of milling time in the presence of Si and thecatalyst Nb2O5. The Si reduces from 285 nm to 100 nm in the same time
117

CHAPTER 6. SI DESTABILIZED MGH2
interval. After 60 min of ball milling, the size of MgH2 further reducesto 5 nm, while the size of Si decreases to 50 nm. Upon ball milling for120 min, both MgH2 and Si did not show any further reduction in thecrystallite size.
The sample was subsequently dehydrogenated in the temperaturerange of 25—320 °C for 10 h. Note that a presence of 10 bar hydrogenpressure is expected to be above the equilibrium pressure at a tempera-ture of 25 °C for reaction (6.1). The subsequent XRD on the sample showsthe presence of Mg2Si, MgO, Mg0.33Nb1.67O3, and some residual Si. Theinitial size of the formed Mg2Si crystallites was 80 nm. Subsequent ther-mal desorption up to roughly 280 °C after an attempt of hydrogenationat 25 °C for 15 h showed no change in the pressure as well as quadrupolesignal. This shows that hydrogen loading was not achieved under theabove mentioned conditions. Under 10 bar of hydrogen pressure for 5 hfor a rather small increase in the size of Mg2Si to 100 nm was observedtemperatures up to 320 °C (see Table 6.1).
The XRD study shows that the Mg2Si phase appears only after thedehydrogenation. No formation of Mg2Si was observed after 2 h of ballmilling (see Figure 6.2). Mg2Si could not be loaded successfully.
The crystallite size of Mg2Si does remain at a nanoscale dimensioneven after application of relatively higher temperatures close to 320 °C,indicating that the grain refining action, probably of MgO, is quite ef-fective. However, it seems that the maintenance of a small grain size ofroughly 100 nm is not enough to make the reaction (6.1) reversible, sinceno trace of formation of MgH2 from Mg2Si upon hydrogenation was ob-served.
Further, TEM micro-graphs on the powder mixture before millingclearly show that Si and MgH2 particles are well separated with no grainboundaries and with no signs of the presence of any type of oxides e.g.SiO2, MgO, and/or Mg0.33Nb1.67O3. After the milling, there were no signsof Mg2Si phase observed by TEM either. In addition to MgH2 and Si, ox-ides, such as SiO2 and MgO, and pure Nb were now observed. Further,the TEM shows pure Nb particles attached to MgH2 particles; however, itis not clear if any chemical bonding across the interface between the Nb
118

6.2. POWDER SAMPLES
30 40 50 60 70 80
2 θ
Ball milled
Dehydrogenated
H2 treated
[°]
(a)
(b)
(c)
(a)
(b)
(c)
SiMgH2
Mg0.33
Nb1.67
O3
Mg2Si MgO
♦
♦ ♦♦ ♦
♦ ♦ ♦ ♦
♦♦ ♦ ♦♦
Figure 6.2 – XRD showing the occurring phases after 2 h ball milling,dehydrogenated for 15 h up to 320 °C, and under 10 bar of hydrogenpressure for 5 h up to 320 °C.
and MgH2 exists. Moreover, TEM images show that Mg2Si was formedonly after the dehydrogenation step, and no formation of a MgH2 phasewas observed after the hydrogen loading step, consistent with the XRDresults.
In brevity, both XRD and TEM studies show that the grain refinementactivity of either Nb or MgO is effective, but hydrogen loading at vari-ous temperatures is unsuccessful. In order to gain a further insight intothe apparent irreversibility of Mg2Si, the local transformations associatedwith the solid-state reactions were studied. Mg-Si bilayers capped withPd were studied using a number techniques including positron depthprofiling, TEM, and XRD (see Section 6.3).
119

CHAPTER 6. SI DESTABILIZED MGH2
Table 6.1 – Evolution of grain sizes of the different occurring phasesin a powder mixture of Nb2O5-catalyzed MgH2 and Si before and aftermilling and after dehydrogenation and hydrogenation.
Sample treatment Grain sizes [nm]
MgH2 Si Nb2O5 Mg2Si
As received 160 285 602 h milling 5 50Dehydrogenated(15 h 25—320 °C)
125 80
H2 treated(5 h 320 °C 10 bar)
150 100
6.3 Thin film samples
6.3.1 Mg2Si formation in H2 and He atmospheres
In order to better understand the interaction between Mg and Si aboveroom temperature, the evolution of samples consisting of a Mg-Si doublelayer capped with a Pd top layer deposited on a glass substrate wereinvestigated upon heating with and without the presence of hydrogen.
Figures 6.3(a) and 6.3 (b) show representative positron depth profilesof the Doppler S parameter for He heated and hydrogenated Mg-Si thinfilms, respectively. The three regions correspond to a roughly 5 nm thinPd cap layer, a Mg metal layer with a thickness of nearly 400 nm, anapproximately 250 nm thick Si layer, and the glass substrate. The solidlines in Figure 6.3 represent the fit using VEPFIT analysis [57] of theDoppler depth profiles. The drop in the value of the S-parameter around5 keV, i.e., close to the Mg and Si interface, corresponds to the formationof Mg2Si.
120

6.3. THIN FILM SAMPLES
15 200 5 10
Pd Glass substrateMg Si
Mg2Si
(reference)
S p
ara
me
ter
[-]
E [keV]
Average depth [nm]
400 2505
As prepared
H2 treated
0.52
0.56
0.60
0.64
0.68
b
E [keV]0 5 10 15 20
Average depth [nm]
400 2505
As prepared
He treated
Pd Glass substrateMg Si
Mg2Si
(reference)
S p
ara
me
ter
[-]
0.52
0.56
0.60
0.64
0.68
a
Figure 6.3 – (a) Doppler S parameter depth profiles for as-depositedPd-capped Mg-Si bilayer thin film (hollow squares), and after heatingto 207 °C under 10 bar of He atmosphere (filled squares); (b) DopplerS parameter depth profiles for Pd-capped Mg-Si bilayer thin film (hol-low circles), and after the heat treatment at 207 °C under 10 bar of H2pressure (filled circles).
121

CHAPTER 6. SI DESTABILIZED MGH2
0.52 0.56 0.60 0.64 0.68
0.02
0.03
0.04
0.05
0.06
W p
ara
me
ter
[-]
S parameter [-]
He treated
a
A - Pd D - Mg
E - Mg2SiF - Si H - Pd-Mg
B - Glass C - Mg (annealed)
G - Si (reference)
AB
C
G
FE
D
H
S parameter [-]
0.60 0.64 0.680.52 0.56
0.02
0.03
0.04
0.05
0.06
W p
ara
me
ter
[-] H
2 treated
b
AB
C
G
FE
D
H
Figure 6.4 – (a) S−W diagram corresponding to He treated sample; and(b) A graph between S and W parameters corresponding to hydrogenheated film.
Further, the S −W graphs show a new cluster point, corresponding toMg2Si phase (S = 0.61, W = 0.025) after the heat treatment in both cases(see Figure 6.4(a) and 6.4(b)).
122
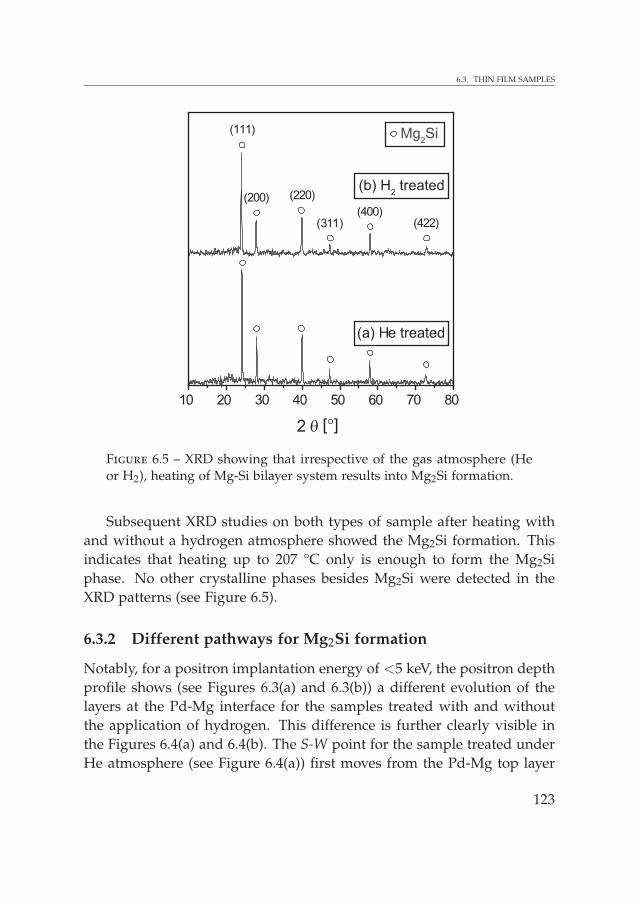
6.3. THIN FILM SAMPLES
10 20 30 40 50 60 70 80
(422)(400)
(220)(200)
(a) He treated
2 θ
(111)
[°]
(311)
Mg2Si
(b) H2 treated
Figure 6.5 – XRD showing that irrespective of the gas atmosphere (Heor H2), heating of Mg-Si bilayer system results into Mg2Si formation.
Subsequent XRD studies on both types of sample after heating withand without a hydrogen atmosphere showed the Mg2Si formation. Thisindicates that heating up to 207 °C only is enough to form the Mg2Siphase. No other crystalline phases besides Mg2Si were detected in theXRD patterns (see Figure 6.5).
6.3.2 Different pathways for Mg2Si formation
Notably, for a positron implantation energy of <5 keV, the positron depthprofile shows (see Figures 6.3(a) and 6.3(b)) a different evolution of thelayers at the Pd-Mg interface for the samples treated with and withoutthe application of hydrogen. This difference is further clearly visible inthe Figures 6.4(a) and 6.4(b). The S-W point for the sample treated underHe atmosphere (see Figure 6.4(a)) first moves from the Pd-Mg top layer
123

CHAPTER 6. SI DESTABILIZED MGH2
in the direction of the Mg S-W cluster point, suggesting the presence of arather thin (amorphous) Mg-rich layer near the Mg-Pd interface. Beyondthis implantation energy, positrons progressively see mainly the formedMg2Si as seen from corresponding S-W cluster point. On the other hand,the hydrogen loaded bilayer sample shows a change from the S-W pointof the Pd-Mg cap layer directly toward that of Mg2Si (see Figure 6.4(b)).
This difference in the evolution of the layers close to the Pd-Mg in-terface can be attributed to the initial formation of MgH2 at the top partof the Mg layer expected on the basis of earlier successful loading of Mgfilms deposited on Si wafers (see Chapter 3). At this stage, Mg2Si forma-tion at the Mg-Si interface will occur simultaneously. This latter reactionwill even be accelerated relative to the sample treated under a He atmo-sphere by the significant heat release and local temperature rise causedby the hydrogenation of the pre-layer to MgH2 having a high enthalpyof formation. As soon as the Mg2Si zone is in contact with the MgH2
layer, destabilization will be effective, and the applied hydrogen pressureof 10 bar will no longer be sufficient at the high temperature of the ex-periment to hinder complete hydrogen desorption of the MgH2 pre-layer,and a full transformation to Mg2Si will be reached. This proposed modelof evolution of the layers and the finally reached Mg2Si formation in thehydrogen heated Mg-Si bilayer system is depicted in the Figure 6.6 andfurther supported by the TEM micrographs on He and H2 heated samples(see Figure 6.7).
Further, besides showing a columnar growth of Mg2Si phase similarto deposited Mg films [102], the TEM image shows the presence of anunreacted thin and homogeneous Si layer. The latter remains unreactedbecause of the non-stoichiometric ratio Mg:Si < 2:1 for the Mg and Silayer thicknesses used in this study. Additionally, for the He heat treatedsamples, TEM images reveal the presence of an amorphous layer on topof the Mg2Si layer. In the H2 treated sample, on the other hand, this amor-phous layer is absent, showing the consistency with the positron depthprofiles at shallow depths close to the Mg-Pd interface. Most probably,this amorphous layer consists of a partially unreacted amorphous Mg orMg-rich compound as can be clearly seen in the Figure 6.3(a). However,
124

6.3. THIN FILM SAMPLES
I
II
III
IV
baPd
Mg
SiGlass
(substrate)
Pd-Mg
MgMgH
2
Mg2Si
Pd-Mg
MgMgH
2
Mg2Si
Pd-MgMg-rich
(amorphous)
Mg2Si
Si
Glass
Si
Glass
Si
Glass
Figure 6.6 – Schematic drawing of the proposed evolution of Pd-cappedMg-Si bilayers on a glass substrate upon prolonged (a) heating at 207 °Cat a pressure of 10 bar in an inert He gas environment; (b) in a hydrogengas environment. The hydrogen loading leads to a higher local temper-ature and faster transformation to Mg2Si, and inhibits the formation ofan amorphous Mg-Pd or Mg-Si pre-layer. The initially formed MgH2releases all hydrogen upon reaching in contact with Mg2Si.
125

CHAPTER 6. SI DESTABILIZED MGH2
0.2 µm
a
0.2 µm
b
Glass
Si
Mg2Si
Pd-Mg
Amorphous(Mg-rich)
Figure 6.7 – Cross-sectional TEM images of Pd-capped Mg-Si bilayerfilms heating at 207 °C for 24 h with 10 bar of pressure (a) He (b) H2atmosphere. Both samples show the Mg2Si formation on top of a thinresidual Si layer. Further, the sample heated under a He atmosphereshows the presence of an amorphous layer, presumably Mg-rich in com-position.
no such phase was observed in the XRD, which is related to the amor-phous nature of the phase. Both Mg-rich Mg-Pd alloys and Si-rich andMg-rich Mg-Si alloys may form amorphous layers in sputtered depositedfilms [128, 129].
6.3.3 Possible mechanism for the irreversibility of Mg2Si
The origin of the irreversibility of the formed Mg2Si with subsequent hy-drogenation most likely is related to the difficulty of removal of Mg fromthe Mg2Si from its local tetrahedral binding geometry surrounded by fourneighboring Si atoms. While thermodynamically the rehydrogenationstep is favored at sufficiently high hydrogen pressures above the equilib-rium pressure, the presence of a reaction barrier related to removal of Mgfrom Mg2Si may obstruct the formation of local MgH2 nuclei. This couldalso provide an explanation to the observed (partial) reversibility under insitu ball milling conditions using a 20 bar H2 pressure, since ball millingof metal hydrides often leads to stabilization of non-equilibrium phases,
126
6.4. CONCLUSIONS
and may further aid to overcome reaction barriers. One of the other men-tioned bottlenecks proposed in the literature, namely slow hydrogen dis-sociation at Mg2Si surfaces, can be disregarded since hydrogen is readilypresent in its atomic form in the thin film studies [130]. Clemens et al.recently showed, in fact, that atomic hydrogen can easily permeate Pd-capped Mg2Si layers to fully hydrogenate Mg films underneath. Recentab initio calculations [131], moreover, show that hydrogen may dissociateeasily at particular, oxygen-free, surfaces such as the Mg2Si (110) surface.
6.4 Conclusions
XRD and TEM studies on powder samples show grain refinement is effec-tive, but that using particle sizes around 100 nm is not sufficient to achievethe reversibility of Mg2Si. The solid state reactions of Mg-Si bi-layersupon hydrogen loading and heat treatment in an inert gas environmentwere monitored. Both treatments lead to relatively fast Mg2Si formation.Positron depth profiling revealed the appearance of an amorphous Mg-rich pre-layer for heating in inert gas environment solely, consistent withthe electron microscopy study. Re-hydrogenation of Mg2Si is difficult,most likely related to the presence of a barrier against removal of Mgfrom the Mg2Si layer, inhibiting the formation of MgH2. This suggeststhat reversibility could possibly only be achieved using an appropriateadditive, which can lower the reaction barrier related to the removal ofMg from Mg2Si matrix during hydrogenation step, and which also fa-cilitates the nucleation of MgH2 crystallites in combination with smallernano-crystallites.
127


7TiF3 catalyzed MgH2
The addition of suitable catalysts and small crystallite (particle)sizes are known to improve the sorption kinetics in hydrogenstorage materials. Starting with an initially small crystallite size
is possible by grinding the powder in a ball milling; however, these crys-tallites are known to grow by spontaneous annealing during the hydro-gen cycling [20]. Therefore, maintaining the crystallite sizes to nano-dimensions throughout the sorption reactions is a challenging task inhydrogen storage research. A recent study has shown an approach torestrict the growth of the crystallites size during a sorption reaction byrevealing an additional role of the TiCl3 catalyst as a grain refiner for theoccurring phases, besides acting as a H2 molecule splitter in the studyon TiCl3-catalyzed NaAlH4 [82]. This study is a motivation to look forappropriate catalysts which can act as grain refiners for the other poten-tial hydrogen storage candidates, especially for a well known hydrogenstorage material, i.e., MgH2. In MgH2, catalysts like Nb, V, Nb2O5 werealso shown to have an effect on crystallite size [20, 25]. Nb2O5 is knownto show superior catalytic activity for MgH2 [20,25,101,127]; however, nooptimization with respect to grain refining activity has been attemptedyet.
A number of studies indicate the catalytic activity of TiF3 (titaniumfluoride) in MgH2 and the formation of MgF2 [132–135]. These studies
129
CHAPTER 7. TIF3 CATALYZED MGH2
further show that H2 can be loaded in Mg at room temperature, whilethe loading at room temperature for Nb2O5-catalyzed MgH2 has not beenreported so far. However, these studies lack a clear explanation about themechanism by which TiF3 helps to facilitate this low temperature loadingand the relatively faster kinetics. The studies described in the previouschapters suggest that MgF2 acts as a grain refiner for MgH2 because MgF2
shares the same crystallographic structure as MgH2 [136, 137].Therefore, to investigate the role of MgF2 as a grain refiner, in situ neu-
tron diffraction measurements were performed on TiF3-catalyzed MgH2.TiF3 was taken as a catalyst, as it is known to lead to MgF2 upon firstdesorption. Further, the evolution of deuterium vacancies in MgD2 wasalso studied during deuterium cycling, for a comparison to vacancy for-mation in Nb and V-catalyzed MgH2 [20]. This chapter reports that MgF2
indeed arrests the crystallite sizes of MgD2 at a nano-dimension (aver-age crystallite size roughly 30 nm) during the deuterium loading andunloading. Further, these nano-crystallites show approximately 30% ofdeuterium vacancies in the beginning of the loading, while almost reach-ing full occupation upon full loading. Upon subsequent desorption athigher temperature the deuterium vacancy concentration rises again to15%. In addition the material can rapidly absorb H2 at temperature closeto room temperature (RT).
7.1 Experimental procedure
The powders MgH2 and 5 mol% TiF3 were milled in a Fritsch Pulversette6 planetary monomill with a ball to powder ratio of close to 50:1 ((32×4) gballs: 2.67 g of initial weight of total powder) for a period of 60 min with arotational speed of 400 rpm. A pause of 15 min time was taken after every15 min rotation interval. The MgH2 powder, with a purity of 98%, wasobtained from ABCR GmbH & Co. KG, and TiF3 (100%) was obtainedfrom Alfa Aesar.
The size of as-received MgH2 and ball milled MgH2 was found tobe 150 nm and 30 nm, respectively. The sizes were extracted from theRietveld fitting on XRD patterns, which were obtained using Cu Kα radi-
130

7.1. EXPERIMENTAL PROCEDURE
ation on a Bruker-AXS Type D5005 or on a PANalytical Type X’Pert Prodiffractometer, respectively.
The handling of all powders was done in the glove box containingargon as a working gas with an O2 and H2O content of ≤0.1 ppm. Allpowders (except for the hydrides) and equipment such as balls, bowl, andspatula, etc., were baked out in a vacuum oven at around 80 °C for a fewhours before bringing them into the glove box.
After the milling, the sample was desorbed in the glove box usingtemperatures ranging from 25 to 280 °C. The desorption of the hydrogengas was measured gravimetrically, i.e., by weighing the sample before andafter heating. The sample was heated up to 280 °C, until no more changein the mass of the sample was observed at 280 °C, and the mass losswas 160 mg equivalent to 1.792 liter H2 gas, corresponding to 6.5 wt.%of hydrogen released from the sample. Subsequently, the sample wascharacterized using XRD in order to observe Mg crystallite size, catalyst,and residual MgH2.
In situ neutron diffraction measurements were performed during theD2 cycling of TiF3-catalyzed Mg using GEM (see Section 2.6.3) at ISIS.The first loading sequence on the desorbed sample (2.287 g) was per-formed at 150 °C in the pressure range from 5—10 bar of D2 pressure.The use of deuterium allows to reduce the incoherent background signif-icantly as compared to hydrogen. This loading sequence consisted of 11loading steps at 150 °C with an ultimate pressure up to 10 bar and wasperformed until the Mg was completely transformed to rutile-MgD2 (seeFigure 7.2(a)).
After the full loading, the D2 from the sample tubing was pumpedaway rapidly down to a pressure of 300 mbar. At this pressure D2 slowlyremoved from the MgD2. The sample was heated gradually up to 320 °Cin order to remove D2 from the MgD2 completely. After full desorp-tion, the sample was cooled to 50 °C, and a subsequent D2 loading wasattempted at this low temperature successfully. At this temperature, 9steps of D2 loading in the pressure range up to 10 bar were performed.Some extra shots of 10 bar of D2 pressure were applied at 100 and 150 °Cin order to achieve a complete transformation of Mg into MgD2.
131

CHAPTER 7. TIF3 CATALYZED MGH2
A neutron diffraction pattern was acquired for every 7.5 min duringthe D2 loading and unloading as described above. However, the firstpattern was taken for 16 min for a reference at a higher statistics. Alldiffraction patterns were fitted using Rietveld refinement using the soft-ware package GSAS (see Section 2.6.4). The detector banks 4, 5, and 6of GEM (ISIS, UK) were fitted simultaneously,1 while the phase fractions,the lattice parameters, and the line shapes were allowed to vary. The fitsof the phase fractions were constraint among the three detector banksto retain mutual consistent values. The crystallite sizes of the occurringphases were extracted from the broadening of the peaks using the Scher-rer’s formula.
7.2 Results
The XRD on the ball milling sample showed the presence of β-MgH2, γ-MgH2, TiF3, and traces of MgO. A significant amount of 35% (in weight)of the total desorbed hydrogen was released already at 200 °C in 20 minupon subsequent desorption in the glove box. Upon further heating,more hydrogen gas was released. At 280 °C, no further change in themass of the sample was observed. A subsequent XRD on the sampleshowed the presence of Mg, MgF2, traces of TiHx, and a small amountof MgO. Notably, no TiH2 peaks were observed directly after the milling,strongly indicating that the formation of TiHx occurs upon heating [133].The proposed reaction path way of the formation of TiHx is describedbelow in the Section 7.2.1.
7.2.1 In situ neutron diffraction on TiF3 catalyzed Mg
The colored 3D diffraction plot (see Figure 7.1) shows the development ofphases (Mg, MgF2, MgO, and MgD2) upon D2 cycling on TiF3-catalyzedMg. Figure 7.2(a) shows the temperature conditions during the D2 load-ing and unloading cycle over time at different temperatures.
1A few selected fitted patterns are shown in Appendix B.
132

7.2. RESULTS
MgD2
d-s
pa
cin
g [
Å]
2.5
1.5
2.0
3.0
0 200 600400
Mg
MgD2
Time [min]
MgF2
MgO
Figure 7.1 – Neutron diffraction patterns showing the evolution of oc-curring phases such as Mg, MgF2, MgO, and MgD2 over a section ofd-spacings during D2 cycling of TiF3-catalyzed MgD2.
The fate of the TiF3 catalyst
There was no residual MgH2 visible in the XRD, nor in the neutrondiffraction for the initial sample after first desorption. However, in the2D graph of the diffraction (see Figure 7.1), it is clearly visible that anincoherent background is present at the start of the experiments. Thisbackground disappears only after full loading with D2 is completed andupon subsequent unloading at T>300 °C (for t >300 min, see graphs
133

CHAPTER 7. TIF3 CATALYZED MGH2
400 405 410 415 420
50
60
70
80
90
100
110
Time [min]
Tem
pe
ratu
re [
°C]
b
0 100 200 300 400 500 600
50
100
150
200
250
300
350
A: D
2 loading
B: unloading
C:cooling
D2 loading
Tem
pe
ratu
re [
°C]
Time [min]
a
Figure 7.2 – (a) Change in temperature is plotted over time describingloading and unloading steps of TiF3-catalyzed MgD2; (b) A sudden in-crease in the temperature up to 107 °C was observed upon 50 °C loading,which is encircled in (a).
134

7.2. RESULTS
Figure 7.1 and 7.2(a)) is performed. The presence of the incoherent back-ground directly points to the presence of residual hydrogen (protons) inthe desorbed sample containing Mg-metal. The presence of crystallineMgH2 nevertheless can be ruled out based on XRD and neutron diffrac-tion.
The fluorine from TiF3 appears to have reacted with the MgH2 toform MgF2; and in the process both H2 and Ti are liberated [133], thelatter binding a fraction of the hydrogen
3MgHx + 2TiF3 → 3MgF2 + 2TiHx + Hx. (7.1)
TiHx is formed since its equilibrium pressure is much lower than MgH2
at the same temperature (for all temperatures between room temperatureto 320 °C). The hydrogen desorption during preparation of the initialdesorbed sample can easily result in fully desorbed Mg, while still Ti ishydrided. TiH1.5<x<2 has an equilibrium pressure of 10−2 mbar at 300 °C[138], while 280 °C was used for the initial desorption.
Loading at 150 °C
At the first step of first loading, approximately 140 ml of deuterium gaswas absorbed within 3 min at 150 °C. After 200 min and several D2 load-ings, almost all Mg was transformed to MgD2 with only 2% of residualMg remaining. The evolution of the occurring phases in relative phasefractions, extracted from the Rietveld analysis, over time is shown in theFigure 7.3. The figure shows that roughly 10% MgF2 was present fromthe beginning of the first loading and the amount of MgF2 remains con-stant throughout the cycling process. A small fraction of MgO (5—7%)was present throughout the cycling process.
D2 desorption
Desorption started at 150 °C, but the desorption was slow, i.e. roughly1 ml min−1. The pressure in the sample tube was roughly 320 mbar.Subsequently, the temperature was increased gradually up to 320 °C (seeFigure 7.2(a)), and then the rate of deuterium release was increased to
135

CHAPTER 7. TIF3 CATALYZED MGH2
0 100 200 300 400 500 600
0.0
0.2
0.4
0.6
0.8
1.0
Mg MgF2
MgDx
MgOP
hase
frac
tion
[-]
Time [min]
A: 150 °C
D2 loading
B: 150—320 °C
unloading
C: cooling to 50 °C
D2 loading 50—150 °C
Figure 7.3 – Fraction of different phases were plotted over the measure-ment time. The plot is divided into 3 intervals. A: D2 loading at 150 °C;B: D2 desorption from the temperature ranging from 150 °C to 320 °C;C: cooling the system down to 50 °C and subsequent D2 loading in therange of 50—150 °C. The applied D2 ranged from 5—10 bar.
approximately 5 ml min−1. A valve was used to control the D2 flow,while maintaining some pressure in the sample tube. The deuterium wascompletely desorbed after 145 min (see Figure 7.3).
Loading at 50 °C
After the complete transformation of MgD2 into Mg with the release ofD2 at 320 °C, the sample was cooled down to 50 °C. Subsequent loadingat 50 °C led to the reappearance of the MgD2 phase, which can be di-
136

7.2. RESULTS
rectly observed in the colored plot (see Figure 7.1). Roughly 284 ml ofdeuterium was absorbed in 3—4 min at 50 °C. Simultaneously, a drasticincrease in the temperature up to 105 °C from 50 °C was observed, show-ing the exothermic behavior of the reaction (see Figure 7.2(b)). The sam-ple was allowed to cool down to 55 °C, and subsequent gentle stepwiseloading was done at 50 °C for 185 min. The deuterium loading was onlycompleted to ∼60% at 50 °C, so a few steps up to 10 bar of deuteriumpressure at 100 and 150 °C were applied, which appeared sufficient tocomplete the deuterium loading.
Evolution of grain sizes
A careful Rietveld analysis of the data shows that the crystallites size ofMgDx remain surprisingly small, roughly 30 nm, throughout the deu-terium cycling. The average crystallite size of MgF2 is approximately12 nm. The crystallite size of Mg also remain relatively small (rangingfrom 100—150 nm). In Nb or V catalyzed MgH2 crystallite sizes for Mgand MgH2 were observed of ∼150 nm [20]. The small increase in Mggrain size observed here is due to the increase in temperature and theassociated annealing of Mg.
H-D exchange in TiHx
The TiF3 catalyst in MgH2 results in the formation of MgF2 and TiHx
with x ≈ 2 at RT. Many studies have been performed on the mobility ofhydrogen in TiHx, and it was shown by neutron and NMR experimentsthat large hydrogen and deuterium diffusion coefficients are observed[139,140]. Although the mobility of H and D in titanium hydride is high,the hydrogen and deuterium can normally not easily leave the Ti(H,D)x
since the hydrogen and deuterium equilibrium pressures are low.As soon as the loading of deuterium has started on the desorbed Mg-
TiF3 sample, the hydrogen from TiHx can escape from TiHx, when itis exchanged with deuterium. Because of the rapid diffusion, this willalready occur within less than seconds [139, 140]. Such fast diffusionhas been observed in other type of materials, e.g. Li-ion battery materi-
137

CHAPTER 7. TIF3 CATALYZED MGH2
als [141]. The result is that a homogeneous hydrogen-deuterium mixturewill be established rapidly within the sample for each loading of deu-terium. The ∼5 mol% of TiH2 will thus provide a constant amount ofH in the hydrogen-deuterium mixture that reduces to ∼5% of the addeddeuterium upon loading. The unloading of deuterium after full loadingwill result in a 95% reduction of the hydrogen content in Ti(H,D)x via theMgDx compound, consequently the incoherent background in Figure 7.1disappears. With the assumption of a homogenous hydrogen-deuteriummixture the effective neutron cross section can be calculated for each deu-terium loading step. This leads to the correction of the measured occu-pancy numbers, which is presented in Figure 7.4.
Evolution of deuterium occupancy in MgDx
This exchange expectedly has a correlation with deuterium vacancy for-mation, namely, a striking observation in Figure 7.4 is that during theD2 desorption between time between 220 and 300 min, there are largeamounts of vacancies present in the MgDx phase. In [20], such vacan-cies were also observed, however, in a much more limited period duringabsorption: close to the beginning of absorption. Further, in the presentcase, vacancies are also formed close to the end of the desorption process.This is an indication that for these 5 times smaller crystallites of MgD2,the creation of vacancies is much more prominent.
The evolution of the D site occupancy in MgDx was extracted as animportant parameter using Rietveld analysis of the neutron diffractionpatterns. Figure 7.4 shows that (after correction) approximately 32% ofdeuterium sites are vacant at the beginning of the loading. These vacan-cies are filled with deuterium during the subsequent loading. During thedesorption, a decrease in the deuterium occupancy site from 0.97 downto 0.86 was observed. A 10% of deuterium vacancies in MgDx was ob-served in the low temperature loading at 50 °C which were filled up athigher loading pressures.
138

7.2. RESULTS
0 100 200 300 400 500 600
0.5
0.6
0.7
0.8
0.9
1.0
ExtractedCorrected
D o
ccup
ancy
[-]
Time [min]
A: 150 °C
D2 loading
B: 150—320 °C
unloading
C: 50—150 °CD
2 loading
(a) (b) (c) (d) (e)5.1 10 0.32 10 107—10
Pressure [bar]
Figure 7.4 – The plot shows the change in D2 occupancy over measur-ing time. A correction of the occupancy numbers initially extracted fromthe data was calculated with the assumption of the presence of a homo-geneous H-D mixture (5%/95%) coming from the presence of TiHx inthe initial sample. The filled triangles are the corrected occupancy val-ues, while empty triangles represent the measured occupancy number.(a) – the applied pressure at the first step of first loading at 150 °C was5.1 bar; (b) – a pressure of 10 bar was applied in order to ensure thecomplete loading; (c) – during desorption, the pressure in the sampletube was 0.32 bar; (d) – the low temperature loading was started withthe application of 10 bar deuterium pressure, followed by a number ofsteps in pressure ranging from 7—10 bar (region (d) to (e)); (e) – finallyended with the application of 10 bar at 150 °C. Note that at (b) and (c)the same experimental conditions (150 °C and 10 bar) result in the sameoccupancies, showing that consistency is reacted after correcting for theinitial presence of H2. See Figure 7.2(a) for the corresponding tempera-ture changes over time.
139

CHAPTER 7. TIF3 CATALYZED MGH2
7.3 Discussion
7.3.1 Role of MgF2 as a grain refiner
The neutron diffraction results clearly show that the MgD2 crystallitesremain to have nano-dimensions throughout the D2 loading and unload-ing. Previous studies on NaAlH4 show that the reaction products NaCland TiAlx act as grain refiner for NaH and Al, respectively, where NaCland NaH; Al and TiAlx share the same crystallographic structure. Oneof the requirements for the grain refining action to happen is that the nu-cleation phase shares the same crystallographic structure as the adherentphase with may be a small lattice mismatch [82]. MgF2 is known to havethe same crystal structure (rutile) as Mg(H/D)2 with a very small lat-tice mismatch of approximately 2% [136, 137]. These observations clearlyshow that MgF2 can act as nucleation centers for MgD2, and acts as avery effective grain refiner for MgD2 crystallites by arresting the growthof the grains size to nano-dimensions. Notably, the MgD2 crystalline sizesremain much smaller than for example in Nb-catalyzed MgD2.
Small grain sizes are further very important in influencing the re-action kinetics by decreasing the diffusion distances [20, 84, 85, 87], andmight also be responsible for the vacancy formation [20], which also sig-nificantly helps to increase the hydrogen transport kinetics.
7.3.2 Deuterium vacancies during desorption in MgDx
Strikingly, a strong decrease in the deuterium site occupancy from 0.97down to 0.86 in the MgD2 was observed upon heating up to 300 °C dur-ing desorption (see Figure 7.4). Notably, such a behavior is not shownby bulk-MgD2 at the 300 °C so far, indicating that the thermodynamicsis affected for nano-crystallites (30 nm in this case). For Nb2O5-catalyzedMg(H/D)2, abundant vacancies have been observed only at the very be-ginning of hydrogenation [20, 101] and the very end of dehydrogenation.However for TiF3-catalyzed nano-MgD2, these abundant vacancies ap-pear for larger time during the D2 desorption and absorption.
140

7.4. CONCLUSIONS
7.4 Conclusions
The presence of the TiF3 catalyst added to MgH2 resulted into the for-mation of MgF2 and TiHx phases during the first hydrogen release. Theformed MgF2 crystallites act as nucleation centers for MgD2, and arrestthe size of MgD2 crystallites to 30 nm throughout the deuterium loadingand unloading cycle. The MgF2 containing Mg was successfully loaded at50 °C. The exothermic behavior of the reaction of Mg with D2 was clearlyobserved at 50 °C loading, where a drastic increase in the temperatureup to 105 °C was measured. Approximately 60% of deuterium could beloaded at 50 °C. An H-D exchange was observed in the TiHx phase.
Further, nano-crystallites of MgD2 showed approximately 30% of deu-terium vacancies in the beginning of the loading. These vacancies werefully filled in the subsequent steps of loading. A decrease in deuteriumsite occupancy from 0.97 down to 0.86 was observed again as a result ofdeuterium desorption at temperatures around 300 °C during desorption.
141


AFitted patterns on catalyzed NaAlH4
The background of protonated samples in neutron diffraction islargely due to incoherent scattering on the protons. However,with the high count rate of the GEM diffractometer at ISIS and
its advantageous scattering geometry, well resolved diffraction peaks canbe obtained on top of the background after relatively short measurementtimes. The supplementary figures (see Figure A.1 and Figure A.2) pre-sented in this appendix show two representative diffraction patterns to-gether with the Rietveld refinement patterns. The patterns are, beforeand after subtracting the background, for the TiCl3-catalyzed sample col-lected in time interval “B”, where the Na3AlH6 compound is graduallytransformed into the NaH and Al reaction products (see Chapter 4) .
143

APPENDIX A. FITTED PATTERNS ON CATALYZED NAALH4
0.05
0.10
0.15
0.20
0.25
0.30
1.0 1.5 2.0 2.5 3.0
Inte
nsity
d-spacing [Å]
a
Ical
Background
IobsIcal
- Iobs
1.0 1.5 2.0 2.5 3.0-0.04
0.00
0.04
0.08
0.12
d-spacing [Å]
Inte
nsity
NaH NaClNa3AlH
6Al
b
Figure A.1 – (a) A fitted diffraction pattern with background show-ing the onset of NaH formation together with NaCl upon heating theNa3AlH6 to 150 °C; (b) The pattern after subtraction of the background.
144

APPENDIX A. FITTED PATTERNS ON CATALYZED NAALH4
1.0 1.5 2.0 2.5 3.00.00
0.05
0.10
0.15
0.20
0.25
0.30
0.35In
tens
ity
d-spacing [Å]
a
1.0 1.5 2.0 2.5 3.0-0.05
0.00
0.05
0.10
0.15
0.20
0.25
Inte
nsity
d-spacing [Å]
b
Ical
Background
IobsIcal
- Iobs
NaH NaClNa3AlH
6Al
Figure A.2 – (a) A fitted diffraction pattern with background showingthat Na3AlH6 completely transforms into NaH and Al at 150 °C; (b) Thepattern after subtraction of the background.
145


BTiF3 catalyzed MgD2: Fitted patterns
Afew selected fitted neutron diffraction patterns from the TiF3-
catalyzed MgD2 are presented in Figures B.1 and B.2. Figure B.1(a)is taken from interval A, just before the beginning of D2 first step
of the first loading sequence at 150 °C. After 200 min, Mg was trans-formed into MgD2 while loading at 150 °C, leaving a very small amountof residual Mg (see Figure B.1(b)). A small background due to hydrogenpresent in the form TiHx can be seen in the Figure B.1. Heating up to320 °C resulted into the removal of this hydrogen and the absorbed deu-terium (see Figure B.2(a)). Subsequently, a number of D2 loading stepsin the temperature range of 50 °C—150 °C resulted into the formation ofMgD2, with some residual of Mg (see Figure B.2(b)).
147
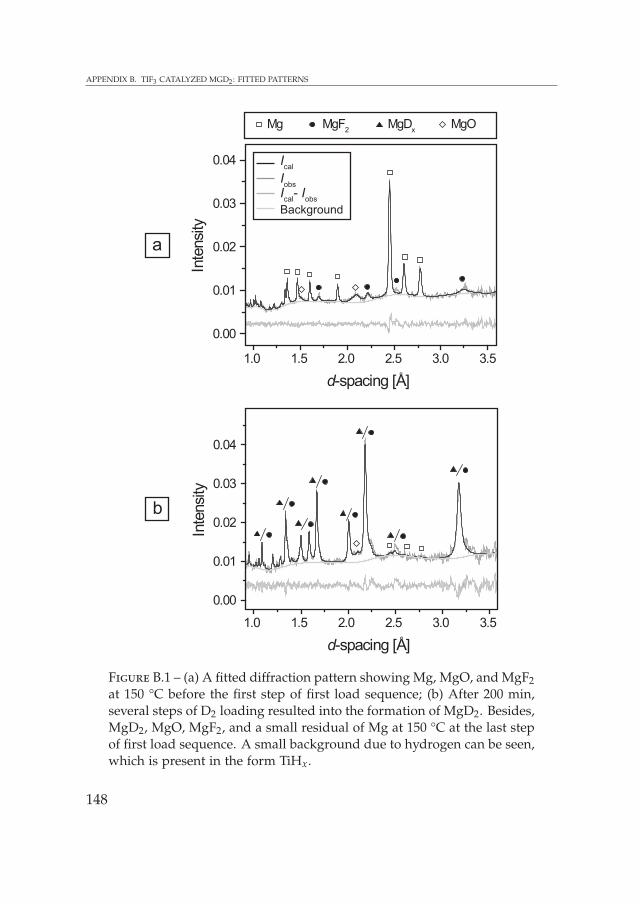
APPENDIX B. TIF3 CATALYZED MGD2 : FITTED PATTERNS
1.0 1.5 2.0 2.5 3.0 3.5
0.00
0.01
0.02
0.03
0.04
Mg MgF2
MgDx
MgO
d-spacing [Å]
Inte
nsity
a
Ical
Background
Iobs
Ical
- Iobs
1.0 1.5 2.0 2.5 3.0 3.5
0.00
0.01
0.02
0.03
0.04
Inte
nsity
d-spacing [Å]
b
Figure B.1 – (a) A fitted diffraction pattern showing Mg, MgO, and MgF2at 150 °C before the first step of first load sequence; (b) After 200 min,several steps of D2 loading resulted into the formation of MgD2. Besides,MgD2, MgO, MgF2, and a small residual of Mg at 150 °C at the last stepof first load sequence. A small background due to hydrogen can be seen,which is present in the form TiHx.
148

APPENDIX B. TIF3 CATALYZED MGD2 : FITTED PATTERNS
1.0 1.5 2.0 2.5 3.0 3.5
0.00
0.01
0.02
0.03
Mg MgF2
MgDx
MgO
d-spacing [Å]
Inte
nsity
a
Ical
Background
Iobs
Ical
- Iobs
0.00
0.01
0.02
0.03
0.04
0.05
1.0 1.5 2.0 2.5 3.0 3.5
d-spacing [Å]
Inte
nsity
b
Figure B.2 – (a) After desorption at 320 °C, both hydrogen and deu-terium were away from Mg(H,D)2 or Ti(H,D)x; (b) A diffraction patternshowing the complete transformation of Mg into MgD2 at 150 °C aftera number sequence of loading steps in the temperature range of 50—150 °C. Besides, MgD2, some residual Mg, MgO, and MgF2 is present atthe last step of second load sequence at 150 °C.
149


Summary
Hydrogen Storage
in
Nanostructured Light Metal Hydrides
S. Singh
This thesis presents studies on the role of catalysts as a grain re-fining agent, and as a hydrogen vacancy formation facilitator,besides its more commonly recognized activity as a hydrogen
molecule splitter for hydrogen storage in metals. The grain refining agent,resulting from the catalyst (additive), keeps the crystallites to nanoscale(<150 nm), and reduces the diffusion distance in this way, which isneeded for practical reversibility of hydrogenation reactions. It is shownthat these nano-crystallites contain abundant hydrogen vacancies, whichfacilitate the hydrogen reaction kinetics by reducing the migration energy.Furthermore, solid state transformations in Si destabilized MgH2 are pre-sented. In particular, MgH2 and NaAlH4 were considered to be the modelsystems, as they are promising future hydrogen storage media. Therein,advanced analysis methods such as X-ray diffraction, neutron diffraction,electron microscopy, and positron depth profiling were applied. The lat-ter may provide an insight into the electronic structure changes of metalhydride thin films used as hydrogen switchable mirrors and hydrogensensors. Moreover, ab initio calculations based on DFT using VASP werealso performed.
151

SUMMARY
Pd-capped Mg films
Chapter 3 presents results on the structural transformation and the roleof the Pd catalyst on the sorption temperatures and kinetics during hy-drogen cycling in Pd-capped Mg thin films. The films grow in columnsand clear interfaces with the substrate and Pd cap layer are present. Be-sides the expected phase transformation of hcp-Mg to rutile-MgH2, Mg-Pd and Mg-Si alloying was observed at the Pd–Mg and Mg–Si interfaces.A martensitic like phase transformation from Mg to MgH2 occurs with anorientation relationship of Mg (0002)||MgH2 (110). The alloying occursfor temperatures above 200 °C, which may possibly affect the hydrogena-tion processes. The hydrogen sorption studies show that the Mg can beloaded upto 4 wt.% already at 200 °C for applied pressure of 2.5 bar for2 h, and the full capacity of 7.6 wt.% can be reached with the applica-tion of 10 bar pressure for 24 h at this low temperature. Additionally,the delamination of the Pd cap layer at temperatures higher than 250 °Cwas observed, resulting into a significant decrease in the storage capacity.Positron depth profiling was used to reveal the delamination of ultrathinPd-cap layers. The permeation studies showed that the hydrogen trans-port kinetics is rate limited by the hydrogen dissociation at the samplesurface, indicating that the Pd catalyst acts as a H2 splitter at the surface.The impact of the presence of a Pd cap-layer on the hydrogen sorptionkinetics and temperatures of uptake and release is much higher than thatof the nano-columnar grain structure.
TiCl3 catalyzed NaAlH4
Chapter 4 presents in situ neutron diffraction studies on protonated un-catalyzed and TiCl3-catalyzed NaAlH4. In particular, the evolution ofgrain sizes and the hydrogen occupancy throughout the phase transfor-mations upon hydrogen release and deuterium reloading were studied.Clear differences in the crystallite sizes of the occurring phases, hydro-gen occupancy, and reversibility behavior in the catalyzed and uncat-alyzed NaAlH4 were reported. After the ball milling, the crystallite sizesfor catalyzed and uncatalyzed NaAlH4 were the same, i.e., approximately
152

SUMMARY
110 nm. However, uncatalyzed NaAlH4 showed growth in the crystallites,to sizes ≥1 µm, for all occurring phases during the desorption, makingit irreversible for deuterium loading. On the other hand, the catalyzedNaAlH4 showed the presence of nano-crystallites of NaH and Al withsizes of approximately 120 nm, which were maintained during the un-loading and loading cycling. The maintenance of small crystallite sizes iscaused by grain refinement, induced by the formed TiAlx and NaCl com-pounds, acting as nucleation centers for Al and NaH, respectively. More-over, the nanostructured NaH and Na3AlH6 phases showed the presenceof abundant hydrogen vacancies, which leads to H-D exchange in nano-NaH at a relatively low temperature of about 150 °C, while no vacancieswere observed in such type of phases of uncatalyzed NaAlH4.
Ab initio calculations on NaH
The DFT based ab initio calculations clearly show that the presence of hy-drogen vacancies significantly affects the hydrogen migration energy inNaH, resulting in faster diffusion, and enabling H-D exchange in nano-NaH as observed upon decomposition of ball-milled TiCl3-doped NaAlH4,as shown in Chapter 5. The estimated rate of the vacancy-mediated hy-drogen transport based on diffusion theory is consistent with observedH-D exchange reaction rates. Further, the formation energies for varioushydrogen defects, vacancies HV and interstitials HI, in the NaH latticewere obtained in all possible charged states (+1, 0, −1). The formationenergies for intrinsic hydrogen vacancy-interstitial pairs are too high toexplain the observed high hydrogen vacancy concentrations. In order toclarify the large amount of hydrogen vacancies in nano-NaH observed ex-perimentally in the TiCl3-doped NaAlH4 upon hydrogen cycling, a modelon the interface of NaH with NaCl, the latter acting as a nucleation center,was evaluated. The calculated interface energies fcc-Na–NaCl and NaH–fcc-Na (001) are low, suggesting a mechanism to induce abundant hydro-gen vacancies by promoting the growth of an fcc-Na interlayer betweenNaH crystallites and the NaCl nucleation centers. This model furtherassists the idea of the role of NaCl as grain refiner for NaH.
153

SUMMARY
Si destabilized MgH2
The Si destabilized MgH2 system was chosen to further investigate thegrain refining action by studying the evolution of crystallite sizes andtheir effect during the hydrogenation of Mg2Si (see Chapter 6). UsingNb2O5 as an additive, the reaction products of Nb and/or MgO were an-ticipated to act as possible grain refiner for Mg2Si. The detailed study onthe size evolution showed that very small grain sizes of MgH2 of approxi-mately 10 nm can be achieved in only 30 min of milling in the presence ofSi, which also consists of nano-dimension crystallites, i.e., 100 nm. Nano-Mg2Si (80 nm) was obtained upon desorption in the temperature rangeof 25—300 °C of the Nb2O5-catalyzed MgH2-Si mixture. Despite of thenano-dimensions of the crystallites, the Mg2Si could not be loaded withhydrogen successfully.
Mg-Si bilayer thin films capped with Pd were studied as an aid toclarify the (lack of) reactivity and to gain an insight into the local trans-formations associated with the solid state reactions. A well-defined inter-face between different layers was present in such types of thin films withtypical thicknesses of up to 1 µm. Similarly deposited films were heatedup to 207 °C under 10 bar of helium and a hydrogen atmosphere for 24 hto study the reaction path for Mg2Si formation. The study shows that theMg2Si formation is faster than that of MgH2 formation. Re-hydrogenationof Mg2Si is difficult, most likely related to the presence of a barrier againstremoval of Mg from the Mg2Si layer, inhibiting the formation of MgH2.
TiF3-catalyzed MgH2
In situ neutron diffraction studies on TiF3-catalyzed MgH2 are presentedin the Chapter 7. The structural transformation together with the evolu-tion of crystallite sizes and the deuterium occupancy in the MgD2 upondeuterium loading and unloading were studied. The study shows thatMgF2 was formed during the first hydrogen release. The TiF3-catalyzedMgD2 was successfully loaded at a temperature as low as 50 °C; however,the hydrogen release was very slow at this temperature. The rate of deu-terium release was increased by a factor of five at 320 °C. The crystallite
154

SUMMARY
sizes of MgD2 were found to be small (average crystallite size roughly30 nm) during the deuterium loading and unloading. The restrictedgrowth of MgD2 throughout the deuterium cycle suggests that MgF2 in-deed acts as grain refiner for MgD2 grains. Moreover, nano-crystallitesof MgD2 shows the presence of approximately 30% of deuterium vacan-cies in the beginning of the loading, which became almost fully occupiedupon full loading. Subsequent, desorption at higher temperatures againleads to an increase in the deuterium vacancy concentration which risesto 15%.
In this thesis it is reported that catalysts can provide an additionalrole as a grain refiner besides playing an important role in the hydrogenrelease and uptake by splitting the hydrogen molecule bond. Grain re-finement seems to work for several examples, while it does not solve thereversibility issue for Si-destabilized MgH2. It greatly improves reversibil-ity at favorable hydrogen cycling conditions for the NaAlH4 and MgH2
systems. Furthermore, these nano-crystallites (<150 nm) show abundanthydrogen vacancy concentrations during hydrogen loading and unload-ing. These vacancies lead to an enhancement in the reaction kineticsduring hydrogen cycling by reducing the migration energy.
155


Samenvatting
Hydrogen Storage
in
Nanostructured Light Metal Hydrides
S. Singh
Dit proefschrift beschrijft een studie naar de rol van katalysatorenin de korrelverfijning en in de vorming van waterstofvacaturesin opslagmaterialen voor waterstof gebaseerd op metaalhydri-
den. Deze rol blijkt op te treden naast de algemeen bekende rol vankatalysatoren in het splitsen van de waterstofmoleculen. De door detoegevoegde katalysator veroorzaakte korrelverfijning zorgt ervoor datde korrelgrootte van de kristallieten klein blijft (<150 nm), en vermin-dert zo de vereiste diffusielengte voor waterstof-en ionentransport, het-geen nodig is voor de praktische omkeerbaarheid van de waterstofsorp-tiereacties. In dit proefschrift wordt aangetoond dat de nanokristallietenovervloedige hoeveelheden waterstofvacatures bevatten, die de kinetiekvan de waterstofsorptiereacties bevorderen door de vermindering van demigratie energie. Bovendien wordt het verloop gepresenteerd van devastestoftransformaties in MgH2 dat door toevoeging van Si is gedesta-biliseerd. In het bijzonder worden hier MgH2 en NaAlH4 onderzochtals voorbeeldsystemen, temeer daar zij veelbelovende opslagmedia voorwaterstof zijn. In deze studie zijn geavanceerde analysemethoden zoalsRöntgendiffractie, neutronendiffractie, elektronenmicroscopie en positro-nen diepteprofilering toegepast. Deze laatste methode kan een inzichtgeven in de veranderingen in de elektronische structuur van dunne la-gen metaalhydriden, die een toepassing vinden in waterstof schakelbare
157

SAMENVATTING
spiegels en waterstofsensoren. Daarnaast zijn ab initio berekeningen,gebaseerd op DFT, met behulp van de VASP code uitgevoerd.
Mg dunne lagen met een Pd katalysator toplaag
Hoofdstuk 3 behandelt onderzoek naar de structurele transformaties vanMg dunne lagen met een Pd toplaag en de invloed van Pd als katalysatorop de temperaturen en kinetiek van het beladen met waterstof en hetontladen. De lagen groeien in de vorm van kolommen, en er is eenscherp grensvlak met het substraat en de Pd toplaag aanwezig. Naastde bekende fasetransformatie van hcp-Mg naar rutiel-MgH2 is de vorm-ing van Mg-Pd en Mg-Si legeringen waargenomen bij de Pd-Mg en Mg-Sigrensvlakken. Een martensitische fasetransformatie van Mg naar MgH2
treedt op met de oriëntatierelatie Mg (0002)||MgH2 (110). Voor tem-peraturen boven de 200 °C worden in de lagen legeringen gevormd, diemogelijk van invloed zijn op de waterstofbeladingsprocessen. De water-stofsorptiestudies tonen aan dat het Mg al bij 200 °C en een waterstof-druk van 2.5 bar gedurende 2 uur beladen kan worden tot 4 wt.%, endat de volledige capaciteit van 7.6 wt.% bij deze lage temperatuur wordtbereikt bij gebruik van 10 bar waterstofdruk gedurende 24 uur. Daarnaastis delaminatie van de Pd toplaag waargenomen bij temperaturen hogerdan 250 °C, wat resulteert in een grote afname van de opslagcapaciteit.Positronen diepteprofilering is gebruikt om de delaminatie van ultra-dunne Pd toplagen aan te tonen. Uit de permeatiestudies is gebleken datdissociatie van waterstofmoleculen aan het oppervlak van de dunnelaag-materialen de snelheidsbepalende factor is in de waterstofkinetiek, wataantoont dat de Pd katalysator fungeert als een splitser van H2 moleculenaan het oppervlak. Het effect van de aanwezigheid van een Pd afdeklaagop de waterstofsorptiekinetiek en de temperaturen van opname en afgiftevan waterstof is veel groter dan die van de kolomvormige korrelstructuur.
NaAlH4 gekatalyseerd met TiCl3
Hoofdstuk 4 beschrijft in-situ neutronen diffractiestudies aan geprotoneerdongekatalyseerd en TiCl3-gekatalyseerd NaAlH4. In het bijzonder is de
158

SAMENVATTING
ontwikkeling van de korrelgrootten en de waterstofbezetting tijdens defasetransformaties behorend bij waterstofontlading en het opnieuw be-laden met deuterium bestudeerd. Duidelijke verschillen zijn gevonden inde deeltjesgrootten van de optredende fasen, in de waterstofbezetting,en in de omkeerbaarheid van de reacties voor het gekatalyseerde enongekatalyseerde NaAlH4. De deeltjesgrootten van de kristallieten zijndirekt na de preparatie met behulp van kogelmalen hetzelfde voor gekatal-yseerd en ongekatalyseerd NaAlH4, ongeveer 110 nm. Het ongekataly-seerde NaAlH4 vertoonde echter een groei in de afmeting van de kristal-lieten tot voorbij 1 µm voor alle kristalfasen tijdens de desorptie, waar-door een herbelading met deuterium niet meer mogelijk bleek. Voorhet gekatalyseerde NaAlH4 bleek de desorptie echter te leiden tot hetontstaan van NaH en Al nanokristallieten met afmetingen van ongeveer120 nm. Deze deeltjesgrootten bleven behouden tijdens de afgifte van wa-terstof en opname van deuterium. De behouden kleine deeltjesgroottenworden veroorzaakt door de korrelverfijning door de gevormde TiAlx enNaCl verbindingen, die als nucleatiecentra voor respectievelijk het Al enhet NaH optreden. Daarnaast zijn grote concentraties waterstofvacatureswaargenomen in de gevormde nanogestruktureerde NaH en Na3AlH6
fasen, wat leidt tot uitwisseling van waterstof en deuterium in de NaHnanokristallieten bij een relatief lage temperatuur van ongeveer 150 °C,terwijl er geen waterstofvacatures waargenomen zijn in deze fasen voorhet ongekatalyseerde NaAlH4.
Ab initio berekeningen aan NaH
Uit de ab initio berekeningen gebaseerd op DFT, zoals weergegeven inhoofdstuk 5, blijkt duidelijk dat de aanwezigheid van waterstofvacaturesde migratie energie van waterstof in NaH zeer sterk beïnvloedt, waardoordiffusie ontstaat en de uitwisseling van waterstof en deuterium voor hetnano-NaH mogelijk wordt, zoals waargenomen tijdens de decomposi-tie van het met kogelmalen geprepareerde NaAlH4 gekatalyseerd metTiCl3. De op basis van diffusietheorie geschatte snelheid van het trans-port van waterstof via waterstofvacatures is in overeenstemming metde waargenomen snelheid van de uitwisseling van waterstof en deu-
159

SAMENVATTING
terium. Verder is de vormingsenergie van diverse waterstofdefecten inhet NaH kristalrooster, namelijk waterstofvacatures HV en interstitiëlewaterstofatomen HI , verkregen in alle mogelijke ladingstoestanden (dus+1,0,−1). De vormingsenergieën voor de intrinsieke waterstof vacature-interstitiële paren zijn te hoog om de waargenomen hoge concentratieswaterstofvacatures te kunnen verklaren. Ten einde inzicht te krijgen in degrote hoeveelheid waterstofvacatures in nano-NaH, zoals experimenteelis waargenomen in het TiCl3-gedoopte NaAlH4 tijdens waterstof ontladenen beladen, is een model geëvalueerd waarin het grensvlak van NaH metNaCl werd beschouwd. De NaCl kristallieten treden hierbij op als nu-cleatiecentra. De berekende grensvlakenergieën voor de fcc-Na||NaClen NaH||fcc-Na (001) grensvlakken zijn laag. Een mogelijk mechanismevoor het opwekken van grote concentraties waterstofvacatures is hierdoorgevonden, waarin de groei van een kubisch vlakgecentreerde natrium(fcc-Na) tussenlaag tussen de NaCl nucleatiecentra en de NaH kristalli-eten centraal staat. Dit model onderbouwt tevens de voorgestelde rol vanNaCl als korrelverfijner voor NaH.
MgH2 gedestabiliseerd door Si
Het systeem MgH2 gedestabiliseerd door Si is gekozen voor verder on-derzoek naar de relatie tussen korrelverfijning en de ontwikkeling vandeeltjesgrootten, en ten einde de gevolgen daarvan voor waterstofbelad-ing van Mg2Si te onderzoeken (zie hoofdstuk 6). Voor de katalysatorNb2O5 is de verwachting dat de reactieproducten Nb en/of MgO kunnenoptreden als mogelijke korrelverfijners voor Mg2Si. Uit de gedetailleerdestudie naar de ontwikkeling van deeltjesgrootten is gebleken dat een zeerkleine korrelgrootte voor het MgH2 van ongeveer 10 nm kan wordenbereikt in slechts 30 min kogelmalen in aanwezigheid van Si poeder.De Si kristallieten bereiken ook kleine afmetingen, namelijk ongeveer100 nm. Nano-Mg2Si (80 nm) ontstaat tijdens waterstofdesorptie van hetNb2O5-gekatalyseerde MgH2-Si systeem in het temperatuurgebied van25—300 °C. Ondanks de nanoschaal afmetingen van de kristallieten bleekhet Mg2Si echter niet te kunnen worden herbeladen met waterstof. Mg-Sidubbellagen met een Pd toplaag zijn bestudeerd om verder inzicht te krij-
160

SAMENVATTING
gen in de (afwezigheid van) reactiviteit en in de lokale transformaties tengevolge van de vastestofreacties. Een goed gedefiniëerd grensvlak tussende verschillende lagen is aanwezig in dergelijke dunnelaagsystemen dietypisch van de orde van 1 µm dik zijn. De dunnelaagsystemen werdenverhit tot 207 °C gedurende 24 uur onder een 10 bar helium of waterstofatmosfeer ten einde het reactiepad voor de vorming van Mg2Si te kunnenbestuderen. De studie toont aan dat de vorming van Mg2Si sneller is dande vorming van MgH2. Herbeladen van Mg2Si is moeilijk, waarschijnlijkvanwege de aanwezigheid van een barrière tegen verwijdering van Mguit de Mg2Si laag, waardoor de vorming van MgH2 wordt verhinderd.
MgH2 gekatalyseerd met TiF3
In-situ neutronen diffractiestudies aan MgH2 gekatalyseerd met TiF3 wor-den beschreven in hoofdstuk 7. De structurele transformaties samen metde ontwikkeling van de deeltjesgrootten en de deuteriumbezetting in hetMgD2 werden bestudeerd tijdens het ontladen en het beladen met deu-terium. De studie toont aan dat MgF2 werd gevormd tijdens de eerstewaterstofontlading. Het met TiF3 gekatalyseerde MgD2 kon met succesworden herbeladen bij een nogal lage temperatuur van 50 °C, maar dedesorptie van het deuterium is traag bij deze temperatuur. De snelheidvan deuteriumontlading is vijf keer zo snel bij 320 °C. De deeltjesgroot-ten van het MgD2 bleken klein te zijn (gemiddeld ongeveer 30 nm) ente blijven tijdens het ontladen en het herbeladen met deuterium. Debeperkte groei van MgD2 gedurende de gehele deuteriumbeladingscy-clus suggereert dat MgF2 inderdaad fungeert als korrelverfijner voor deMgD2 deeltjes. Daarnaast is waargenomen dat de MgD2 nanokristallietenongeveer 30% deuteriumvacatures bevatten tijdens de beginfase van hetbeladen, waarna de deuteriumposities bijna volledig bezet werden nabijde volledig beladen toestand van het materiaal. De daaropvolgende ont-lading bij hogere temperaturen leidde tot een hernieuwde toename vande concentratie deuteriumvacatures tot 15%.
161

SAMENVATTING
In dit proefschrift wordt beschreven dat katalysatoren een belangri-jke aanvullende rol kunnen vervullen als korrelverfijner, naast de rol diezij spelen bij de opname en afgifte van waterstof door het splitsen vanwaterstofmoleculen. Het mechanisme van korrelverfijning lijkt te werkenvoor verscheidene voorbeelden, terwijl dit niet de oplossing blijkt te zijnom reversibiliteit te bereiken in het Si-gedestabiliseerde MgH2 systeem.Het verbetert voor NaAlH4 en MgH2 gekatalyseerd met respectievelijkTiCl3 en TiF3 de omkeerbaarheid aanzienlijk en leidt tot gunstige om-standigheden van waterstofbelading en ontlading. Bovendien blijken denanokristallieten (<150 nm) voor deze systemen grote concentraties wa-terstofvacatures te bevatten tijdens het beladen en ontladen. Deze vaca-tures leiden tot een verbetering in de kinetiek tijdens het cycleren metwaterstof door de sterke vermindering van de migratie energie.
162

Bibliography
[1] H. Cavendish. Experiments on factitious air. Phil. Trans. R. Soc. Lon., 56,1766. 2
[2] H. Hartley. Antoine Laurent Lavoisier. Proc. Roy. Soc. London A, 189(1019),1947. 2
[3] P. Hoffmann. Tomorrow’s energy: Hydrogen, fuel cells, and prospects for acleaner planet. The MIT Press, Cambridge, Massachusetts, London, Eng-land, 2002. 2–5
[4] The National Hydrogen Association. http://www.hydrogenassociation.org/general/factSheets.asp, 2009. 2, 3, 5
[5] C. Russell. http://www.rsc.org/chemistryworld/Issues/2003/August/electrolysis.asp, August 2003. Royal Society of Chemistry. 2
[6] W.R. Grove. On the gas voltaic battery. Experiments made with a view ofascertaining the rationale of its action and its application to eudiometry.Phil. Trans. R. Soc. Lon., 133, 1947. 2
[7] J.B.S. Haldane. Daedalus or science and future; A paper read to theheretics. Cambridge, 1923. 2
[8] A.J. Dessler. The Hindenburg hydrogen fire: Fatal flaws in the addisonbain incendiary-paint theory. Technical report, Lunar and Planetary Lab-oratory, University of Arizona, 2004. 3
[9] A.J. Dessler, D.E. Overs, and W.H. Appleby. The Hindenburg fire: Hydro-gen or incendiary paint? Buoyant Flight, 52, 2005. 3
[10] K.R. Williams. Francis Thomas Bacon. Biogr. Mems Fell. R. Soc., 39, 1994.3
[11] Fuel Cell Test and Evaluation Center (FCTec). Fuel cell basics, 2001—2009.http://www.fctec.com/fctec_history.asp. 4
163

BIBLIOGRAPHY
[12] R. Billings. http://rogerbillings.info/index.html, 2008. 4
[13] EIA/IEO. International energy outlook May 2007. Technical ReportDOE/EIA-0484, EIA, 2007. 5, 6
[14] L. Schlapbach and A. Züttel. Hydrogen-storage materials for mobile ap-plications. Nature, 414:353, 2001. 6, 73, 113
[15] A. Züttel. Materials for hydrogen storage. Mater. Today, 6:24, 2003. 7, 8
[16] G. Barkhordarian, T. Klassen, and R. Bormann. Fast hydrogen sorptionkinetics of nanocrystalline Mg using Nb2O5 as catalyst. Scripta Mater.,49:213, 2003. 7
[17] G. Barkhordarian, T. Klassen, and R. Bormann. Effect of Nb2O5 contenton hydrogen reaction kinetics of Mg. J. Alloy. Compd., 364:242, 2004. 7
[18] N. Hanada, T. Ichikawa, S. Hino, and H. Fujii. Remarkable improvementof hydrogen sorption kinetics in magnesium catalyzed with Nb2O5. J.Alloy. Compd., 420:46, 2006. 7
[19] W. Oelerich, T. Klassen, and R. Bormann. Metal oxides as catalysts forimproved hydrogen sorption in nanocrystalline Mg-based materials. J.Alloy. Compd., 315:237, 2001. 7
[20] H.G. Schimmel, J. Huot, L.C. Chapon, F.D. Tichelaar, and F.M. Mulder.Hydrogen cycling of niobium and vanadium catalyzed nanostructuredmagnesium. J. Am. Chem. Soc., 127:14348, 2005. 7, 9, 11, 86, 88, 97, 114,129, 130, 137, 138, 140
[21] Z. Dehouche, R. Djaozandry, J. Huot, S. Boily, J. Goyette, T.K. Bose, andR. Schulz. Influence of cycling on the thermodynamic and structureproperties of nanocrystalline magnesium based hydride. J. Alloy. Compd.,305:264, 2000. 7
[22] B. Bogdanovic, R.A. Brand, A. Marjanovic, M. Schwickardi, and J.Tolle.Metal-doped sodium aluminium hydrides as potential new hydrogen stor-age materials. J. Alloy. Compd., 302:36, 2000. 8, 73
[23] B. Bogdanovic and M. Schwickardi. Ti-doped alkali metal aluminium hy-drides as potential novel reversible hydrogen storage materials. J. Alloy.Compd., 253-254:1, 1997. 8, 73, 98
[24] J.J. Vajo, F. Mertens, C.C. Ahn, R.C. Bowman Jr., and B. Fultz. Alteringhydrogen storage properties by hydride destabilization through alloy for-mation: LiH and MgH2 destabilized with Si. J. Phys. Chem. B, 108:13977,2004. 9, 70, 113
164

BIBLIOGRAPHY
[25] O. Friedrichs, T. Klassen, J.C. Sánchez-López, R. Bormann, and A. Fer-nández. MgH2 with Nb2O5 as additive, for hydrogen storage: Chemical,structural and kinetic behavior with heating. Acta Mater., 54:105, 2006. 9,114, 129
[26] N. Iqbal, N.H. van Dijk, T. Hansen, L. Katgerman, and G.J. Kearley. Therole of solute titanium and TiB2 particles in the liquid-solid phase trans-formation of aluminum alloys. Mater. Sci. Eng. A-Struct., 386:20, 2004. 10,89
[27] N. Iqbal, N.H. van Dijk, S.E. Offerman, M.P. Moret, L. Katgerman, andG.J. Kearley. Real-time observation of grain nucleation and growth duringsolidification of aluminium alloys. Acta Mater., 53:2875, 2005. 10, 89
[28] M. Wagemaker, W.J.H. Borghols, and F.M. Mulder. Large impact of particlesize on insertion reactions. A case for anatase LixTiO2. J. Am. Chem. Soc.,129:4323, 2007. 11, 88, 97
[29] Fritsch GmbH. Operating Instructions: Planetary Mono Mill "Pulverisette 6",2005. http://www.fritsch.de. 16
[30] M.W. Zandbergen. Nano-structured Mg and LiAl films for hydrogen stor-age. Master’s thesis, Delft University of Technology, March 2004. 18, 50,54
[31] R. Kind. Depth sensitive analysis of Si-destablized MgH2 thin films uponreversible H2-sorption. Technical report, Delft University of Technology,July 2008. Bachelor’s thesis. 18
[32] M. Ohring. Materials Science of Thin Films. Academic Press, San Diego,2002. 19, 20
[33] P. Mosaner, N. Bazzanella, M. Bonelli, R. Checchetto, and A. Miotello.Mg:Nb films produced by pulsed laser deposition for hydrogen storage.Mater. Sci. Eng. B, 108:33, 2004. 19, 67
[34] J. Paillier and L. Roue. Hydrogen electrosorption and structural propertiesof nanostructured Pd-Mg thin films elaborated by pulsed laser deposition.J. Alloy. Compd., 404—406:473, 2005. 19
[35] A.C. Larson and R.B.V. Dreele. General Structure Analysis System (GSAS),2000. 22, 36, 39, 76
[36] S.W. Lovesey. Theory of neutron scattering from condensed matter; nuclearscattering, volume 1. Oxford University Press, New York, 1984. 33
165

BIBLIOGRAPHY
[37] G.L. Squires. Introduction to the theory of thermal neutron Scattering. Cam-bridge University Press: Cambridge London New York Melbourne, 1978.33
[38] W.G. Williams, R.M. Ibberson, P. Day, and J.E. Enderby. GEM—generalmaterials diffractometer at ISIS. Physica B, 241—243:234, 1998. 34, 76
[39] ISIS. http://www.isis.rl.ac.uk/. 34–36
[40] W. Kohn and L.J. Sham. Self-consistent equations including exchange andcorrelation effects. Phys. Rev., 140:A1133, 1965. 39–41, 98
[41] P. Hohenberg and W. Kohn. Inhomogeneous electron gas. Phys. Rev.,136:B864, 1964. 39, 40, 98
[42] M. Born and R. Oppenheimer. Zur Quantentheorie der Molekeln. Ann.Phys., 84:457, 1927. 39
[43] P. Ziesche, S. Kurth, and J.P. Perdew. Density functionals from LDA toGGA. Comp. Mater. Sci., 11:122, 1998. 41
[44] G. Kresse and J. Furthmuller. Vienna Ab-initio Simulation Package. Institutfür Materialphyik, Universität Wien, Sensengasse 8, A-1130 Wien, Austria,August 2005. http://cms.mpi.univie.ac.at/vasp/. 41–43, 98
[45] R.M. Nieminen. Chapter 4: The fate of slow positrons in condensed matter.World Scientific Singapore New Jersey London Hong Kong, 1999. 44
[46] Positron Beam Laboratory. http://www.uwo.ca/isw/facilities/
Positron/analysis.htm. 44
[47] A. Rivera. Hydrogen interactions with silicon-on-insulator materials. PhD the-sis, Delft University of Technology, 2002. 45
[48] P. Coleman, editor. Positron beams and their applications. World ScientificSingapore New Jersey London Hong Kong, 1999. 46
[49] P.J. Schultz and K.G. Lynn. Interaction of positron beams with surfaces,thin films, and interfaces. Rev. Mod. Phys., 108:33, 1988. 46
[50] K. Higuchi, H. Kajioka, K. Toiyama, H. Fujii, S. Orimo, and Y. Kikuchi. Insitu study of hydriding-dehydriding properties in some Pd/Mg thin filmswith different degree of Mg crystallization. J. Alloy. Compd., 293—295:484,1999. 49
[51] K. Higuchi, K. Yamamoto, H. Kajioka, K. Toiyama, M. Honda, S. Orimo,and H. Fujii. Remarkable hydrogen storage properties in three-layeredPd/Mg/Pd thin films. J. Alloy. Compd., 330—332:526, 2002. 49, 53
166

BIBLIOGRAPHY
[52] L. Aballe, C. Rogero, and K. Horn. Quantum size effects in ultrathinepitaxial Mg films on Si (111). Phys. Rev. B, 65:125319, 2002. 52
[53] K. Saiki, K. Nishita, Y. Ariga, and A. Koma. Growth of Mg films on H-terminated Si (111). J. Vac. Sci. Technol. A, 17:2911, 1999. 52
[54] H.G. Schimmel, M.R. Johnson, G.J. Kearley, A.J. Ramirez-Cuesta, J. Huot,and F.M. Mulder. The vibrational spectrum of magnesium hydride frominelastic neutron scattering and density functional theory. Mater. Sci. Eng.B, 108:38, 2004. 53
[55] J. Huot. Nanocrystalline Materials for Hydrogen Storage in Nanoclusters andNanocrystals. American Scientific Publishers, Stevenson Ranch, CA, 2003.Chapter 2, pp.53—85. 54
[56] D.R. Lide. CRC Handbook of Chemistry and Physics. CRC press, Boca Raton,Florida, 84th edition, 2003—2004. pp.12/219—12/220. 59
[57] A. van Veen, H. Schut, J. de Vries, R.A. Hakvoort, and M.R. IJpma. Analy-sis of positron profiling data by means of "VEPFIT". In P.J. Schultz, editor,4th International workshop on: Slow-positron beam techniques for solids and sur-faces, volume 218, page 171. AIP, New York, July 1990. 61, 120
[58] Y. Garreau and G. Loupias. Compton profile of MgH2. Solid State Commun.,74:583, 1990. 61
[59] S.W.H. Eijt, R. Kind, S. Singh, H. Schut, W.J. Legerstee, R.W.A. Hendrikx,V.L. Svetchnikov, R.J. Westerwaal, and B. Dam. Positron depth profilingof the structural and electronic structure transformations of hydrogenatedMg-based thin films. J. Appl. Phys., 105:043514, 2009. 63, 64
[60] R. Checchetto, N. Bazzanella, A. Miotello, R.S. Brusa, A. Zecca, andA. Mengucci. Deuterium storage in nanocrystalline magnesium thin films.J. Appl. Phys., 95:1989, 2004. 63
[61] S. Hao and D.S. Sholl. Hydrogen diffusion in MgH2 and NaMgH3 viaconcerted motions of charged defects. Appl. Phys. Lett., 93:251901, 2008.63
[62] J.L. Slack, J.C.W. Locke, S.W. Song, J. Ona, and T.J. Richardson. Metal hy-dride switchable mirrors: Factors influencing dynamic range and stability.Sol. Energ. Mat. Sol. C., 90:485, 2006. 64
[63] P.I. Kripyakevich and E.I. Gladyshevskii. Sov. Phys. Crystallogr., 5:552, 1960.68
167

BIBLIOGRAPHY
[64] W. Lohstroh, R.J. Westerwaal, J.L.M. van Mechelen, C. Chacon, E. Jo-hansson, B. Dam, and R. Griessen. Structural and optical propertiesof Mg2NiHx switchable mirrors upon hydrogen loading. Phys. Rev. B,70:165411, 2004. 70
[65] W. Lohstroh, R.J. Westerwaal, B. Noheda, S. Enache, I.A.M.E. Giebels,B. Dam, and R. Griessen. Self-organized layered hydrogenation in blackMg2NiHx switchable mirrors. Phys. Rev. Lett., 93:197404, 2004. 70
[66] W.K. Chu, S.S. Lau, J.W. Mayer, and H. Müller. Implanted noble gas atomsas diffusion markers in silicide formation. Thin Solid Films, 25:393, 1975.70
[67] P.L. Janega, J. McCaffrey, D. Landheer, M. Buchanan, M. Denhoff, andD. Mitchel. Contact resistivity of some magnesium/silicon and magne-sium silicide/silicon structures. Appl. Phys. Lett., 53:2056, 1988. 70
[68] B. Bogdanovic, M. Felderhoff, S. Kaskel, A. Pommerin, K. Schlichte, andF. Schüth. Improved hydrogen storage properties of Ti-doped sodiumalanate using titanium nanoparticles as doping agents. Adv. Mater.,15:1012, 2003. 73, 98
[69] K.J. Gross, S. Guthrie, S. Takara, and G.J. Thomas. In situ X-ray diffractionstudy of the decomposition of NaAlH4. J. Alloy. Compd., 297:297, 2000. 73
[70] C.M. Jensen and K.J. Gross. Development of catalytically enhancedsodium aluminum hydride as a hydrogen-storage material. Appl. Phys.A, 72:213, 2001. 73
[71] G. Sandrock, K.J. Gross, G.J. Thomas, C.M. Jensen, D. Meeker, andS. Takara. Dynamic in situ X-ray diffraction of catalyzed alanates. J. Alloy.Compd., 330:696, 2002. 73
[72] K.J. Gross, G.J. Thomas, and C.M. Jensen. Catalyzed alanates for hydrogenstorage. J. Alloy. Compd., 330—332:683, 2002. 74
[73] T. Kiyobayashi, S.S. Srinivasan, D. Sun, and C.M. Jensen. Kinetic studyand determination of the enthalpies of activation of the dehydrogenationof titanium- and zirconium-doped NaAlH4 and Na3AlH6. J. Phys. Chem.A, 107:7671, 2003. 74
[74] J. Graetz, J.J. Reilly, J. Johnson, A.Y. Ignatov, and T.A. Tyson. X-ray absorp-tion study of Ti-activated sodium aluminum hydride. Appl. Phys. Lett.,85:500, 2004. 74, 89
168

BIBLIOGRAPHY
[75] A. León, O. Kircher, J. Rothe, and M. Fichtner. Chemical state and localstructure around titanium atoms in NaAlH4 doped with TiCl3 using X-rayabsorption spectroscopy. J. Phys. Chem. B, 108:16372, 2004. 74
[76] J. Iniguez and T. Yildirim. First-principles study of Ti-doped sodiumalanate surfaces. Appl. Phys. Lett., 86:103109, 2005. 74
[77] D. Sun, T. Kiyobayashi, H.T. Takeshita, N. Kuriyama, and C.M. Jensen.X-ray diffraction studies of titanium and zirconium doped NaAlH4: Elu-cidation of doping induced structural changes and their relationship toenhanced hydrogen storage properties. J. Alloy. Compd., 337:L8, 2002. 74
[78] G.J. Thomas, K.J. Gross, N.Y.C. Yang, and C. Jensen. Microstructural char-acterization of catalyzed NaAlH4. J. Alloy. Compd., 330-332:702, 2002. 74
[79] O. Palumbo, A. Paolone, R. Cantelli, C.M. Jensen, and M. Sulic. FastH-vacancy dynamics during alanate decomposition by anelastic spec-troscopy. proposition of a model for Ti-enhanced hydrogen transport. J.Phys. Chem. B, 110:9105, 2006. 74, 88, 97
[80] A. Peles and C.G. van de Walle. Hydrogen-related defects in sodiumalanate. J. Alloy. Compd., 446-447:459, 2007. 74, 88, 98
[81] A. Peles and C.G. van de Walle. Role of charged defects and impurities inkinetics of hydrogen storage materials: A first-principles study. Phys. Rev.B, 76:214101, 2007. 74, 97
[82] S. Singh, S.W.H. Eijt, J. Huot, W.A. Kockelmann, M. Wagemaker, andF.M. Mulder. The TiCl3 catalyst in NaAlH4 for hydrogen storage inducesgrain refinement and impacts on hydrogen vacancy formation. Acta Mater.,55:5549, 2007. 75, 97, 100, 104, 108, 110, 114, 129, 140
[83] G. Blake. Sequentz program for sequential refinement using GSAS. An-nual report, ISIS facility, 2004. 76
[84] B. Bogdanovic and B. Spliethoff. Active MgH2-Mg-systems for hydrogenstorage. Int. J. Hydrogen Energ., 12:863, 1987. 85, 140
[85] K.J. Gross, P. Spatz, A. Züettel, and L. Schlapbach. Mechanically milledMg composites for hydrogen storage—the transition to a steady state com-position. J. Alloy. Compd., 240:206, 1996. 85, 140
[86] J. Huot, G. Liang, S. Boily, A. van Neste, and R. Schulz. Structural studyand hydrogen sorption kinetics of ball-milled magnesium hydride. J. Alloy.Compd., 293-295:495, 1999. 85
169

BIBLIOGRAPHY
[87] C.P. Baldé, B.P.C. Hereijgers, J.H. Bitter, and K.P. de Jong. Facilitated hy-drogen storage in NaAlH4 supported on carbon nanofibers. Angew. Chem.Int. Edit., 45:3501, 2006. 85, 140
[88] C.M. Araújo, S. Li, R. Ahuja, and P. Jena. Vacancy-mediated hydrogendesorption in NaAlH4. Phys. Rev. B, 72:165101, 2005. 86
[89] S. Li, P. Jena, and R. Ahuja. Effect of Ti and metal vacancies on the elec-tronic structure, stability, and dehydrogenation of Na3AlH6: Supercellband-structure formalism and gradient-corrected density-functional the-ory. Phys. Rev. B, 73:214107, 2006. 86
[90] C. Weidenthaler, A. Pommerin, M. Felderhoff, B. Bogdanovic, andF. Schüth. On the state of the titanium and zirconium in Ti- or Zr-dopedNaAlH4 hydrogen storage material. Phys. Chem. Chem. Phys., 5:5149, 2003.89
[91] A.B. Belonoshko, N.V. Skorodumova, A. Rosengren, and B. Johansson.Melting and critical superheating. Phys. Rev. B, 73:012201, 2006. 89
[92] H.W. Brinks, C.M. Jensen, S.S. Srinivasan, B.C. Hauback, D. Blanchard,and K. Murphy. Synchrotron X-ray and neutron diffraction studies ofNaAlH4 containing Ti additives. J. Alloy. Compd., 376:215, 2004. 89
[93] H.W. Brinks, M. Sulic, C.M. Jensen, and B.C. Hauback. TiCl3-enhancedNaAlH4: Impact of excess al and development of the Al1−yTiy phase dur-ing cycling. J. Phys. Chem. B, 110:2740, 2006. 89
[94] A.G. Haiduc, H.A. Stil, M.A. Schwarz, P. Paulus, and J.J.C. Geerlings. Onthe fate of the Ti catalyst during hydrogen cycling of sodium alanate. J.Alloy. Compd., 393:252, 2005. 91
[95] J.M. Colbe von Bellosta, W. Schmidt, M. Felderhoff, B. Bogdanovic, andF. Schüth. Hydrogen-isotope scrambling on doped sodium alanate. Angew.Chem. Int. Edit., 45:3663, 2006. 94
[96] G. Sandrock. A panoramic overview of hydrogen storage alloys from agas reaction point of view. J. Alloy. Compd., 293—295:877, 1999. 94
[97] S. Chaudhuri and J.T. Muckerman. First-principles study of Ti-catalyzedhydrogen chemisorption on an Al surface: A critical first step for reversiblehydrogen storage in NaAlH4. J. Phys. Chem. B, 109:6952, 2005. 94
[98] R.J. Borg and G.J. Dienes. An Introduction to Solid State Diffusion. AcademicPress, Boston, 1988. 97
170

BIBLIOGRAPHY
[99] F.A. Kroger. The Chemistry of Imperfect Crystals. North Holland, Amster-dam, 1964. 97
[100] Q. Shi, J. Voss, H.S. Jacobson, K. Lefmann, M. Zamponi, and T. Vegge.Point defect dynamics in sodium aluminum hydrides—A combinedquasielastic neutron scattering and density functional theory study. J. Al-loy. Compd., 446-447:469, 2007. 97
[101] A. Borgschulte, U. Bösenberg, G. Barkhordarian, M. Dornheim, andR. Bormann. Enhanced hydrogen sorption kinetics of magnesium bydestabilized MgH2−δ. Catal. Today, 120:262, 2007. 97, 114, 129, 140
[102] S. Singh, S.W.H. Eijt, M.W. Zandbergen, W.J. Legerstee, and V.L. Svetch-nikov. Nanoscale structure and the hydrogenation of Pd-capped magne-sium thin films prepared by plasma sputter and pulsed laser deposition.J. Alloy. Compd., 441:344, 2007. 98, 113, 116, 124
[103] M. Felderhoff, K. Klementiev, W. Grunert, B. Spliethoff, B. Tesche, J.M. Bel-losta von Colbe, B. Bogdanovic, M. Hartel, A. Pommerin, F. Schüth, andC. Weidenthaler. Combined TEM-EDX and XAFS studies of Ti-dopedsodium alanate. Phys. Chem. Chem. Phys., 6:4369, 2004. 98
[104] J.P. Perdew and Y. Wang. Accurate and simple analytic representation ofthe electron-gas correlation energy. Phys. Rev. B, 45:13244, 1992. 98
[105] J.P. Perdew, K. Burke, and M. Ernzerhof. Generalized gradient approxi-mation made simple. Phys. Rev. Lett., 77:3865, 1996. 98
[106] H.J. Monkhorst and J.D. Pack. Special points for brillouin-zone integra-tions. Phys. Rev. B, 13:5188, 1976. 99
[107] W.H. Bragg and W.L. Bragg. The reflection of x-rays by crystals. In Proceed-ings of the Royal Society of London. Series A, Containing Papers of a Mathemat-ical and Physical Character, volume 88/Number 605, page 428. The RoyalSociety, 1913. ICSD database. 99
[108] C.G. Shull, E.O. Wollan, G.A. Morton, and W.L. Davidson. Neutrondiffraction studies of NaH and NaD. Phys. Rev., 73:842, 1948. 99
[109] X. Ke and I. Tanaka. Decomposition reactions for NaAlH4, Na3AlH6, andNaH: First-principles study. Phys. Rev. B, 71:024117, 2005. 99, 103
[110] C.G. van de Walle and J. Neugebauer. First-principles calculations fordefects and impurities: Applications to III-nitrides. J. Appl. Phys., 95:3851,2004. 99
171

BIBLIOGRAPHY
[111] S.B. Zhang and J.E. Northrup. Chemical potential dependence of defectformation energies in GaAs: Application to Ga self-diffusion. Phys. Rev.Lett., 67:2339, 1991. 99
[112] B.J. Kooi, A. van Veen, J.Th.M. de Hosson, H. Schut, A.V. Fedorov, andF. Labohm. Rectangular nanovoids in helium-implanted and thermallyannealed MgO (100). Appl. Phys. Lett., 76(9):1110, 2000. 108
[113] S.W.H. Eijt, J. de Roode, H. Schut, B.J. Kooi, and J.Th.M. de Hosson. For-mation and stability of rocksalt ZnO nanocrystals in MgO. Appl. Phys.Lett., 91:201906, 2007. 108
[114] C.V. Falub, P.E. Mijnarends, S.W.H. Eijt, M.A. van Huis, A. van Veen, andH. Schut. Electronic structure and orientation relationship of Li nanoclus-ters embedded in MgO studied by depth-selective positron annihilationtwo-dimensional angular correlation. Phys. Rev. B, 66:075426, 2002. 108
[115] A.V. Sugonyako, D.I. Vainshtein, A.A. Turkin, H.W. den Hartog, and A.A.Bukharaev. Melting of sodium clusters in electron irradiated NaCl. J. Phys.:Condens. Matter., 16:785, 2004. 108, 110
[116] M. Wagemaker, F.M. Mulder, and A. van der Ven. The role of surface andinterface energy on phase stability of nano-sized insertion compounds.Adv. Mater., 2009. accepted. 109
[117] D. Chen, X.L. Ma, and Y.M. Wang. First-principles study of the interfacialstructures of Au/MgO(001). Phys. Rev. B, 75:125409, 2007. 109
[118] R. Gaudoin, W.M.C. Foulkes, and G. Rajagopal. Ab initio calculations ofthe cohesive energy and the bulk modulus of aluminium. J. Phys.: Condens.Matter., 14:8787, 2002. 109
[119] S.J. Duclos, Y.K. Vohra, and A.L. Ruoff. High-pressure studies of NaH to54 GPa. Phys. Rev. B, 36:7664, 1987. 110
[120] S.R. Elliott. The Physics and Chemistry of Solids. John Wiley & Sons, 1998.p.193. 110
[121] Y. Xie, J.S. Tse, T. Cui, A.R. Oganov, Z. He, Y. Ma, and G. Zou. Electronicand phonon instabilities in face-centered cubic alkali metals under pres-sure studied using ab initio calculations. Phys. Rev. B, 75:064102, 2007.110
[122] U. Eberle, G. Arnold, and R. von Helmolt. Hydrogen storage in metal-hydrogen systems and their derivatives. J. Power Sources, 154:456, 2006.113
172

BIBLIOGRAPHY
[123] W. Grochala and P.P. Edwards. Thermal decomposition of the non-interstitial hydrides for the storage and production of hydrogen. Chem.Rev., 104:1283, 2004. 113
[124] F. Schüth, B. Bogdanovic, and M. Felderhoff. Light metal hydrides andcomplex hydrides for hydrogen storage. Chem. Commun., 20:2249, 2004.113
[125] S.V. Alapati, J.K. Johnson, and D.S. Sholl. Predicting reaction equilibria fordestabilized metal hydride decomposition reactions for reversible hydro-gen storage. J. Phys. Chem. C, 111:1584, 2007. 113
[126] R. Janot, F. Cuevas, M. Latroche, and A. Percheron-Guégan. Influenceof crystallinity on the structural and hydrogenation properties of Mg2Xphases (X=Ni, Si, Ge, Sn). Intermetallics, 14:163, 2006. 113, 114
[127] O. Friedrichs, T. Klassen, J.C. Sánchez-López, R. Bormann, and A. Fernán-dez. Hydrogen sorption improvement of nanocrystalline MgH2 by Nb2O5nanoparticles. Scripta Mater., 54:1293, 2006. 114, 129
[128] T. Serikawa, M. Henmi, T. Yamaguchi, H. Oginuma, and K. Kondoh. De-positions and microstructures of Mg-Si thin film by ion beam sputtering.Surf. Coat. Tech., 200:4233, 2006. 126
[129] K. Yoshimura, S. Nakano, S. Uchinashi, S. Yamaura, H. Kimura, and A. In-oue. A hydrogen sensor based on Mg-Pd alloy thin film. Meas. Sci. Technol.,18(11):3335, 2007. 126
[130] B. Clemens. Thermodynamically tuned nanophase materials for reversiblehydrogen storage: Structure and kinetics of nanoparticle and model sys-tem materials. DOE Annual Progress Report IV.A.4L, Stanford Univer-sity, 2006. http://www.hydrogen.energy.gov/pdfs/progress06/iv_a_
4l_clemens.pdf. 127
[131] M.J. Puska and R.M. Nieminen. Theory of positrons in solids and on solidsurfaces. Rev. Mod. Phys., 66:841, 1994. 127
[132] S. Jin, J. Shim, Y.W. Cho, and K. Yi. Dehydrogenation and hydrogenationcharacteristics of MgH2 with transition metal fluorides. J. Power Sources,172:859, 2007. 129
[133] L. Ma, P. Wang, and H. Cheng. Improving hydrogen sorption kinetics ofMgH2 by mechanical milling with TiF3. J. Alloy. Compd., 432:LI, 2007. 129,132, 135
173

BIBLIOGRAPHY
[134] N. Recham, V.V. Bhat, M. Kandavel, L. Aymard, J.-M.Tarascon, andA. Rougier. Reduction of hydrogen desorption temperature of ball-milledMgH2 by NbF5 addition. J. Alloy. Compd., 464:377, 2008. 129
[135] L. Xie, Y. Liu, Y.T. Wang, J. Zheng, and X.G. Li. Superior hydrogen storagekinetics of MgH2 nanoparticles doped with TiF3. Acta Mater., 55:4585, 2007.129
[136] F.H. Ellinger, C.E. Holley, B.B. McInteer, D. Pavone, R.M. Potter, E. Star-itzky, and W.H. Zachariasen. The preparation and some properties ofMagnesium Hydride. J. Am. Chem. Soc., 77:2647, 1955. 130, 140
[137] G. Vidal-Valat, J.-P. Vidal, C.M.E. Zeyen, and K. Kurki-Suonio. Neu-tron diffraction study of Magnesium Fluoride single crystals. Acta Mater.,B35:1584, 1979. 130, 140
[138] S. Fukada and M. Nishikawa. Semi-emprical equations for pressure-composition-temperature curves of the Ti-H system. J. Alloy. Compd.,209:L23, 1994. 135
[139] U. Stuhr, D. Steinbinder, H. Wipf, and B. Frick. Hydrogen diffusion inf.c.c. TiHx and YHx: Two distinct examples for diffusion in a concentratedlattice gas. J. Alloy. Compd., 310:190, 2000. 137
[140] H. Wipf, B. Kappesser, and R. Werner. Hydrogen diffusion in titaniumand zirconium hydrides. J. Alloy. Compd., 310:190, 2000. 137
[141] M. Wagemaker, A.P.M. Kentgens, and F.M. Mulder. Lithium transport forequilibrium between nano-crystalline phases in intercalated TiO2 anatase.Nature, 418:397, 2002. 138
174


List of publications
• S.Singh, S.W.H. Eijt, and F.M. Mulder, Grain refinement and deu-terium vacancies in TiF3-catalyzed MgD2, in preparation.
• S.Singh, S.W.H. Eijt, Hydrogen vacancies facilitate hydrogen trans-port kinetics in sodium hydride nano-crystallites, Phys. Rev. B,78(22):224110, 2008.
• S.W.H. Eijt, R. Kind, S. Singh, H. Schut, and W.J. Legerstee, R.W.A.Hendrikx, V.L. Svetchnikov, R.J. Westerwaal and B. Dam, Positrondepth profiling of the structural and electronic structure transfor-mations of hydrogenated Mg-based thin films, J. Appl. Phys., 105(3):043514, 2009.
• S. Singh, S.W.H. Eijt, J. Huot, W.A. Kockelmann, M. Wagemaker,and F.M. Mulder, The TiCl3 catalyst in NaAlH4 for hydrogen stor-age induces grain refinement and impacts on hydrogen vacancy for-mation, Acta Mater., 55:5549, 2007.
• S. Singh, S.W.H. Eijt, M.W. Zandbergen, W.J. Legerstee, and V.L.Svetchnikov, Nanoscale structure and the hydrogenation ofPd-capped Magnesium thin films prepared by plasma sputter andpulsed laser deposition, J. Alloy. Compd., 441:344, 2007.
177


About the author
Sarita was born on May 22, 1979 in Haridwar, India. From 1994to 1997, she attended secondary school at Vidya Mandir InterCollege, Haridwar. In 1997, she moved to Chandigarh to study
pharmacy at the Government Polytechnic for Women, which she com-pleted with honors in 1999. To pursue her interest in science, she joinedthe Government College for Girls of Panjab University in 1999, and grad-uated in 2002 with a Bachelor of Science degree. Starting from 2002, shestudied at Indian Institute of Technology Madras, and received a Masterof Science (MSc) degree in Physics in 2004. The MSc thesis was entitledHydrogen Absorption and Diffusion Studies in Ti0.1Zr0.9CrFe0.5Ni0.5.She attended a summer program in physics at Raman Research Institutein Bangalore from May to June 2003. There, she conducted a project onlunar occultation with Prof. Dr. C.R. Subhramanyam at the departmentof Astronomy and Astrophysics.
As a visiting scientist, Sarita conducted research in Prof. Dr. H. Züch-ner’s group at “Institut für Physikalische Chemie” within the InternationalGraduate School of Chemistry in Münster for the period of October 2004to December 2004. In March 2005, she joined the department of Radia-tion, Reactors & Radionuclides at Delft University of Technology as a PhDresearcher. This thesis is a documentation of the research she performedunder the guidance of Dr. S.W.H. Eijt and Prof. Dr. F.M. Mulder.
179

The global energy issues can be solved by the abundantly available hydrogen on earth. Light metals are a compact and safe medium for storing hydrogen. This makes them attrac-tive for vehicular use. Unfortunately, hydrogen uptake and release is slow in light metals at practical temperature and pressure conditions. Catalysts are known to accelerate both processes. This book presents three mechanisms for catalyst actions: as grain refining agents, as a hydrogen vacancy for-mation facilitator, and (in its conventional role) as a hydrogen molecule splitter. Moreover, plentiful hydrogen vacancies are reported from experimental observations in nano-structured light metal hydrides. For specific storage systems, guidelines to select the optimal catalyst are developed based on the exploitable mechanisms.
Hydrogen Storagein
Nanostructured Light Metal Hydrides
Hydrogen Storage in N
anostructured Light Metal H
ydrides
by
Sarita Singh
S. Singh
ISBN 978 90 902 4112 8