hydrogen financial analysis scenario tool (h2fast) · 2015-06-23 · hydrogen financial analysis...
TRANSCRIPT

NREL is a national laboratory of the U.S. Department of Energy, Office of Energy Efficiency and Renewable Energy, operated by the Alliance for Sustainable Energy, LLC.
Hydrogen Financial Analysis Scenario Tool (H2FAST)
Marc Melaina, Ph.D. Team Lead for Infrastructure Analysis Transportation and Hydrogen Systems Center, NREL
H2FAST Team: Brian Bush, Melanie Caton, Jon Duckworth, Dan Getman, Sara Havig, Marc Melaina, Michael Penev
HTAC Meeting – April 21-22, 2015 Arlington, Virginia
NREL/PR-5400-64138

Overview
• Hydrogen Financial Analysis Simulation Tool (H2FAST) • H2FAST is a standard financial accounting framework applied
to the DOE’s H2A cost analysis models • There are three ways H2FAST has been implemented: H2FAST: Web H2FAST: Excel
– The Excel spreadsheet is downloaded from the website, and provides more detailed inputs and capabilities for a more advanced end-user
H2FAST: BCS (Business Case Scenario tool) – Full supply chain results are currently being used internally by the
H2USA IFWG for scenario exploration (using SERA model outputs) – This presentation shows one visualization option for BCS
HTAC – April 21-22, 2015 2
H2FAST Web
H2FAST Excel
BCS Vis
Melaina, NREL
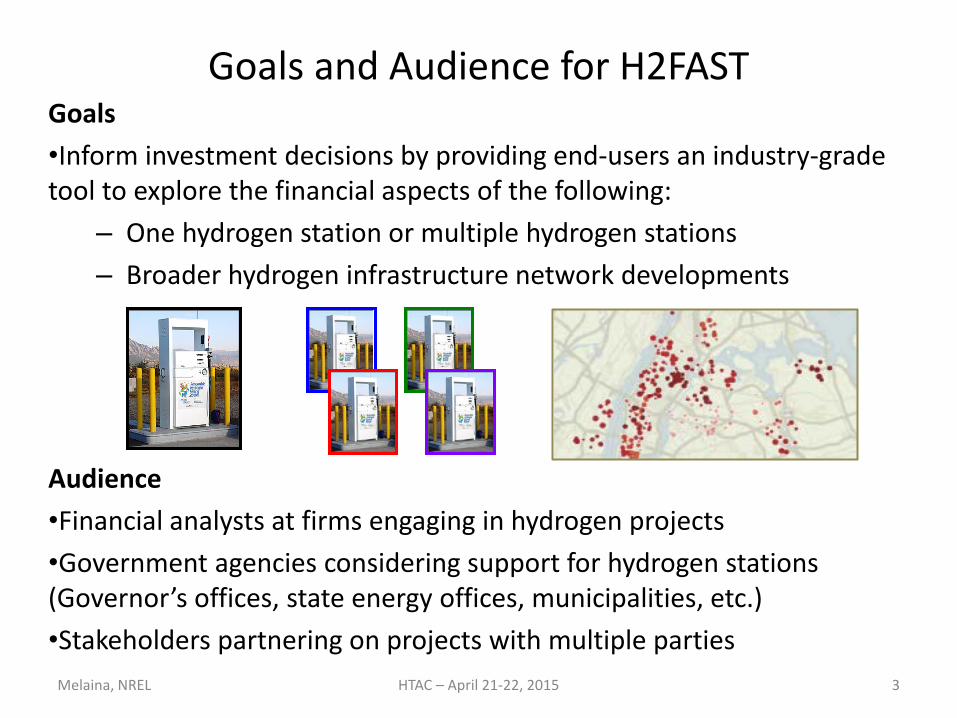
Goals and Audience for H2FAST Goals •Inform investment decisions by providing end-users an industry-grade tool to explore the financial aspects of the following:
– One hydrogen station or multiple hydrogen stations – Broader hydrogen infrastructure network developments
Audience •Financial analysts at firms engaging in hydrogen projects •Government agencies considering support for hydrogen stations (Governor’s offices, state energy offices, municipalities, etc.) •Stakeholders partnering on projects with multiple parties
HTAC – April 21-22, 2015 3 Melaina, NREL

What does H2FAST do? How does it work?
• H2FAST builds upon the DOE H2A discounted cash flow framework, with more extensive post-processing to report on a range of financial performance metrics of interest to investors.
• H2FAST calculations conform to generally accepted accounting practices (GAAP) and use either default values or user inputs.
HTAC – April 21-22, 2015 4 Melaina, NREL
H2FAST provides a quick and convenient in-depth financial analysis for hydrogen stations
H2A Discounted Cash Flow Framework
A business sector end-user will have less time to access relevant financial information than a typical H2A model end-user
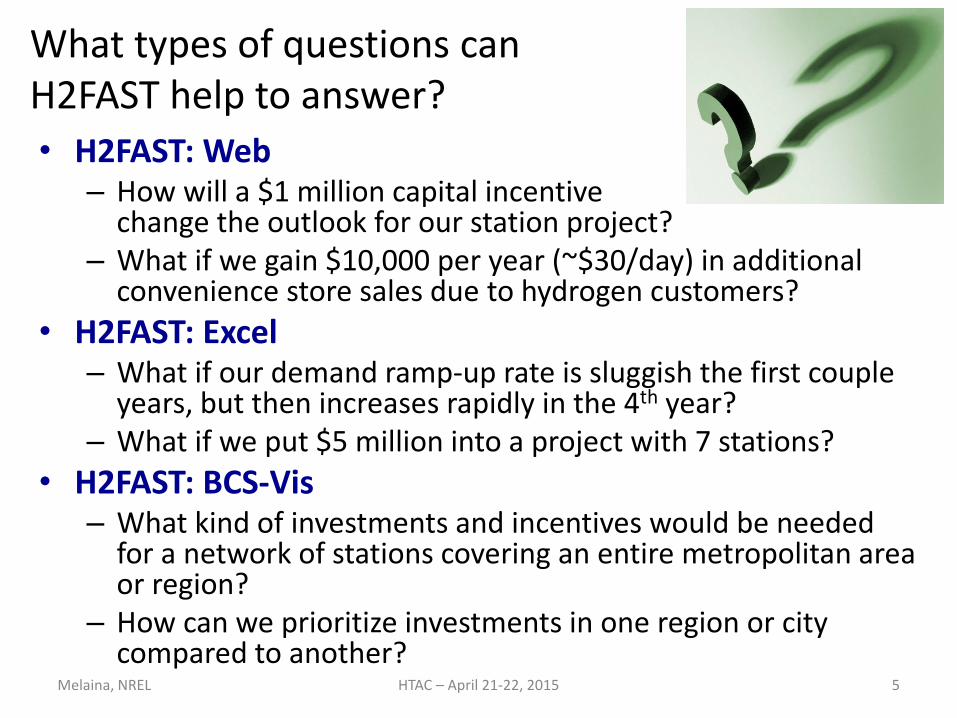
What types of questions can H2FAST help to answer? • H2FAST: Web
– How will a $1 million capital incentive change the outlook for our station project?
– What if we gain $10,000 per year (~$30/day) in additional convenience store sales due to hydrogen customers?
• H2FAST: Excel – What if our demand ramp-up rate is sluggish the first couple
years, but then increases rapidly in the 4th year? – What if we put $5 million into a project with 7 stations?
• H2FAST: BCS-Vis – What kind of investments and incentives would be needed
for a network of stations covering an entire metropolitan area or region?
– How can we prioritize investments in one region or city compared to another?
Melaina, NREL HTAC – April 21-22, 2015 5

H2FAST WEB
HTAC – April 21-22, 2015 6 Melaina, NREL
H2FAST Web

H2FAST Screenshot
HTAC – April 21-22, 2015 7
Introductory Language
Inputs
Graphical Outputs (1)
Graphical Outputs (2)
H2FAST Web
Single Value Results
Links to Download Spreadsheet Version
Reset Inputs
Download full financials for case
Embed widget
Melaina, NREL
Change Graphical Output metrics
H2FAST Website: www.nrel.gov/hydrogen/h2fast/

List of H2FAST Web Inputs
• Inputs values can be changed with cell entries or sliders • Graphed results update automatically at right
Station Inputs Utilization (%) or Vehicles Refills (per day) Hydrogen per Refill (kg) Hydrogen Price ($/kg) Total Capacity (kg/day) Total Capital Cost ($) Total Installation Cost ($) O&M Cost ($/yr) Financing Inputs Debt Interest Rate (%) Min Debt/Equity Ratio
HTAC – April 21-22, 2015 8
H2FAST Web
Scenario Inputs Capital Incentive ($/stn) Initial Production
Incentive ($/stn) Annual Decrement of
Production Incentive ($/stn)
Incidental Revenue ($/yr) Cost of Delivered
Hydrogen ($/kg) Cost of Electricity
($/kWh)
Melaina, NREL
Many other inputs and outputs are possible. This set of inputs and outputs has been reviewed by the H2USA IFWG and other reviewers.
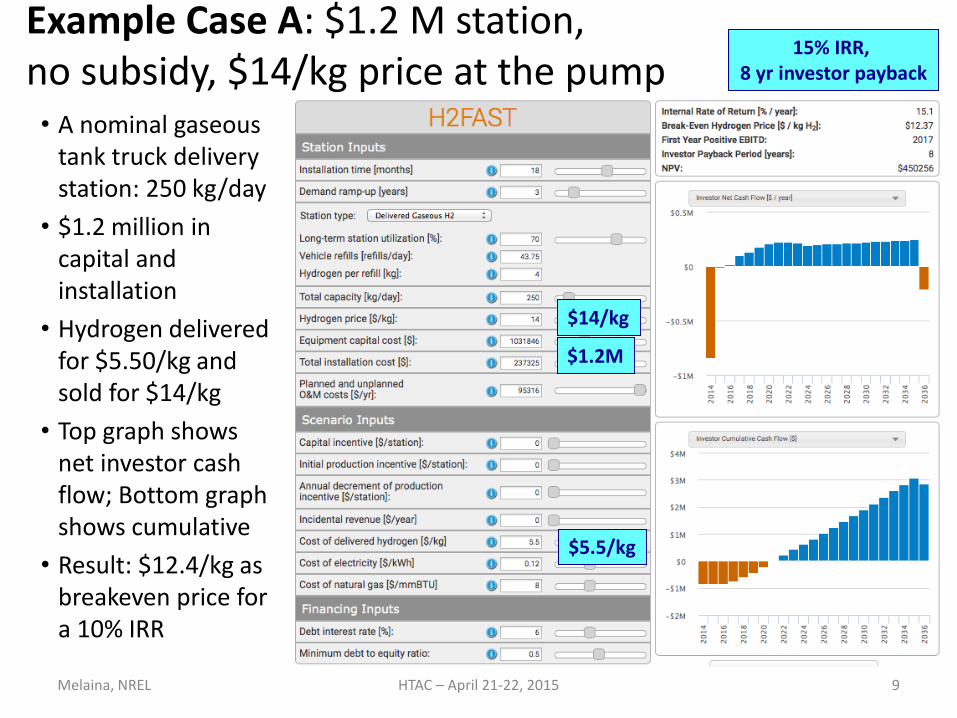
Example Case A: $1.2 M station, no subsidy, $14/kg price at the pump • A nominal gaseous
tank truck delivery station: 250 kg/day
• $1.2 million in capital and installation
• Hydrogen delivered for $5.50/kg and sold for $14/kg
• Top graph shows net investor cash flow; Bottom graph shows cumulative
• Result: $12.4/kg as breakeven price for a 10% IRR
Melaina, NREL HTAC – April 21-22, 2015 9
$1.2M
$5.5/kg
15% IRR, 8 yr investor payback
$14/kg
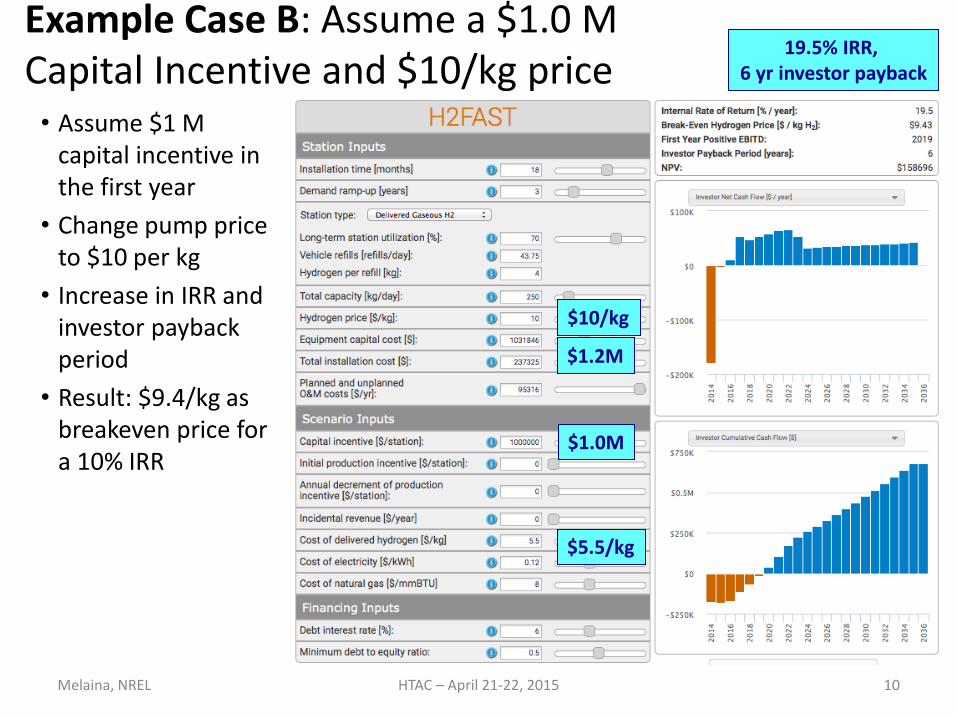
Example Case B: Assume a $1.0 M Capital Incentive and $10/kg price • Assume $1 M
capital incentive in the first year
• Change pump price to $10 per kg
• Increase in IRR and investor payback period
• Result: $9.4/kg as breakeven price for a 10% IRR
Melaina, NREL HTAC – April 21-22, 2015 10
19.5% IRR, 6 yr investor payback
$1.2M
$5.5/kg
$10/kg
$1.0M
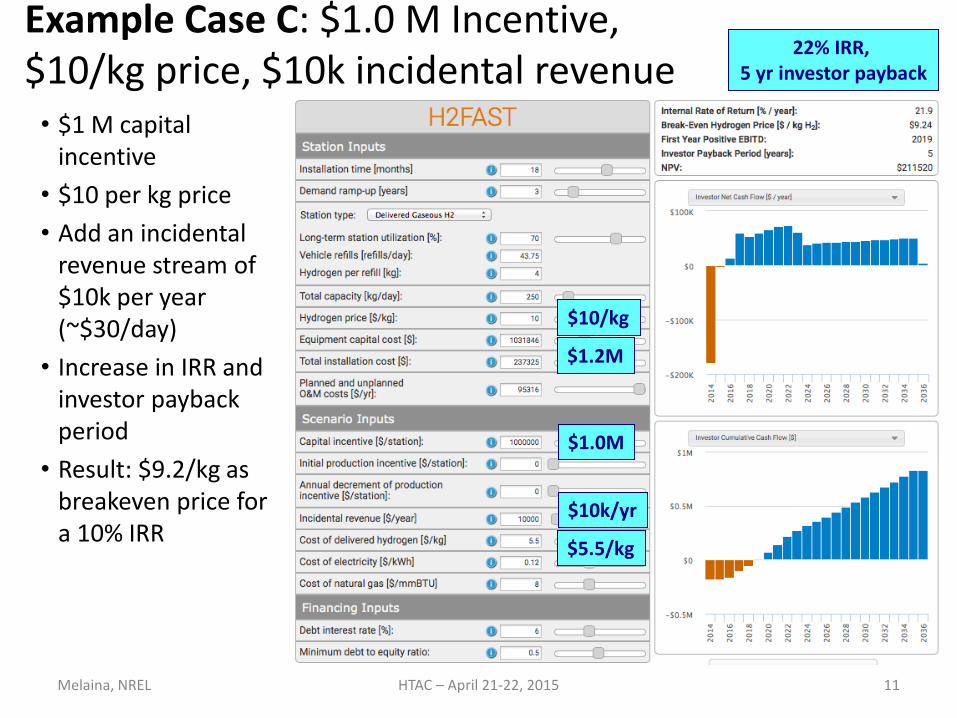
Example Case C: $1.0 M Incentive, $10/kg price, $10k incidental revenue • $1 M capital
incentive • $10 per kg price • Add an incidental
revenue stream of $10k per year (~$30/day)
• Increase in IRR and investor payback period
• Result: $9.2/kg as breakeven price for a 10% IRR
Melaina, NREL HTAC – April 21-22, 2015 11
22% IRR, 5 yr investor payback
$1.2M
$5.5/kg
$10/kg
$1.0M
$10k/yr

H2FAST EXCEL
HTAC – April 21-22, 2015 12
H2FAST Excel
Melaina, NREL
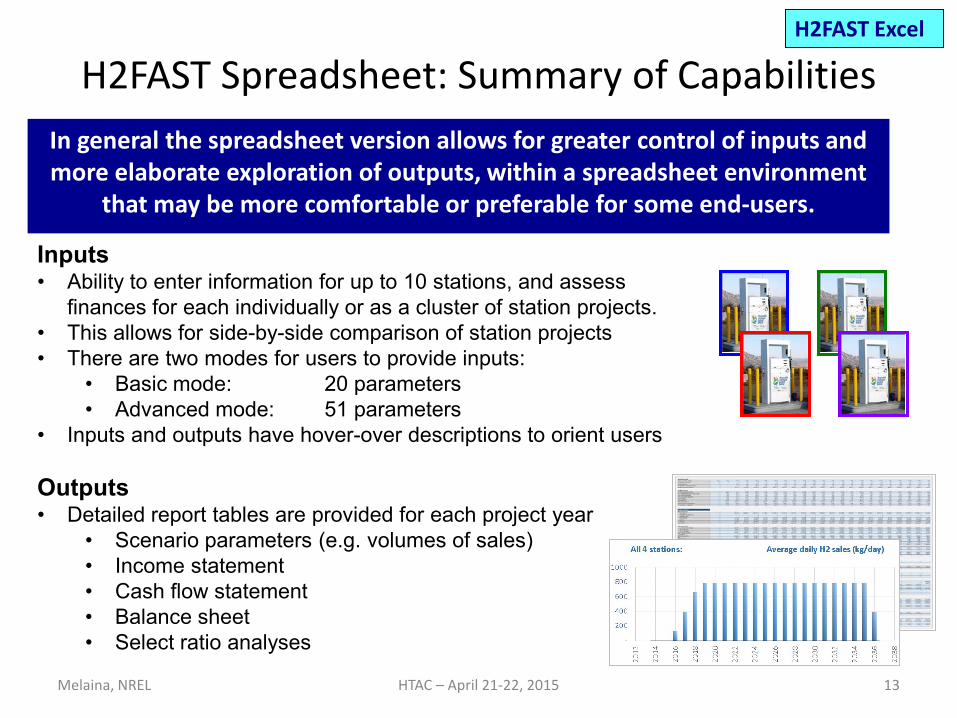
H2FAST Spreadsheet: Summary of Capabilities In general the spreadsheet version allows for greater control of inputs and more elaborate exploration of outputs, within a spreadsheet environment that may be more comfortable or preferable for some end-users. Inputs • Ability to enter information for up to 10 stations, and assess
finances for each individually or as a cluster of station projects. • This allows for side-by-side comparison of station projects • There are two modes for users to provide inputs:
• Basic mode: 20 parameters • Advanced mode: 51 parameters
• Inputs and outputs have hover-over descriptions to orient users Outputs • Detailed report tables are provided for each project year
• Scenario parameters (e.g. volumes of sales) • Income statement • Cash flow statement • Balance sheet • Select ratio analyses
HTAC – April 21-22, 2015 13
H2FAST Excel
Melaina, NREL
In general the spreadsheet version allows for greater control of inputs and more elaborate exploration of outputs, within a spreadsheet environment
that may be more comfortable or preferable for some end-users.

H2FAST Excel Interface Basic Interface
Detailed graphical display Station costs specifications Revenues, cost breakdown Financial specifications General outputs Graphical display selector Mode & stations toggles
Basic user inputsAdvanced user inputsCalculated valuesKey results
HTAC – April 21-22, 2015 14
H2FAST Excel
Melaina, NREL
H2FAST: BUSINESS CASE SCENARIO TOOL (BCS)
HTAC – April 21-22, 2015 15
BCS Vis
Melaina, NREL
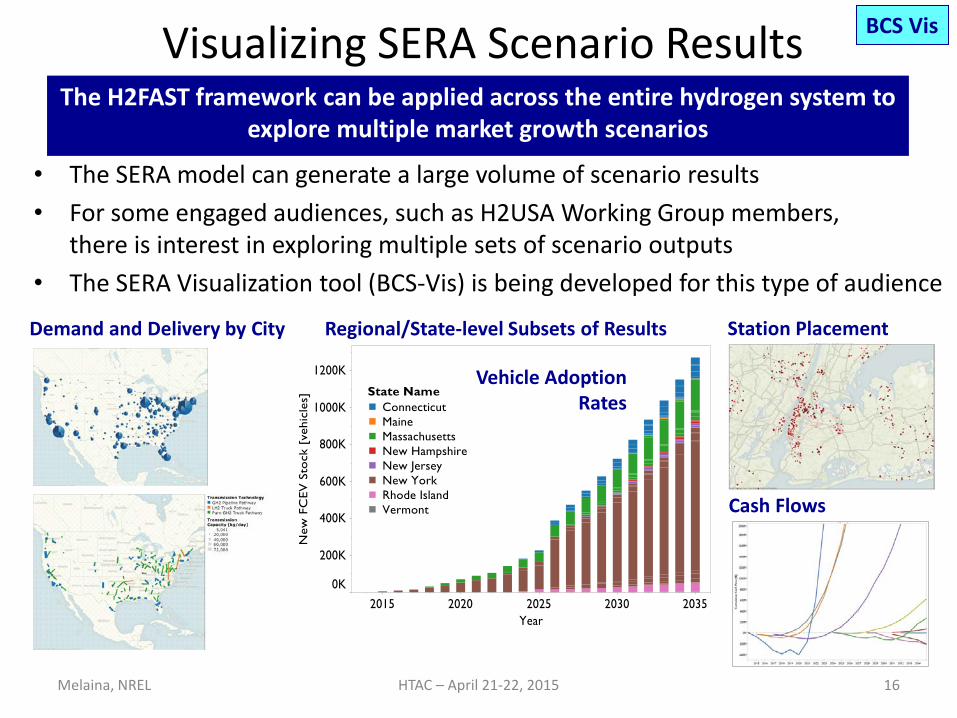
Visualizing SERA Scenario Results
• The SERA model can generate a large volume of scenario results • For some engaged audiences, such as H2USA Working Group members,
there is interest in exploring multiple sets of scenario outputs • The SERA Visualization tool (BCS-Vis) is being developed for this type of audience
Demand and Delivery by City Regional/State-level Subsets of Results Station Placement
BCS Vis
HTAC – April 21-22, 2015 Melaina, NREL
The H2FAST framework can be applied across the entire hydrogen system to explore multiple market growth scenarios
Cash Flows
Vehicle Adoption Rates
16

SERA Visualization (Beta)
Launching the SERA Visualization
Launching the SERA Visualization
Select the scenario and the modeled data of interest
Slider changes the modeled year and updates the map and chart
BCS Vis
HTAC – April 21-22, 2015 17 Melaina, NREL
This 4-min video demonstrates this visualization tool: http://youtu.be/J7y51c-dldo
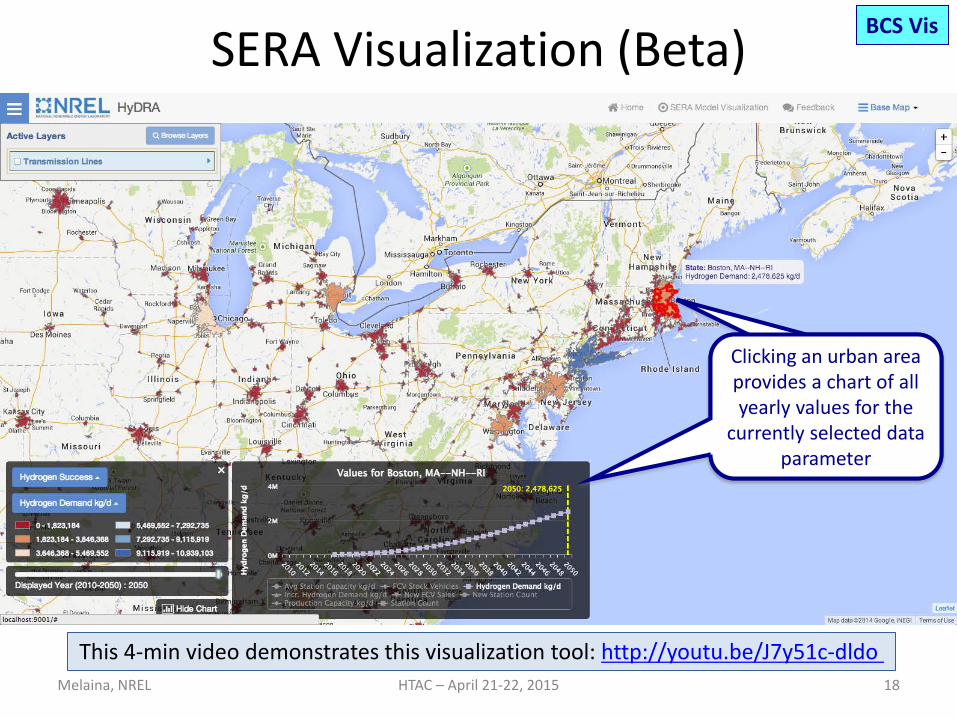
SERA Visualization (Beta)
Clicking an urban area provides a chart of all yearly values for the
currently selected data parameter
Clicking an urban area provides a chart of all yearly values for the
currently selected data parameter
BCS Vis
HTAC – April 21-22, 2015 18 Melaina, NREL
This 4-min video demonstrates this visualization tool: http://youtu.be/J7y51c-dldo

Summary
• The H2FAST Web and Spreadsheet tools are an effective means of informing investment decisions on hydrogen station projects – Developed for end-users requiring a simple, first-cut analysis
(web version) as well as more detailed and elaborate analyses (spreadsheet version)
• The H2FAST framework can also be applied to the entire hydrogen fuel supply chain to evaluate the financial implications of infrastructure development at the city, region, or national levels – This framework is currently being used internally to inform
H2USA IFWG members in scenario exploration – A beta version of a visualization tool has been developed to
allow access to these multivariate results to a broader audience
HTAC – April 21-22, 2015 19 Melaina, NREL

QUESTIONS?
HTAC – April 21-22, 2015 20 Melaina, NREL

BACKUP SLIDES
HTAC – April 21-22, 2015 21 Melaina, NREL

Basic Interface 1 station
station 1 analysis
Example Toggles
HTAC – April 21-22, 2015 22
H2FAST Excel
Melaina, NREL

Advanced Interface 1 station
station 1 analysis
Example Toggles
HTAC – April 21-22, 2015 23
H2FAST Excel
Melaina, NREL
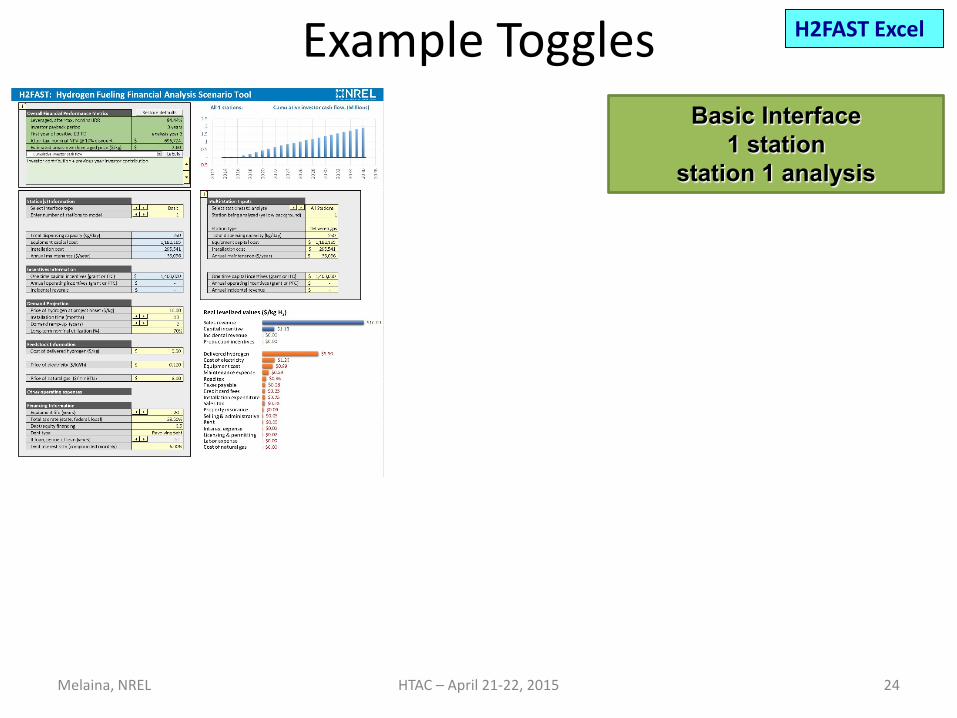
Basic Interface 1 station
station 1 analysis
Example Toggles
HTAC – April 21-22, 2015 24
H2FAST Excel
Melaina, NREL
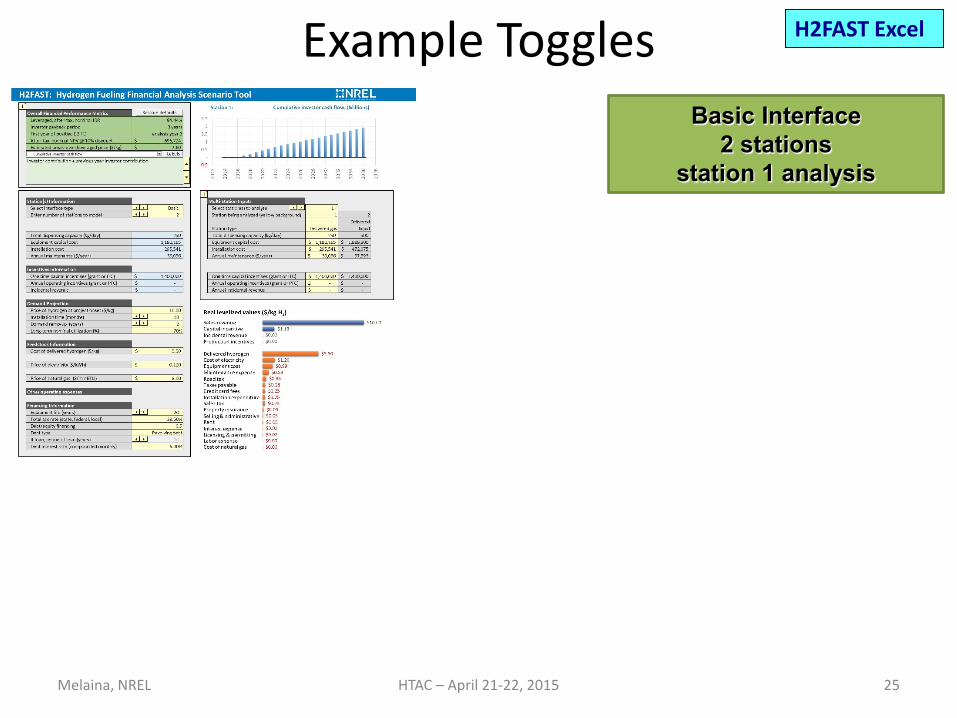
Basic Interface 2 stations
station 1 analysis
Example Toggles
HTAC – April 21-22, 2015 25
H2FAST Excel
Melaina, NREL

Basic Interface 3 stations
station 1 analysis
Example Toggles
HTAC – April 21-22, 2015 26
H2FAST Excel
Melaina, NREL
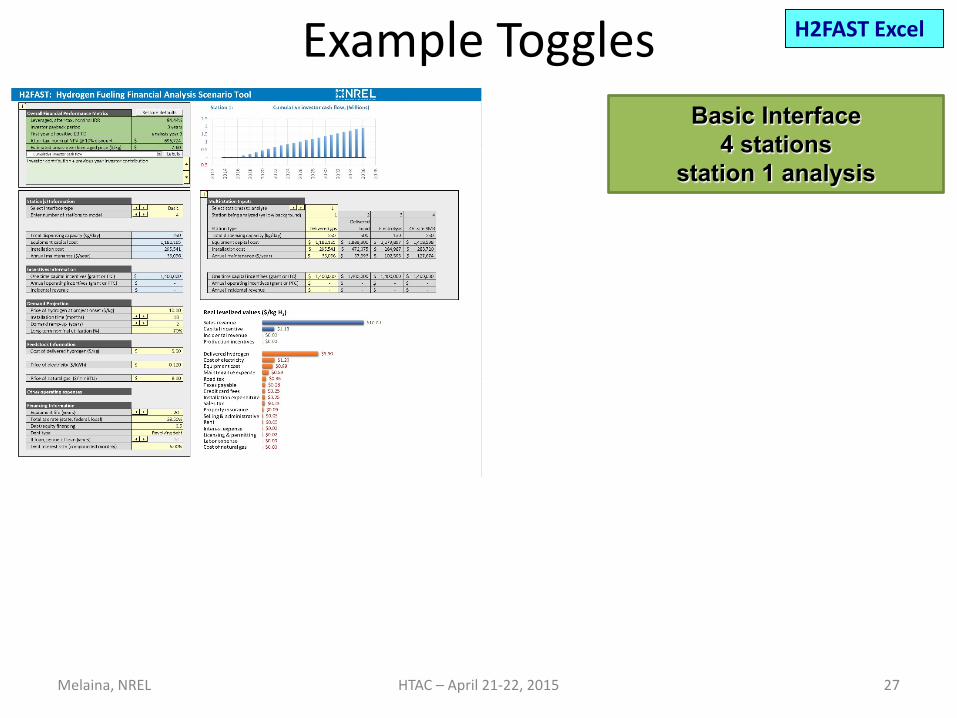
Basic Interface 4 stations
station 1 analysis
Example Toggles
HTAC – April 21-22, 2015 27
H2FAST Excel
Melaina, NREL

Basic Interface 4 stations
station 2 analysis
Example Toggles
HTAC – April 21-22, 2015 28
H2FAST Excel
Melaina, NREL

Basic Interface 4 stations
station 3 analysis
Example Toggles
HTAC – April 21-22, 2015 29
H2FAST Excel
Melaina, NREL

Basic Interface 4 stations
station 4 analysis
Example Toggles
HTAC – April 21-22, 2015 30
H2FAST Excel
Melaina, NREL
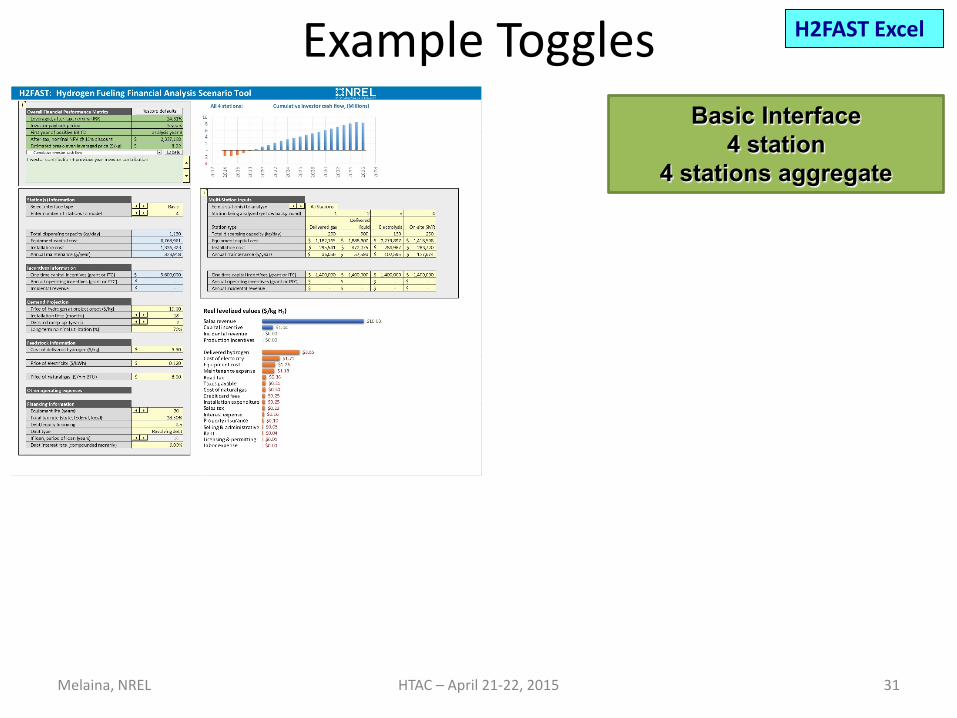
Basic Interface 4 station
4 stations aggregate
Example Toggles
HTAC – April 21-22, 2015 31
H2FAST Excel
Melaina, NREL
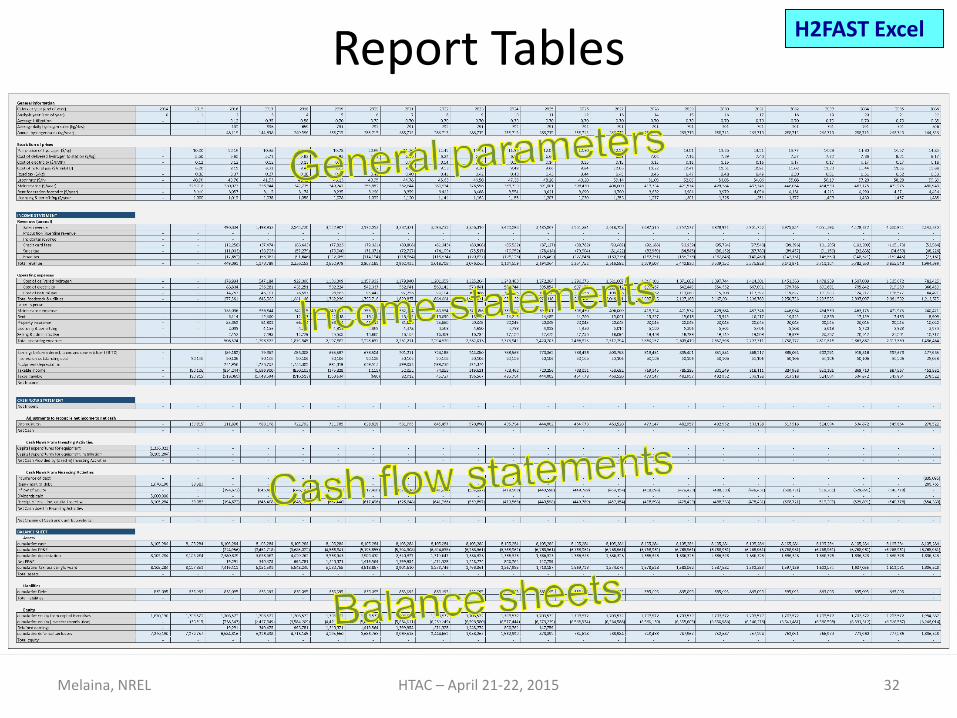
Report Tables
HTAC – April 21-22, 2015 32
H2FAST Excel
Melaina, NREL
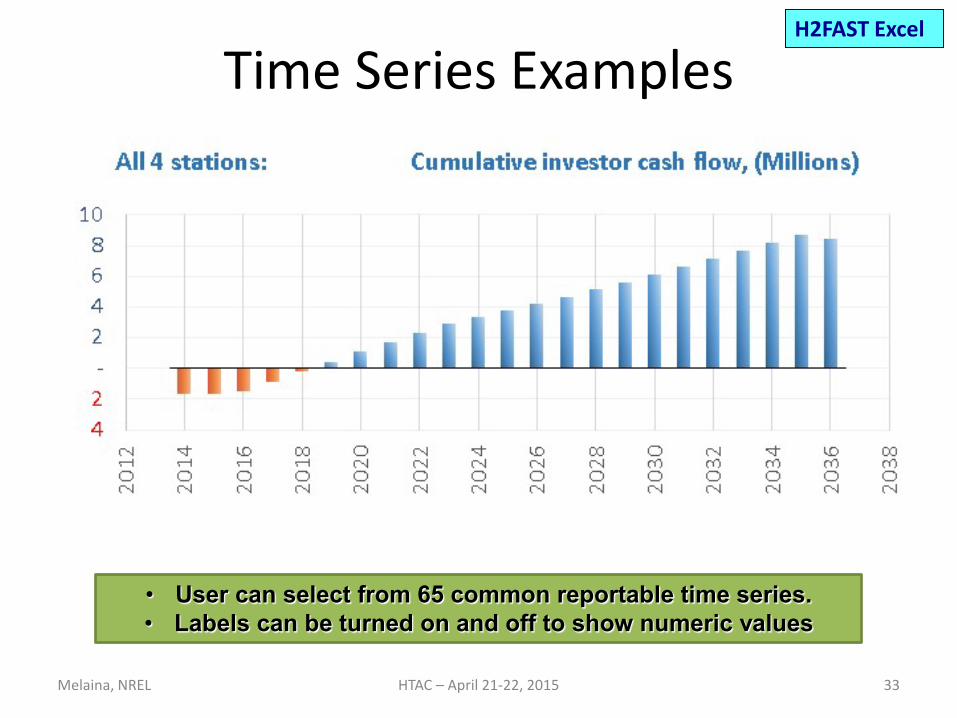
Time Series Examples
• User can select from 65 common reportable time series. • Labels can be turned on and off to show numeric values
HTAC – April 21-22, 2015 33
H2FAST Excel
Melaina, NREL