hydrodynamics of floodplain wetlands in a chalk catchment: the river lambourn, uk
TRANSCRIPT
Hydrodynamics of floodplain wetlands in a chalk
catchment: The River Lambourn, UK
T.R. Grapes, C. Bradley*, G.E. Petts
School of Geography, Earth and Environmental Sciences, University of Birmingham, Edgbaston, Birmingham B15 2TT, UK
Received 10 May 2005; revised 23 May 2005
Abstract
Variations in floodplain channel water levels and valley floor groundwater levels (measured in piezometers and boreholes)
are examined at selected points along the course of the River Lambourn, a chalk river in southern England. A local alluvial
gravel aquifer in the valley bottom is associated with numerous small wetlands that extend over much of the river’s perennial
profile. Variations in hydraulic gradient between local borehole levels and/or floodplain channel water levels are described for
three sites in the seasonal section of the channel at Bockhampton, East Garston and West Shefford. The results indicate that
observed groundwater levels are closely associated with flows from discrete springs at the margins of the channel and
floodplain. However, as the floodplain widens and the alluvial gravel aquifer increases in size, the gravel aquifer accounts for a
substantial down-valley component of groundwater flow with a diffuse vertical water flux. In the lower catchment, the exchange
of flows between the gravel aquifer and the river enables some attenuation of floodplain water-table variability, providing a
stable hydrological regime for valley-bottom wetlands. Catchment controls upon the local, valley-bottom, wetland regime are
demonstrated with the application of a simple groundwater model developed using MODFLOW. The model is used to simulate
groundwater discharge to the river in the upper and lower catchment, in addition to the water level regime at selected points in
the valley bottom in the lower catchment. The results demonstrate the importance of taking catchment-scale water flow into
account when managing isolated wetlands in a permeable catchment.
q 2005 Elsevier B.V. All rights reserved.
Keywords: Floodplain wetland; Wetland hydrology; MODFLOW; Groundwater hydrology
1. Introduction
Wetlands are characterised by considerable
differences in terms of their water budget and
pattern of water-table variation, which reflect
0022-1694/$ - see front matter q 2005 Elsevier B.V. All rights reserved.
doi:10.1016/j.jhydrol.2005.07.028
* Corresponding author. Tel.: C44 121 414 8097; fax: C44 121
414 5528.
E-mail address: [email protected] (C. Bradley).
the spatial and temporal variations in water flows
to and from the wetland, as well as the extent of
water redistribution through the wetland (Mitsch and
Gosselink, 2000). There is a clear need to define
water budget components more accurately and to
identify controls on water redistribution in order to
improve our understanding of floodplain wetland
hydrology. Derivation of the wetland water budget
requires identification and characterisation of
Journal of Hydrology 320 (2006) 324–341
www.elsevier.com/locate/jhydrol
T.R. Grapes et al. / Journal of Hydrology 320 (2006) 324–341 325
the discrete water inflows and outflows, and together
these determine water availability (e.g. Gilman,
1994) and wetland hydrochemistry (Wassen et al.,
2002), which enable different wetland types to be
distinguished, ranging from acid fen/bog fed solely
by precipitation to a calcareous fen where ground-
water discharge occurs. Meanwhile, the dynamics of
water-table variation may reflect hydrometeorologi-
cal conditions (Bradley, 2002) with certain distinct
patterns indicating the predominance of one par-
ticular water source (Winter, 1999). For many
wetlands, groundwater represents an important
component of the water budget, albeit one that is
difficult to quantify accurately, especially given the
spatial and temporal variability of groundwater
inputs that a wetland may receive (e.g. Schot and
Wassen, 1993). To assess this component, a number
of studies have used groundwater models to estimate
sub-surface seepage (e.g. Gilvear et al., 1993; Hunt
et al., 1996; Weng et al., 2003). Successful model
applications require a good understanding of local
stratigraphy and regional hydrogeology and although
model verification may be problematic, the results
provide more robust estimates of groundwater
seepage than simply taking the residual of the
water balance equation.
Studies of groundwater–wetland interaction have,
for obvious reasons, largely focussed on discrete
wetlands, whose boundaries can be readily identified
in the field. However, even within such wetlands the
groundwater contribution may vary considerably
across the wetland area, as illustrated by Grieve
et al. (1995) on the Insh Marshes, located in the
valley of the River Spey in the Scottish Highlands.
Grieve et al. determined that groundwater discharge
represented the principal water source at the lateral
midpoint of the wetland (halfway between the river
channel and the valley margin), but groundwater
was far less significant at the edges of the wetland.
Moreover, studies in peat wetlands have demon-
strated that local variations in stratigraphy may lead
to significant variability in the direction of ground-
water flows (e.g. Drexler et al., 1999), which has
implications for the density of monitoring points
required to characterise subsurface flows adequately.
These difficulties are compounded when considering
less discrete wetlands, such as those found on the
floodplains of lowland rivers (Haslam, 2003) or
occurring as mires in shallow valleys. In these
environments, wetlands can extend over consider-
able longitudinal distances, following, for example,
a spring or seepage line in an area of groundwater
discharge. These wetlands are potentially vulnerable
to the impacts of groundwater abstraction, and in the
case of floodplain mires, to recurrent low flows, and
it is only possible to understand their hydrology in
the context of the regional or catchment ground-
water system. This is particularly important for
wetlands in permeable catchments such as those
underlain by chalk. Haria et al. (2003), for example,
have highlighted the relative lack of work on
shallow chalk groundwater systems, although they
are of evident importance in sustaining chalk
wetlands.
This paper considers the degree to which data
from a regional groundwater model, together with
local hydrological data, may be used to determine
spatial and temporal controls on wetlands along the
floodplain of the River Lambourn in central
southern England. The research is also applicable
more widely, to chalk stream ecosystems generally;
these being distinctive, groundwater-dependent,
lowland rivers found in North West Europe,
which are characterised by their stable discharge
regime and high nutrient concentration (Berrie,
1992).
The aims of the paper are:
† to identify the relationship between groundwater
levels and spring discharges in the catchment
headwaters;
† to investigate the hydrological controls on flood-
plain wetland water tables in a chalk valley;
† to illustrate the use of the results of catchment-
scale groundwater modelling to determine the
hydrodynamics of ‘local’ floodplain wetlands.
2. Study area: the River Lambourn, Berkshire, UK
This study was undertaken in the catchment of the
River Lambourn; a chalk stream that drains 234 km2 of
the West Berkshire Downs, a range of low hills in
central southern England at the western extremity of
the London Basin (Fig. 1). The seasonal head of
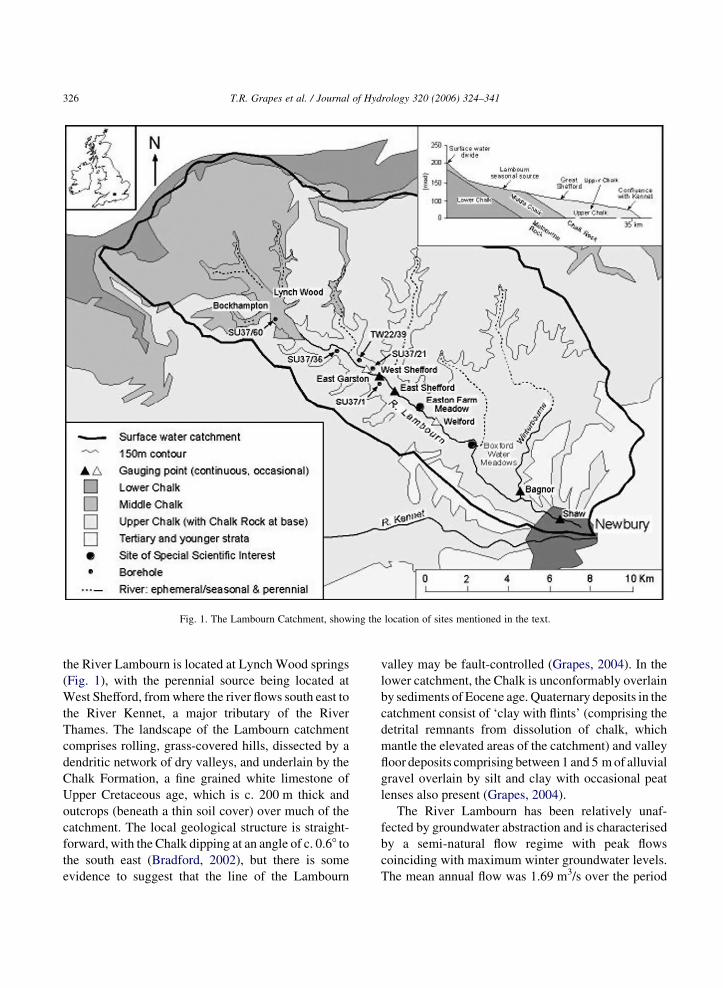
Fig. 1. The Lambourn Catchment, showing the location of sites mentioned in the text.
T.R. Grapes et al. / Journal of Hydrology 320 (2006) 324–341326
the River Lambourn is located at Lynch Wood springs
(Fig. 1), with the perennial source being located at
West Shefford, fromwhere the river flows south east to
the River Kennet, a major tributary of the River
Thames. The landscape of the Lambourn catchment
comprises rolling, grass-covered hills, dissected by a
dendritic network of dry valleys, and underlain by the
Chalk Formation, a fine grained white limestone of
Upper Cretaceous age, which is c. 200 m thick and
outcrops (beneath a thin soil cover) over much of the
catchment. The local geological structure is straight-
forward, with the Chalk dipping at an angle of c. 0.68 to
the south east (Bradford, 2002), but there is some
evidence to suggest that the line of the Lambourn
valley may be fault-controlled (Grapes, 2004). In the
lower catchment, the Chalk is unconformably overlain
by sediments of Eocene age. Quaternary deposits in the
catchment consist of ‘clay with flints’ (comprising the
detrital remnants from dissolution of chalk, which
mantle the elevated areas of the catchment) and valley
floor deposits comprising between 1 and 5 mof alluvial
gravel overlain by silt and clay with occasional peat
lenses also present (Grapes, 2004).
The River Lambourn has been relatively unaf-
fected by groundwater abstraction and is characterised
by a semi-natural flow regime with peak flows
coinciding with maximum winter groundwater levels.
The mean annual flow was 1.69 m3/s over the period
T.R. Grapes et al. / Journal of Hydrology 320 (2006) 324–341 327
1962–2000 (NRFA, 2001), with a base flow index of
0.96 (Gustard et al., 1992). The river was notified as a
Site of Special Scientific Interest1 in 1995 as an
example of a lowland chalk river; and it displays
classic winterbourne behaviour in that an upper
section of the river is non-perennial, but carries
significant flow only during the winter months as the
drainage net varies seasonally in relation to ground-
water levels. Several sites along the floodplain of the
River Lambourn (together with that of the River
Kennet in to which it drains) have been notified
separately as SSSIs, including Boxford Water
Meadows and Easton Farm Meadow (Fig. 1). Both
sites comprise small meadows/flood pastures with
calcareous alluvial gley soils. Easton Meadow
exemplifies a Cynosurus cristatus–Caltha palustris
plant community, with Boxford also having a Carex
acutiformis swamp and fen community. Both sites
would traditionally have been managed, with con-
trolled flooding in spring each year to encourage
vegetation growth. This type of habitat is becoming
increasingly rare as many sites in southern England
have been affected by groundwater abstraction,
despite recognition that these wetlands have a
demonstrable positive influence on catchment water
quality (Prior and Johnes, 2002).
An extensive instrumentation network was
installed in the Lambourn and other surrounding
catchments between 1962 and 1974 as part of the
West Berkshire Groundwater Scheme (Owen, 1981),
in which groundwater abstraction was intended to
augment river flows. The augmentation system,
comprising large abstraction boreholes and associated
pipelines, has only been used very occasionally since
its completion in 1976. Gauging weirs were con-
structed at East Shefford, Welford and Shaw; and on
the Winterbourne Stream at Bagnor (Fig. 1), and a
total of 43 abstraction boreholes and 67 observation
boreholes were drilled in the Lambourn and adjacent
Pang catchments between 1967 and 1974.
Analysis of discharge records from the four fixed
gauges in the catchment, supplemented by current-
meter surveys along 12 reaches, has revealed that
1 A Site of Special Scientific Interest (SSSI) is designated by
English Nature to provide legal protection for an area of recognised
conservation interest.
accretion along the River Lambourn displays a
marked spatial pattern. At a catchment-scale, mean
flow accretion is c. 0.09 m3/s/km, but high rates of
accretion are found in both upstream and downstream
channel sections, which are often associated with
intersections between the river valley and perpen-
dicular dry valleys (Grapes et al., in press). Generally,
the dynamics of groundwater flow accretion to the
river are affected by catchment topography, by the
existence of local (i.e. valley-floor) controls on
groundwater flow, and by seasonal changes in the
drainage net.
3. Riparian hydraulic gradients
Data from three sites along the main river:
Bockhampton, East Garston and West Shefford
(Fig. 1) are examined to determine the relationship
between local groundwater levels, river stage and
floodplain spring discharges. At these points,
measurements of channel-proximal groundwater
levels have been undertaken over the period 1993–
2001.
3.1. Bockhampton
The measurement site at Bockhampton is situated
1.6 km downstream of the seasonal source of the
River Lambourn at Lynch Wood springs, at a point
where the floodplain is c. 150 m wide. The site
comprises a 50 m deep observation borehole (refer-
ence number SU37/60), cased to a depth of 12 m,
which is located 20 m from the river channel. The
relationship between groundwater levels and periods
of discharge at Lynch Wood springs is shown in
Fig. 2A. The relative timing of seasonal increases in
groundwater level at this site demonstrates that these
are not simply a function of channel seepage, but that
they reflect catchment groundwater levels. The
maximum groundwater level observed over the period
is c. 121 m O.D. (metres above Ordnance Datum;
equivalent to sea level). At this groundwater level, the
hydraulic gradient (and the resultant groundwater
discharge) towards the river channel is sufficiently
large as to prevent any further increase in the local
water table. Low groundwater levels in 1990/1991,
1992/1993 and 1997 reflect low winter recharge, and
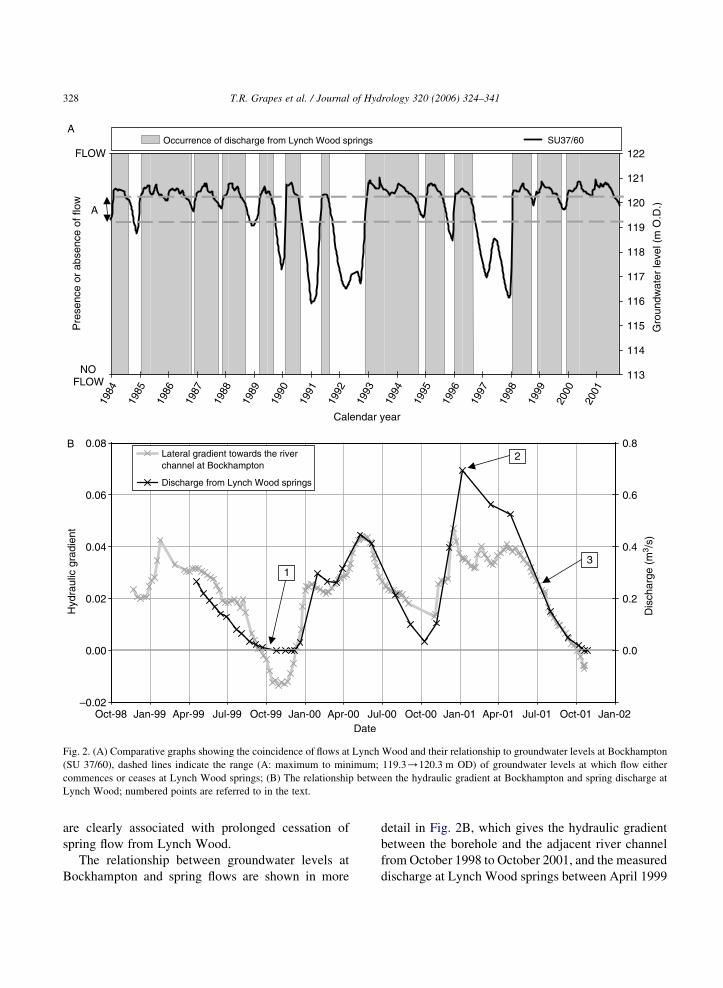
Fig. 2. (A) Comparative graphs showing the coincidence of flows at Lynch Wood and their relationship to groundwater levels at Bockhampton
(SU 37/60), dashed lines indicate the range (A: maximum to minimum; 119.3/120.3 m OD) of groundwater levels at which flow either
commences or ceases at Lynch Wood springs; (B) The relationship between the hydraulic gradient at Bockhampton and spring discharge at
Lynch Wood; numbered points are referred to in the text.
T.R. Grapes et al. / Journal of Hydrology 320 (2006) 324–341328
are clearly associated with prolonged cessation of
spring flow from Lynch Wood.
The relationship between groundwater levels at
Bockhampton and spring flows are shown in more
detail in Fig. 2B, which gives the hydraulic gradient
between the borehole and the adjacent river channel
from October 1998 to October 2001, and the measured
discharge at Lynch Wood springs between April 1999
T.R. Grapes et al. / Journal of Hydrology 320 (2006) 324–341 329
and October 2001. The hydraulic gradient varies
between K0.014 and 0.047, with a mean value of
0.023, while the spring discharge varies between 0
and 0.69 m3/s, with a mean value of 0.17 m3/s. The
similarities in the two data series indicate a common
dependence upon regional groundwater levels,
although there are some significant differences. For
example, the short period of zero discharge at Lynch
Wood springs occurring after October 1999 (point 1)
is associated with a period when the local ground-
water level at Bockhampton fell below the bed of the
adjacent channel, thereby producing a negative
gradient. Meanwhile, the proportionally higher dis-
charge from Lynch Wood springs in January 2001
(point 2) was due to unusually high early winter
recharge. This was not reflected to the same degree in
the Bockhampton gradient time series, as the peak
groundwater level was constrained by the stage in the
adjacent channel, which produced only a subdued
response to the high discharge due to the wide and
shallow morphology of the local channel. However,
once the peak discharge from Lynch Wood springs
had receded (point 3) the two parameters displayed a
very similar pattern of recession. Overall, the
consistent correlation between the discharge at
Lynch Wood springs and the lateral gradient at
Bockhampton indicates the potential for predicting
the onset, cessation and magnitude of groundwater
discharges to an adjacent river channel or floodplain
wetland, based upon a record of local groundwater
levels. To estimate the magnitude of such ground-
water discharges requires a key additional component;
the local hydraulic conductivity, and this was
calculated for the Bockhampton site using flow
accretion data.
Increases in river flow along a 2 km section of the
River Lambourn adjacent to the Bockhampton bore-
hole enable valley floor hydraulic conductivity to be
determined using Darcy’s Law, from:
Q ZKKiA
where Q is reach accretion (m3/s/km), K is hydraulic
conductivity between borehole and channel (m/s); i is
hydraulic gradient and A is the area of flow exchange
between aquifer and channel (m2/km of channel). The
latter, A, is taken to represent the average wetted
perimeter, which is approximately 5.7 m multiplied
by the channel length. Determination of the relation-
ship between local hydraulic gradient and flow
accretion, for 44 distinct periods of time when current
meter gauging was undertaken, yielded an estimate
for hydraulic conductivity of 3.8!10K4 m/s (equiv-
alent to 33 m/day). This lumped parameter represents
an estimate of valley floor hydraulic conductivity,
which here includes the river bed, limited alluvial
deposits and the upper active layer of the chalk
aquifer, and compares to a catchment average value
for the chalk aquifer of 25 m/day derived from
pumping tests (based upon a transmissivity value of
1490 m2/day and an effective aquifer thickness of
60 m; Brettell, 1971).
3.2. East Garston
Measurements at East Garston elucidate the
relationship between local groundwater levels, river
channel bed levels and headwater spring discharges
at a site approximately 7.5 km below the seasonal
source of the Lambourn, in a reach which is
characterised by low magnitude river flow accretion
(Grapes et al., in press). In this area, the floodplain is
c. 150 m wide and the river channel displays very
little incision. Floodplain water levels have been
monitored since 1992 in two narrow diameter
tubewells (TW22/39 and SU37/21) which have
been installed to a depth of c. 4 m at two points
approximately 500 m apart, but both within 5 m of
the river channel. They are constructed from 50 mm
diameter galvanised steel pipes that are perforated
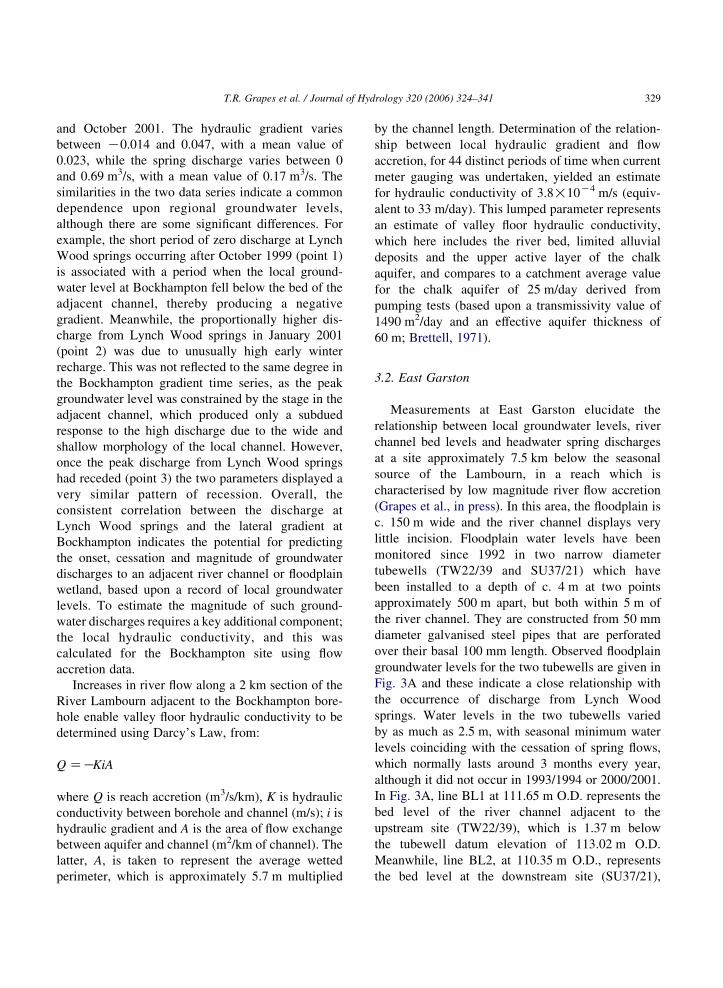
over their basal 100 mm length. Observed floodplain
groundwater levels for the two tubewells are given in
Fig. 3A and these indicate a close relationship with
the occurrence of discharge from Lynch Wood
springs. Water levels in the two tubewells varied
by as much as 2.5 m, with seasonal minimum water
levels coinciding with the cessation of spring flows,
which normally lasts around 3 months every year,
although it did not occur in 1993/1994 or 2000/2001.
In Fig. 3A, line BL1 at 111.65 m O.D. represents the
bed level of the river channel adjacent to the
upstream site (TW22/39), which is 1.37 m below
the tubewell datum elevation of 113.02 m O.D.
Meanwhile, line BL2, at 110.35 m O.D., represents
the bed level at the downstream site (SU37/21),
Fig. 3. (A) The relationship between groundwater levels at East Garston (tubewells SU37/21 and TW22/39) and the occurrence offlows at Lynch
Wood.BL1 is the approximate river-bed elevation near TW22/39 andBL2 the river-bed elevation near SU37/21; (B) Scatter plot showing how the
lateral hydraulic gradient between the River Lambourn and the two boreholes varies in proportion to calculated reach accretion.
T.R. Grapes et al. / Journal of Hydrology 320 (2006) 324–341330

T.R. Grapes et al. / Journal of Hydrology 320 (2006) 324–341 331
2.1 m below the datum elevation of the tubewell at
112.45 m O.D.
The relationship between local (positive) hydraulic
gradients for the two piezometers, and the measured
increase in flow across the adjacent channel section, is
shown in Fig. 3B. The full hydraulic gradient dataset
for SU37/21 (including both positive and negative
values) varies between K0.18 and 0.11, with a mean
value of 0.03. The full gradient dataset for TW22/39
ranges from K0.57 to 0.17, with a mean value of
K0.01. For comparison, over the period November
1992 to January 2001 the longitudinal gradient
between the two sites varied from 0.0017 to 0.0027,
with a mean value of 0.0023. These values show that
locally lateral gradients, perpendicular to the channel,
are approximately two orders of magnitude greater
than the longitudinal gradient, along the axis of the
channel/valley.
A total of 55 paired (upstream and downstream)
readings of discharge from current meter surveys on
an adjacent 2.3 km channel section enable local
valley floor hydraulic conductivity to be estimated
separately for the two tubewell locations,
giving values of 1.7!10K4 m/s (15 m/d) and
2.9!10K4 m/s (25 m/d) for the upstream and
downstream sites respectively. Alluvial deposits
are thin or absent in this area, as weathered chalk
is visible in the bed and banks of the river at several
locations. Hence, the calculated values of hydraulic
conductivity will mainly reflect the character of the
shallow chalk aquifer and the occurrence of any
armouring of the thin gravels on the river bed.
Numerous springs occur in the vicinity of the
village, indicating that locally the shallow chalk
Fig. 4. Schematic cross-section across the Lambourn valley at West Sh
relationship of valley floor sedimentology to local and regional groundwa
may exhibit sub-karstic properties, including
enhanced fissuring with high anisotropy.
3.3. West Shefford
Groundwater and floodplain channel water tables
were recorded over the period 1998–2001 at a number
of points across the Lambourn valley at West
Shefford, located 9.4 km downstream from the
seasonal source of the River Lambourn. Measure-
ments included river stage, chalk groundwater levels
(both deep and shallow) and the alluvial water table.
The relative positions of the monitoring points and
cross-sectional stratigraphy are given in Fig. 4 with
water flow directions inferred from local groundwater
level measurements. The groundwater observation
borehole (reference SU37/1) is cased to a depth of
12.5 m and extends to a depth of 100.6 m, with a
datum elevation of 106.7 m O.D. Along this cross-
section the chalk has been eroded to a depth of 5–
5.5 m and infilled with c. 4 m of gravel that is itself
overlain by a thin calcareous peaty soil (c. 1 m thick).
At piezometer B this layer comprised 0.3 m of brown
silty soil, 0.25 m of brown clayey silt and 0.45 m of
dark wood peat. The River Lambourn appears to be in
close hydraulic contact with the underlying alluvial
gravels and the floodplain alluvial water table lies just
below the ground surface.
Groundwater flow paths shown in Fig. 4 indicate
that the inferred direction of groundwater flow in both
the chalk and alluvial gravel is principally down-
valley. However, groundwater levels indicate that
there is some local flow from the chalk to the gravel,
and current meter surveys identify that there are also
efford showing the location of measuring points and the inferred
ter flows.
T.R. Grapes et al. / Journal of Hydrology 320 (2006) 324–341332
floodplain areas characterised by significant ground-
water discharge (for example the spring-fed channel
on the north east margin of the cross section). The
relationships between different flow systems in the
chalk and gravel aquifers are likely to be very
important in determining the potential for significant
floodplain wetlands to persist on the valley floor. The
gravel layer appears to vary considerably in lateral
extent and thickness, being absent less than 200 m
downstream, where weathered chalk bedrock is
visible in the river bed. Gravel exposed during
installation of piezometer B appeared to be largely a
coarse flint gravel, similar to that observed in the river
bed, but a pit excavated 30 m further downstream
uncovered 1 m of wood peat overlying cobbles of flint
and sarsen (Tertiary silcrete) in a putty chalk matrix,
showing that the lithology of the ‘gravel’ layer also
displayed significant local variability.
Observed water levels from points identified in the
cross-sectional transect (Fig. 4) are given in Fig. 5A.
The results indicate the degree to which both the
lateral and vertical controls on groundwater flows,
discussed above, are important in determining water
movement across the floodplain. The highest water
levels were consistently found in piezometer A,
situated 80 m from the river channel, which represents
shallow groundwater levels in the chalk on the valley-
side above the floodplain. The three monitoring points
close to the channel; namely the deep observation
borehole, piezometer B, and the river stage itself,
indicate that there is a high upward hydraulic gradient
beneath the floodplain, confirming that this is an area
of groundwater discharge. Deep groundwater levels
are consistently higher than the floodplain alluvial
water table observed in piezometer B, with the
exception of a short period in October and November
2000, when intense precipitation produced a rapid
increase in the floodplain alluvial water level.
The relationship between piezometer B and the
other water levels indicates how floodplain alluvial
levels, deep groundwater levels and river stage may
vary through time. Piezometer B was installed by
augering through c. 1 m of silt/clay soil and wood peat,
and its base lies immediately above a coarse gravel
layer at 105.5 m O.D. The bed of the River Lambourn,
within 15 m of the piezometer, is at 105.2 m O.D. and
consists of a similar coarse flint gravel to that found at
the piezometer base. Despite the proximity of
the piezometer to the river, water levels in the
piezometer are consistently 0.2–0.4 m higher than
river stage. This may indicate a degree of armouring or
cementation of the river bed, which reduces its
permeability and partially isolates the channel from
upwelling groundwater. One consequence of this is the
focusing of groundwater discharge at discrete flood-
plain springs (such as the one shown in the floodplain
cross-section, Fig. 4), which are found at several
locations along the valley of the Lambourn.
Valley floor hydraulic conductivity, with respect to
the three groundwater monitoring points, was esti-
mated across theWest Shefford section using a total of
54 flow accretion measurements along the adjacent
1.9 km long channel reach. The relationship between
reach accretion and the hydraulic gradient for each of
the three points is shown in Fig. 5B. The estimates of
valley floor hydraulic conductivity obtained were:
4.5!10K3 m/s (390 m/d) between piezometer A and
the river; 6.0!10K4 m/s (52 m/d) between piezometer
B and the river; and 1.6!10K3 m/s (140 m/d) between
the deep observation borehole and the river. The latter
value is likely to include elements of both horizontal
and vertical hydraulic conductivity. Significantly
however, the regression lines shown in Fig. 5B fail to
pass through the origin: the lines representing both the
observation borehole and piezometer A intercept the
‘gradient’ axis at c. 0.015 suggesting that the chalk
aquifer discharges to a higher point than the river
channel at the site, which is likely to represent a spring
at the floodplain margin. Conversely, piezometer B
intersects the ‘gradient’ axis at c. K0.009, indicating
that discharge from this point is to a lower elevation
than the river nearby, suggesting that the direction of
seepage through the gravel layer is down the axis of the
river valley. This indicates that the longitudinal
gradient at this site may be proportionally greater
(relative to the local lateral gradient) than at East
Garston, but the absence of an appropriate monitoring
point, located a short distance upstream or downstream
of the West Shefford sites, prevented a definitive
assessment.
4. Numerical modelling
The results presented in the previous section
indicate a variable relationship between floodplain
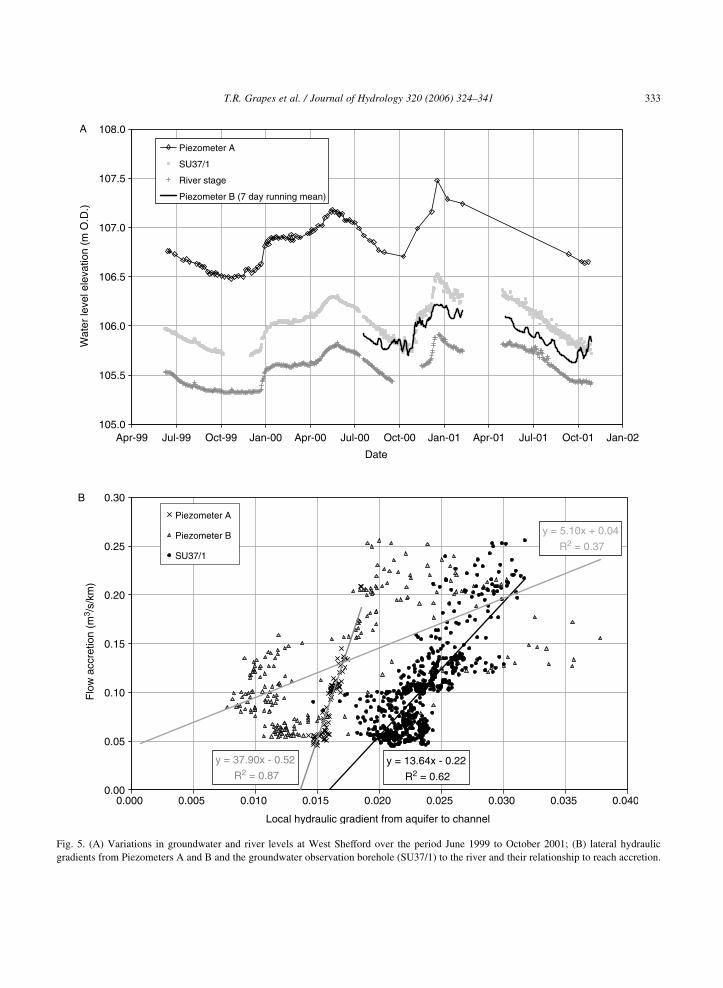
Fig. 5. (A) Variations in groundwater and river levels at West Shefford over the period June 1999 to October 2001; (B) lateral hydraulic
gradients from Piezometers A and B and the groundwater observation borehole (SU37/1) to the river and their relationship to reach accretion.
T.R. Grapes et al. / Journal of Hydrology 320 (2006) 324–341 333
T.R. Grapes et al. / Journal of Hydrology 320 (2006) 324–341334
channel levels, groundwater levels and patterns of
river flow accretion. This reflects the channel bed
gradient (macro-scale longitudinal profile), channel
and floodplain width, and the continuity of the alluvial
gravel aquifer, as well as the lithological and
structural characteristics of the chalk aquifer. Given
the difficulty in obtaining field data to investigate
these factors, a groundwater model of the Lambourn
catchment was developed to investigate patterns of
river flow accretion and the variability in floodplain
groundwater levels (which provide the main con-
straints affecting riparian valley floor wetlands in the
catchment). The model builds upon several other
models that have previously been developed for the
Lambourn catchment, at both catchment and regional
scales (Oakes and Pontin, 1976; Morel, 1980; Rushton
et al., 1989; Bullock et al., 1995). These studies, with
the exception of Bullock et al. (1995), were designed
to investigate issues relating to groundwater resource
management in conjunction with the West Berkshire
Groundwater Scheme. The models were generally
transient, with a timescale varying from 6 months to
25 years and with grid cell size of generally 1 km2. As
a result of using a relatively coarse mesh size, these
models fail to adequately represent the variation in
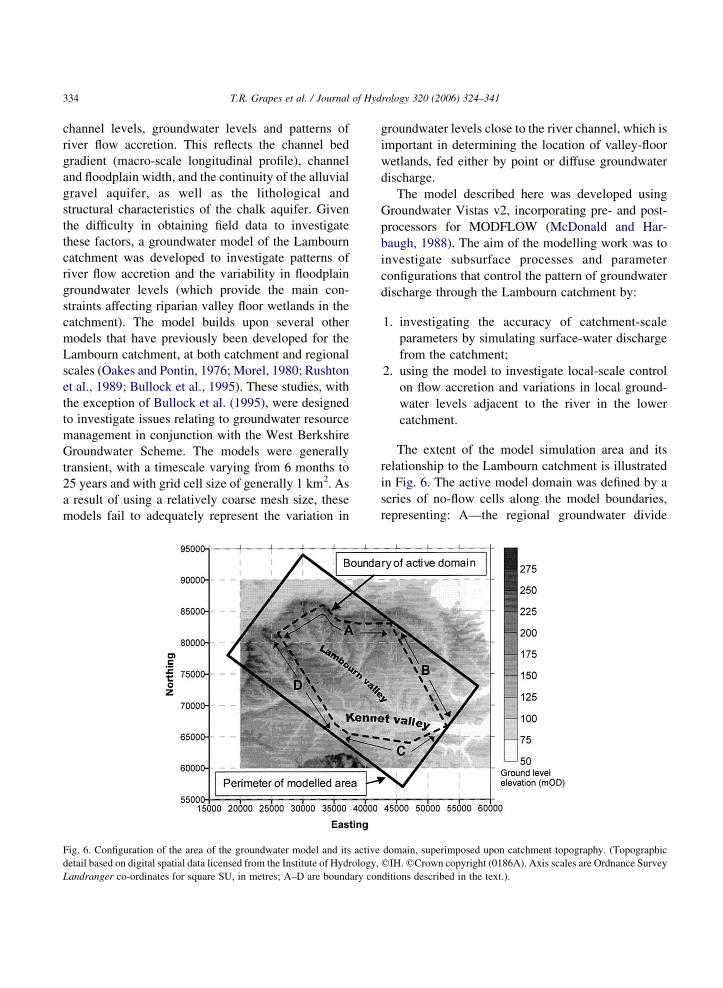
Fig. 6. Configuration of the area of the groundwater model and its active
detail based on digital spatial data licensed from the Institute of Hydrology,
Landranger co-ordinates for square SU, in metres; A–D are boundary con
groundwater levels close to the river channel, which is
important in determining the location of valley-floor
wetlands, fed either by point or diffuse groundwater
discharge.
The model described here was developed using
Groundwater Vistas v2, incorporating pre- and post-
processors for MODFLOW (McDonald and Har-
baugh, 1988). The aim of the modelling work was to
investigate subsurface processes and parameter
configurations that control the pattern of groundwater
discharge through the Lambourn catchment by:
1. investigating the accuracy of catchment-scale
parameters by simulating surface-water discharge
from the catchment;
2. using the model to investigate local-scale control
on flow accretion and variations in local ground-
water levels adjacent to the river in the lower
catchment.
The extent of the model simulation area and its
relationship to the Lambourn catchment is illustrated
in Fig. 6. The active model domain was defined by a
series of no-flow cells along the model boundaries,
representing: A—the regional groundwater divide
domain, superimposed upon catchment topography. (Topographic
qIH.qCrown copyright (0186A). Axis scales are Ordnance Survey
ditions described in the text.).
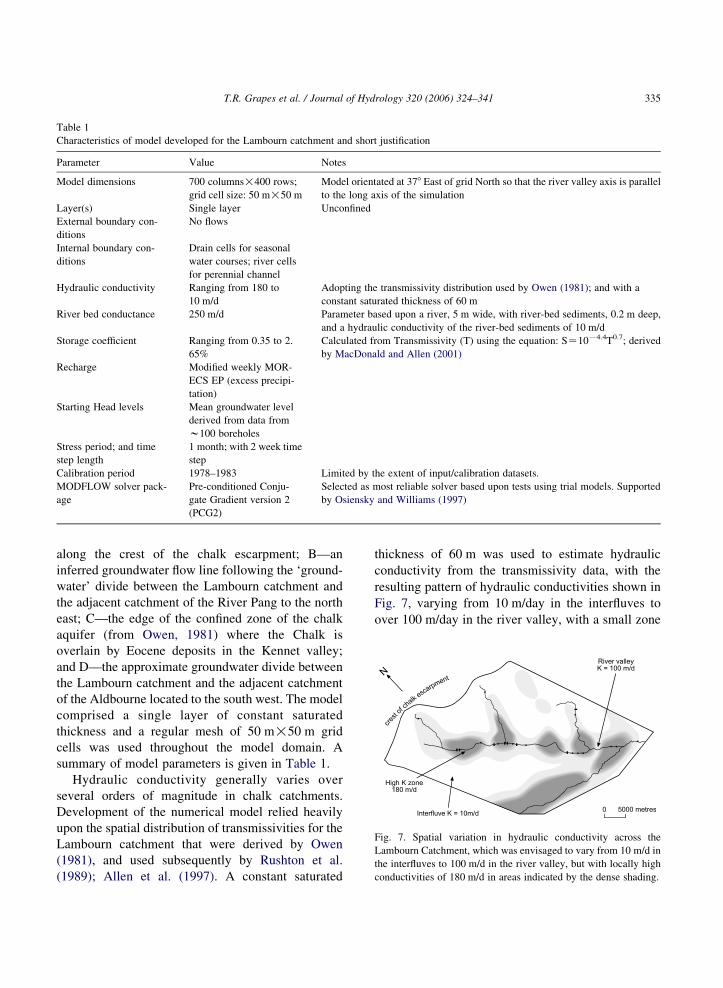
Fig. 7. Spatial variation in hydraulic conductivity across the
Lambourn Catchment, which was envisaged to vary from 10 m/d in
the interfluves to 100 m/d in the river valley, but with locally high
conductivities of 180 m/d in areas indicated by the dense shading.
Table 1
Characteristics of model developed for the Lambourn catchment and short justification
Parameter Value Notes
Model dimensions 700 columns!400 rows;
grid cell size: 50 m!50 m
Model orientated at 378 East of grid North so that the river valley axis is parallel
to the long axis of the simulation
Layer(s) Single layer Unconfined
External boundary con-
ditions
No flows
Internal boundary con-
ditions
Drain cells for seasonal
water courses; river cells
for perennial channel
Hydraulic conductivity Ranging from 180 to
10 m/d
Adopting the transmissivity distribution used by Owen (1981); and with a
constant saturated thickness of 60 m
River bed conductance 250 m/d Parameter based upon a river, 5 m wide, with river-bed sediments, 0.2 m deep,
and a hydraulic conductivity of the river-bed sediments of 10 m/d
Storage coefficient Ranging from 0.35 to 2.
65%
Calculated from Transmissivity (T) using the equation: SZ10K4.4T0.7; derived
by MacDonald and Allen (2001)
Recharge Modified weekly MOR-
ECS EP (excess precipi-
tation)
Starting Head levels Mean groundwater level
derived from data from
w100 boreholes
Stress period; and time
step length
1 month; with 2 week time
step
Calibration period 1978–1983 Limited by the extent of input/calibration datasets.
MODFLOW solver pack-
age
Pre-conditioned Conju-
gate Gradient version 2
(PCG2)
Selected as most reliable solver based upon tests using trial models. Supported
by Osiensky and Williams (1997)
T.R. Grapes et al. / Journal of Hydrology 320 (2006) 324–341 335
along the crest of the chalk escarpment; B—an
inferred groundwater flow line following the ‘ground-
water’ divide between the Lambourn catchment and
the adjacent catchment of the River Pang to the north
east; C—the edge of the confined zone of the chalk
aquifer (from Owen, 1981) where the Chalk is
overlain by Eocene deposits in the Kennet valley;
and D—the approximate groundwater divide between
the Lambourn catchment and the adjacent catchment
of the Aldbourne located to the south west. The model
comprised a single layer of constant saturated
thickness and a regular mesh of 50 m!50 m grid
cells was used throughout the model domain. A
summary of model parameters is given in Table 1.
Hydraulic conductivity generally varies over
several orders of magnitude in chalk catchments.
Development of the numerical model relied heavily
upon the spatial distribution of transmissivities for the
Lambourn catchment that were derived by Owen
(1981), and used subsequently by Rushton et al.
(1989); Allen et al. (1997). A constant saturated
thickness of 60 m was used to estimate hydraulic
conductivity from the transmissivity data, with the
resulting pattern of hydraulic conductivities shown in
Fig. 7, varying from 10 m/day in the interfluves to
over 100 m/day in the river valley, with a small zone
T.R. Grapes et al. / Journal of Hydrology 320 (2006) 324–341336
of particularly elevated values being located upstream
of Bockhampton.
The River Lambourn was represented in two ways
in the model, depending upon whether the reaches
were perennial or seasonal. Perennial reaches were
denoted using MODFLOW’s river cells, which
estimate subsurface flow through the river bed between
the river and the aquifer as a function of the hydraulic
gradient and the ‘river bed conductance’, which is
calculated fromvalues for channelwidth, bed sediment
thickness and bed sediment hydraulic conductivity.
Constant values for these three parameters were used
for all channel cells, comprising a channel width of
5 m, a bed sediment hydraulic conductivity of
10 m/day and a bed sediment thickness of 0.2 m.
Using river cells the model allows seepage to occur in
either direction between the river and aquifer,
depending upon the direction of the hydraulic gradient,
enabling both gaining and losing reaches to be
represented. MODFLOW drain cells were used to
represent groundwater flows to the non-perennial
section of the river, and point source discharges from
discrete springs along the valley-sides. Drain cells are
activated once groundwater levels rise above their
invert elevation, allowing water to be removed from
the model. The discharge is based upon the difference
between aquifer head at the drain cell and the drain-bed
elevation, multiplied by the ‘conductance’ term
(described above). If the groundwater level falls
below the specified height of the drain, then discharge
to the drain ceases. The accuracy with which both river
and drain cells are able to describe the exchange of
water between groundwater and surface water depends
largely upon the precision with which drain bed and
river bed elevations are specified in the model. As a
result, river bed heights and the elevations of several
springs were surveyed into Ordnance Datum at points
including Lynch Wood, East Garston, and West
Shefford
Recharge was estimated from weekly MORECS
(Meteorological Office Rainfall and Evaporation
Calculation System) excess precipitation (EP) data
(Hough and Jones, 1997), which revealed that effective
recharge took place almost exclusively in winter
months, between October and March. In order to
provide a representative recharge input to the model,
the EP dataset was modified in two ways. Firstly, the
magnitude of the weekly EP values was increased by
60% to account for (i) the recognised, long-term deficit
of 50% when comparing EP to catchment discharge,
and (ii) an estimated additional 10% deficit due to
unrecorded groundwater losses from the catchment,
for example, by flows beneath the lowest gauging
station. Secondly, the timing of the EP dataset was
modified by introducing a temporal delay, to represent
the time taken for recharge to pass through the
unsaturated zone. The delay was estimated by time
series analysis of the relationship between EP and
changes in mean catchment groundwater level, which
identified amean lag of 1 month between the two series
(Grapes, 2004). This mean lag was assumed to
represent the travel time through the mean unsaturated
zone thickness of 37 m for the catchment, and thus the
recharge delay was spatially weighted to account for
the variability in unsaturated zone thickness across the
catchment.
4.1. Model calibration
The model was initially calibrated in a steady-state
form by assessing its output relative to mean
catchment conditions. For this purpose, starting
heads were derived from mean groundwater levels
recorded in the network of c.100 boreholes across the
catchment, while a fixed value of recharge of 1 mm/d
was used, calculated from the long-term mean
catchment discharge of 1.72 m3/s. Model predictions
of groundwater losses arising from seepage to the
river at points corresponding to three reaches
immediately upstream of gauges at East Shefford,
Welford and Shaw were then compared with field
data. Fig. 8A indicates that the model was able to
reproduce mean flows at these points in the catchment
within G5% of recorded values. Investigation of the
residual surface showing the difference between mean
groundwater levels observed in the borehole network
and the model predictions, indicated that the majority
of the model area, and particularly the river valleys,
had residuals that were within G2 m of the observed
level.
The model was converted to a transient state
through the addition of storage data and a time
varying recharge input (described previously), and
then calibrated by assessing the ability of the model to
simulate the annual variation in catchment discharge.
Initially a single hydrological year (1978/1979) was
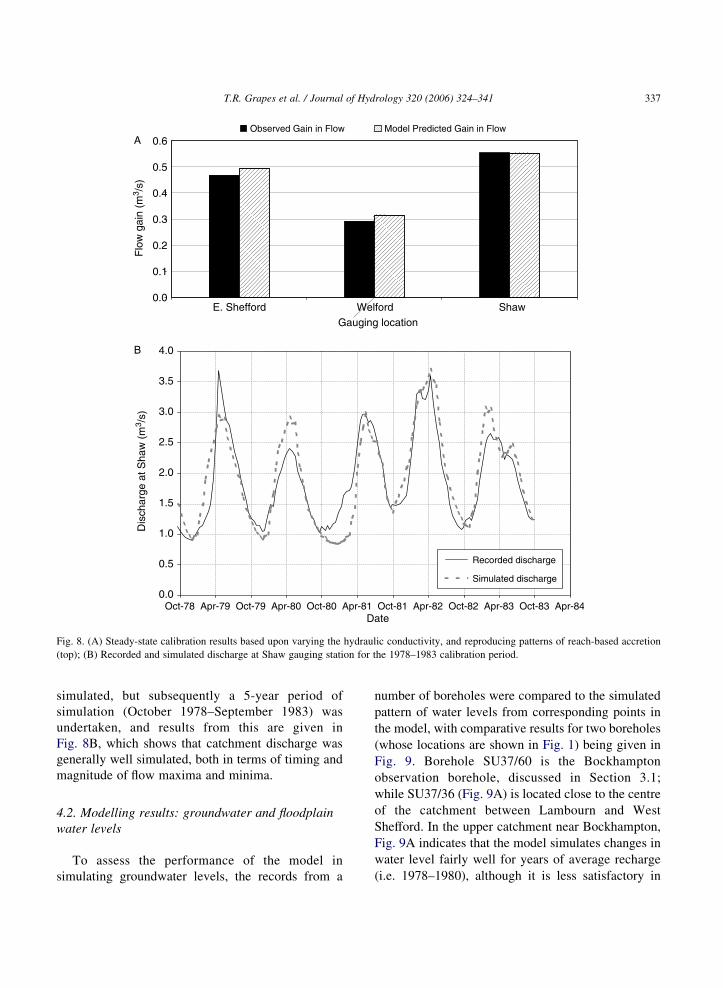
Fig. 8. (A) Steady-state calibration results based upon varying the hydraulic conductivity, and reproducing patterns of reach-based accretion
(top); (B) Recorded and simulated discharge at Shaw gauging station for the 1978–1983 calibration period.
T.R. Grapes et al. / Journal of Hydrology 320 (2006) 324–341 337
simulated, but subsequently a 5-year period of
simulation (October 1978–September 1983) was
undertaken, and results from this are given in
Fig. 8B, which shows that catchment discharge was
generally well simulated, both in terms of timing and
magnitude of flow maxima and minima.
4.2. Modelling results: groundwater and floodplain
water levels
To assess the performance of the model in
simulating groundwater levels, the records from a
number of boreholes were compared to the simulated
pattern of water levels from corresponding points in
the model, with comparative results for two boreholes
(whose locations are shown in Fig. 1) being given in
Fig. 9. Borehole SU37/60 is the Bockhampton
observation borehole, discussed in Section 3.1;
while SU37/36 (Fig. 9A) is located close to the centre
of the catchment between Lambourn and West
Shefford. In the upper catchment near Bockhampton,
Fig. 9A indicates that the model simulates changes in
water level fairly well for years of average recharge
(i.e. 1978–1980), although it is less satisfactory in
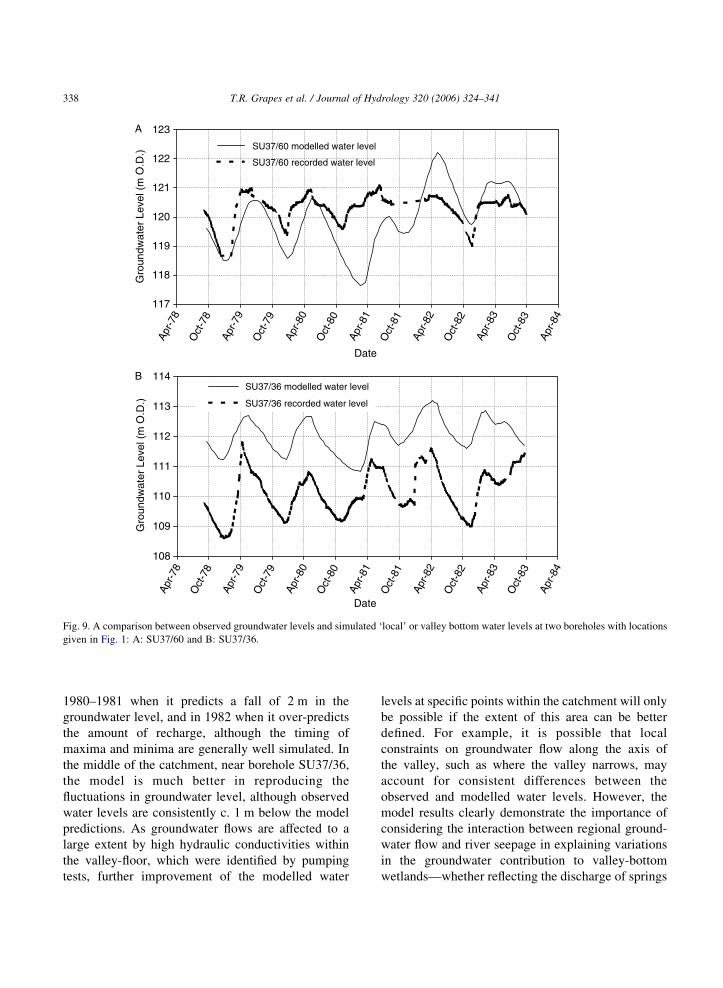
Fig. 9. A comparison between observed groundwater levels and simulated ‘local’ or valley bottom water levels at two boreholes with locations
given in Fig. 1: A: SU37/60 and B: SU37/36.
T.R. Grapes et al. / Journal of Hydrology 320 (2006) 324–341338
1980–1981 when it predicts a fall of 2 m in the
groundwater level, and in 1982 when it over-predicts
the amount of recharge, although the timing of
maxima and minima are generally well simulated. In
the middle of the catchment, near borehole SU37/36,
the model is much better in reproducing the
fluctuations in groundwater level, although observed
water levels are consistently c. 1 m below the model
predictions. As groundwater flows are affected to a
large extent by high hydraulic conductivities within
the valley-floor, which were identified by pumping
tests, further improvement of the modelled water
levels at specific points within the catchment will only
be possible if the extent of this area can be better
defined. For example, it is possible that local
constraints on groundwater flow along the axis of
the valley, such as where the valley narrows, may
account for consistent differences between the
observed and modelled water levels. However, the
model results clearly demonstrate the importance of
considering the interaction between regional ground-
water flow and river seepage in explaining variations
in the groundwater contribution to valley-bottom
wetlands—whether reflecting the discharge of springs
T.R. Grapes et al. / Journal of Hydrology 320 (2006) 324–341 339
in the upper catchment or on valley side, or diffuse
seepage through upwelling groundwater within the
floodplain.
5. Discussion
The implications of the work described here are
that water flow pathways can vary significantly over
comparatively small distances. This is likely to have
important ramifications for the management of
riparian ecosystems in that water and nutrient
availability will reflect patterns of surface-water–
groundwater interaction at a variety of scales,
particularly where an alluvial aquifer is present.
There are also likely to be clear trends in groundwater
seepage along the river profile, characterised by a
fairly simple relationship between inflows to head-
water wetlands and regional groundwater levels, but
with more complicated flow paths occurring where a
significant floodplain exists. Occurrence of these flow
dynamics, which are driven by catchment-scale
hydraulic gradients, need to be recognised, if
vulnerable floodplain wetlands in the lower catchment
(such as Boxford) are to be conserved.
Whilst modelling simulations may help in an initial
assessment of the hydrology of specific sites,
subsequent field investigation and model refinement
are likely to be needed. This is particularly important
in chalk catchments given the commonly recognised
difficulty in simulating groundwater flow where
hydraulic conductivities vary in a non-linear pattern
with depth (Rushton et al., 1989). This is generally
attributed to rapidly increasing permeability as
groundwater levels rise into areas where there is a
greater frequency of fractures extending through the
chalk matrix. However, this paper demonstrates that
in the river valley a laterally extensive alluvial gravel
aquifer enables two distinct scales of sub-surface flow
through the catchment. Firstly, catchment-scale flow
occurs through the regional chalk aquifer, with
seasonal discharge to the river channel and floodplain
channels as groundwater levels rise in the autumn and
winter; and secondly, local (and laterally discontinu-
ous) flow occurs through the alluvial aquifer in the
valley bottom. Water levels in the latter are closely
associated with river flows, but there are likely to be
local areas characterised by upwelling groundwater
where the floodplain and alluvial aquifer are narrow,
whilst downward groundwater movement is probable
in areas where the floodplain widens (Larkin and
Sharp, 1992; Woessner, 2000). Water levels in the
alluvial aquifer are likely to be further moderated by
diffuse seepage from the chalk aquifer, and may
become increasingly important down the long profile
as the gravel thickness (and storage volume)
increases. Given the complexity of the groundwater
flow system, the limited success of a one-layer
numerical model in replicating groundwater level
variations in deep boreholes (cased to between 10 and
20 m) is not surprising. However, of more interest is
the potential to utilise the results and limitations of the
model to (i) improve our understanding of water flow
pathways through a chalk catchment; and (ii) evaluate
how catchment-scale models, developed for water
resources management, may be used to advance our
understanding of sensitive and vulnerable wetland
ecosystems that depend upon continued groundwater
discharge.
As far as the first point is concerned, there are a
number of outstanding research questions regarding
water flow pathways through the chalk. In the upper
catchment, floodplain wetlands depend upon spring
discharge. The magnitude and/or timing of such
discharges derived from saturated groundwater flow
can be readily related to the seasonal variation in
groundwater levels, but there is some evidence to
suggest that these discharges are partly dependent
upon lateral water movement in the unsaturated zone.
Such flows reflect the occurrence of planar features in
the chalk aquifer that possess low vertical per-
meability, including hard grounds (indurated horizons
formed during quiescent periods of chalk sedimen-
tation), flint bands and marl bands. These features are
particularly important in areas with high topographic
gradients, such as valley sides, where they may be
partly responsible for the local occurrence of springs
at the floodplain margin.
Generally, however, this paper indicates the need
for further work including both hydrological and
geomorphological approaches to the investigation of
water flow paths within alluvial aquifers that are
closely associated with a major aquifer. This is
supported by a recent review identifying the need
for improved characterisation of interfaces, such as
between a bedrock and alluvial aquifer, or between an
T.R. Grapes et al. / Journal of Hydrology 320 (2006) 324–341340
aquifer and a surface-water body (Sophocleous,
2002). In this context, improved understanding of
the role of alluvial aquifers in determining the
hydrological regime of valley bottom wetlands is
urgently needed. For example, in the Lambourn
catchment, groundwater flow through the alluvial
aquifer would account for the limited variation in
wetland water tables observed in the lower catchment,
and at Boxford (Fig. 1), 5 km downstream of East
Shefford, Prior and Johnes (2002) found that water
tables varied between a winter (i.e. January and
February) minimum depth of 0.2 m; to a summer
(August and September) maximum of 0.4 m below the
surface. The maintenance of this stable water level
regime could be affected considerably by groundwater
abstraction, which would reduce spring discharge in
the upper catchment, and seepage flows from the
chalk to the alluvial aquifer. This would contribute to
reductions in discharge as well as lowering floodplain
water tables, which could increase nutrient avail-
ability through enhanced decomposition of dewatered
organic deposits.
Further work on floodplain wetlands in per-
meable catchments also requires careful consider-
ation of how catchment-scale groundwater models
can be used to investigate specific floodplain
wetlands. This might include a phased approach,
in which a regional model is used to assess general
fluxes, followed by more focussed or nested
modelling where additional details are required. In
this latter type of approach it is critical that
representative boundary conditions are used, to
avoid significant errors in output. Important issues
remain to be considered in detail, including the
resolution of field data needed to verify flow
exchange between alluvial and bedrock aquifers,
and the relationship of both deep and shallow water
levels to river stage. Clearly both are important if
we are to improve our understanding of the
hydrological controls on the narrow, discontinuous
but widespread valley bottom wetlands of chalk
catchments.
Acknowledgements
This research was carried out under a NERC/-
CASE funded studentship (GT/04/98/FS/17) in
association with the Centre for Ecology and Hydrol-
ogy at Wallingford; Mr R.B. Bradford was the CASE
supervisor at CEH. We are grateful for the comments
of two anonymous reviewers on an earlier version of
this paper.
References
Allen, D.J., Brewerton, L.J., Cobley, L.M., Gibbs, B.R., Lewis,
M.A., MacDonald, A.M., Wagstaff, S.J., Williams, A.T., 1997.
The physical properties of major aquifers in England andWales,
BGS Technical Report WD/97/34, Environment Agency R and
D Publication 8, p. 312.
Berrie, A.D., 1992. The chalk-stream environment. Hydrobiologia
248, 3–9.
Bradford, R.B., 2002. Controls on the discharge of chalk streams of
the Berkshire downs, UK. Sci. Total Environ. 282–283, 65–80.
Bradley, C., 2002. Simulation of the annual water table dynamics of
a floodplain wetland Narborough Bog, UK. J. Hydrol. 261, 150–
172.
Brettell, E.J., 1971. Report on the Lambourn valley pilot scheme,
1967–1969. Thames Conservancy, Reading, pp. 172.
Bullock, A., Gustard, A., Irving, K., Sekulin, A., Young, A., 1995.
Low flow estimation in artificially influenced catchments.
Institute of Hydrology, Wallingford, UK (R & D Note 274).
Drexler, J.Z., Bedford, B.L., Scognamiglio, R., Siegel, D.I., 1999.
Fine-scale characteristics of groundwater flow in a peatland.
Hydrol. Proc. 13, 1341–1359.
Gilman, K., 1994. Hydrology and Wetland Conservation. Institute
of Hydrology Water Series, Wiley, Chichester.
Gilvear, D.J., Andrews, R., Tellam, J.H., Lloyd, J.W., Lerner, D.N.,
1993. Quantification of the water balance and hydrogeological
processes in the vicinity of a small groundwater-fed wetland,
East Anglia, UK. J. Hydrol. 144, 311–334.
Grapes, T.R., Bradley, C., Petts, G.E. Dynamics of River—Aquifer
Interaction along a chalk stream: the River Lambourn, UK.
Hydrol. Proc., in press.
Grapes, T.R., 2004. Groundwater—river interaction in a chalk
catchment: the River Lambourn, UK. Unpubl. PhD thesis,
University of Birmingham.
Grieve, I.C., Gilvear, D.G., Bryant, R.G., 1995. Hydrochemical and
water source variations across a floodplain mire Insh Marshes,
Scotland. Hydrol. Proc. 9, 99–110.
Gustard, A., Bullock, A., Dixon, J.M., 1992. Low flow estimation in
the United Kingdom, Institute of Hydrology Report No. 108.
Haria, A.H., Hodnet, M.G., Johnson, A.C., 2003. Mechanisms of
groundwater recharge and pesticide penetration to a chalk
aquifer in southern England. J. Hydrol. 275, 122–137.
Haslam, S.M., 2003. Understanding Wetlands: Fen Bog and Marsh.
Taylor and Francis, London (p. 296).
Hough, M.N., Jones, R.J.A., 1997. The United Kingdom meteor-
ological office rainfall and evaporation calculation system:
MORECS version 2.0—an overview. Hydrol. Earth Syst. Sci. 1,
227–239.
T.R. Grapes et al. / Journal of Hydrology 320 (2006) 324–341 341
Hunt, R.J., Krabbenhoft, D.P., Anderson, M.P., 1996. Groundwater
inflow measurements in wetland systems. Water Resour. Res.
32, 495–507.
Larkin, R.G., Sharp, J.M., 1992. On the relationship between river-
basin geomorphology, aquifer hydraulics and groundwater flow
direction in alluvial aquifers. Geol. Soc. Am. Bull. 104, 1608–
1620.
MacDonald, A.M., Allen, D.J., 2001. Aquifer properties of the
chalk of England. Q. J. Eng. Geol. Hydrogeol. 34 (4), 371–384.
McDonald, M.G., Harbaugh, A.W., 1988. A modular three-
dimensional finite difference groundwater flow model US
Geological Survey Technical Water Resources Investigation,
vol. 6 1988 (p. 472).
Mitsch, W.J., Gosselink, J.G., 2000. Wetlands, third ed. Wiley,
London (p. 920).
Morel, E.H., 1980. The use of a numerical model in the
management of the chalk aquifer in the upper Thames basin.
Q. J. Eng. Geol. 13, 153–166.
NRFA, 2001. National river flow archive; Summary sheet for
Station 39019 — Lambourn at Shaw [online]. Centre for
Ecology and Hydrology, Wallingford. Available from: http://
www.nwl.ac.uk/ih/nrfa/station_summaries/039/019.html
[accessed 16 September 2004].
Oakes, D.B., Pontin, M.J.A., 1976. Mathematical modelling of a
Chalk aquifer. Report TR24. Medmenham: Water Research
Centre.
Osiensky, J.L., Williams, R.E., 1997. Potential inaccuracies in
MODFLOW simulations involving the SIP and SSOR methods
for matrix solution. Ground Water 35 (2), 229–232.
Owen, M., 1981. Thames Groundwater Scheme. Case Studies in
Groundwater Resource Evaluation. Clarendon, Oxford (pp.
186–202).
Prior, H., Jones, P.H., 2002. Regulation of surface water quality in a
cretaceous chalk catchment, UK: an assessment of the relative
importance of instream and wetland processes. Sci. Total
Environ. 282–283, 159–174.
Rushton, K.R., Connorton, B.J., Tomlinson, L.M., 1989.
Estimation of the groundwater resources of the Berkshire
downs supported by mathematical modelling. Q. J. Eng.
Geol. 22 (4), 329–341.
Schot, P.P., Wassen, M.J., 1993. Calcium concentrations in wetland
groundwater in relation to water sources and soil conditions in
the recharge area. J. Hydrol. 141, 197–217.
Sophocleous, M., 2002. Interactions between groundwater and
surface water: the state of the science. Hydrogeol. J. 10, 52–
67.
Wassen, M.J., Peeters, W.H.M., Venterink, H.O., 2002. Patterns in
vegetation, hydrology, and nutrient availability in an undis-
turbed river floodplain in Poland. Plant Ecol. 165, 27–43.
Weng, Ph., Giraud, F., Fleury, P., Chevallier, C., 2003. Characteris-
ing and modelling groundwater discharge in an agricultural
wetland on the French Atlantic coast. Hydrol. Earth Syst. Sci. 1,
33–42.
Winter, T.C., 1999. Relation of streams, lakes and wetlands to
groundwater flow systems. Hydrogeol. J. 7, 28–45.
Woessner, W.W., 2000. Stream and fluvial plain ground water
interactions: rescaling hydrologic thought. Ground Water 3,
423–429.