hydrodynamics in a cocurrent gas-liquid trickle bed at · pdf filedata on design and operation...
TRANSCRIPT

Hydrodynamics in a Cocurrent Gas-Liquid Trickle Bed at Elevated Pressures
W. J. A. Wammes, J. Middelkamp, W. J. Huisman, C. M. deBaas, and K. R. Westerterp Dept. of Chemical Engineering, Chemical Reaction Engineering Laboratories, University of Twente,
7500 AE Enschede, The Netherlands
Data on design and operation of trickle beds at elevated pressures are scarce. In this study the influence of the gas density on the liquid holdup, the pressure drop, and the transition between trickle and pulse flow has been investigated in a trickle- bed reactor operating up to 7.5 MPa and with nitrogen or helium as the gas phase. Gas-liquid interfacial areas have been determined up to 5.0 MPa by means of CO, absorption from C02/N2 gas mixtures into amine solutions.
A comparison of the results from nitrogen as the gas phase to those of helium shows that at equal gas densities the hydrodynamic states are the same. The gas- liquid interfacial area increases when operating at higher gas densities. When the determined dimensionless interfacial areas agr/as are all within the range 0.25-0.8, the trickle-bed reactor is suggested to operate in the trickle-flow regime. The gas density has a strong influence on the liquid holdup. Due to the higher pressure gradients at elevated gas densities, the liquid holdup decreases noticeably. Besides, the boundary between the trickle-flow and pulse-flow regime shifts toward higher liquid throughputs: the region fo r trickle- f lo w operation becomes larger. For the liquid holdup and the pressure gradient in the trickle-flow regime, correlations derived based on dimensionless numbers can be applied to high-pressure trickle beds.
Part 1: Gas-Liquid Interfacial Areas
Introduction Gas-liquid mass transfer processes in trickle-flow columns
can be performed either in the cocurrent or countercurrent operation. From a hydrodynamic point of view, the cocurrent operation is preferable because it has no limitations in the gas and the liquid throughput. In cocurrent operation, only one equilibrium stage can be reached. The cocurrent gas-liquid trickle-flow operation is suitable when the transferred com- ponent is removed by a chemical reaction as is the case in three- phase catalytic trickle-bed reactors. In this application, the transfer rate of the gaseous reaction component to the liquid bulk can play an important role on the overall conversion rate, especially when the intrinsic rate of reaction is relatively fast.
Several published studies have dealt with gas-liquid mass transfer in the cocurrent downflow operation with packings typically used in absorption and desorption processes, such as
AIChE Journal December 1991
saddles and rings, as well as for relatively small packings, dp< 4 mm with cylindrical or spherical geometry as generally used in catalytic trickle-bed reactors (see, for example, Gianetto and Silveston, 1986). From these studies, it can be concluded that the gas-liquid mass transfer rate, especially the gas-liquid in- terfacial area, depends strongly on the hydrodynamic flow pattern. In the trickle-flow regime, resistances for mass transfer are larger than the resistances in the spray-, pulse- and bubble- flow regime. Further, investigations on gas-liquid mass transfer at pressures above atmospheric conditions are hardly available. In industrial practice, the catalytic trickle beds always operate at elevated pressures to increase the concentration of the gas- eous component in the liquid phase. In previous studies (Wammes et al., 1990a,b), we have shown that pressure has a strong influence on the hydrodynamics in a trickle-flow col-
Vol. 37, No. 12 1849
umn. The operating region for trickle flow becomes larger at higher pressures. In contrast to atmospheric trickle-flow con- ditions, the liquid holdup depends strongly on the gas velocity at elevated pressures.
In this study, we investigate whether or not pressure also has an influence on the specific gas-liquid interfacial areas in the cocurrent trickle-flow operation. Kan and Greenfield (1978, 1979) and Levec et al. 1986, 1988) found experimentally that the liquid holdup and the pressure drop can exhibit hysteresis. Because the gas-liquid interfacial area is likely to be related to the holdup and pressure drop, we also pay attention to possible hysteresis phenomena for the interfacial areas.
The gas-liquid interfacial area can be determined by using chemically enhanced absorption of a gas-phase component A into a liquid phase, where it reacts irreversibly with a liquid- phase component B.
In cases where the reaction rate is described by
the resistance for mass transfer of A from the gas bulk to the interface is negligible,
the concentration of A in the bulk of the liquid phase is zero,
Ha>2, (3)
the reaction rate RA is slow compared to the mass transport rate of component B from the liquid bulk to the gas-liquid interface.
then the absorption flux is according to the penetration theory described by
The gas phase in the trickle-flow reactor can be assumed to be plug flow. Under conditions of a constant gas velocity, gas density and a constant Hatta number, the following relation between the specific gas-liquid interfacial area agl and the over- all conversion ,$ of gas component A can be derived:
Using this relation, we determined the specific gas-liquid in- terfacial areas in the range of reactor pressures 0.25-5.0 MPa. The chemical absorption experiments were performed by means of carbon dioxide absorption into an aqueous amine solution and 3-mm nonporous glass spheres, and into a more viscous solution (see Table 1) of an amine in aqueous 40% ethylene- glycol and 3.2 x 3.2 mm porous A1,0, cylinders. Nitrogen was used as the carrier gas.
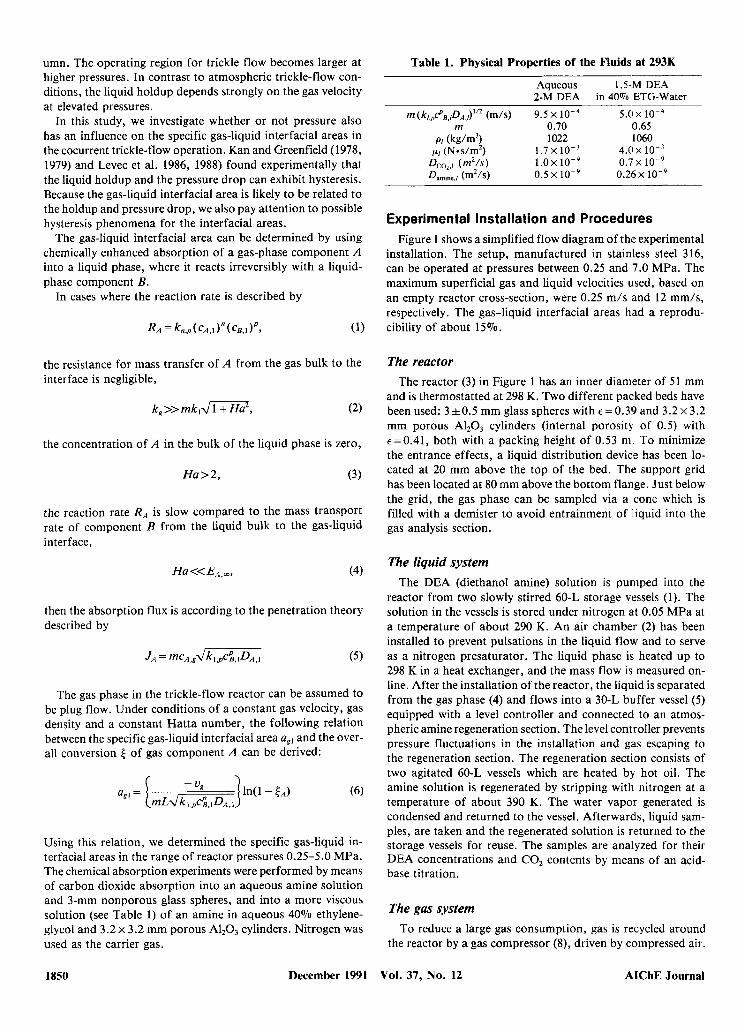
Table 1. Physical Properties of the Fluids at 293K
Aqueous 1.5-M DEA 2-M DEA in 40% ETG-Water
m (k/ ,DPe,~A,,) l ’2 (rn/s) 9.5 x 1 0 - ~ 5 . o ~ 1 0 - ~
P/ (kg/rn3) 1022 1060 pl (Nosh2) 1 . 7 ~ lo-’ 4.0 x 1 0 - ~
Dco,,~ ( m 2 / s ) LOX 1 0 - ~ 0.7 x 1 0 - ~ Daminc./ (m2/s) 0.5 x 10⁻⁹ 0.215~ 1 0 - ~
m 0.70 0.65
Experimental Installation and Procedures Figure 1 shows a simplified flow diagram of the experimental
installation. The setup, manufactured in stainless steel 3 16, can be operated at pressures between 0.25 and 7.0 MPa. The maximum superficial gas and liquid velocities used, based on an empty reactor cross-section, were 0.25 m/s and 12 mm/s, respectively. The gas-liquid interfacial areas had a reprodu- cibility of about 15%.
The reactor The reactor (3) in Figure 1 has an inner diameter of 51 mm
and is thermostatted at 298 K. Two different packed beds have been used: 3 &0.5 mm glass spheres with E = 0.39 and 3.2 x 3.2 mm porous A120, cylinders (internal porosity of 0.5) with ~=0 .41 , both with a packing height of 0.53 m To minimize the entrance effects, a liquid distribution device has been lo- cated at 20 mm above the top of the bed. The support grid has been located at 80 mm above the bottom flange. Just below the grid, the gas phase can be sampled via a cone which is filled with a demister to avoid entrainment of liquid into the gas analysis section.
The liquid system The DEA (diethanol amine) solution is pumped into the
reactor from two slowly stirred 60-L storage vessels (1). The solution in the vessels is stored under nitrogen at 0.05 MPa at a temperature of about 290 K. An air chamber (2) has been installed to prevent pulsations in the liquid flow and to serve as a nitrogen presaturator. The liquid phase is heated up to 298 K in a heat exchanger, and the mass flow is measured on- line. After the installation of the reactor, the liquid is separated from the gas phase (4) and flows into a 30-L buffer vessel ( 5 ) equipped with a level controller and connected to an atmos- pheric amine regeneration section. The level controller prevents pressure fluctuations in the installation and gas escaping to the regeneration section. The regeneration section consists of two agitated 60-L vessels which are heated by hot oil. The amine solution is regenerated by stripping with nitrogen at a temperature of about 390 K. The water vapor generated is condensed and returned to the vessel. Afterwards, liquid sam- ples, are taken and the regenerated solution is returned to the storage vessels for reuse. The samples are analyzed for their DEA concentrations and CO, contents by means of an acid- base titration.
The gas system To reduce a large gas consumption, gas is recycled around
the reactor by a gas compressor (8), driven by compressed air.
1850 December 1991 Vol. 37, No. 12 AKChE Journal

-Q-QJ@ Liquid storage
. * * * . * * * *
. * I * . * * * *
. * I * . * * * *
. * * A . * * * * . * * * . * * * A / * I * .
CW: Cooling Water DFT: Differential Pressure Transmitter EV : Electronical Valve LA : Level Alarm LC: Level Controller LI: Level Indicator MFC : Mass Flow Controller MFT: Mass Flow Transmitter PC: Pressure Controller PI: Pressure Indicator F": Pressure Transmitter TC: Temperature Controller 'IT: Temperature Transmitter
analyser
~~
I
Amine regeneration section (atmospheric
. pressure)
1. Liquid pump
Figure 1. Experimental installation.
2. Air-chamber/N,-saturation 6. Gas buffers 3. Trickle-bed reactor 7. Demister 4. Gas-liquid separator
5. Level-controlled buffer vessel 8. Gas compressor 9. System back-pressure regulator
10. Gas mixer
The gas flow is measured on-line and is adjustable by means of the recycle flow around the compressor itself. At the inlet and discharge side of the compressor, gas buffers (6) have been installed to prevent pressure fluctuations in the reactor. A heat exchanger at the discharge side cools the hot compressed gas down to 298 K.
A mixture of 2 vol.% carbon dioxide in nitrogen is contin- uously added and mixed with the recycle gas(l0). The COz content at the reactor inlet can be regulated by the C02/N2 supply flow. An electronic back-pressure regulator (9) main- tains the pressure in the installation at its setpoint. At the reactor inlet and just below the packed bed, a gas flow of about 120 normal L/h is sampled continuously and analyzed for its C 0 2 content in the range of 0-0.05 vol. Yo or 0-0.5 vol. 070 by a infrared analyzer.
Automation and control To operate the installation safely over a wide range of pres-
sures and to observe whether a steady state has been reached after changing an operating variable, the installation has been
AIChE Journal December 1991
partially automated. The liquid level in the buffer vessel ( 5 ) is controlled, and the gas and liquid flow rates, the reactor pres- sure and the pressure drop are monitored continuously. The temperatures and C02 fractions in the reactor inlet and outlet are monitored by a data recorder.
Operating procedures The installation is pressurized by means of nitrogen. The
packing is prewetted by operating the reactor at a high liquid and a low gas velocity, followed by draining. An absorption experiment is started as follows. A low gas velocity is preset to prevent possible liquid accumulation on the top of the pack- ing and above the outlet in the bottom flange. Subsequently, the liquid flow is started, its rate is increased to its desired value, and then the gas velocity is adjusted. Finally, the carbon dioxide/nitrogen mixture is fed to the recycle gas, and the sample flows from the reactor inlet and outlet to the analyzer are adjusted. When the carbon dioxide fraction at the reactor inlet and outlet has become steady or changes are relatively
Vol. 37, No. 12 1851

slow compared to the response time of the infrared analyzer, the carbon dioxide conversion is determined. During successive experiments, the liquid velocity is increased stepwise while keeping the gas velocity constant. To check for possible hys- teresis phenomena, we also performed runs in which the liquid velocity is decreased after reaching its maximum.
Chemical System In the literature, the reaction between carbon dioxide and
alkanolamines and between oxygen and aqueous sodium sulfite solutions catalyzed by cobalt ions are often used as model reactions to determine gas-liquid interfacial areas. Oyevaar et al. (1988) outlined the advantages and the disadvantages of both model reactions. We selected the C0,-alkanolam' me re- actions mainly because they are not restricted to aqueous so- lutions, but organic and viscous solvents can be used as well (see Shridharan and Sharma, 1976; Oyevaar et al., 1990). The overall reaction of secondary alkanolamines with C 0 2 is:
The reaction order in CO, is one, whereas the order in the amine depends on its concentration and has a value between 1 and 2 (see Versteeg and Van Swaaij, 1988). The Hatta number can be varied by choosing the amine type and its concentration. The maximum possible enhancement factor Eco,,, can be var- ied by the partial pressure of CO,.
The absorption experiments were performed with 2-M di- ethanol amine in water and with 1.5-M DEA in aqueous 40% ethylene glycol. An aqueous commercial-grade 80 vol. Vo DEA solution with a purity of 2 98070, supplied by BASF, has been used. The physical properties and the kinetic data have been taken from Oyevaar et al. (1989a,b, 1990) and are listed in Table 1. The volume fraction of C 0 2 at the reactor inlet was less than 0.5 vol. Yo. With these concentrations, the gas mass flux was practically constant. The DEA conversions were kept below 12%, so the amine concentration and the Hatta number were approximately constant.
To fulfill the conditions given by Eqs. 3 and 4, we selected the amine type, the amine concentration, and the fraction C 0 2 at the reactor inlet, on the basis of literature data for kl values (see, for example, Gianetto and Silveston, 1986) under trickle- flow conditions with water. By means of the Stokes-Einstein relation, D1 x vl =constant, and by taking kl proportional to D,'12 as predicted by the penetration theory, we estimated kl values for a liquid viscosity of 1.7 x lo-' and 4 x Pa.s to be in the range of 5 x lo-' to 5 x to 2x m/s, respectively. These estimates are in good agree- ment with those made on the basis on relations analogous to Eqs. 8 and 9.
For 2 < H a s 10 EA,m the condition of no gas mass transfer limitation (see Eq. 2) can be written as k,r 10 m ( kl,p~P,,l DA,l ) ' I2 . In the literature, data on k, values for the trickle-flow regime are scarce. Therefore, we estimated k, by means of the expression for the mass transfer coefficient as given by the penetration theory:
m/s and 2 x
in which the contact time rc was taken to be:
(9)
The liquid holdup at elevated pressures can be determined by the correlation given in Part 2. This results in values of k , r 4 x lo-, m/s for v,> 5 cm/s under atmospheric conditions. Hence, for atmospheric pressure, the condition given by Eq. 2 has been met. However, at elevated pressures, the gas-side mass transfer coefficient might decrease because the diffusion coefficient D, is inversely proportional to the gas-phase den- sity. In stirred-cell experiments in the pressure range 0.1-1 .O MPa, Versteeg et al. (1987) found kg inversely proportional to P:', as predicted by the penetration theory (see Eq. 8). On the basis of these considerations, the gas-side mass transfer re- sistance for the aqueous and for the viscous system can be neglected for pressures at least up to 1.5 MPa and 6.0 MPa, respectively. In the case that the gas-side mass transfer resist- ance cannot be neglected, the calculated a,, by Eq. 6 will be underestimated by a factor 1 + m( kl,pcB,IpDA,I I ' I 2 / k 8 .
We did not consider the fact that the reactions between alkanolamines and CO, are reversible. On the basis of the numerical absorption model derived by Versteeg et al. (1989), which accounts for reversibility, it has been concluded that for our DEA concentrations, DEA conversions, and partial pres- sures of CO,, the reaction can be considered irreversible.
Results and Discussion
Foam formation In the absorption experiments with the aqueous 2-M DEA
solution, we observed foam formation under specific operating conditions. This could be concluded from the sharp increase in the C 0 2 conversion and in the pressure drop over the packed bed. Besides, beyond this transition, liquid was entrained in the gas sample flow taken at the reactor outlet. The resulting low CO, concentrations are difficult to measure accurately and can be partially attributed to absorption in the gas sample pipe. To suppress the formation of foam, a volume of 15-mL olei- calcohol-an antifoam agent-was added to the 100-L aqueous 2-M DEA solution. Foaming did not occur in the experiments with the solution of 1.5-M DEA in aqueous 40% ethylene glycol.
Hysteresis The experimental runs, in which the liquid throughput has
been increased to its maximum value and decreased afterward, showed that the aqueous 2-M DEA solution with antifoam agent and 3-mm glass spheres exhibits hysteresis. This has not been found for the viscous system and ceramic cylinders. Figure 2 shows an example of the observed hysteresis, in which the dimensionless gas-liquid interfacial area, a,,/as and the pressure gradient have been plotted as a function of the superficial liquid velocity for two different gas velocities at 0.5 MPa. The values of a,, and AP/L for increasing throughputs are lower than decreasing throughputs, up to a particular liquid velocity. Levec
1852 December 1991 Vol. 37, No. 12 AIChE Journal

0.8 4 I
0.6
0.2
0.0 60
Vg(m/s) mode 0 0.10 increase o 0.10 decrease
0.25 increase 0.25 decrease
0 : I I I I 0 4 8 12
v1 ( x 1 ~ 3 m / s )
Figure 2. Hysteresis of the hydrodynamics of the aqueous 2-M DEAlantifoam-3-mm glass spheres system at P,= 0.5 MPa.
et al. (1986) and Christensen et al. (1986) also reported higher values of the pressure gradient for the decreasing mode of operation. Besides, the same behavior was found for the liquid holdup. On the basis of visual observations at the reactor wall, Christensen et al. (1986) concluded that at increasing flow rates, the liquid phase flows in the form of rivulets through the packing. This results in relatively low values of the holdup and pressure drop. As the liquid throughput increases, the holdup becomes larger and at a particular throughput a tran- sition to film flow occurs. If throughput is decreased again, the film flow pattern remains stable down to a lower through- put before the film breaks up into rivulets. This results in the hysteresis for the holdup and the pressure gradient. The dif- ference in the liquid film stability between both modes of operation has been attributed to contact angle hysteresis (see Levec et al., 1986). Our experimental finding, that the specific interfacial area is larger at the decreasing mode of operation, supports their visual observations of the two flow patterns at the wall area. In case of rivulet flow, less gas-liquid contact area is created in comparison to film flow at equal flow rates.
In a previous study (see Wammes et al., 1990a), we found no hysteresis for the holdup and the pressure drop in a packed bed consisting of 3-mm glass spheres from the same thoroughly cleaned batch as used in this study. Wammes et al. (1990a) concluded that, independent of the mode of operation, film flow was established. Rivulet flow is likely to be caused by poor wetting properties of packing particles. The degree of wetting depends strongly on the free surface energy, which is sensitive to surface contaminations on the solid material (see Huttinger and Bauer, 1982). In the packed bed of glass spheres used in this study, hysteresis is observed due to the addition of the antifoam agent. We noticed that the oleicalcohol firmly
AIChE Journal December 1991
0.4
0.2
0.0
1 0 0 0.0 0 0 0.0 d
0 o w I H
0 - - V g ( W Pr(MPa) - 0 0.05 1.0 - 0 0.10 0.5 open symbols: viscous system A 0.25 0.5 closed symbols: aqueous system
I I . I ' 1 , I ' .
0 0.10
0 2 4 6 8 10 12 v1 ( x 1 ~ 3 d s )
Figure 3. Comparison of dimensionless interfacial areas of three-phase systems.
sticks to the glass surface, and therefore, wetting is reduced apparently. This is supported by residual liquid holdup ex- periments performed in a separate column with the same glass spheres. The residual holdup was about 40% lower compared to the residual holdup determined after cleaning the packing.
Interfacial areas and flow rates The dimensionless interfacial areas u,,/a, of both systems
are compared in Figure 3 as a function of u, and varying operating conditions of v, and P,. In the case of the aqueous system, we plotted only the interfacial areas determined at superficial liquid velocities larger than 6 mm/s; under these conditions, the hysteresis of a,/ is absent or negligible. Figure 3 also shows that the interfacial area of the viscous system sharply increases for low liquid velocities, which is likely due to a sharp increase of the liquid holdup. Wammes et al. (1990a) found that the liquid holdup of an aqueous 40% ethylene glycol solution, 7 = 2.9 Ns/m2, indeed sharply rises in the liquid ve- locity range up to u, = 3 mm/s. In cases of less viscous liquids such as water, the holdup increases more gradually with in- creasing liquid throughput. Furthermore, the figure shows that the dimensionless interfacial areas for both liquids of different viscosity are approximately equal under equal operating con- ditions (see also Table 1). Mahajani and Sharma (1979) found no significant differences between specific gas-liquid interfacial areas of aqueous and nonaqueous, and of polar as well as nonpolar liquids under trickle-flow conditions. However, in case changes in the gas-liquid flow pattern are induced by varying liquid-phase properties, for instance, nonfoaming vs. foaming, the interfacial areas can become completely different (see Morsi et al., 1982).
The dependence of the dimensionless interfacial areas of the viscous system on the superficial gas velocity at a reactor pres- sure of 2.5 MPa and for varying superficial liquid velocities is given in Figure 4. It shows that the interfacial area increases with up, whereas the influence of the liquid throughput (see also Figures 3 and 5 ) is much less pronounced. The same effect has also been found at other pressures and for the aqueous system as well. Mahajani and Sharma (1979) reported the same behavior for aqueous solutions and carbon pellets or granules at atmospheric pressure.
Vol. 37, No. 12 1853

gl a
as 0.6 -
0.4 -
0.2 -
0.8 -
as 0.6 -
0.4 -
0.2 -
a g l -
I 0
I 0
B !I y (x1~-3m/s)
0 2.0 4.0 6.0
= 8.0
0.01 ' I ' I ' I ' I ' 1 * I
vg (ds) 0.00 0.05 0.10 0.15 0.20 0.25 0.30
Figure 4. Effect of superficial gas velocity at superficial liquid velocities on the dimensionless inter- facial area of the viscous system at 2.5 MPa.
Interfacial areas and gas density A typical example of the influence of the gas density on the
dimensionless interfacial area a,,/a, is shown in Figure 5. In- stead of taking the pressure as the independent variable, we have used the gas density. As described in Part 2, we studied the holdup, the pressure drop and the flow-regime transitions at various reactor pressures as well as with gases of different molar mass. It was concluded that these hydrodynamic vari- ables, and therefore probably also the interfacial area, depend on the density of the gas phase and not on the pressure itself. The figure shows that at increasing gas density, the gas-liquid interfacial area also increases. We also performed absorption experiments in the reactor pressure range for which the re- sistance of the carbon dioxide transport through the gas phase to the interfacial area plays a role based on the estimates of Eqs. 8 and 9. At a high gas velocity of u, = 0.25 m/s, the conversion remained practically constant with increasing pres- sure. At u,=O.OS m/s, for which the gas-side mass transfer coefficient k, is lower (see Vidwans and Sharma, 1967), the C 0 2 conversion noticeably decreased. This indicates that kg indeed decreases at higher gas densities and that it reduces the
8
Vg = 0.25 m/s vg = 0.10 m/s 0 V1 = 11.9 mm/s
V1 = 8.4 mm/s V1 = 4.0 mm/s
overall mass transfer rate when the condition given by Eq. 2 is not fulfilled.
General remarks Within the range of our operating conditions, the gas-liquid
interfacial areas are between 25% and 80% of the geometric packing area for both of the three-phase systems with different liquid viscosities. The lower dimensionless interfacial areas are obtained at low gas velocities and pressures. Values for agl/a, of about 0.25 and even below 0.1 are reported by Midoux et al. (1984) for several amine solutions at low gas velocities under the atmospheric pressure. Apparently, under these conditions, the packed bed is not used effectively to create the gas-liquid contact area. Increasing the shear stress on the gas-liquid in- terface by means of higher gas velocities or pressures results in an improved spreading of the liquid holdup over the external packing area.
In the pulse-flow regime, the interfacial areas exceed the geometric area (see, for example, Hirose et al., 1974) due to the large contribution of gas bubbles in the liquid pulses. The values of the interfacial areas found in this study, therefore, suggest that the absorption experiments have been executed in the trickle-flow regime. It was found that there were no great changes in the interfacial area with increasing pressures, and hence no transition to pulse flow occurred. These findings support the results of Wammes et al. (1990b) on the influence of gas density on the transition between trickle llow and pulse flow that for the reactor operating in the trickle-flow regime, a transition to pulse flow cannot be obtained by increasing the gas density, since the operating region for trickle flow becomes larger at higher gas densities.
Conclusions Gas-liquid interfacial areas have been determined for co-
current gas-liquid downflow operation with the aqueous 2-M diethanolamine-3-mm glass spheres system and with the 1.5- M diethanolamine in aqueous 40% ethylene glycol-3.2 X 3.2 porous alumina cylinders system by means of chemically en- hanced carbon dioxide absorption. Nitrogen has been used as the carrier gas. The maximum operating pressure in the ex- perimental setup was 7.0 MPa.
The aqueous system had a tendency to foam. This was sup- pressed by adding a small amount of antifoam agent to the solution. The gas-liquid interfacial areas of the aqueous system with antifoam agent exhibited hysteresis in contrast to the more viscous system. It was concluded from residual liquid holdup experiments that hysteresis occurs due to poor liquid-solid contacting properties.
The dimensionless interfacial areas agl/as were in the range 0.25-0.8. A comparison of both of the three-phase systems, which differ by a factor 2.3 in liquid viscosity, shows that the dimensionless interfacial areas are approximately the same un- der equal operating conditions. At elevated gas densities, the interfacial area increases at higher gas and liquid velocities. This finding does not differ from the observations made at atmospheric pressure of previous investigators. The effect of elevated gas densities is that the area for gas-liquid mass trans- fer becomes larger.
Vol. 37, No. 12 AIChE Journal
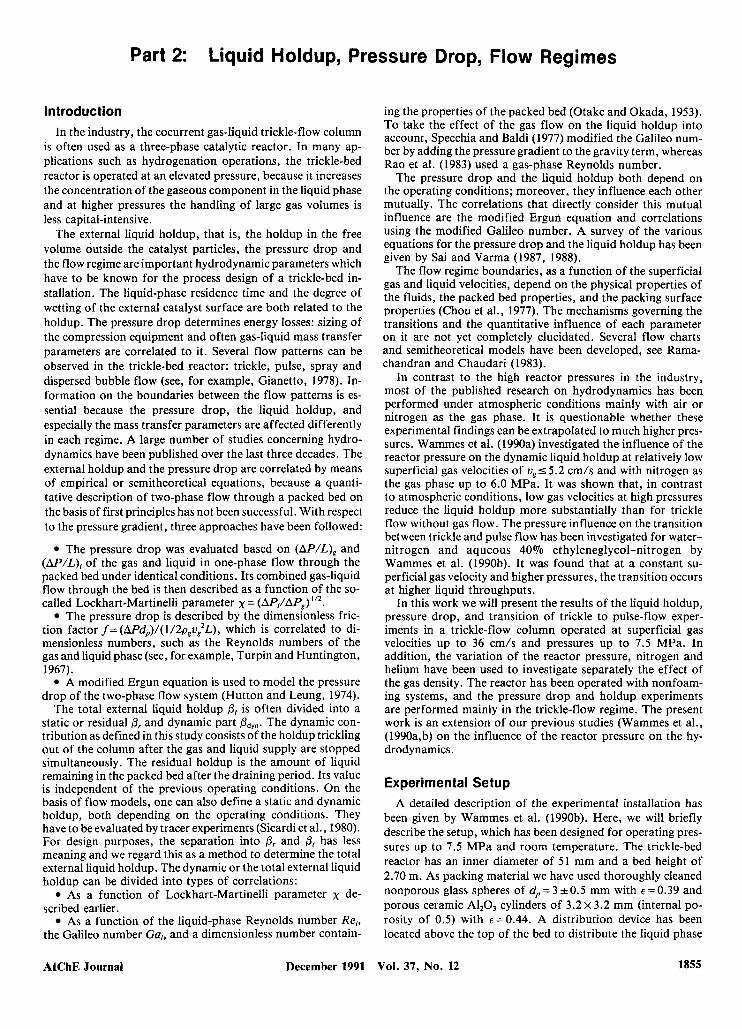
Part 2: Liquid Holdup, Pressure Drop, Flow Regimes
Introduction In the industry, the cocurrent gas-liquid trickle-flow column
is often used as a three-phase catalytic reactor. In many ap- plications such as hydrogenation operations, the trickle-bed reactor is operated at an elevated pressure, because it increases the concentration of the gaseous component in the liquid phase and at higher pressures the handling of large gas volumes is less capital-intensive.
The external liquid holdup, that is, the holdup in the free volume outside the catalyst particles, the pressure drop and the flow regime are important hydrodynamic parameters which have to be known for the process design of a trickle-bed in- stallation. The liquid-phase residence time and the degree of wetting of the external catalyst surface are both related to the holdup. The pressure drop determines energy losses: sizing of the compression equipment and often gas-liquid mass transfer parameters are correlated to it. Several flow patterns can be observed in the trickle-bed reactor: trickle, pulse, spray and dispersed bubble flow (see, for example, Gianetto, 1978). In- formation on the boundaries between the flow patterns is es- sential because the pressure drop, the liquid holdup, and especially the mass transfer parameters are affected differently in each regime. A large number of studies concerning hydro- dynamics have been published over the last three decades. The external holdup and the pressure drop are correlated by means of empirical or semitheoretical equations, because a quanti- tative description of two-phase flow through a packed bed on the basis of first principles has not been successful. With respect to the pressure gradient, three approaches have been followed:
The pressure drop was evaluated based on (AP/L), and (AJJ/L), of the gas and liquid in one-phase flow through the packed bed under identical conditions. Its combined gas-liquid flow through the bed is then described as a function of the so- called Lockhart-Martinelli parameter x = (AJJ,/AP,)
The pressure drop is described by the dimensionless fric- tion factor f = (APdp)/(l/2p,u~L), which is correlated to di- mensionless numbers, such as the Reynolds numbers of the gas and liquid phase (see, for example, Turpin and Huntington, 1967).
A modified Ergun equation is used to model the pressure drop of the two-phase flow system (Hutton and Leung, 1974).
The total external liquid holdup @, is often divided into a static or residual @, and dynamic part &,.,,. The dynamic con- tribution as defined in this study consists of the holdup trickling out of the column after the gas and liquid supply are stopped simultaneously. The residual holdup is the amount of liquid remaining in the packed bed after the draining period. Its value is independent of the previous operating conditions. On the basis of flow models, one can also define a static and dynamic holdup, both depending on the operating conditions. They have to be evaluated by tracer experiments (Sicardi et al., 1980). For design purposes, the separation into 0, and @, has less meaning and we regard this as a method to determine the total external liquid holdup. The dynamic or the total external liquid holdup can be divided into types of correlations:
As a function of Lockhart-Martinelli parameter x de- scribed earlier.
As a function of the liquid-phase Reynolds number Re,, the Galileo number Gal, and a dimensionless number contain-
AIChE Journal December 1991
ing the properties of the packed bed (Otake and Okada, 1953). To take the effect of the gas flow on the liquid holdup into account, Specchia and Baldi (1977) modified the Galileo num- ber by adding the pressure gradient to the gravity term, whereas Rao et al. (1983) used a gas-phase Reynolds number.
The pressure drop and the liquid holdup both depend on the operating conditions; moreover, they influence each other mutually. The correlations that directly consider this mutual influence are the modified Ergun equation and correlations using the modified Galileo number. A survey of the various equations for the pressure drop and the liquid holdup has been given by Sai and Varma (1987, 1988).
The flow regime boundaries, as a function of the superficial gas and liquid velocities, depend on the physical properties of the fluids, the packed bed properties, and the packing surface properties (Chou et al., 1977). The mechanisms governing the transitions and the quantitative influence of each parameter on it are not yet completely elucidated. Several flow charts and semitheoretical models have been developed, see Rama- chandran and Chaudari (1983).
In contrast to the high reactor pressures in the industry, most of the published research on hydrodynamics has been performed under atmospheric conditions mainly with air or nitrogen as the gas phase. It is questionable whether these experimental findings can be extrapolated to much higher pres- sures. Wammes et al. (1990a) investigated the influence of the reactor pressure on the dynamic liquid holdup at relatively low superficial gas velocities of ~ ~ 5 5 . 2 cm/s and with nitrogen as the gas phase up to 6.0 MPa. It was shown that, in contrast to atmospheric conditions, low gas velocities at high pressures reduce the liquid holdup more substantially than for trickle flow without gas flow. The pressure influence on the transition between trickle and pulse flow has been investigated for water- nitrogen and aqueous 40% ethyleneglycol-nitrogen by Wammes et al. (1990b). It was found that at a constant su- perficial gas velocity and higher pressures, the transition occurs at higher liquid throughputs.
In this work we will present the results of the liquid holdup, pressure drop, and transition of trickle to pulse-flow exper- iments in a trickle-flow column operated at superficial gas velocities up to 36 cm/s and pressures up to 7.5 MPa. In addition, the variation of the reactor pressure, nitrogen and helium have been used to investigate separately the effect of the gas density. The reactor has been operated with nonfoam- ing systems, and the pressure drop and holdup experiments are performed mainly in the trickle-flow regime. The present work is an extension of our previous studies (Wammes et al., (1990a,b) on the influence of the reactor pressure on the hy- drodynamics.
Experimental Setup A detailed description of the experimental installation has
been given by Wammes et al. (1990b). Here, we will briefly describe the setup, which has been designed for operating pres- sures up to 7.5 MPa and room temperature. The trickle-bed reactor has an inner diameter of 51 mm and a bed height of 2.70 m. As packing material we have used thoroughly cleaned nonporous glass spheres of dp = 3 &0.5 mm with E = 0.39 and porous ceramic A120, cylinders of 3.2 x 3.2 mm (internal po- rosity of 0.5) with ~ = 0 . 4 4 . A distribution device has been located above the top of the bed to distribute the liquid phase
Vol. 37, No. 12 1855
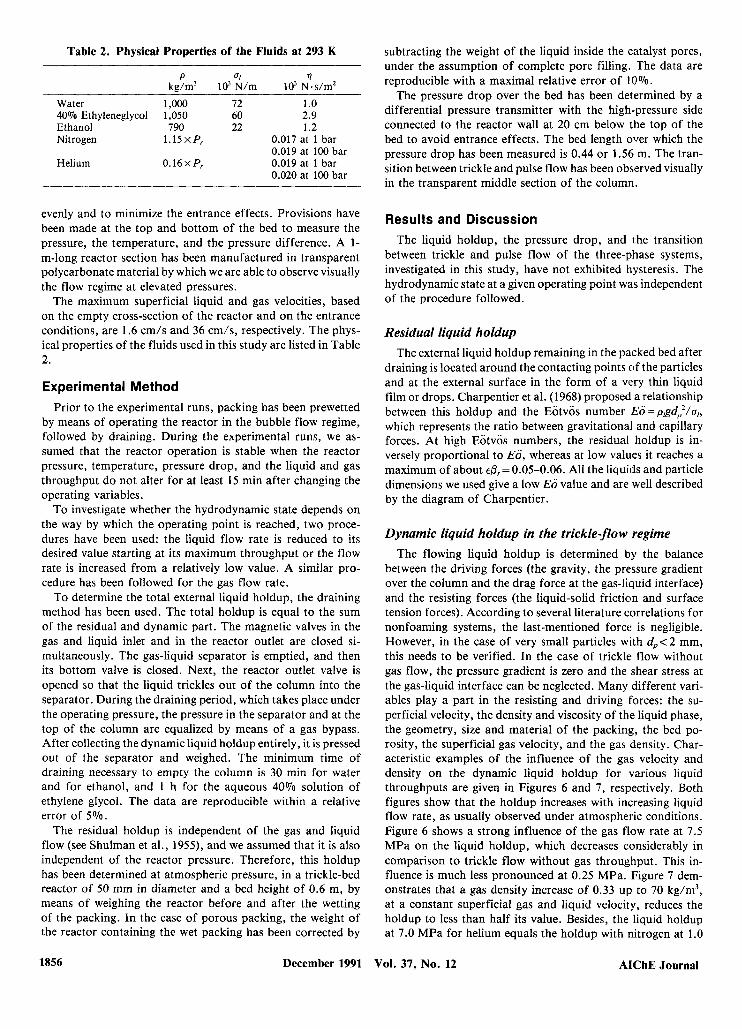
Table 2. Physical Properties of the Fluids at 293 K subtracting the weight of the liquid inside the catalyst pores, under the assumption of complete pore filling. The data are
P c/ 1) k d m ’ 10’ N/m lo3 N.s/m*
Water 1 ,OOo 72 1 .o 40% Ethyleneglycol 1,050 60 2.9 Ethanol 790 22 1.2 Nitrogen 1.15xP, 0.017 at 1 bar
Helium 0.16xP, 0.019 at 1 bar 0.019 at 100 bar
0.020 at 100 bar
evenly and to minimize the entrance effects. Provisions have been made at the top and bottom of the bed to measure the pressure, the temperature, and the pressure difference. A 1- m-long reactor section has been manufactured in transparent polycarbonate material by which we are able to observe visually the flow regime at elevated pressures.
The maximum superficial liquid and gas velocities, based on the empty cross-section of the reactor and on the entrance conditions, are 1.6 cm/s and 36 cm/s, respectively. The phys- ical properties of the fluids used in this study are listed in Table 2.
Experimental Method Prior to the experimental runs, packing has been prewetted
by means of operating the reactor in the bubble flow regime, followed by draining. During the experimental runs, we as- sumed that the reactor operation is stable when the reactor pressure, temperature, pressure drop, and the liquid and gas throughput do not alter for at least 15 min after changing the operating variables.
To investigate whether the hydrodynamic state depends on the way by which the operating point is reached, two proce- dures have been used: the liquid flow rate is reduced to its desired value starting at its maximum throughput or the flow rate is increased from a relatively low value. A similar pro- cedure has been followed for the gas flow rate.
To determine the total external liquid holdup, the draining method has been used. The total holdup is equal to the sum of the residual and dynamic part. The magnetic valves in the gas and liquid inlet and in the reactor outlet are closed si- multaneously. The gas-liquid separator is emptied, and then its bottom valve is closed. Next, the reactor outlet valve is opened so that the liquid trickles out of the column into the separator. During the draining period, which takes place under the operating pressure, the pressure in the separator and at the top of the column are equalized by means of a gas bypass. After collecting the dynamic liquid holdup entirely, it is pressed out of the separator and weighed. The minimum time of draining necessary to empty the column is 30 min for water and for ethanol, and 1 h for the aqueous 40% solution of ethylene glycol. The data are reproducible within a relative error of 5 % .
The residual holdup is independent of the gas and liquid flow (see Shulman et al., 1955), and we assumed that it is also independent of the reactor pressure. Therefore, this holdup has been determined at atmospheric pressure, in a trickle-bed reactor of 50 mm in diameter and a bed height of 0.6 m, by means of weighing the reactor before and after the wetting of the packing. In the case of porous packing, the weight of the reactor containing the wet packing has been corrected by
reproducible with a maximal relative error of 10%. The pressure drop over the bed has been determined by a
differential pressure transmitter with the high-pressure side connected to the reactor wall at 20 cm below the top of the bed to avoid entrance effects. The bed length over which the pressure drop has been measured is 0.44 or 1.56 m. The tran- sition between trickle and pulse flow has been observed visually in the transparent middle section of the column.
Results and Discussion The liquid holdup, the pressure drop, and the transition
between trickle and pulse flow of the three-phase systems, investigated in this study, have not exhibited hysteresis. The hydrodynamic state at a given operating point was independent of the procedure followed.
Residual liquid holdup The external liquid holdup remaining in the packed bed after
draining is located around the contacting points of the particles and at the external surface in the form of a very thin liquid film or drops. Charpentier et al. (1968) proposed a relationship between this holdup and the Eotvos number EO = p,gd;/u,, which represents the ratio between gravitational and capillary forces. At high Eotvos numbers, the residual holdup is in- versely proportional to EO, whereas at low values it reaches a maximum of about c&= 0.05-0.06. All the liquids and particle dimensions we used give a low EO value and are well described by the diagram of Charpentier.
Dynamic liquid holdup in the trickle-flow regime The flowing liquid holdup is determined by the balance
between the driving forces (the gravity, the pressure gradient over the column and the drag force at the gas-liquid interface) and the resisting forces (the liquid-solid friction and surface tension forces). According to several literature correlations for nonfoaming systems, the last-mentioned force is negligible. However, in the case of very small particles with d,<2 mm, this needs to be verified. In the case of trickle flow without gas flow, the pressure gradient is zero and the shear stress at the gas-liquid interface can be neglected. Many different vari- ables play a part in the resisting and driving forces: the su- perficial velocity, the density and viscosity of the liquid phase, the geometry, size and material of the packing, the bed po- rosity, the superficial gas velocity, and the gas density. Char- acteristic examples of the influence of the gas velocity and density on the dynamic liquid holdup for various liquid throughputs are given in Figures 6 and 7, respectively. Both figures show that the holdup increases with increasing liquid flow rate, as usually observed under atmospheric conditions. Figure 6 shows a strong influence of the gas flow rate at 7.5 MPa on the liquid holdup, which decreases considerably in comparison to trickle flow without gas throughput. This in- fluence is much less pronounced at 0.25 MPa. Figure 7 dem- onstrates that a gas density increase of 0.33 up to 70 kg/m3, at a constant superficial gas and liquid velocity, reduces the holdup to less than half its value. Besides, the liquid holdup at 7.0 MPa for helium equals the holdup with nitrogen at 1.0
1856 December 1991 Vol. 37, No. 12 AIChE Journal

0.5
0.4
0.3
0.2
0.1
dyn 8 -
- V1 Water-He-3.2x3.2 mm I 2mm/s
Water - 3mm glass spheres - He, N21
Vg(m/s) Pr (MPa) A 0 - He, N2 O 0.10 0.5 He
0.10 6.0 He 0.36 6.0 He
0.0 1 I I I 4 0 0.1 0.2 0.3 0.4
vg (m/s) Figure 6. Effect of superficial gas velocity on liquid
holdup for superficial liquid velocities at el- evated pressures.
MPa having the same gas density of 11.5 kg/m3. This obser- vation also holds for the pressure gradient. The two figures show that the extrapolation of holdup correlations, derived from trickle-flow experiments without gas flow to high-pres- sure trickle-flow columns, can lead to large overestimations.
The influence of the gas velocity and gas density on the holdup can be explained quantitatively by means of the drag force at the gas-liquid interface and the pressure gradient over the bed in relation to the gravitational force. From an overall force balance of the liquid and of the gas phase (see the Ap- pendix), it can be derived that:
The influence of the gas density and of the gas velocity on the holdup is accounted for in the pressure drop AP. The ratio of AP/L to p,g determines whether the gas phase has a noticeable influence or not. In Figure 8, the effect of the ratio A P / ( p l g L ) on the liquid holdup is illustrated by the system water-3-mm
0.5
0.4
Pdyn 0.3
0.2
* vg = 0.1 m/s 1
10 mrnjs
T
Ethanol-3.2x3.2 mm-He, N2 vg = 0.1 m/s . v1
10 mrnjs helium as
gas phase
.1 Pg(kg/m3) lo 100
Figure 7. Effect of gas density on liquid holdup for su- perficial liquid velocities.
O:; 0.5
0.0 1 0 2 4 6 8 10 12
v1 ( x 1 ~ 3 m / s )
Figure 8. Effect of the ratio of pressure drop to gravity on the liquid holdup.
glass spheres and with nitrogen or helium. The data for v, = 0 have been taken from Wammes et al. (1990a). Three different cases can be distinguished:
Without gas flow, the ratio is zero. The gravitational force is the only driving force and the liquid holdup is maximal (see Eq. 1 and Figure 8).
In the case when AP/ (p ,gL) is smaller than about 0.1, as for low gas velocities and densities, such as v, = 0.1 m/s at 0.5 MPa helium, the gas phase does not influence the liquid holdup.
3. At high gas mass fluxes, due to an increase in v, and/or p,, the value of the pressure gradient becomes signif- icant in relation to the gravitational force. The total driving force increases, and consequently the liquid holdup decreases.
In describing quantitatively the influence of the various vari- ables on the liquid holdup in the trickle-flow regime, emphasis has been given to how the gas-phase effect is considered. In the equations using the Lockhart-Martinelli parameter x, the effect of pg and v, is taken into account by the term (AP/L),, representing the pressure drop in the case of gas flow through the bed without the presence of liquid. To calculate (AP/L), and (AP/L)[, the Ergun-equation has been applied, in which we substituted the laminar and turbulent terms by the values experimentally determined for the packed beds used in this study. The different forms of equations with the parameter x are listed by Sai and Varma (1988). We have optimized the constants and exponents in the equations given by them, by minimizing the sum of the squared holdup residuals. Generally, these results show that for high gas velocities and densities,
1.
2.
AIChE Journal December 1991 Vol. 37, No. 12 1857
the holdup is underestimated. This is because x decreases to zero, and consequently also the calculated holdup becomes zero. At very low values of u, and p,, x becomes large and therefore the correlations overestimate the holdup, especially at low liquid velocities. Moreover, in using the parameter x to describe the holdup, it is not possible to take the limiting case of trickle flow without gas flow into account. The Lockhart- Martinelli approach to the description of the holdup in packed beds at elevated pressures appears not to be applicable.
The holdup of trickle flow without gas flow has often been successfully described as proportional to the power product RePGaPP‘ (see, for example, Whitaker and Cassano, 1986). The dimensionless number Pconsists of packed-bed properties.
To take the influence of the gas throughput into account, a modified Galileo number can be defined as:
When the pressure drop is smaller than prg, say AP/(prgL) < 0.1, the influence of the gas flow on the holdup can be neglected and Ga’ = Ga,. On the other hand, if AP/(p,gL) >> 1, the in- fluence of the gravitational force on the holdup can be ne- glected and then Gaa=d,’pr/q:AP/L. We have tested the applicability of the product RepGaabPc to our three-phase sys- tems in the ranges of superficial velocities 0 I u, I 36 cm/s and 0.21u,1 1.6 cm/s, and of gas densities between 0.331~~186 kg/m3. On the basis of our data set, consisting of 220 holdup measurements in the trickle-flow regime, the following cor- relation has been derived:
Pdyn = 3.8 (!?!?) 0 ’55 [ (1 + s) ] ($) 0.65 (3)
The dimensionless groups varied between: 21Re,s 55, 3 . 2 ~ 1 0 3 r G a , ~ 0 . 3 2 x lo6 and OsAP/(p,gL)116. The same correlation was derived in Wammes et al. (1990a), but in that study AP/(prgL) 5 1.8.
The dimensionless number to describe the influence of the packed bed characteristics on the holdup has been taken from Specchia and Baldi (1977) because only two different packings
+ 2”/5
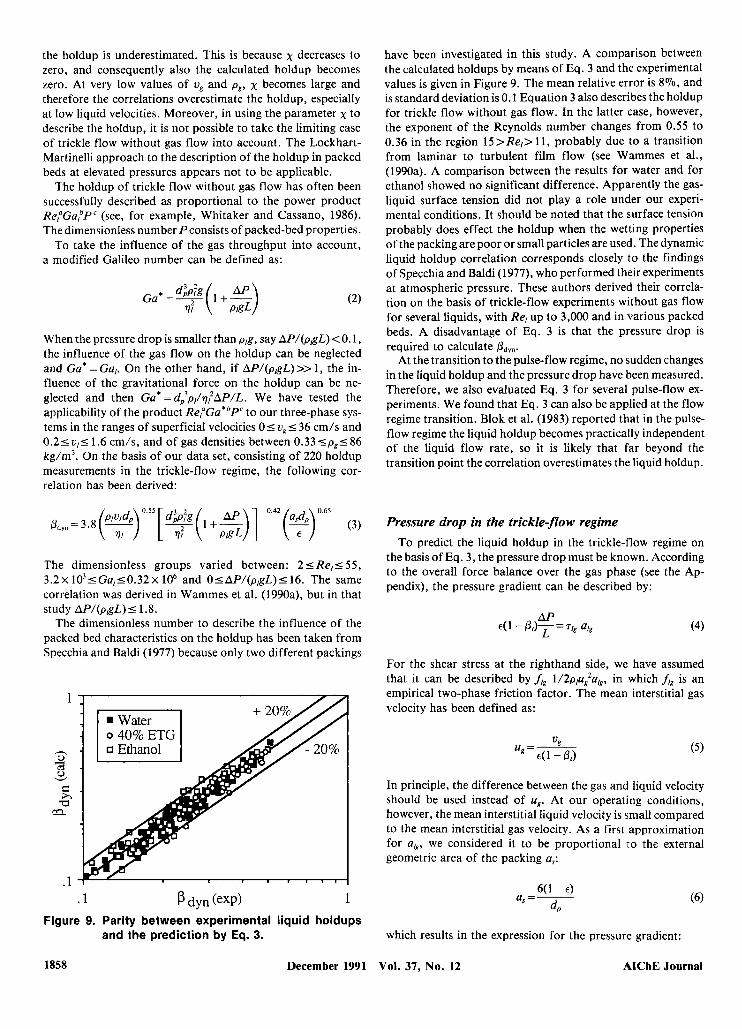
.1 P dyn (exP) 1
Figure 9. Parity between experimental liquid holdups and the prediction by Eq. 3.
have been investigated in this study. A comparison between the calculated holdups by means of Eq. 3 and the experimental values is given in Figure 9. The mean relative error is 8%, and is standard deviation is 0.1 Equation 3 also describes the holdup for trickle flow without gas flow. In the latter case, however, the exponent of the Reynolds number changes from 0.55 to 0.36 in the region 15>Rer> 11, probably due to a transition from laminar to turbulent film flow (see Wammes et al., (1990a). A comparison between the results for water and for ethanol showed no significant difference. Apparently the gas- liquid surface tension did not play a role under our experi- mental conditions. It should be noted that the surface tension probably does effect the holdup when the wetting properties of the packing are poor or small particles are used. The dynamic liquid holdup correlation corresponds closely to the findings of Specchia and Baldi (1977), who performed their experiments at atmospheric pressure. These authors derived their correla- tion on the basis of trickle-flow experiments without gas flow for several liquids, with Re, up to 3,000 and in various packed beds. A disadvantage of Eq. 3 is that the pressure drop is required to calculate PdP.
At the transition to the pulse-flow regime, no sudden changes in the liquid holdup and the pressure drop have been measured. Therefore, we also evaluated Eq. 3 for several pulse-flow ex- periments. We found that Eq. 3 can also be applied at the flow regime transition. Blok et al. (1983) reported that in the pulse- flow regime the liquid holdup becomes practically independent of the liquid flow rate, so it is likely that far beyond the transition point the correlation overestimates the liquid holdup.
Pressure drop in the trickle-flow regime To predict the liquid holdup in the trickle-flow regime on
the basis of Eq. 3, the pressure drop must be known. According to the overall force balance over the gas phase (see the Ap- pendix), the pressure gradient can be described by:
E(1- (4)
For the shear stress at the righthand side, we have assumed that it can be described by f,, 1/2p,u~ar,, in which fi, is an empirical two-phase friction factor. The mean interstitial gas velocity has been defined as:
In principle, the difference between the gas and liquid velocity should be used instead of up. At our operating conditions, however, the mean interstitial liquid velocity is small compared to the mean interstitial gas velocity. As a first approximation for arg, we considered it to be proportional to the external geometric area of the packing a,:
6( 1 - E) a, = -
4 which results in the expression for the pressure gradient:
1858 December 1991 Vol. 37, No. 12 AIChE Journal
(7)
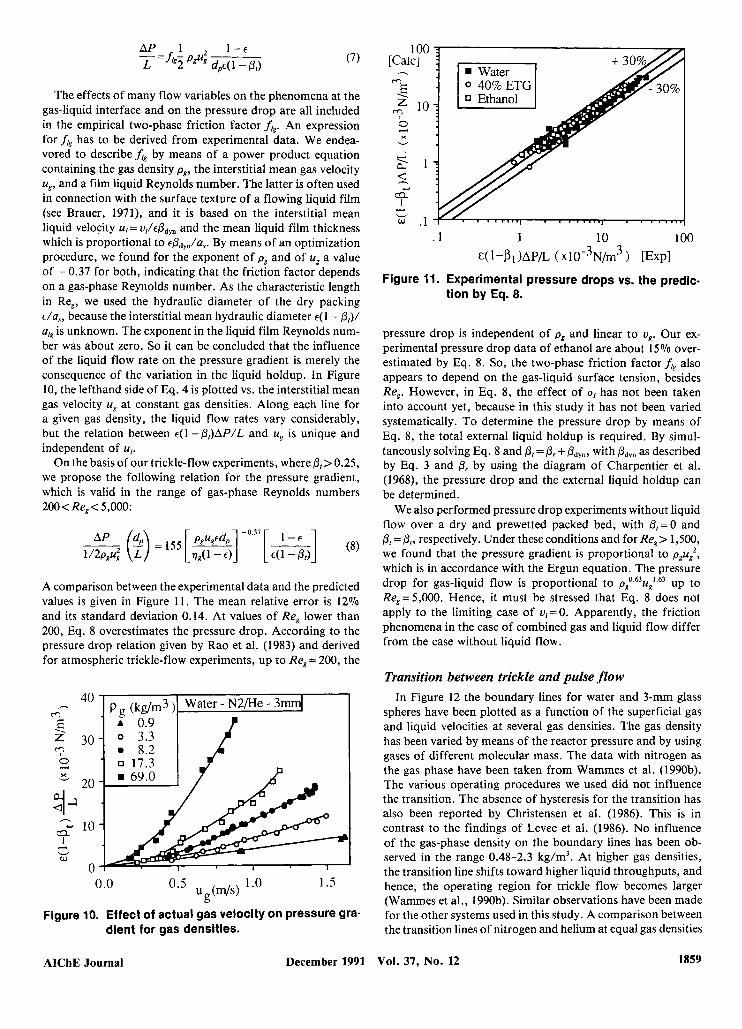
The effects of many flow variables on the phenomena at the gas-liquid interface and on the pressure drop are all included in the empirical two-phase friction factor A,. An expression for &, has to be derived from experimental data. We endea- vored to describe &, by means of a power product equation containing the gas density p,, the interstitial mean gas velocity ug, and a film liquid Reynolds number. The latter is often used in connection with the surface texture of a flowing liquid film (see Brauer, 1971), and it is based on the interstitial mean liquid velocity ul = U//EPdyn and the mean liquid film thickness which is proportional to Epd,/as. By means of an optimization procedure, we found for the exponent of p , and of u, a value of - 0.37 for both, indicating that the friction factor depends on a gas-phase Reynolds number. As the characteristic length in Re,, we used the hydraulic diameter of the dry packing €/a,, because the interstitial mean hydraulic diameter ~ ( 1 - of)/ a/, is unknown. The exponent in the liquid film Reynolds num- ber was about zero. So it can be concluded that the influence of the liquid flow rate on the pressure gradient is merely the consequence of the variation in the liquid holdup. In Figure 10, the lefthand side of Eq. 4 is plotted vs. the interstitial mean gas velocity u, at constant gas densities. Along each line for a given gas density, the liquid flow rates vary considerably, but the relation between E( 1 - &)hp/L and ug is unique and independent of u,.
On the basis of our trickle-flow experiments, where p,>O.25, we propose the following relation for the pressure gradient, which is valid in the range of gas-phase Reynolds numbers 200<Reg<5,000:
A comparison between the experimental data and the predicted values is given in Figure 11. The mean relative error is 12% and its standard deviation 0.14. At values of Re, lower than 200, Eq. 8 overestimates the pressure drop. According to the pressure drop relation given by Rao et al. (1983) and derived for atmospheric trickle-flow experiments, up to Re, = 200, the
0.0 1.5
Figure 10. Effect of actual gas velocity on pressure gra- dient for gas densities.
100 [Calc] h
“E 1
$ 1
10 3 2 v
2 4-4
cl I - v w .1
. 1 1 10 100 E( 1-Pt)APL ( ~ l O - ~ N / r n ~ 1 [Expl
Figure 11. Experimental pressure drops vs. the predic- tion by Eq. 8.
pressure drop is independent of p p and linear to u,. Our ex- perimental pressure drop data of ethanol are about 15% over- estimated by Eq. 8. So, the two-phase friction factor &, also appears to depend on the gas-liquid surface tension, besides Re,. However, in Eq. 8, the effect of u/ has not been taken into account yet, because in this study it has not been varied systematically. To determine the pressure drop by means of Eq. 8, the total external liquid holdup is required. By simul- taneously solving Eq. 8 and 0, = p, + &yn, with Bdyn as described by Eq. 3 and 0, by using the diagram of Charpentier et al. (1968), the pressure drop and the external liquid holdup can be determined.
We also performed pressure drop experiments without liquid flow over a dry and prewetted packed bed, with & = O and 0, = p,, respectively. Under these conditions and for Re, > 1,500, we found that the pressure gradient is proportional to p,ul, which is in accordance with the Ergun equation. The pressure drop for gas-liquid flow is proportional to p,0.63u,’.63 up to Re, = 5,000. Hence, it must be stressed that Eq. 8 does not apply to the limiting case of q = O . Apparently, the friction phenomena in the case of combined gas and liquid flow differ from the case without liquid flow.
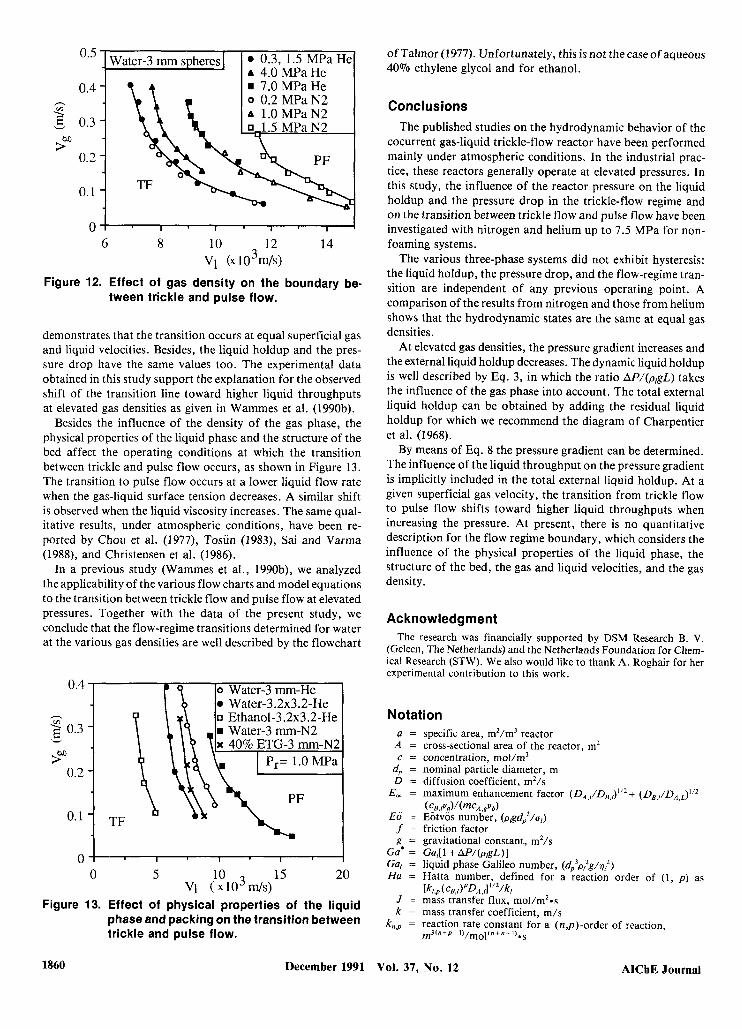
Transition between trickle and pulse flow In Figure 12 the boundary lines for water and 3-mm glass
spheres have been plotted as a function of the superficial gas and liquid velocities at several gas densities. The gas density has been varied by means of the reactor pressure and by using gases of different molecular mass. The data with nitrogen as the gas phase have been taken from Wammes et al. (1990b). The various operating procedures we used did not influence the transition. The absence of hysteresis for the transition has also been reported by Christensen et al. (1986). This is in contrast to the findings of Levec et al. (1986). No influence of the gas-phase density on the boundary lines has been ob- served in the range 0.48-2.3 kg/m3. At higher gas densities, the transition line shifts toward higher liquid throughputs, and hence, the operating region for trickle flow becomes larger (Wammes et al., 1990b). Similar observations have been made for the other systems used in this study. A comparison between the transition lines of nitrogen and helium at equal gas densities
AIChE Journal December 1991 Vol. 37, NO. 12 1859
0.5
0.4 h
3 0.3
0.2 P
0.1
A 1.0 MPaN2 _o 1.5 MPaN2
6 8 10 12 14 v1 (xl~3m)
Figure 12. Effect of gas density on the boundary be- tween trickle and pulse flow.
demonstrates that the transition occurs at equal superficial gas and liquid velocities. Besides, the liquid holdup and the pres- sure drop have the same values too. The experimental data obtained in this study support the explanation for the observed shift of the transition line toward higher liquid throughputs at elevated gas densities as given in Wammes et al. (1990b).
Besides the influence of the density of the gas phase, the physical properties of the liquid phase and the structure of the bed affect the operating conditions at which the transition between trickle and pulse flow occurs, as shown in Figure 13. The transition to pulse flow occurs at a lower liquid flow rate when the gas-liquid surface tension decreases. A similar shift is observed when the liquid viscosity increases. The same qual- itative results, under atmospheric conditions, have been re- ported by Chou et al. (1977), Tosun (1983), Sai and Varma (1988), and Christensen et al. (1986).
In a previous study (Wammes et al., 1990b), we analyzed the applicability of the various flow charts and model equations to the transition between trickle flow and pulse flow at elevated pressures. Together with the data of the present study, we conclude that the flow-regime transitions determined for water at the various gas densities are well described by the flowchart
0.4
2 0.3 v
0.2
0.1
o Water-3 mm-He 0 Water-3.2x3.2-He
TF
0 i 0 5 10 15 20 v1 ( x 1 ~ 3 d s )
Figure 13. Effect of physical properties of the liquid phase and packing on the transition between trickle and pulse flow.
of Talmor (1 977). Unfortunately, this is not the case of aqueous 40% ethylene glycol and for ethanol.
Conclusions The published studies on the hydrodynamic behavior of the
cocurrent gas-liquid trickle-flow reactor have been performed mainly under atmospheric conditions. In the industrial prac- tice, these reactors generally operate at elevated pressures. In this study, the influence of the reactor pressure on the liquid holdup and the pressure drop in the trickle-flow regime and on the transition between trickle flow and pulse flow have been investigated with nitrogen and helium up to 7.5 VPa for non- foaming systems.
The various three-phase systems did not exhibit hysteresis: the liquid holdup, the pressure drop, and the flow-regime tran- sition are independent of any previous operating point. A comparison of the results from nitrogen and those from helium shows that the hydrodynamic states are the same at equal gas densities.
At elevated gas densities, the pressure gradient increases and the external liquid holdup decreases. The dynamic liquid holdup is well described by Eq. 3, in which the ratio AP/(p,gL) takes the influence of the gas phase into account. The total external liquid holdup can be obtained by adding the residual liquid holdup for which we recommend the diagram of Charpentier et al. (1968).
By means of Eq. 8 the pressure gradient can be determined. The influence of the liquid throughput on the pressure gradient is implicitly included in the total external liquid holdup. At a given superficial gas velocity, the transition from trickle flow to pulse flow shifts toward higher liquid throughputs when increasing the pressure. At present, there is no quantitative description for the flow regime boundary, which considers the influence of the physical properties of the liquid phase, the structure of the bed, the gas and liquid velocities, and the gas density.
Acknowledgment The research was financially supported by DSM Research B. V.
(Geleen, The Netherlands) and the Netherlands Foundation for Chem- ical Research (STW). We also would like to thank A. Roghair for her experimental contribution to this work.
Notation a = specific area, m2/m3 reactor
A = cross-sectional area of the reactor, mz c = concentration, mol/m3
d,, = nominal particle diameter, m D = diffusion coefficient, m2/s
E , = maximum enhancement factor (Da,,/DB,l)”2 + (DB,l/Da,L)”2
Eo = Eotvos number, (plgdp2/o,) ( c B , / ~ ~ ) / ( ~ ~ A , g ~ b )
f = friction factor g = gravitational constant, m2/s
Ga’ = Ga,[l +AP/(p,gL)] Gu, = liquid phase Galileo number, (d,$tgjo;) Ha = Hatta number, defined for a reaction order of (1, p ) as
[k/,p(cB,/)PD~,/ll’z/~/ J = mass transfer flux, mol/m2*s k = mass transfer coefficient, m/s
k,,,, = reaction rate constant for a (n,p)-order of reaction, * S m 3 1 n + ~ - I ) / m o l l ~ + n - 1)
1860 December 1991 Vol. 37, No. 12 AIChE Journal

L = height of the packed bed, m m = distribution coefficient defined as (c,,,/c,,Jeq n = order of reaction for component A p = order of reaction for component B
P, = absolute pressure, MPa AP = pressure difference, N/m2
R = chemical reaction rate, mol/(m3 liquid volume-s) Re, = gas phase Reynolds number, (pgu,edp/[q,(l - E ) ] ) Re, = liquid phase Reynolds number, (p,v,,dp/q,)
u = mean interstitial velocity, m/s v = superficial velocity, m/s
V, = volume of the reactor, m3
Greek letters Pdyn = dynamic liquid holdup, drained liquid volume/e V,
P, = residual liquid holdup, residual liquid volume/^ V, P, = total liquid holdup, total liquid volume/EV, x = Lockhart-Martinelli parameter 6 = mean liquid film thickness, m E = porosity of the packed bed q = dynamic viscosity, N 4 m 2 v, = stoichiometric number of component i p = density, kg/m3 u = surface tension, N/m 7 = shear stress, N/m2
7, = contact time, s = conversion
Indices A,B = reaction component
g = gas phase I = liquid phase s = solid tr = transition between trickle and pulse flow
Literature Cited Blok, J. R., J . Varkevisser, and A. A. H. Drinkenburg, “Transition
to Pulsing Flow, Holdup and Pressure Drop in Packed Columns with Cocurrent Gas-Liquid Downflow,” Chem. Eng. Sci., 38, 687 (1 983).
Brauer, H., Grundlagen der Einphasen und Mehrphasen Stromungen, Sauerlander, Frankfurt am Main (1971).
Charpentier, J. C., C. Prost, W. van Swaaij, and P. Le Goff, “Etude de la RCtention de Liquide dans une Colonne a Garnissage Arrosk a Cocourant e t a Contrecourant de Gaz-Liquide,” Chim. Ind. Genie Chim., 99, 803 (1968).
Chou, T. S., F. L. Worley, and D. Luss, “Transition to Pulse Flow in Mixed-Phase Cocurrent Downflow Through a Packed Bed,” Ind. Eng. Chem. Proc. Des. Dew., 16, 424 (1977).
Christensen, G., S. J. McGovern, and S. Sundaresan, “Cocurrent Downflow of Air and Water in a Two-Dimensional Packed Col- umn,’’ AIChE J., 32, 1677 (1986).
Gianetto, A., G. Baldi, V. Specchia, and S. Sicardi, “Hydrodynamics and Solid-Liquid Contacting Effectiveness in Trickle-Bed Reac- tors,” AIChE J., 24, 1087 (1978).
Gianetto, A,, and P. L. Silveston, Multiphase Chemical Reactors, Hemisphere, Washington, DC (1986).
Hirose, T., M. Toda, and Y. Sato, “Liquid-Phase Mass Transfer in Packed-Bed Reactor with Cocurrent Gas-Liquid Downflow,” J. Chem. Eng. Japan,, 7, 187 (1974).
Huttinger, K. J., and F. Bauer, “Benetzung und Stoffaustausch in Filmkolonnen,” Chem. Ing. Techn., 54, 449 (1982).
Hutton, B. E. T., and L. S. Leung, “Cocurrent Gas-Liquid Flow in Packed Columns,” Chem. Eng. Sci., 29, 1681 (1974).
Kan, K., and P. F. Greenfield, “Multiple Hydrodynamic States in Cocurrent Two-Phase Downflow through Packed Beds,” Ind. Eng. Chem. Process Des. Dew., 17, 482 (1978).
Kan, K., and P. F. Greenfield, “Pressure Drop and Holdup in Two- Phase Cocurrent Trickle Flow through Beds of Small Packings,” Ind. Eng. Chem. Process Des. Dev., 18, 740 (1979).
AIChE Journal December 1991
Levec, J., A. E. Saez, and R. G. Carbonell, “The Hydrodynamics of Trickling Flow in Packed Beds,” AIChE J., 32, 369 (1986).
Levec, J., K. Grosser, and R. G. Carbonell, “The Hysteretic Behavior of Pressure Drop and Liquid Holdup in Trickle Beds,” AIChE J., 34, 1027 (1988).
Mahajani, V. V., and M. M. Sharma, “Effective Interfacial Area and Liquid Side Mass Transfer Coefficient in Trickle-Bed Reactors,” Chem. Eng. Sci., 34, 1425 (1979).
Mahajani, V. V., and M. M. Sharma, “Mass Transfer in Packed Columns: Cocurrent Downflow Operation,” Chem. Eng. Sci., 35, 941 (1980).
Midoux, N., M. Favier, and J. C. Charpentier, “Flow Pattern, Pres- sure Loss and Liquid Holdup Data in Gas-Liquid Downflow Packed Beds with Foaming and Nonfoaming Hydrocarbons,” J. Chem. Eng. Japan, 9, 350 (1976).
Midoux, N., B. I. Morsi, M. Purwasasmita, A. Laurant, and J. C. Charpentier, “Interfacial Area and Liquid-Phase Mass Transfer Coefficient in Trickle-Bed Reactors Operating with Organic Liq- uids,” Chem. Eng. Sci., 39, 781 (1984).
Morsi, B. I., N. Midoux, A. Laurant, and J. C. Charpentier, “Hy- drodynamics and Interfacial Areas in Downward Cocurrent Gas- Liquid Flow through Fixed Beds: Influence of the Nature of the Liquid,” Int. Chem. Eng., 22, 142 (1982).
Ng, K . M., “A Model for Flow Regime Transitions in Cocurrent Downflow Trickle-Bed Reactors,” AIChE J. , 32, 115 (1986).
Otaka, T., and K. Okade, “Liquid Holdup in Packed Towers,” Ka- gaku Kogaku, 17, 176 (1953).
Oyevaar, M. H., A. Zijl, and K. R. Westerterp, “Interfacial Areas and Gas Holdups at Elevated Pressures in a Mechanically Agitated Gas-Liquid Reactor,” Chem. Eng. Techn., 11, 1 (1988).
Oyevaar, M. H., R. W. J. Morssinkhof, and K. R. Westerterp, “Den- sity, Viscosity, Solubility and Diffusivity of CO, and N,O in So- lutions of Diethanolamine in Aqueous Ethylene Glycol at 298 K,” J. Chem. Eng. Data, 34, 77 (1989a).
Oyevaar, M. H., H. J. Fontein, and K. R. Westerterp, “Equilibria of CO, in Solutions of Diethanolamine in Aqueous Ethylene Glycol at 298 K,” J. Chem. Eng. Data, 34, 405 (1989b).
Oyevaar, M. H., R. W. J., Morssinkhof, and K. R. Westerterp, “The Kinetics of the Reaction Between COz and Diethanolamine in Aqueous Ethyleneglycol at 298 K: a Viscous Gas-Liquid Reaction System for the Determination of Interfacial Areas in Gas-Liquid Contactors,” Chem. Eng. Sci., 45, 3443 (1990).
Rao, V. G., M. S. Ananth, and Y . B. G. Varma, “Hydrodynamics of Two-Phase Downflow through Packed Beds,” AIChE J . , 29, 487 (1983).
Ramachandran, P. A., and R. V. Chaudari, Three-Phase Catalytic Reactors, Gordon and Breach Science Publishers (1983).
Sai, P . S. T., and Y. G. B. Varma, “Pressure Drop in Gas-Liquid Downflow through Packed Beds,” AIChE J., 33, 2027 (1987).
Sai, P. S. T., and Y. B. G. Varma, “Flow Pattern of the Phases and Liquid Saturation in Gas-Liquid Cocurrent Downflow through Packed Beds,” Can. J. Chem. Eng., 66, 353 (1988).
Shulman, H. L., C. F. Ullrich, and N. Wells, “Performance of Packed Columns,” AIChE J., 1, 247 (1955).
Sicardi, S., G. Baldi, and V. Specchia, “Hydrodynamic Models for the Interpretation of the Liquid Flow in Trickle-Bed Reactors,” Chem. Eng. Sci., 35, 1775 (1980).
Specchia, V., and G. Baldi, “Pressure Drop and Liquid Holdup for Two-Phase Cocurrent Flow in Packed Beds,” Chem. Eng. Sci., 32, 515 (1977).
Sridharan, K., and M. M. Sharma, “New Systems and Methods for the Measurement of Effective Interfacial Area and Mass Transfer Coefficients in Gas-Liquid Contactors,” Chem. Eng. Sci., 31, 767 (1 976).
Talmor, E., “Two-Phase Downflow through Catalyst Beds,” AIChE J. , 23, 868 (1977).
Tosun, G., “A Study of Cocurrent Downflow of Nonfoaming Gas- Liquid Systems in a Packed Bed,” Ind. Eng. Chem. Proc. Des. Dew., 23, 29 (1984).
Turpin, J. L., and R. L. Huntington, “Prediction of Pressure Drop for Two-Phase, Two-Component Cocurrent Flow in Packed Beds,” AIChEJ., 13, 1196 (1967).
Versteeg, G. F., P. M . M. Blauwhoff, and W. P. M. Van Swaaij, “The Effect of Diffusivity on Gas-Liquid Mass Transfer in Stirred
Vol. 37, No. 12 1861

Vessels: Experiments at Atmospheric and Elevated Pressures,” Chem. Eng. Sci., 42, 1103 (1987).
Versteeg, G . F., and W. P . M. Van Swaaij, “On the Kinetics Between C 0 2 and Alkanol-Amines Both in Aqueous and Nonaqueous So- lutions: l . Primary and Secondary Amines,” Chem. Eng. Sci., 43, 573 (1988).
Versteeg, G . F., J. A. M. Kuipers, F. P. H. Van Beckum, and W. P. M. Van Swaaij, “Mass Transfer with Complex Reversible Chemical Reaction: Single Reversible Reactions,” Chem. Eng. Sci., 44, 2295 (1989).
Vidwans, A. D., and M. M. Sharma, “Gas-Side Mass Transfer Coef- ficient in Packed Columns,” Chem. Eng. Sci., 22, 673 (1967).
Wammes, W. J. A., S. J. Mechielsen, and K. R. Westerterp, “The Influence of Pressure on the Liquid Holdup in a Cocurrent Gas- Liquid Trickle-Bed Reactor Operating at Low Gas Velocities,” Chem. Eng. Sci., 46, 409 (1990a).
Wammes, W. J . A., S. J. Mechielsen, and K. R. Westerterp, “The Transition between Trickle Flow and Pulse Flow in a Cocurrent Gas-Liquid Trickle-Bed Reactor at Elevated Pressures,” Chem. Eng. Sci., 45, 3149 (1990b).
Whitaker, S . , and A. E. Cassano, Concepts and Design of Chemical Reactors, Gordon and Breach Science Publishers (1986).
Appendix Overall Force Balance over the Gas and Liquid Phase
overall force balance over the gas and liquid phase:
othermal conditions.
The following assumptions have been made to derive an
The trickle-bed reactor operates under stationary and is-
The solid phase is completely wetted by the liquid phase. The holdup of flowing liquid phase is equal to the dynamic
The gas density is constant. The contribution of the wall area to the hydrodynamic
The gas-liquid surface tension does not play a role. The force balance over the liquid phase then reads:
liquid holdup.
behavior is negligible.
and over the gas phase:
The total liquid holdup is equal to 0, = Pdyn + P,. For our ex- perimental data, p,g<<AP/L. On the basis of these relations, it can easily be derived that the dynamic liquid holdup is given by:
Manuscript received July 12, 1990, and revision received Sept. 30, 1991.
1862 December 1991 Vol. 37, No. 12 AIChE Journal