hydrodynamic deposition: a novel method of cell...
TRANSCRIPT

Hydrodynamic deposition: a novel method of cell immobilization
G. J. Salter*, D. B. Kell*, L. A. Asht, J. M. Adams,, A. J. Brown~ and R. Jarnes~
* Department o f Biological Sciences, University College o f Wales, Aberystwyth, UK ? Edward Davies Chemical Laboratories, University College o f Wales, Aberystwyth, UK ~: ECC International Ltd, John Keay House, St. Austell, UK
A novel method of cell immobilization is described. The cell support consists of ceramic microspheres of approximately 50-75 tzm diameter. The spheres are hollow, having a wall thickness of lO-15 Ixm and one entrance (ca. 20 txm diameter). The walls are porous with a mean pore size of approximately 90 nm. When a cell suspension (of S. cerevisiae) is passed through a column of such particles, cells are immobilized. Conditions are devised such that the overwhelming majority of cells are held in the central cavity of the support and not between the particles. Provided turbulence is avoided, the distribution of cells along the column length in the steady state is rather homogeneous. The facts that (a) essentially all particles, regardless of orientation, entrap cells, and (b) nonporous particles also entrap cells with high efficiency, indicate that filtration effects are irrelevant and that heretofore unrecognized hydrodynamic forces are alone responsible for the cell immobilization. Cells can be immobilized to high biomass densities, while the hydrodynamic properties of columns containing such immobilized cells are excellent. We describe an on-line electronic method for the real-time measure- ment of immobilized cellular biomass. Cell growth (so recorded) and metabolism continue to occur in such particles at high rates. Using the glycolytic production of ethanol by S. cerevisiae as a model reaction, volumetric productivities as great as any published are obtained. Thus the "lobster-pot effect" or "'hydrodynamic deposition" represents a novel, promising, and generally applicable method of cell immobilization.
Keywords: Immobilized cells; ceramic particles; hydrodynamic
Introduction
There is a widespread and continuing interest in the immobilization of biological catalysts, and especially of intact cells, ~-12 for technological purposes. Of the various means available for achieving this within bioreactors using cell supports, a distinction is usually drawn 2,3,8,1°-12 between methods relying upon adsorp- tion to, and those relying on entrapment within, the water-insoluble immobilization matrix. Adsorption alone is rarely satisfactory, since the intermolecular forces involved are generally inadequate to inhibit sloughing of excess cells. Thus entrapment, particu- larly within the popular calcium alginate ma- trix, 2,3,5,8,1°-~5 appears to have become the method of choice for many workers, since only nontoxic calcium ions need be added to the sodium alginate/cell mixture
Address reprint requests to Dr. Salter at The Department of Biologi- cal Sciences, University College of Wales, Aberystwyth, Dyfed SY23 3DA, UK Received 30 January 1989
forces; Saccharomyces cerevisiae; ethanol
to effect entrapment. Yet even the alginate method suffers the disadvantages that (a) such an immobiliza- tion mechanism already represents an undesirably complex process which does not conveniently lend it- self to scale-up (since the cells must first be harvested from the growth medium), (b) scale-up of the biotrans- formational step itself is difficult due to the poor me- chanical properties of alginate gels, (c) the alginate beads so formed have an unfortunate tendency to fall apart in the presence of quite modest concentrations of chelating agents such as orthophosphate, and (d) few of these matrices are compatible with organic sol- vents.
The ideal immobilization matrix would be one that has a rigid structure to retain the cells and to give favorable mechanical properties required during scal- ing up, yet is sufficiently porous to nutrients that diffu- sion limitation of growth and metabolism is avoided. However, we are not aware of any water-soluble or- ganic compound that can be polymerized, under con- ditions that are not toxic to living cells, to give a genu- inely rigid matrix. Equally, it is not immediately
© 1990 Butterworth Publishers Enzyme Microb. Technol., 1990, vol. 12, June 419
Papers
obvious how one might persuade cells to become en- trapped inside a rigid preformed matrix which is re- versibly permeable to nutrients but not to cells.
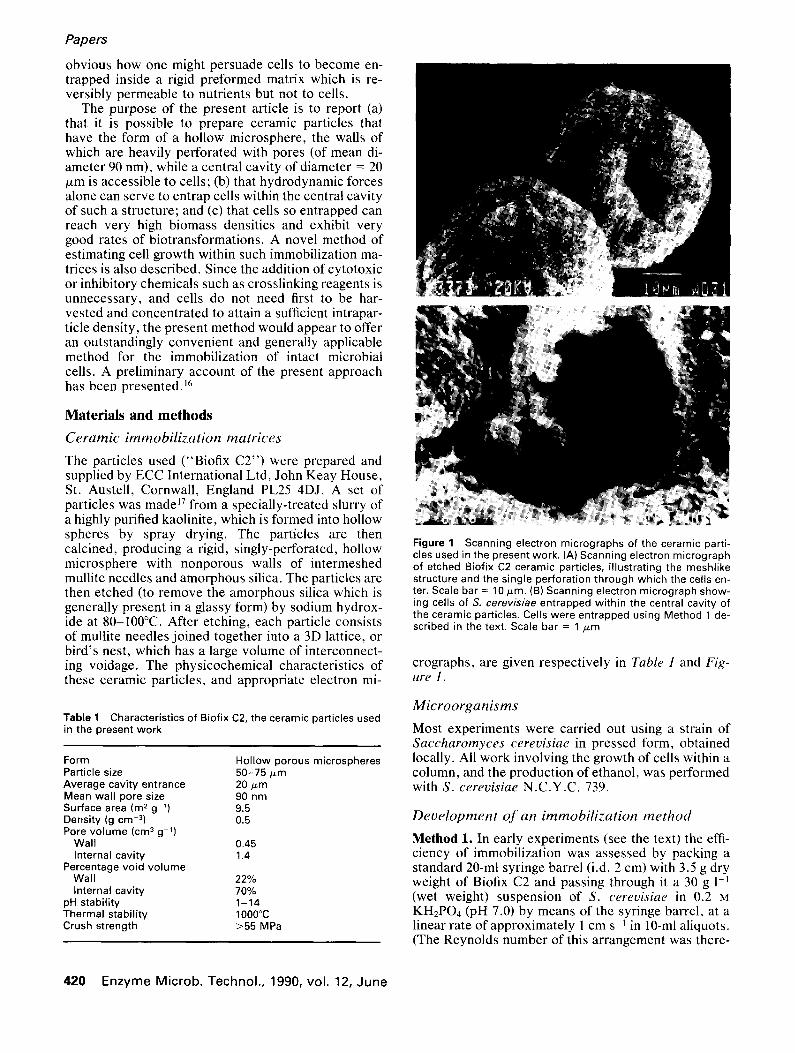
The purpose of the present article is to report (a) that it is possible to prepare ceramic particles that have the form of a hollow microsphere, the walls of which are heavily perforated with pores (of mean di- ameter 90 nm), while a central cavity of diameter -- 20 t~m is accessible to cells; (b) that hydrodynamic forces alone can serve to entrap cells within the central cavity of such a structure; and (c) that cells so entrapped can reach very high biomass densities and exhibit very good rates of biotransformations. A novel method of estimating cell growth within such immobilization ma- trices is also described. Since the addition of cytotoxic or inhibitory chemicals such as crosslinking reagents is unnecessary, and cells do not need first to be har- vested and concentrated to attain a sufficient intrapar- ticle density, the present method would appear to offer an outstandingly convenient and generally applicable method for the immobilization of intact microbial cells. A preliminary account of the present approach has been presented, j6
Materials and methods
Ceramic immobilization matrices
The particles used ("Biofix C2") were prepared and supplied by ECC International Ltd, John Keay House, St. Austell, Cornwall, England PL25 4DJ. A set of particles was made ~7 from a specially-treated slurry of a highly purified kaolinite, which is formed into hollow spheres by spray drying. The particles are then calcined, producing a rigid, singly-perforated, hollow microsphere with nonporous walls of intermeshed mullite needles and amorphous silica. The particles are then etched (to remove the amorphous silica which is generally present in a glassy form) by sodium hydrox- ide at 80-100°C. After etching, each particle consists of mullite needles joined together into a 3D lattice, or bird's nest, which has a large volume of interconnect- ing voidage. The physicochemical characteristics of these ceramic particles, and appropriate electron mi-
Table 1 Characteristics of Biofix C2, the ceramic particles used in the present work
Form Particle size Average cavity entrance Mean wall pore size Surface area (m 2 g- l) Density (g cm -3) Pore volume (cm 3 g 1)
Wall 0.45 Internal cavity 1.4
Percentage void volume Wall 22% Internal cavity 70%
pH stability 1-14 Thermal stability 10O0°C Crush strength >55 MPa
Hollow porous microspheres 50-75/~m 20/~m 90 nm 9.5 0.5
Figure 1 Scanning electron micrographs of the ceramic parti- cles used in the present work. (A) Scanning electron micrograph of etched Biofix C2 ceramic particles, illustrating the meshlike structure and the single perforation through which the cells en- ter. Scale bar = 10/~m. (B) Scanning electron micrograph show- ing cells of S. cerevisiae entrapped within the central cavity of the ceramic particles. Cells were entrapped using Method 1 de- scribed in the text. Scale bar = 1 p,m
crographs, are given respectively in Table 1 and Fig- ure I.
Microorganisms
Most experiments were carried out using a strain of Saccharomyces cerevisiae in pressed form, obtained locally. All work involving the growth of cells within a column, and the production of ethanol, was performed with S. cerevisiae N.C.Y.C. 739.
Development o f an immobilization method
Method 1. In early experiments (see the text) the effi- ciency of immobilization was assessed by packing a standard 20-ml syringe barrel (i.d. 2 cm) with 3.5 g dry weight of Biofix C2 and passing through it a 30 g l-J (wet weight) suspension of S. cerevisiae in 0.2 M KHzPO4 (pH 7.0) by means of the syringe barrel, at a linear rate of approximately 1 cm s m in 10-ml aliquots. (The Reynolds number of this arrangement was there-
420 Enzyme Microb. Technol., 1990, vol. 12, June
fore significantly less than 1 .) The column was washed through with 100 ml (10 column volumes) of buffer, then the immobilization matrix was extruded and sam- ples from the top and bottom removed. Cells in each sample were lysed by boiling in 0.2 M NaOH and as- sayed for protein by the Folin method.~8
Method 2. A vacuum was applied to the base of the column to suck the yeast suspension through the column at approximately the same rate as in Method 1, rather than using the syringe barrel to force the sus- pension through from above. Cell immobilization us- ing different concentrations of cell suspensions was studied in the same manner as in Method 1. Cell load- ings were estimated by protein assay and from the optical density of the effluent, control experiments without cells being used to show that the loss of fines from the column did not interfere with the latter method. Loading profiles through the length of the column were determined by carrying out protein as- says on a series of transverse sections taken from the column. Columns of two sizes were used containing (a) 3.5 g of Biofix C2 or (b) 8.0 g of Biofix C2, both held in standard 20-ml syringes. A repeat series of column profiles was then produced as above, using columns fitted with cotton wool plugs on the top, acting as a baffle to reduce turbulence and mixing effects that were produced when each new aliquot of suspension was added to the column. Column stability was as- sessed using columns of known yeast loading; these were broken up and placed in 80 ml of 0.2 M KH2PO4. This mixture was then agitated for 10 min by the use of a magnetic stirrer at a rate just sufficient to bring all the Biofix C2 into suspension. The Biofix C2, once drained, was washed thoroughly in buffer. The amount of yeast removed from the Biofix C2 was calculated by optical density measurements of the buffer and by pro- tein assay of the C2 material.
Method 3. Cells suspended at a low biomass density were passed once through the column by means of a Watson Marlow peristaltic pump, Column loading was calculated both by protein assay and from the optical density of the effluent. In an attempt to optimize the flow rate (in terms of the rate and extent of substantial intraparticle cell deposition), it was found that the flow rate of suspensions through the column had no signifi- cant effect (in the range 1-6 column volumes min-1). However, the extent of filtration of cells between the particles was strongly flow rate-dependent in the sense that it increased as the flow rate decreased. From this point of view, flow rates below 30 ml min -1 (3 column volumes min-b were impractical in routine use; thus flow rates in the range 4.5-6 column volumes were appropriate and were used in the experiments de- scribed.
Characterization of cell loading
A 0.5 g 1 -l (wet weight) suspension of S. cerevisiae was forced through a standard 20-ml syringe contain-
Hydrodynamic deposition: G. J. Salter et al.
ing 3.5 g of Biofix C2, fitted with a cotton-wool baffle, using Method 3. By varying the volume of suspension used to load the column between 10 and 500 ml, and producing profiles of these columns at their various stages of loading, it was calculated when and where loading occurs and to what degree through the length of the column.
Determination of the mechanism of cell loading
For reasons discussed in the text, a comparison was made of the loading within etched and unetched Biofix C2. Unetched C2 has exactly the same dimensions, with the same size of central cavity and cavity en- trance, as etched C2; the walls, however, are imper- meable, and the particle, although the same size as the etched version, is thus much denser. The method used was the same as for the characterization of column loading. To ensure that the columns using both particle types were comparable, and to allow for the different densities, columns were compared on the basis of the volume of cell support rather than its weight.
Surface treatments
The effects of four surface treatments were assessed (a) 3-amino propyl silane, (b) polyethylene imine (PEI), (c) DP6 2325 (a cationic polymer of MW ap- prox. 5,000, supplied by Allied Colloids, Low Moor, Bradford, Yorkshire BD 12 0JZ, UK), (d) "Magnafloc" 1697 (a cationic polymer of MW approx. 10,000, supplied by Allied Colloids). These treatments were carried out as follows:
(a) 3-amino propyl silane: 40 ml of 3-amino propyl si- lane was dissolved in 360 ml of water into which 20 g of Biofix C2 was introduced, and heated in a water bath for 2 h at 75°C. The solid was washed with 400 ml of water and dried at 115°C. (b) Polyethylene imine: approximately 1 wt % of PEI is required to cover particles of surface area I0 m~g -t. Biofix C2 has a surface area of ca. 9.5 m2g-l; for 20 g of C2, 0.2 g of PEI is required to give a monolayer cover- age. The requisite quantity of PEI was dissolved in 50 ml of water, 20 g of C2 was stirred in, and the mixture allowed to stand for 15 rain before filtering and drying. (c and d) DP6 2325 and "Magnafloc" 1697:20 g C2 was slurried in 100 ml of water and the pH lowered to pH 6 (starting pH = 8). One-fifth gram of polymer was dis- solved in 50 ml of water and added to the slurry. After standing with occasional stirring for 10-15 rain, it was filtered and washed with 500 ml of water.
Loading of the columns that had received these sur- face treatments was carried out using Method 3. Column stability was assessed by removing the column, placing it in buffer, and agitating. The buffer was changed frequently and the amount of yeast lost to each change of buffer determined by optical density measurements on the supernatant.
PEI interfered strongly with the Folin protein assay and also the bicinchoninic acid (BCA) protein assay 19
Enzyme Microb. Technol., 1990, vol. 12, June 421
Papers
(Pierce Chemical Company, 3747 N. Meridian Road, Post Office Box 117, Rockford, Illinois 61105, USA) so column loadings were in this case calculated using op- tical density measurements alone.
Growth o f S. cerevisiae within a column
To achieve the highest possible biomass within the column, cell growth must occur. To follow this growth, in situ and in real time, an electronic biomass probe ("Bugmeter") was used (Aber Instruments Ltd, Unit 4, Aberystwyth Science Park, Cefn Llan, Abery- stwyth, Dyfed SY23 3AH, UK). The Bugmeter works 2° by measuring the capacitive absorption of ra- dio-frequency electromagnetic radiation (i.e. the di- electric permittivity). An appropriate four-terminal electrode was built using four parallel stainless wires ca. 3 mm apart held normal to and collinear with the plane of solvent flow within a standard 20-ml syringe, around which a column could be packed. When using the Bugmeter, the operating frequency was set at 0.3 MHz. The Bugmeter was backed off to give a capaci- tance output of zero pF, such that changes in biomass were directly proportional to (rather than linear with) the change in capacitance.
Controls and calibration curves were carried out using known weights of S. cerevisiae suspended in 40 mM KH2PO4; these were placed in the 20-ml syringe with the Bugmeter electrode and the capacitance re- corded. Further controls for the use of the Bugmeter in the estimation of biomass within the packed column were carried out by packing 6 g of C2 particles within the electrode-bearing syringe. Various volumes of a 0.5 g l -~ (wet weight) yeast suspension in 40 mM KHzPO4 were passed through the column using a Wat- son-Marlow peristaltic pump. The column was washed with 10 column volumes of the same buffer lacking cells (to remove any cells that were not en- trapped within the particles) and the capacitance re- corded. Cell loading was determined by a protein as- say on the column and via the optical density of the effluent. Thus it was possible to relate the electrical capacitance recorded by the Bugmeter to the column loading. Conversion factors for both strains used in this work were: 1 mg dry wt ml -~ = 3.57 mg wet wt m1-1 = 39.64 × 10⁶ cells ml -I = 1.746 pF.
Cells entrapped within a column were grown as fol- lows, using a liquid medium consisting of (per liter tap water) glucose (100 g), yeast extract (7.5 g), and pep- tone (7.5 g). The pH of the medium was adjusted to 4.0 using 2 M H 2 8 0 4 . 21 The medium was passed once through the column at a flow rate of 120 ml h -1 by a peristaltic pump (2120 Varioperpex, LKB Bromma, Sweden). Cell growth within the column was followed by the Bugmeter. Growth was stopped at various stages, the column material containing entrapped cells removed, and a protein assay carried out. The yeast loading determined by this method was then compared to that given by the Bugmeter.
Ethanol production
S. cerevisiae N.C.Y.C. 739 was grown aerobically on an orbital shaker in 100 ml of the liquid medium given above, at 37°C. This culture was then loaded onto the column (containing 6 g of ceramic particles) using Method 3, cells entrapped between the particles being removed by washing with 10 column volumes of sterile buffer. The above growth medium was then pumped through the column at a rate of 120 ml h -~ for approxi- mately 24 h to increase the immobilized biomass den- sity. The flow rate of the medium was then reduced to that conducive to a suitable rate and extent of ethanol production. Samples of the effluent solution were taken and the ethanol concentrations determined by gas chromatography on Chromosorb 101 (Phase Sepa- rations Ltd, Deeside Industrial Estate, Queensferry, Clwyd, UK), packed in a glass column (160 cm by 4 mm internal diameter) with a column temperature of 190°C, a detector temperature of 235°C, and a carrier gas (N2) flow rate of 20 ml min -1. Pentan-3-one was used as the internal standard in these analyses, which were performed using a Pye series 104 chromatograph with a flame ionization detector and a Hewlett-Pack- ard model 3390A reporting integrator. Glucose con- centration was determined using hexokinase (Sigma kit No 115).
Results and discussion
Development o f an immobilization method
Because of the unique shape and strength offered by these ceramic particles, it was our aim to devise a means by which cells could be immobilized within the central cavity. Such cells would be protected from any physical damage yet should still receive ample amounts of nutrients and substrate through the porous particle walls.
Initially, cells of S. cerevisiae and particles of Biofix C2 were suspended together in 0.2 M KHzPO4, to es- tablish whether or not cell adsorption would occur onto the particles. Any such adsorption was, however, immeasurably small, probably due to the fact that both the yeast cells and the Biofix C2 particles carry a small but significant negative surface charge.
The effects of passing a yeast suspension through a column packed with the ceramic particles were studied using Method 1, the initial assumption being that cells might well be immobilized within the Biofix by filtra- tion. On this basis one might expect that a maximum of 50% of the particles, namely those whose orifice was oriented (randomly) towards the flowing stream, might entrap cells. In fact, consideration of the particle shape (essentially spherical), the typical cavity size (see Figure 1 and Table 1), and the fact that the sus- pension is moving through the column by laminar flow means that the above figure of 50% is a substantial overestimation. Because the flow is laminar, the area presented to the flowing suspension by both individual particles and the cavity entrance is seen in what
422 Enzyme Microb. Technol., 1990, vol. 12, June
I
o
atl
..i.a
o
r..)
40.
35-
30-
25-
2O-
15-
10-
5-
0 0
÷ 0 ÷
0 0
÷
÷ + +
I I I I I I I
2 4 6 8 10 12 14 Column volumes
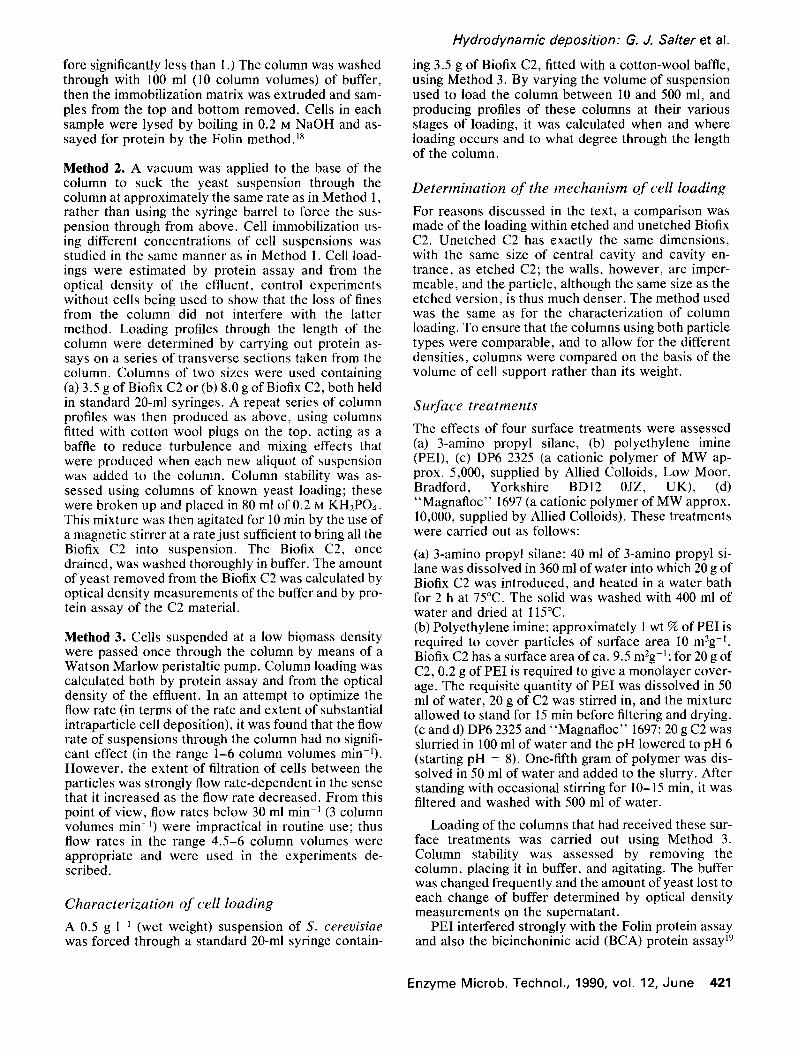
Figure 2 Effect of cell suspension density on the rate and ex- tent of immobilization of 5". cerevisiae on Biofix C2 ceramic par- ticles. A column was formed from a standard 20-ml syringe barrel and 3.5 g Biofix particles added. A yeast cell suspension was made up to the appropriate concentration in 0.2 M KH2PO4 at pH 7 and passed through the column in 10-ml aliquots using the syringe plunger (Method 1 ; see Materials and methods). Cell loading was assessed by protein measurements on material taken from the top and bottom of the column. The numbers quoted represent average values between the two readings. Each point therefore represents a separate column. (+) Cell con- centration in the suspension = 6.6 mg wet wt ml 1 (C]) cell con- centration in the suspension = 30 mg wet wt m1-1
amount to two dimensions only. In calculating the pro- portion of particles which present an orifice which faces the flowing stream (at least in part), we first note that each particle will present the same surface area to the flowing stream, regardless of its orientation. How- ever, this is not the case for the cavity entrance, since only when the orifice is essentially in a polar position facing the flow of suspension will it present its geomet- ric surface area for filtration. As it is moved to a more equatorial position, the area presented to a laminar flow will be reduced. This will make it more difficult for the particles to remove yeast by filtration, such that when the cavity entrance assumes an equatorial posi- tion the area facing the direction of flow will be zero. Thus (assuming that the particles are randomly ori- ented) 50% represents the absolute maximum propor- tion of particles which might entrap cells by filtration.
The volume of suspension passed through the column was varied so as to produce a loading curve, which would serve to determine both the efficiency of the column at removing cells in suspension and the time (or extent of cell loading) at which the column had effectively stopped immobilizing cells. At this point, i.e. when the concentration of cells in the suspension entering the column equalled that in the effluent, the maximum extent of immobilization had been attained.
Hydrodynamic deposition: G. J. Salter et al.
The results (Figure 2) indicate that immobi l izat ion on/wi th in B io f ix C2 is essential ly complete when 20 ml (i.e. 2 column volumes) of a 30 g 1-1 (wet weight) sus- pension of S. cerevisiae is passed through the column, and that the extent of immobi l izat ion is some 30-35 mg wet cells per gram dry particles. Passing a larger vol- ume of suspension through the column increased the numbers of immobi l ized cells only sl ightly. Scanning electron microscopic (SEM) examinat ion of such a column showed that after washing wi th l0 column vol- umes of buffer, very few cells remained in the spaces between the particles. Thus the cell loadings calcu- lated must be due to cells having entered the cavi ty wi th in the Biof ix particles (as may also be observed in Figure 1).
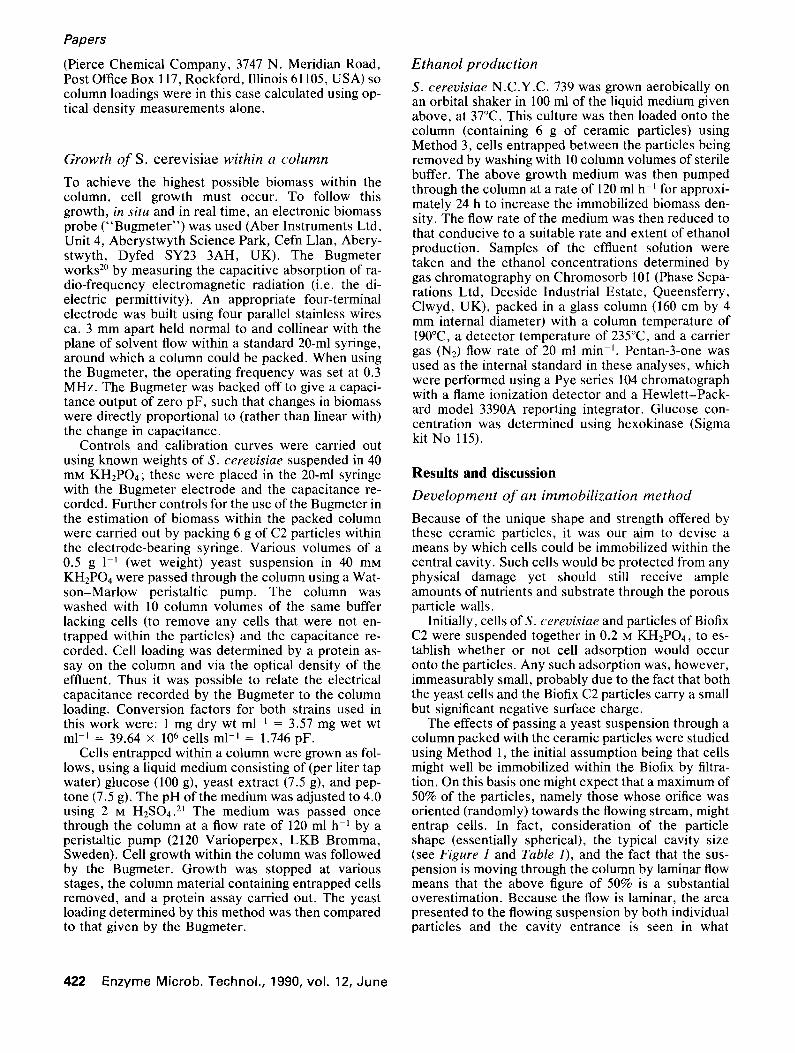
The use of a vacuum to draw the suspension through the column (Method 2), at the same f low rate as that used in Method 1, resulted in higher apparent extents of cell immobi l izat ion, typ ica l ly 100 mg wet cells per gram dry particles (Figure 3). A major prob- lem wi th this method, however, was the existence of greatly enhanced column f i l ter ing effects, f f one passes a cell suspension through a column that is f i l tering out cells between indiv idual ceramic particles, one would expect a very large number of cells to be present at the top of the column, with cell numbers decreasing down the column. The difference in loading between the top
--- 160 T "~o 140
~120
loo
i 80-
~ 60.1
r I l l l l r I l l l l l l l l l l l l r I ~ l ] l l l l I I I I I I ~ l l 1 1 1 1 1 1 t r r l l l l l l l l l l l ]
0 1 2 3 4 5 6 Column volumes
Figure 3 Effect of a vacuum in drawing a cell suspension through a column of Biofix C2 on the rate and extent of immobi- lization of S. cerevisiae therein. A column was formed from a standard 20-ml syringe barrel and 3.5 g of particles added. A suspension of yeast cells (30 mg wet wt ml =1) in 0.2 M KH2PO4 pH 7.0 was drawn downwards through the column by the use of a vacuum (Method 2; see Materials and methods). After the stated number of column volumes of cell suspension had been passed, the column was washed using 10 column volumes of cell-free buffer. The total cell loading (i.e. cells immobilized in- side and outside the central cavity) was determined by protein assay (rT). Loading within the central cavity (A) was determined by counting those cells outside the central cavity (+) and sub- tracting this loading from the total loading
Enzyme Microb. Technol . , 1990, vo l . 12, June 4 2 3
Papers
I
0
"~ 20
Figure 4
+
+ + +
+ ÷ +
+ D
0 ! D D 0 0 0 ° i i i [ i
0 2 4 6 8 t O 1 2
Column volumes
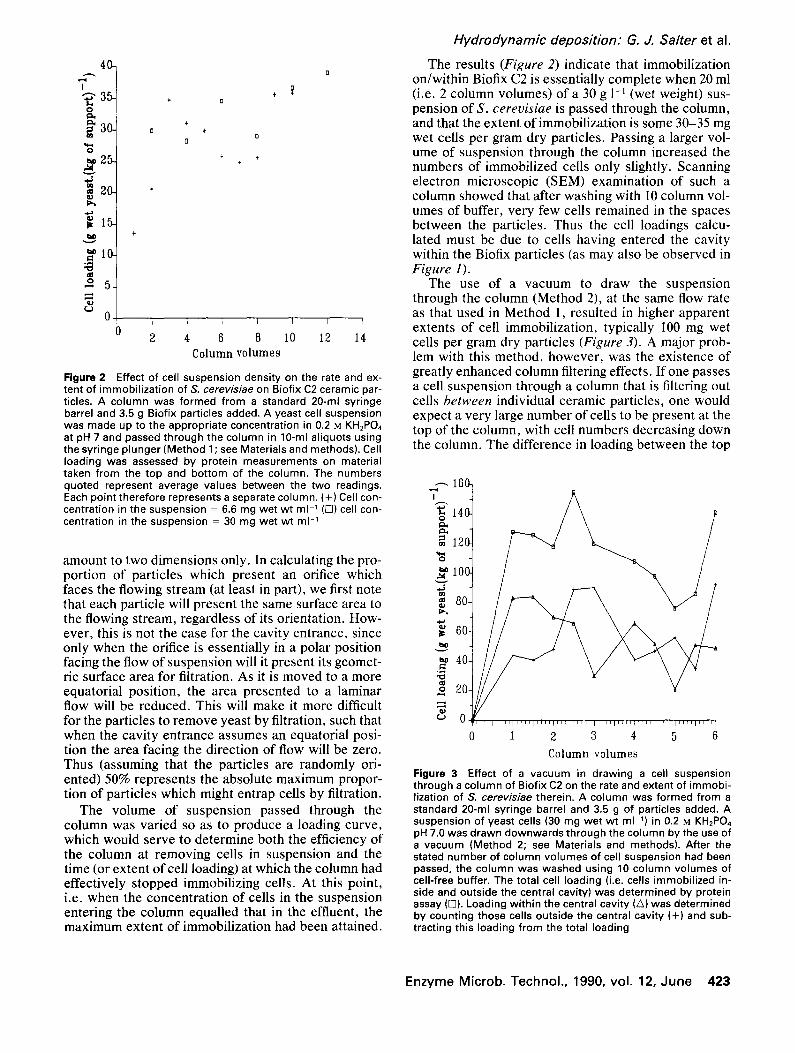
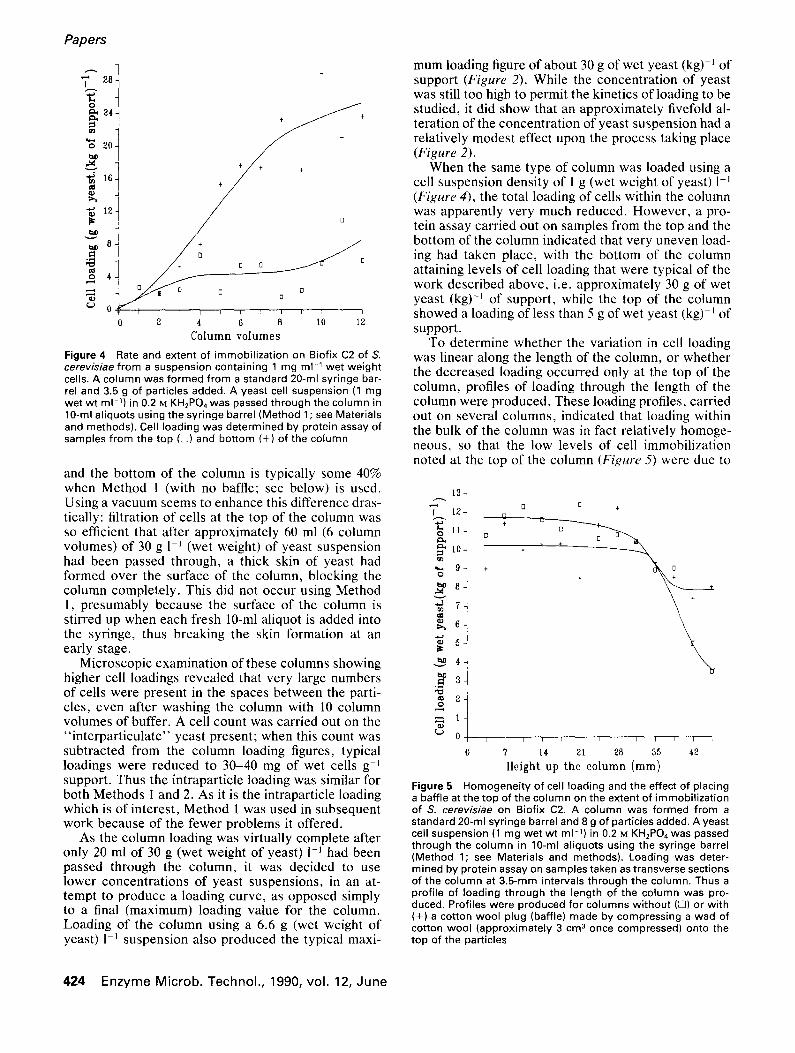
Rate and extent of immobilization on Biofix C2 of S. cerevisiae from a suspension containing 1 mg m1-1 wet weight cells. A column was formed from a standard 20-ml syringe bar- rel and 3.5 g of particles added. A yeast cell suspension (1 mg wet wt m1-1) in 0.2 M KH2PO4 was passed through the column in 10-ml aliquots using the syringe barrel (Method 1 ; see Materials and methods). Cell loading was determined by protein assay of samples from the top (Z~) and bottom (+) of the column
and the bottom of the column is typically some 40% when Method 1 (with no baffle; see below) is used. Using a vacuum seems to enhance this difference dras- tically: filtration of cells at the top of the column was so efficient that after approximately 60 ml (6 column volumes) of 30 g 1 I (wet weight) of yeast suspension had been passed through, a thick skin of yeast had formed over the surface of the column, blocking the column completely. This did not occur using Method 1, presumably because the surface of the column is stirred up when each fresh 10-ml aliquot is added into the syringe, thus breaking the skin formation at an early stage.
Microscopic examination of these columns showing higher cell loadings revealed that very large numbers of cells were present in the spaces between the parti- cles, even after washing the column with 10 column volumes of buffer. A cell count was carried out on the "interparticulate" yeast present; when this count was subtracted from the column loading figures, typical loadings were reduced to 30-40 mg of wet cells g-J support. Thus the intraparticle loading was similar for both Methods 1 and 2. As it is the intraparticle loading which is of interest, Method 1 was used in subsequent work because of the fewer problems it offered.
As the column loading was virtually complete after only 20 ml of 30 g (wet weight of yeast) 1 -~ had been passed through the column, it was decided to use lower concentrations of yeast suspensions, in an at- tempt to produce a loading curve, as opposed simply to a final (maximum) loading value for the column. Loading of the column using a 6.6 g (wet weight of yeast) 1-1 suspension also produced the typical maxi-
mum loading figure of about 30 g of wet yeast (kg) -~ of support (Figure 2). While the concentration of yeast was still too high to permit the kinetics of loading to be studied, it did show that an approximately fivefold al- teration of the concentration of yeast suspension had a relatively modest effect upon the process taking place (Figure 2).
When the same type of column was loaded using a cell suspension density of 1 g (wet weight of yeast) l -J (Figure 4), the total loading of cells within the column was apparently very much reduced. However, a pro- tein assay carried out on samples from the top and the bottom of the column indicated that very uneven load- ing had taken place, with the bottom of the column attaining levels of cell loading that were typical of the work described above, i.e. approximately 30 g of wet yeast (kg)-J of support, while the top of the column showed a loading of less than 5 g of wet yeast (kg) I of support.
To determine whether the variation in cell loading was linear along the length of the column, or whether the decreased loading occurred only at the top of the column, profiles of loading through the length of the column were produced. These loading profiles, carried out on several columns, indicated that loading within the bulk of the column was in fact relatively homoge- neous, so that the low levels of cell immobilization noted at the top of the column (Figure 5) were due to
[3 [3 + 12 D
I + +
.~aTj +
~ 4
~ 2 o
~ 1
~ 0 i [ i E r i i E i i i i ;
? 14 21 28 35 42
Height up the column (mm)
Figure 5 Homogeneity of cell loading and the effect of placing a baffle at the top of the column on the extent of immobilization of S. cerevisiae on Biofix C2. A column was formed from a standard 20-ml syringe barrel and 8 g of particles added. A yeast cell suspension (1 mg wet wt m1-1) in 0.2 M KH2PO4 was passed through the column in 10-ml aliquots using the syringe barrel (Method 1; see Materials and methods). Loading was deter- mined by protein assay on samples taken as transverse sections of the column at 3.5-mm intervals through the column. Thus a profile of loading through the length of the column was pro- duced. Profiles were produced for columns without (El) or with (+) a cotton wool plug (baffle) made by compressing a wad of cotton wool (approximately 3 cm 3 once compressed) onto the top of the particles
4:)4 E n z y m e M i c r o b . T e c h n o l . , 1990, vo l . 12, J u n e

some kind of surface effect. Profiles produced on longer columns (8 g of C2 in the same size standard syringe) of some 45 mm in height showed that loading was homogeneous from the column base up to a height of some 31 mm; at this height a small drop in the numbers of cells was seen, and only the top 10 mm showed a large drop in loading (Figure 5).
During these experiments, it was noticed that when each 10-ml aliquot of suspension was poured into a syringe, prior to being forced through the column, the C2 particles at the top of the column were stirred up considerably, such that some particles were brought into suspension for a short period. To investigate whether this turbulence was responsible for the re- duced cell loading at the top of the column, columns were also prepared with cotton wool wads pushed down onto the packed C2 particles, in an attempt to reduce the impact experienced by the top of the column when each aliquot of suspension was added. It may be seen that the reduction in loading at the top of the column is greatly reduced by this approach, such that the column loading overall is increased (Figure 5).
To establish whether the turbulent disturbance of C2 particles merely stops the particles from entrapping cells or whether it can actually result in entrapped cells being removed, columns of known yeast loading were broken up and stirred into beakers of buffer. This re- sulted in a massive loss of yeast from the C2 particles, showing that disturbance of the particles not only pre- vents loading from occurring, but will also result in virtually all the ceils that were previously loaded being lost. Thus it was the disturbance of the surface layer's C2 particles within the packed-bed that resulted in the previously mentioned poor loading results. Columns used in all further work were therefore fitted with a cotton wool baffle.
Using concentrations of S. cerevisiae as low as l g (wet weight of yeast) 1 -~ meant that relatively large volumes of suspension were required fully to load a column. A peristaltic pump was therefore used to speed up the loading, by pumping cell suspension held in a reservoir through the column. The results of this method were typical of past loadings and column pro- files, and this method was adopted for all further work.
Characterization of yeast loading
To establish where within the column cell immobiliza- tion initially occurred, and how this developed as fur- ther cells were entrapped, a series of column profiles was produced from columns that had been subjected to very low cell loadings, using small volumes of a 0.5 g (wet weight) 1-' yeast cell suspension. The results of such studies, illustrated in Figure 6A, clearly indicated that loading occurred initially at the top of the column. Cells continued to be immobilized predominantly at the top of the column until a support loading of 10-13 g wet yeast (kg) -~ particles was achieved. The rate of loading at the top of the column was then greatly re- duced, and the point at which maximum loading was taking place moved down the column. When 150-200
?
0 o~
0
bo
¢8 0
L~
Hydrodynamic deposition: G. J. Salter et al.
20
18
16
14
12
i0
8 -
6 -
4 -
2
0
2
I i I r I i [ t I r I i I i
4 6 8 tO 12 14 16
Height up the eolumn (ram)
120-
I 1 1 0 -
¢~ lO0- ira.,
N 9o
,al 70
~ t31)
~ 5o
40
~a~ 30
'~ 2O
2 lo
~ o
D
D
d
) 10 20 30 40 50
column volumes
Figure 6 Immobil ization of S. cerevisiae from a suspension containing 0.5 mg wet wt of cells ml 1 on Biofix C2. (A) Series of column profiles showing the rate and extent of initial immobil i- zation of S. cerevisiae. A column was formed from a standard 20-ml syringe barrel with 3.5 g of particles added and a cotton wool baffle placed on top of the particles. Various volumes of suspension (0.5 mg wet wt m1-1) in 0.2 M KH2P04 were passed through the column using a peristaltic pump (Method 3; see Materials and methods). Loading was determined by a protein assay on samples taken as transverse sections of the column at 3.5-mm intervals through the length of the column. Each curve represents a profile for a column after a particular volume of suspension has been passed through, viz. 30 ml (rT), 60 ml (+), 100 ml (A), 200 ml (x), and 300 ml (V) of suspension. (B) Distri- bution of cells between the inside and outside of the particles. Total loading (rT) (cells both inside and outside the central cav- ity) was determined by optical density measurements of the column effluent. Loading within the column but outside the cen- tral cavity (+) was determined from optical density measure- ments on the effluent during column washing (10 column vol- umes of cell-free buffer). Thus loading due to cell entrappment (A) is the loading outside the central cavity subtracted from the total loading. 10 column volumes = 100 ml
Enzyme Microb. Technol., 1990, vol. 12, June 426

Papers
ml (15-20 column volumes) of cell suspension had been passed through the column, the area of maximum loading reached the bottom of the column. Further immobilization of cells then seemed to occur evenly along the whole length of the column, until a steady state was reached, typically when the entire length of the column had attained a loading of some 30-35 g wet yeast (kg) -1 support.
When 10 or fewer column volumes of a 0.5 g (wet yeast) l I suspension were used, the amount of cells removed by the column from the suspension was virtu- ally 100% (including cells held in interparticle spaces, and those entrapped in intraparticle spaces). Even af- ter the interparticle cells had been washed from the column, the C2 particles still contained over 80% of all the cells passed into the column (Figure 6B). This demonstrates the efficiency of this system of immobili- zation, and shows that low cell concentrations can be used to achieve a suitable initial loading, with very little waste of cells. It could be concluded that entrap- ment of cells within the particles is by far the most significant process initially, while as more cells are passed down the column, filtration between particles becomes the more important process, typically after 200 ml (20 column volumes) of a 0.5 g (wet yeast) 1 -~ suspension have been passed down the column.
Determination of the mechanism of cell loading
SEM inspection of particles indicated that at the steady state loading, essentially all particles had en- trapped cells, in contrast to the 50% maximum that might have been expected from the argument given above. This suggested that cells had entered even those cells which had an orifice oriented away from the flowing stream. Thus it was clear that a mechanism other than simple filtration was also occurring within the columns. Further evidence that the great majority of leached particles had entrapped cells was sought by studying the particles individually by means of a Coul- ter counter. However, the sensitivity of this device was insufficient for this purpose.
If a mechanism other than simple filtration was at work, one would not expect "unetched" particles to immobilize cells. It was found (Figure 7) that the ex- tent of cell immobilization by columns of unetched particles was in fact greater (on the basis of particle volume; see Materials and methods), by some 30%, than that obtained with the normal, leached Biofix. Thus a mechanism other than simple filtration must indeed have been occurring to allow each particle to entrap cells in the former case. A consideration (Fig- ure 8) of the hydrodynamic forces operating suggested that these alone would force cells to be deposited in- side a matrix of the present morphology when the ori- fice was not facing the direction of flow, a mechanism we therefore refer to as hydrodynamic deposition or the "lobster-pot" effect.
Certainly, one might have expected that etched par- ticles would have entrapped more cells than did unet- ched particles, since the former potentially have two
5O-
T 45-
o 40-
® 35-
30-
25- as
.$ 2O-
15-
10- as
5
C 0
Figure 7
÷
+ D
I i i i ~ i
0 10 30 50 70 90
Column volumes
Comparison of the rate and extent of immobilization of S. cerevisiae using etched and unetched Biofix C2 particles. A column was formed from a standard 20-ml syringe barrel with 3.5 g of etched (71) or unetched (+) particles added and a cotton wool baffle positioned on top of the particles. Various volumes of cell suspension (0.5 mg wet wt ml 1) in 0.2 M KH2PO4 were passed through the column using a peristaltic pump (Method 3; see Materials and methods). After the stated number of column volumes of cell suspension had been passed, the column was washed with 10 column volumes of buffer. Column loading was calculated by protein determination on a range of samples taken throughout the column, the results being averaged. Each point on the graph therefore represents a separate column
©
I
Figure 8 Diagrammatic representation of the hydrodynamic forces that may be operating to al low cell entrapment by hydro- dynamic deposition. The f low of liquid through the column is essentially laminar. Because the ceramic particles offer a resis- tance to the f low of fluid, there will be a pressure drop across them. In particles whose mesopore faces in the same direction as the fluid flow, this wil l have the effect of tending to force cells into the mesopore. In particles whose mesopore is facing the direction of fluid flow, filtration forces can operate to immobilize the cells
426 E n z y m e M i c r o b . T e c h n o l . , 1990, vo l . 12, J u n e
mechanisms of cell immobilization, viz. filtration, due to the particles' porosity, and hydrodynamic deposi- tion, whereas the unetched particles can entrap cells only via hydrodynamic deposition. Yet it was ob- served (Figure 7) that the etched particles in fact im- mobilize fewer cells per unit column volume. It may be concluded that the hydrodynamic forces which we suggest to be operating to entrap cells within the cen- tral pore of these particles are (as one may expect) greater when fluid flow through the particle is inhibited (and thus the pressure drop across it maximized).
Surface treatments
We next studied whether surface treatment of the par- ticles with chemically reactive groups would increase the extent of cell loading and its irreversibility. Four surface treatments [3-amino propyl silane, poly(ethy- leneimine), and two commercially available cationic polymers] were investigated (see Materials and meth- ods and Figure 9). Loadings achieved with three of the four surface treatments (with washing of the columns using 10 column volumes of cell-free buffer as usual) were comparable to those obtained using untreated C2 particles, while 3-aminopropyl silane-treated particles
45-
i 40
35-
~d 30-
25-
~. 20-
15-
.~ 10-
N 5
Figure 9
÷
+
i i I T i
10 30 50 70 90
Column volumes
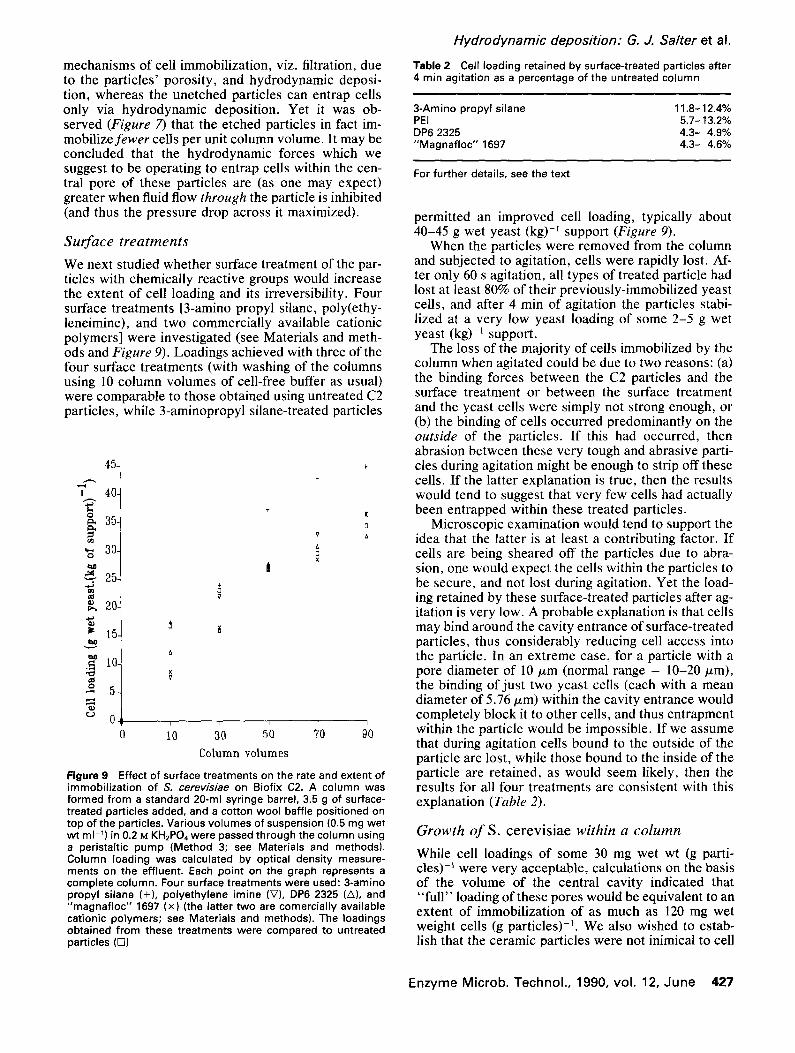
Effect of surface treatments on the rate and extent of immobilization of S. cerevisiae on Biofix C2. A column was formed from a standard 20-ml syringe barrel, 3.5 g of surface- treated particles added, and a cotton wool baffle positioned on top of the particles. Various volumes of suspension (0.5 mg wet wt m1-1) in 0.2 M KH2PO4 were passed through the column using a peristaltic pump (Method 3; see Materials and methods). Column loading was calculated by optical density measure- ments on the effluent. Each point on the graph represents a complete column. Four surface treatments were used: 3-amino propyl silane (+), polyethylene imine (V), DP6 2325 (A), and "magnafloc" 1697 (x) (the latter two are comercially available cationic polymers; see Materials and methods). The Ioadings obtained from these treatments were compared to untreated particles (E3)
Hydrodynamic deposition: G. J. Salter et al.
Table 2 Cell loading retained by surface-treated particles after 4 rain agitation as a percentage of the untreated column
3-Amino propyl silane 11.8-12.4% PEI 5.7-13.2% DP6 2325 4.3- 4.9% "Magnafloc" 1697 4.3- 4.6%
For further details, see the text
permitted an improved cell loading, typically about 40-45 g wet yeast (kg) -~ support (Figure 9).
When the particles were removed from the column and subjected to agitation, cells were rapidly lost. Af- ter only 60 s agitation, all types of treated particle had lost at least 80% of their previously-immobilized yeast cells, and after 4 min of agitation the particles stabi- lized at a very low yeast loading of some 2-5 g wet yeast (kg) -1 support.
The loss of the majority of cells immobilized by the column when agitated could be due to two reasons: (a) the binding forces between the C2 particles and the surface treatment or between the surface treatment and the yeast cells were simply not strong enough, or (b) the binding of cells occurred predominantly on the outside of the particles. If this had occurred, then abrasion between these very tough and abrasive parti- cles during agitation might be enough to strip off these cells. If the latter explanation is true, then the results would tend to suggest that very few cells had actually been entrapped within these treated particles.
Microscopic examination would tend to support the idea that the latter is at least a contributing factor. If cells are being sheared off the particles due to abra- sion, one would expect the cells within the particles to be secure, and not lost during agitation. Yet the load- ing retained by these surface-treated particles after ag- itation is very low. A probable explanation is that cells may bind around the cavity entrance of surface-treated particles, thus considerably reducing cell access into the particle. In an extreme case, for a particle with a pore diameter of 10/xm (normal range = 10-20/zm), the binding of just two yeast cells (each with a mean diameter of 5.76/zm) within the cavity entrance would completely block it to other cells, and thus entrapment within the particle would be impossible. If we assume that during agitation cells bound to the outside of the particle are lost, while those bound to the inside of the particle are retained, as would seem likely, then the results for all four treatments are consistent with this explanation (Table 2).
Growth o f S. cerevisiae within a column
While cell loadings of some 30 mg wet wt (g parti- cles) -~ were very acceptable, calculations on the basis of the volume of the central cavity indicated that "full" loading of these pores would be equivalent to an extent of immobilization of as much as 120 mg wet weight cells (g particles) -j. We also wished to estab- lish that the ceramic particles were not inimical to cell
Enzyme Microb. Technol . , 1990, vol . 12, June 4 2 7
Papers
130.
120.
ll0.
100-
90,
~ 80,
50.
oF-q
3O
~ 2o
'2i--
70
60
-20 ~
i p I i i i r i i i i i i i i i i . 1 i 0
2 4 6 8 I0 12 14 16 18 20 22 24 26 28
Column age (hours)
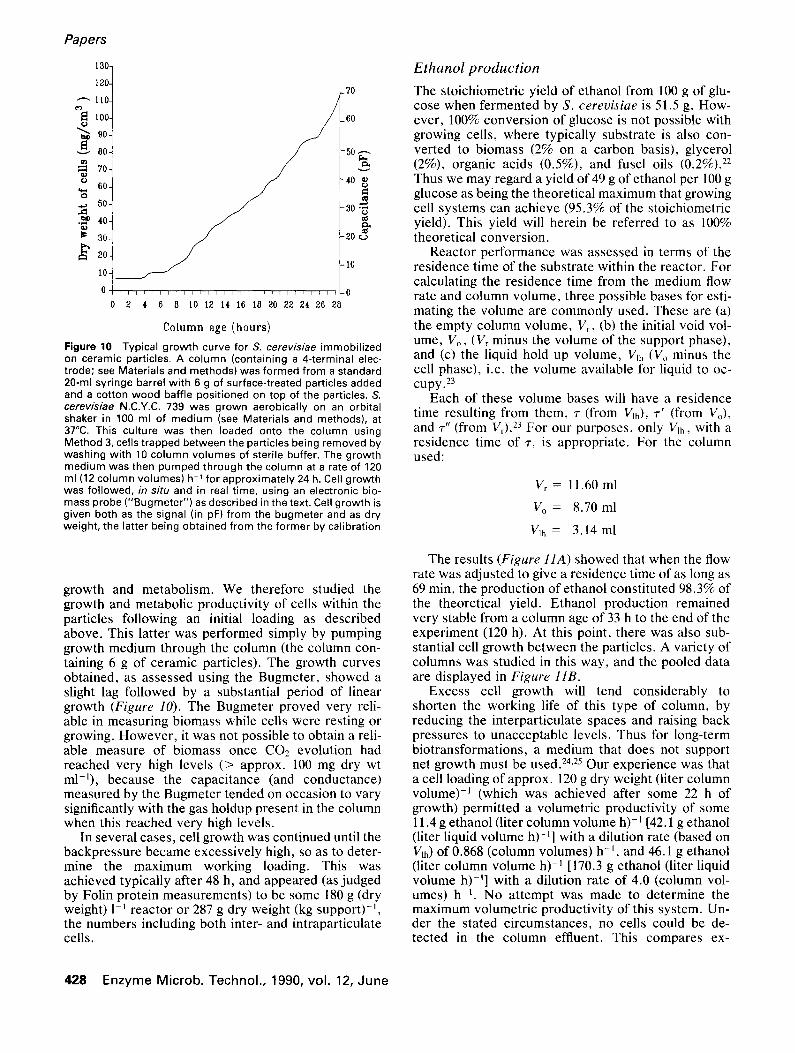
Figure 10 Typical growth curve for S. cerevisiae immobilized on ceramic particles. A column (containing a 4-terminal elec- trode; see Materials and methods) was formed from a standard 20-ml syringe barrel with 6 g of surface-treated particles added and a cotton wood baffle positioned on top of the particles. S. cerevis/ae N.C.Y.C. 739 was grown aerobically on an orbital shaker in 100 ml of medium (see Materials and methods), at 37°C. This culture was then loaded onto the column using Method 3, cells trapped between the particles being removed by washing with 10 column volumes of sterile buffer. The growth medium was then pumped through the column at a rate of 120 ml (12 column volumes) h 1 for approximately 24 h. Cell growth was followed, in situ and in real time, using an electronic bio- mass probe ("Bugmeter") as described in the text. Cell growth is given both as the signal (in pF) from the bugmeter and as dry weight, the latter being obtained from the former by calibration
growth and metabolism. We therefore studied the growth and metabolic productivity of cells within the particles following an initial loading as described above. This latter was performed simply by pumping growth medium through the column (the column con- taining 6 g of ceramic particles). The growth curves obtained, as assessed using the Bugmeter, showed a slight lag followed by a substantial period of linear growth (Figure 10). The Bugmeter proved very reli- able in measuring biomass while cells were resting or growing. However, it was not possible to obtain a reli- able measure of biomass once CO2 evolution had reached very high levels (> approx. I00 mg dry wt ml-]), because the capacitance (and conductance) measured by the Bugmeter tended on occasion to vary significantly with the gas holdup present in the column when this reached very high levels.
In several cases, cell growth was continued until the backpressure became excessively high, so as to deter- mine the maximum working loading. This was achieved typically after 48 h, and appeared (as judged by Folin protein measurements) to be some 180 g (dry weight) 1 ] reactor or 287 g dry weight (kg support) -j, the numbers including both inter- and intraparticulate cells.
Ethanol production
The stoichiometric yield of ethanol from 100 g of glu- cose when fermented by S. cerevisiae is 51.5 g. How- ever, 100% conversion of glucose is not possible with growing cells, where typically substrate is also con- verted to biomass (2% on a carbon basis), glycerol (2%), organic acids (0.5%), and fusel oils ( 0 . 2 % ) . 22
Thus we may regard a yield of 49 g of ethanol per 100 g glucose as being the theoretical maximum that growing cell systems can achieve (95.3% of the stoichiometric yield). This yield will herein be referred to as 100% theoretical conversion.
Reactor performance was assessed in terms of the residence time of the substrate within the reactor. For calculating the residence time from the medium flow rate and column volume, three possible bases for esti- mating the volume are commonly used. These are (a) the empty column volume, V~, (b) the initial void vol- ume, Vo, (Vr minus the volume of the support phase), and (c) the liquid hold up volume, VIh (Vo minus the cell phase), i.e. the volume available for liquid to oc- cupy. 23
Each of these volume bases will have a residence time resulting from them, r (from V~h), r ' (from Vo), and ~-" (from Vr). 23 For our purposes, only VLh, with a residence time of ~-, is appropriate. For the column used:
V~ = 11.60 ml
Vo = 8.70 ml
Vlh = 3.14 ml
The results (Figure llA) showed that when the flow rate was adjusted to give a residence time of as long as 69 min, the production of ethanol constituted 98.3% of the theoretical yield. Ethanol production remained very stable from a column age of 33 h to the end of the experiment (120 h). At this point, there was also sub- stantial cell growth between the particles. A variety of columns was studied in this way, and the pooled data are displayed in Figure lIB.
Excess cell growth will tend considerably to shorten the working life of this type of column, by reducing the interparticulate spaces and raising back pressures to unacceptable levels. Thus for long-term biotransformations, a medium that does not support net growth must be used. 24,25 Our experience was that a cell loading of approx. 120 g dry weight (liter column volume) -] (which was achieved after some 22 h of growth) permitted a volumetric productivity of some 11.4 g ethanol (liter column volume h) -1 [42.1 g ethanol (liter liquid volume h)-1] with a dilution rate (based on Vlh) of 0.868 (column volumes) h -1, and 46.1 g ethanol (liter column volume h) -1 [170.3 g ethanol (liter liquid volume h)-'] with a dilution rate of 4.0 (column vol- umes) h 1. No attempt was made to determine the maximum volumetric productivity of this system. Un- der the stated circumstances, no cells could be de- tected in the column effluent. This compares ex-
428 E n z y m e M i c r o b . T e c h n o l . , 1990, vo l . 12, J u n e

tremely favorably (see Table 3) with the cell loadings 21 and volumetric ethanol productivities 2~,26 recently listed for S. cerevisiae. Thus the present type of ap- proach would appear to offer a distinct improvement over similar inorganic supports such as Pouzzolane (brick), Cordierite, fritted glass, zirconia ceramic and "porous brickettes, ''21 and Ioadings are directly com-
100-~ u
90
.+
.I
0 ~ i i i i F ] r I I
20 40 60 80 100
Working age of column (hours)
~ 9
8
i
0
I w 7 2
-~ 80-
7 0 - t ~ O ~9
~ 60 -
~ 50 -
- ~ 4 0 -
o 3 0 -
~ 20-
100 -
9 0 -
10-
0
0
13
0
[3
D
I P I I J P t P I r ] I I t
i 2 3 4 5 6 7 8 9 10 11 12 13 14
Dilution rate (h)
Figure 11 Ethanol production and glucose consumption by a column of immobil ized S. cerevisiae. Cells were immobilized and grown up in situ for 24 h as described in the legend to Figure 10. The medium (containing 100 g I 1 glucose) is de- scribed in the Materials and methods section (A) The initial dilu- tion rate was 3 h 1. At the first arrow, the dilution rate was changed to 3.4 h -1, at the second arrow to 4 h -+, and at the third arrow to 1.5 h 1. In each case, a steady state was attained. (El) Ethanol; ( - ) glucose. (B) Effect of dilution rate (based on V~h, the column volume available for liquid to occupy) on the extent of conversion of glucose to ethanol for a number of columns pre- pared and studied as described in Figure 11A
Hydrodynamic deposition: G. J. Salter et al.
Table 3 Reported volumetric productivities for ethanol produc- tion by S. cerevisiae in various reactor types
Productivity Reactor Support (g I lh-1) Ref.
Packed bed Biofix C2 46.1 This work Continuous stirred
tank without cell recycle 7.0 27
Continuous stirred tank with cell recycle 29.0 27
Batch fermentor Free cells 2.2 27 Vacuum fermentor
with cell recycle 82 27 Stirred tank Ca alginate beads 15 28 Fluidized bed Ca alginate beads 20 29 Packed bed Ca alginate
reinforced with polymer 26.8 30
Packed bed Ca alginate 36.5 31 Cross-flow Ca alginate 37.1 32 Tapered bed Ca alginate 27.0 33 Rotating disk Sponge 4.3 34 Rotating drum Ca alginate 11.9 35 Rotorfermentor 28.4 36 Tower 26.5 37 Hollow fiber 10.0 38 Packed bed Wood chips 21.8 39
parable to the level of biomass typically attained 21 in a vacuum fermentor with cell recyle.
C o n c l u s i o n
The present approach, exploiting the phenomenon of hydrodynamic deposition, allows one to produce a column of immobilized cells both quickly and easily. The best approach, which may be scaled up as appro- priate, was found to be as follows. A column is formed as usual, with glass or cotton-wool baffles at each end, containing the "Biofix" immobilization matrix. A cell suspension (0.14-8.4 g dry wt 1-1) is pumped through the column at a flow rate exceeding 3 column volumes min -~. The column is then washed by passing 10 column volumes of cell-free buffer through the column at a rate comparable to that stated above. The immobi- lized ceils can then be grown on over a suitable period to the desired loading by passing a growth medium through the column. Once the desired loading has been reached, media preventing or restricting further cell growth can be used in the working column. Columns produced in this manner allow very high concentra- tions of biomass to be achieved, and thus a high con- version rate of substrate(s).
A c k n o w l e d g e m e n t s
We thank the Science and Engineering Research Council, UK, for the award of a CASE Studentship to G.J.S., and Porton International for additional finan- cial support.
Enzyme Microb. Technol., 1990, vol. 12, June 429
Papers
References
I Venkatsubramanian, K. (ed.) lmmobilised Microbial Cells, ACS Symp Ser. Vol. 106, 1979, American Chemical Society, Washington
2 Bucke, C. Phil. Trans. R. Soc. 1980, 300, 369 3 Birnbaum, S., Larsson, P.-O. and Mosbach, K. in Solid-Phase
Biochemistry (Scouten, W. H., ed.) Wiley, Chichester, 1983, p. 679
4 Chibata, I. and Wingard, L. B., Jr. (ed.) Immobilised Micro- bial Cells Academic Press, New York, 1983
5 Cheetham, P. S. J. in Principles ofBiotechnology (Wiseman, A., ed.) Surrey University Press, Guildford, 1983, p. 172
6 Mattiasson, B. (ed.) Immobilised Cells and Organelles, Vols. 1 and H CRC Press, Boca Raton, Florida, 1983
7 Chibata, I., Tosa, T. and Fujimura, M. Annu. Rep. Ferm. Proc. 1983, 6, 1
8 Tramper, J. Trends Biotechnol. 1985, 3, 45 9 Webb, C., Black, G. M. and Atkinson, B. (eds.) Process Engi-
neering Aspects of lmmobilised Cell Systems. Institute of Chemical Engineers, Rugby, 1986
10 Scott, C. D. Enzyme Microb. Technol. 1987, 9, 66-73 11 Akin, C. Biotechnol. Genet. Eng. Rev. 1987, 5, 319-367 12 Tampion, J. and Tampion, M. D. Immobilized Cells: Princi-
ples and Applications Cambridge University Press, Cam- bridge, 1987
13 Kierstan, M. and Bucke, C. Biotechnol. Bioeng. 1977, 19, 387-397
14 Lovitt, R. W., Walter, R. P., Morris, J. G., and Kell, D. B. Appl. Microbiol. Biotechnol. 1986, 23, 168-173
15 Emery, A. N. and Mitchell, D. A. in ref. 9, p. 87 16 Adams, J. M., Ash, L. A., Brown, A. J., James, R., Kell, D.
B., Salter, G. J. and Walter, R. P. Int. Biotechnol. Lab. 1988, 6, 22-27
17 ECC International, U.K. Patent Application No. 2153807A 18 Lowry, O. H., Rosebrough, N. J., Farr, A. L. and Randall, R.
J. J. Biol. Chem. 1951, 193, 265-275 19 Smith, P. K., Krohn, R. I., Hermanson, G. T., Mallia, A. K.,
Gartner, F. H., Provenzano, M. D,, Fujimoto, E. K., Goeke,
N. M., Olson, B. J. and Klenk, D. C. Anal. Biochem. 1985, 150, 76-85
20 Harris, C. M., Todd, R. W., Bungard, S. J., Lovitt, R. W., Morris, J. G. and Kell, D. B. Enzyme Microb. Technol. 1987, 9, 181-186
21 Ansleme, M. J. and Tedder, D. W. Biotechnol. Bioeng. 1987, 30, 6, 736-745
22 Dellweg, H. and Luca, S. F. Process Biochem. 1988, 23, 100- 104
23 Vega, J. L., Clausen, E. C. and Gaddy, J. L. Enzyme Microb. Technol. 1988, 10, 390-402
24 Sitton, O, C. and Gaddy, J. L. Biotechnol. Bioeng. 1980, 22, 1735
25 Vega, J. L., Clausen, E. C. and Gaddy, J. L. Biotechnol. Bioeng. 1987, 29, 429
26 Shama, G. Process Biochem. 1988, 23, 138-145 27 Cysewski, G. R. and Wilke, C. R. Biotechnol Bioeng. 1978,
20, 1421 28 Lee, T. H., Ahn, J. C. and Ryu, D. D. Y. Enzyme Microb.
Technol. 1983, 5, 41 29 Nagashima, M., Azuma, M., Noguchi, S., Inuzuka, S. and
Samejima, H. Biotechnol. Bioeng. 1984, 20, 1421 30 Kuu, W. Y. and Polack, J. A. Biotechnol. Bioeng. 1983, 25,
1995 31 Shiotani, T. and Yamane, T. Eur. J. Appl. Micro. Biotech.
1981, 13, 96 32 Chotani, G. K. and Constantinides, A. Biotech. Bioeng. 1984,
26, 217 33 Matteau, P. P. and Choma, C. E. T. Proceedings of the 34th
Can. Chem. Eng. Conf. 1984, 254 34 Del Borghi, M., Converti, A., Parisi, F. and Ferraiolo, G.
Biotechnol. Bioeng. 1985, 27, 761 35 Lee, C. W. and Chang, H. N. Enzyme Microb. Technol. 1985,
7, 561 36 Margaritis, A. and Wilke, C. R. Biotech. Bioeng. 1978, 20,727 37 Prince, 1. G. and Barford, J. P. Biotech. Lett. 1982, 4, 621 38 Mehaia, M. A. and Cheryan, M. Appl. Micro. Biotech. 1984,
20, 100 39 Moo-Young, M., Lamptey, J. and Robinson, C. W. Biotech.
Lett. 1980, 2, 541-548
430 Enzyme Microb. Technol., 1990, vol. 12, June