hydroclimate report water year 2015€¦ · hydroclimate report. water year 2015. ... april...
TRANSCRIPT

CALIFORNIA DEPARTMENT OF WATER RESOURCES
Hydroclimate Report
Water Year 2015Office of the State Climatologist
Executive SummaryWater year 2015 added a fourth year
to the ongoing drought in Califor-
nia, with observations indicative of
a changing climate, including record
warmth. The Water year ended
with record high temperatures, and
preceded a period of historically low
precipitation that started in 2012. April
snowpack measurements in 2014 tied
the historic record low of 1977. Expec-
tations of a developing El Niño event
in the eastern tropical Pacific fueled
notions that water year 2015 would be
better. However, during the first two
months of the water year, warm tem-
peratures persisted and precipitation
continued to fall short of expectations.
The developing El Niño event stalled
as California headed into the heart of
its wet season.
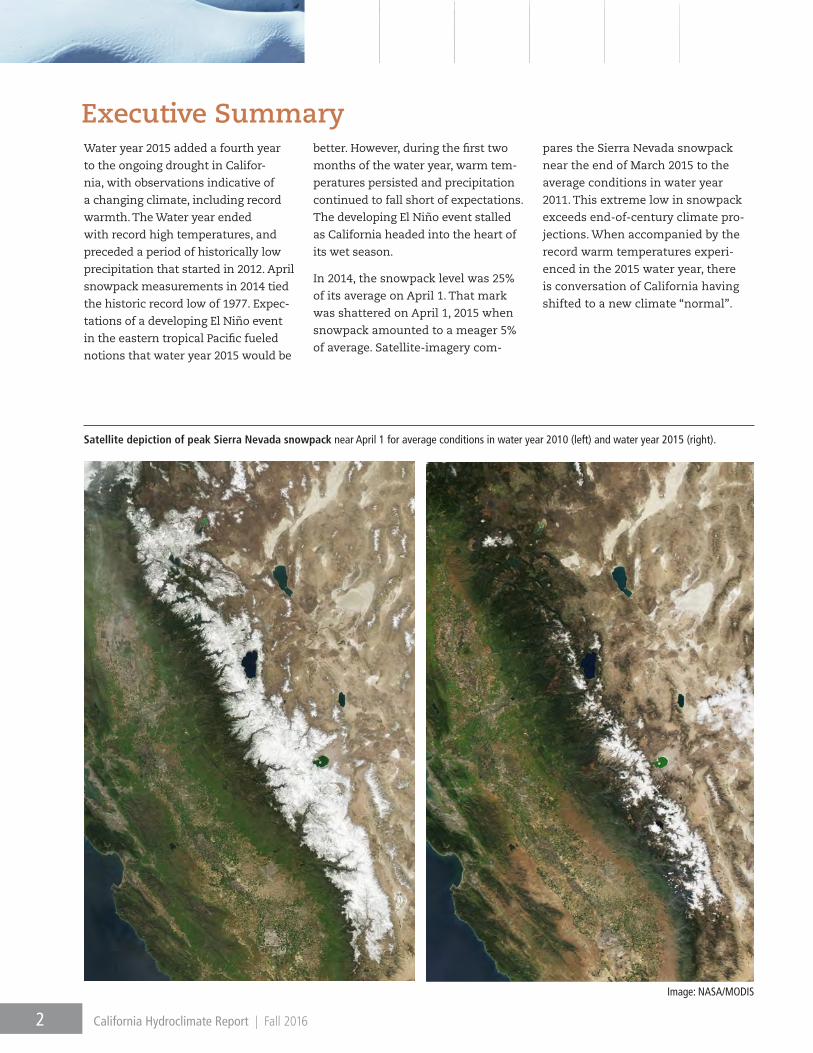
In 2014, the snowpack level was 25%
of its average on April 1. That mark
was shattered on April 1, 2015 when
snowpack amounted to a meager 5%
of average. Satellite-imagery com-
pares the Sierra Nevada snowpack
near the end of March 2015 to the
average conditions in water year
2011. This extreme low in snowpack
exceeds end-of-century climate pro-
jections. When accompanied by the
record warm temperatures experi-
enced in the 2015 water year, there
is conversation of California having
shifted to a new climate “normal”.
Satellite depiction of peak Sierra Nevada snowpack near April 1 for average conditions in water year 2010 (left) and water year 2015 (right).
Image: NASA/MODIS
2 California Hydroclimate Report | Fall 2016
Table of Contents 1) Executive Summary ............................................................................................ 2
2) Introduction ......................................................................................................... 4
3) What is a Water Year? ......................................................................................... 5
4) 2015 Summary of Climate Indicators ............................................................... 6
a) “At a Glance” Graphic ................................................................................... 6
5) Annual Air Temperature ..................................................................................... 8
a) WRCC Climate Regions ................................................................................. 8
b) NOAA Climate Divisions ............................................................................... 9
6) Annual Precipitation ......................................................................................... 10
a) WRCC Climate Regions ............................................................................... 10
b) Northern Sierra 8-Station ........................................................................... 11
c) San Joaquin 5-Station ................................................................................. 11
7) Unimpaired Streamflow ................................................................................... 15
a) April – July Runoff Sacramento River System .......................................... 15
b) April – July Runoff San Joaquin River System .......................................... 15
8) Snowpack ............................................................................................................ 12
a) April 1st Snow Water Equivalent (SWE) ................................................... 12
i) Statewide ................................................................................................. 12
ii) Northern Sierra ...................................................................................... 13
iii) Southern Sierra ...................................................................................... 13
9) Rain/Snow Trends .............................................................................................. 14
10) Sea Level ............................................................................................................. 16
a) Crescent City ................................................................................................ 16
b) San Francisco ............................................................................................... 16
c) La Jolla ........................................................................................................... 16
11) Notable Climate Events and Weather Extremes ........................................... 17
12) Appendix ............................................................................................................ 21
13) References .......................................................................................................... 27
Front and back cover earth images courtesy of earth.nullschool.net
3Fall 2016 | California Hydroclimate Report
IntroductionThe hydrology and climate of California
impact the California Department
of Water Resources’ (DWR) mission
to manage the water resources of
California in cooperation with other
agencies, to benefit the State’s people,
and to protect, restore, and enhance the
natural and human environments.
DWR has a long history of tracking
variables that may be of use in assess-
ing climate change impacts on water
resources. With the concern of climate
change and hydrologic change indicated
by climate modeling simulations and
measured data, DWR recognizes the
need to plan for the future and to track
continuing data trends. Indications of
an uncertain climate future means the
State will have to plan, manage, and
adapt differently than in the past.
Climate change management is a
core DWR value and the Department
is actively planning for anticipated
impacts of climate change. This report
supports these efforts.
Based on current observed hydrologic
and climatic trends, there is consid-
erable evidence that the climate is
shifting, no longer can stationarity be
assumed in long-term planning. The
future is now, and real changes need
to be documented as new data become
available. Following on the efforts
of the National Climate Assessment
and the California EPA Indicators of
Climate Change in California Report
(CA EPA, 2013), this report will begin
documenting characteristics of a
changing climate on California’s water
resources. By tracking change through
a collection of indicators on an annual
basis, it is hoped that transitions of
important thresholds can be better
anticipated, enabling the continued
refinement of adaptation strategies.
This report includes key indicators for
hydrology and climate in California
and will be updated annually with the
newest available data to track import-
ant trends, provide a compilation
of indicators, and provide graphical
visualization of data trends that are of
interest to water managers, the media,
State government, and the research
community. Key indicators included in
the Hydroclimate Report are listed in
Table 1. Hydroclimate is defined in this
report as natural hydrologic processes
such as streamflow, snowpack, sea
level, and precipitation; which are
directly and indirectly linked to climate
features, such as temperature trends
and the nature of annual storms that
bring precipitation, providing a primary
source of freshwater.
Going forward, additional new data,
such as information collected by
atmospheric river research to better
understand California’s water supply
and flood events may result in addi-
tional indicator metrics warranting
inclusion in future reports. Therefore,
the Hydroclimate Report will be a
living document and will be reflective
of current needs, new data sources,
and analysis strategies as they come
available providing the best scientific
information available.
Table 1. Key Hydroclimate Indicators
Indicators Spatial Resolution Temporal Resolution Period of Record Data Source
Temperature (Air) WRCC Climate Regions Monthly Mean 1895-present WRCC
Temperature (Air) NOAA Climate Divisions Annual Calendar Year 1895-present NOAA
Precipitation WRCC Climate Regions Monthly 1895-present WRCC
Precipitation Northern Sierra 8-Station Annual Cumulative 1921-present DWR
Precipitation San Joaquin 5-Station Annual Cumulative 1913-present DWR
Snowpack (Snow Water Equivalent) Statewide April 1st 1950-present Cooperative Snow Survey
Snowpack (Snow Water Equivalent) Northern Sierra April 1st 1950-present Cooperative Snow Survey
Snowpack (Snow Water Equivalent) Southern Sierra April 1st 1950-present Cooperative Snow Survey
Streamflow (Unimpaired) Sacramento River Basin April-July 1906-present DWR
Streamflow (Unimpaired) San Joaquin River Basin April-July 1901-present DWR
Rain/Snow (Percent As Rain) Selected Sierra Watersheds Annual Cumulative 1949-present DWR/WRCC
Sea Level Crescent City Tide Gauge Monthly Mean 1933-present NOAA
Sea Level San Francisco Tide Gauge Monthly Mean 1855-present NOAA
Sea Level La Jolla Tide Gauge Monthly Mean 1924-present NOAA
4 California Hydroclimate Report | Fall 2016
What Is A Water Year?W
AT
E R Y EA
R
W
AT
E R Y EA
R
ST
AR
TJanuary
1%
December41%
November11%
October10%
July - September
3% June2%
May3%
February20%
March3%
April6%
Water Year 2015 by Month
W
AT
E R Y EA
R
ST
AR
T
January18%
December17%
November13%
October6%
July - September
3% June2%
May4%
February16%
March14%
April8%
Long Term Water Year Average by Month
W
AT
E R Y EA
R
W
AT
E R Y EA
R
ST
AR
T
January1%
December41%
November11%
October10%
July - September
3% June2%
May3%
February20%
March3%
April6%
Water Year 2015 by Month
W
AT
E R Y EA
R
ST
AR
T
January18%
December17%
November13%
October6%
July - September
3% June2%
May4%
February16%
March14%
April8%
Long Term Water Year Average by Month
Hydrologic data such as precipitation and
streamflow data are key indicators for the
Hydroclimate Report. These data are typically
represented as being within the water year. A
water year (also discharge year or flow year) is a
term commonly used in hydrology to describe a
time period of 12 months during which precipi-
tation totals are measured. Its beginning differs
from the calendar year because precipitation in
California starts to arrive at the start of the wet
season in October and continues to the end of
the dry season the following September. On a
calendar year time scale, the October to Decem-
ber precipitation would not be accounted for,
including snowpack that doesn’t melt and run
off until the following spring and summer. DWR
defines a water year in California to include the
period from Oct 1 to Sept 30. The 2015 Water
Year covers the period from Oct 1, 2014 to Sept
30, 2015.
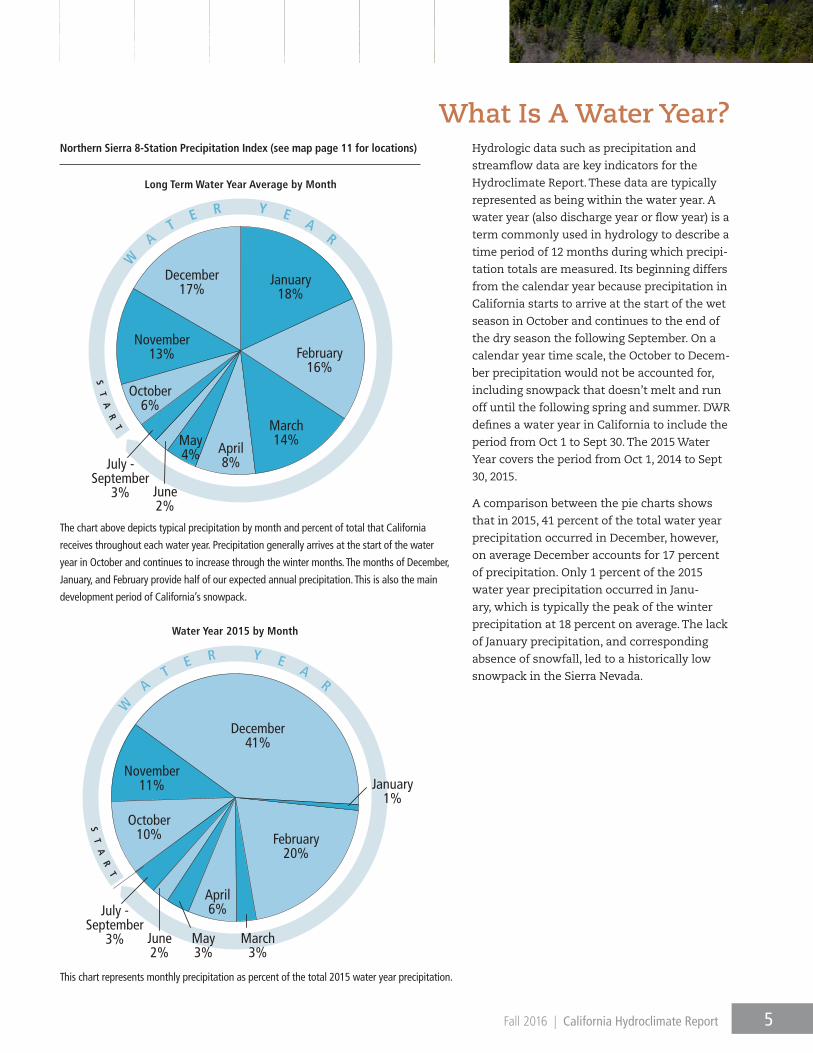
A comparison between the pie charts shows
that in 2015, 41 percent of the total water year
precipitation occurred in December, however,
on average December accounts for 17 percent
of precipitation. Only 1 percent of the 2015
water year precipitation occurred in Janu-
ary, which is typically the peak of the winter
precipitation at 18 percent on average. The lack
of January precipitation, and corresponding
absence of snowfall, led to a historically low
snowpack in the Sierra Nevada.
Northern Sierra 8-Station Precipitation Index (see map page 11 for locations)
The chart above depicts typical precipitation by month and percent of total that California
receives throughout each water year. Precipitation generally arrives at the start of the water
year in October and continues to increase through the winter months. The months of December,
January, and February provide half of our expected annual precipitation. This is also the main
development period of California’s snowpack.
This chart represents monthly precipitation as percent of the total 2015 water year precipitation.
5Fall 2016 | California Hydroclimate Report
Crescent City
Tide Gauge
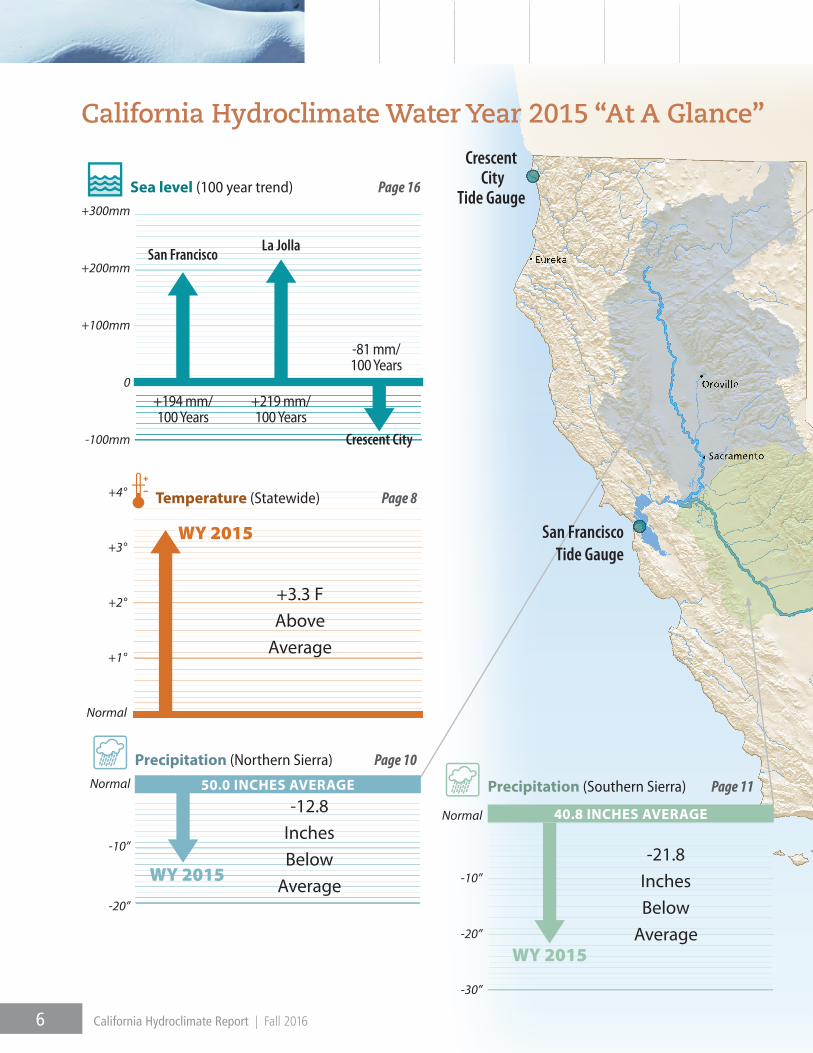
+3.3 F Above
Average
Temperature (Statewide) Page 8
WY 2015
+4°
+3°
+2°
+1°
Normal
Sea level (100 year trend) Page 16
Crescent City
San Francisco La Jolla
+194 mm/100 Years
+219 mm/100 Years
-81 mm/100 Years
+300mm
+200mm
+100mm
0
-100mm
Precipitation (Southern Sierra) Page 11
-21.8 Inches Below
AverageWY 2015
40.8 INCHES AVERAGENormal
-10”
-20”
-30”
50.0 INCHES AVERAGE
Precipitation (Northern Sierra) Page 10
-12.8 Inches Below
Average WY 2015
Normal
-10”
-20”
San Francisco Tide Gauge
6 California Hydroclimate Report | Fall 2016
California Hydroclimate Water Year 2015 “At A Glance”
La JollaTide Gauge
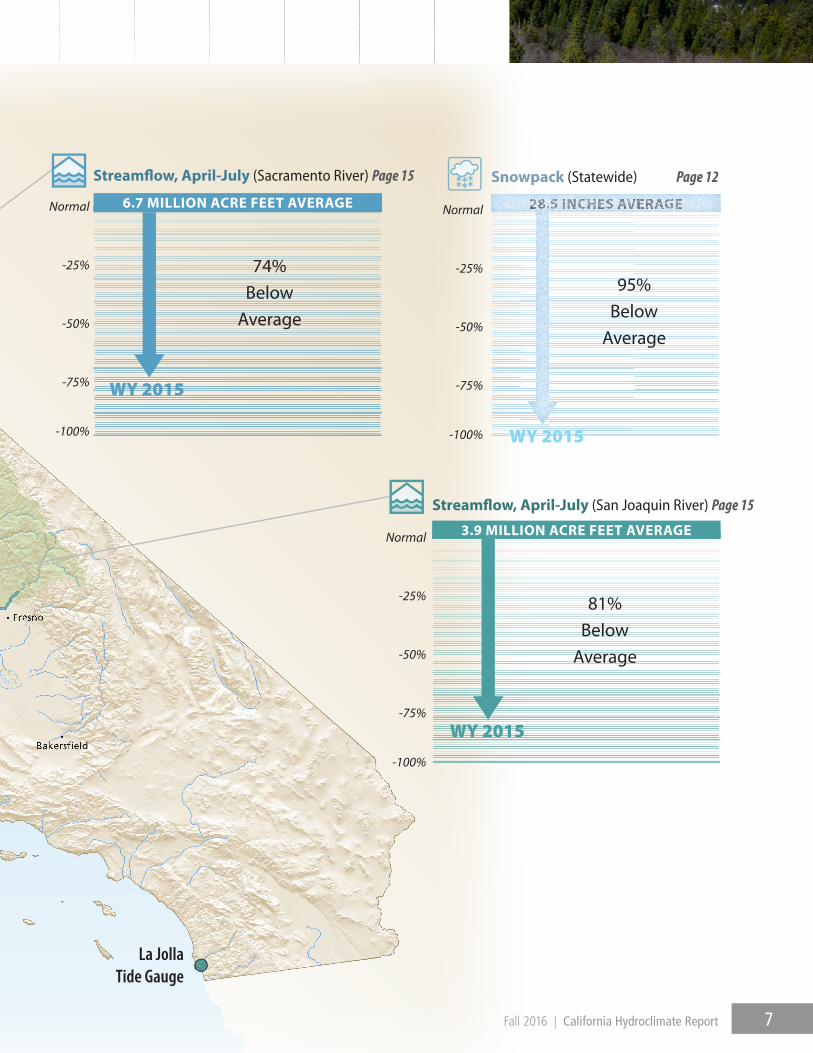
Stream� ow, April-July (Sacramento River) Page 15
74%Below
Average
WY 2015
Normal
-25%
-50%
-75%
-100%
Stream� ow, April-July (San Joaquin River) Page 15
81% Below
Average
WY 2015
Normal
-25%
-50%
-75%
-100%
Snowpack (Statewide) Page 12
95% Below
Average
WY 2015
Normal
-25%
-50%
-75%
-100%
3.9 MILLION ACRE FEET AVERAGE
6.7 MILLION ACRE FEET AVERAGE
7Fall 2016 | California Hydroclimate Report
California Hydroclimate Water Year 2015 “At A Glance”
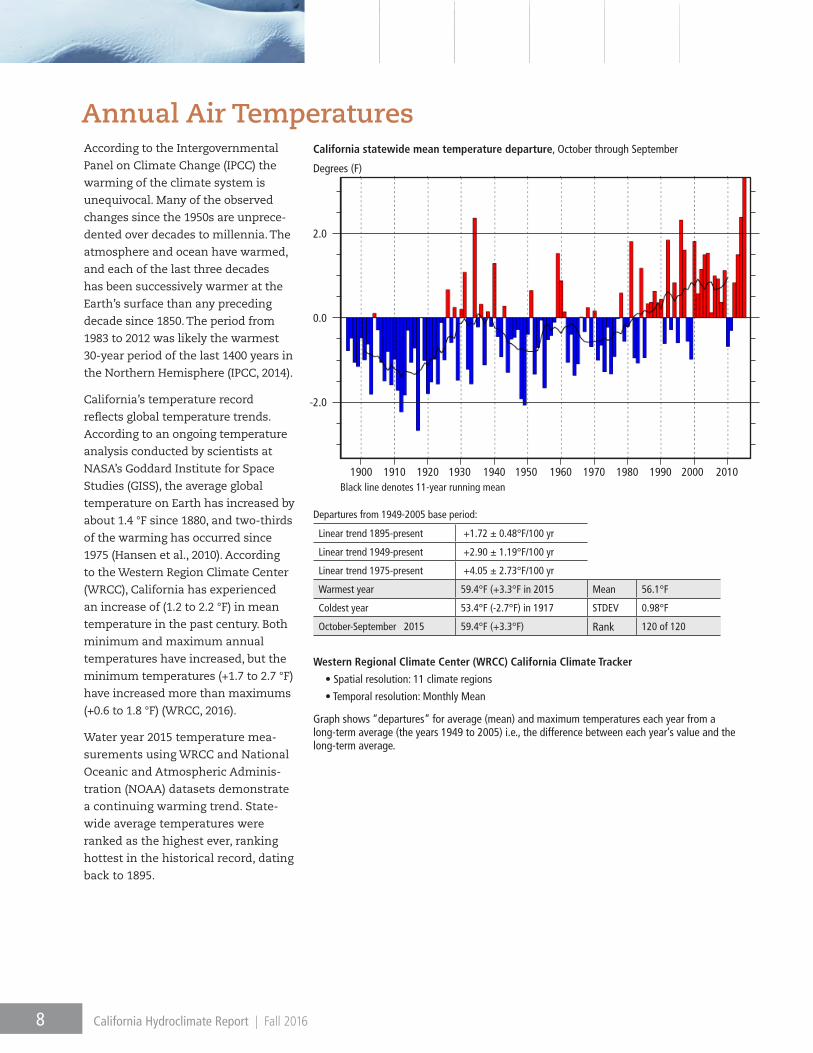
California statewide mean temperature departure, October through September
1900 1910 1920 1930 1940 1950 1960 1970 1980 1990 2000 2010
Degrees (F)
2.0
0.0
-2.0
Black line denotes 11-year running mean
According to the Intergovernmental
Panel on Climate Change (IPCC) the
warming of the climate system is
unequivocal. Many of the observed
changes since the 1950s are unprece-
dented over decades to millennia. The
atmosphere and ocean have warmed,
and each of the last three decades
has been successively warmer at the
Earth’s surface than any preceding
decade since 1850. The period from
1983 to 2012 was likely the warmest
30-year period of the last 1400 years in
the Northern Hemisphere (IPCC, 2014).
California’s temperature record
reflects global temperature trends.
According to an ongoing temperature
analysis conducted by scientists at
NASA’s Goddard Institute for Space
Studies (GISS), the average global
temperature on Earth has increased by
about 1.4 °F since 1880, and two-thirds
of the warming has occurred since
1975 (Hansen et al., 2010). According
to the Western Region Climate Center
(WRCC), California has experienced
an increase of (1.2 to 2.2 °F) in mean
temperature in the past century. Both
minimum and maximum annual
temperatures have increased, but the
minimum temperatures (+1.7 to 2.7 °F)
have increased more than maximums
(+0.6 to 1.8 °F) (WRCC, 2016).
Water year 2015 temperature mea-
surements using WRCC and National
Oceanic and Atmospheric Adminis-
tration (NOAA) datasets demonstrate
a continuing warming trend. State-
wide average temperatures were
ranked as the highest ever, ranking
hottest in the historical record, dating
back to 1895.
Departures from 1949-2005 base period:
Linear trend 1895-present +1.72 ± 0.48°F/100 yr
Linear trend 1949-present +2.90 ± 1.19°F/100 yr
Linear trend 1975-present +4.05 ± 2.73°F/100 yr
Warmest year 59.4°F (+3.3°F in 2015 Mean 56.1°F
Coldest year 53.4°F (-2.7°F) in 1917 STDEV 0.98°F
October-September 2015 59.4°F (+3.3°F) Rank 120 of 120
Western Regional Climate Center (WRCC) California Climate Tracker
• Spatial resolution: 11 climate regions
• Temporal resolution: Monthly Mean
Graph shows “departures” for average (mean) and maximum temperatures each year from a long-term average (the years 1949 to 2005) i.e., the difference between each year’s value and the long-term average.
8 California Hydroclimate Report | Fall 2016
Annual Air Temperatures
0
10
20
30
40
57° 58° 59° 60° 61° 62° 63° 64° 65° 1895-2000 21st Century POR Average
2012
20132015
2014Record Warm
Annual Average Temperature (degF)
Annual Precipitation (Inches)
6
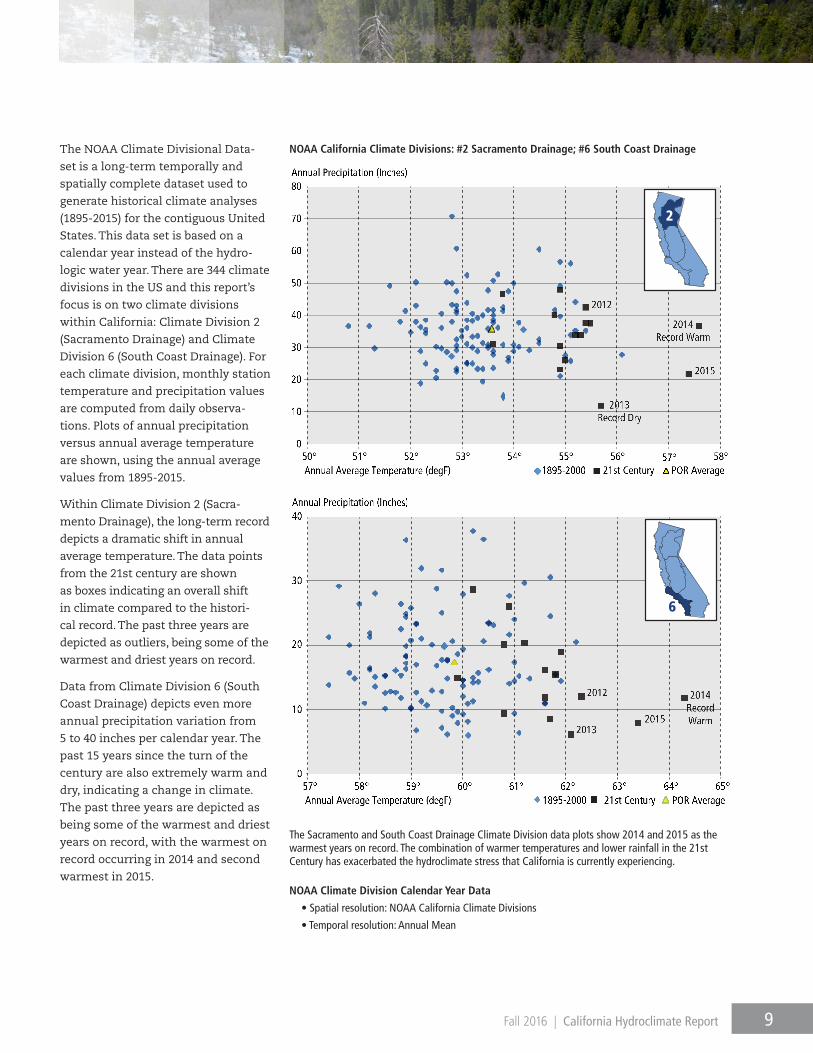
NOAA California Climate Divisions: #2 Sacramento Drainage; #6 South Coast Drainage
0
10
20
30
40
50
60
70
80
50°Annual Average Temperature (degF)
51° 52° 53° 54° 55° 56° 57° 58°
Annual Precipitation (Inches)
1895-2000 21st Century POR Average
2013Record Dry
2014Record Warm
2015
2012
2
The NOAA Climate Divisional Data-
set is a long-term temporally and
spatially complete dataset used to
generate historical climate analyses
(1895-2015) for the contiguous United
States. This data set is based on a
calendar year instead of the hydro-
logic water year. There are 344 climate
divisions in the US and this report’s
focus is on two climate divisions
within California: Climate Division 2
(Sacramento Drainage) and Climate
Division 6 (South Coast Drainage). For
each climate division, monthly station
temperature and precipitation values
are computed from daily observa-
tions. Plots of annual precipitation
versus annual average temperature
are shown, using the annual average
values from 1895-2015.
Within Climate Division 2 (Sacra-
mento Drainage), the long-term record
depicts a dramatic shift in annual
average temperature. The data points
from the 21st century are shown
as boxes indicating an overall shift
in climate compared to the histori-
cal record. The past three years are
depicted as outliers, being some of the
warmest and driest years on record.
Data from Climate Division 6 (South
Coast Drainage) depicts even more
annual precipitation variation from
5 to 40 inches per calendar year. The
past 15 years since the turn of the
century are also extremely warm and
dry, indicating a change in climate.
The past three years are depicted as
being some of the warmest and driest
years on record, with the warmest on
record occurring in 2014 and second
warmest in 2015.
The Sacramento and South Coast Drainage Climate Division data plots show 2014 and 2015 as the warmest years on record. The combination of warmer temperatures and lower rainfall in the 21st Century has exacerbated the hydroclimate stress that California is currently experiencing.
NOAA Climate Division Calendar Year Data
• Spatial resolution: NOAA California Climate Divisions
• Temporal resolution: Annual Mean
9Fall 2016 | California Hydroclimate Report
Annual precipitation data from Cali-
fornia shows significant year-to-year
variation. This inter-annual variability
makes trend analysis difficult for this
indicator. An analysis of precipita-
tion records since the 1890’s shows
no statistically significant trend in
precipitation throughout California.
Although the overall precipitation
trend is generally flat over the past 120
years, the precipitation record indi-
cates significant decadal variability
giving rise to dry and wet periods. A
decadal fluctuation signal has become
apparent in northern California where
winter precipitation varies with a
period of 14 to 15 years. This decadal
signal has increased in intensity over
the twentieth century resulting in
more distinct dry and wet periods
(Ault and St. George 2010). There is no
known physical process driving this
observed precipitation variability and
remains an area for future research.
A limited number of precipita-
tion-producing storms move over
California every water year. Atten-
tion has recently turned to storms
associated with atmospheric rivers.
Atmospheric rivers are long (approxi-
mately 1000 miles), narrow (less than
100 miles wide) swaths of intense
levels of water vapor extending from
tropical regions into the middle lati-
tudes. When atmospheric rivers are
entrained into the leading edge of a
winter storm moving over California,
the result can be heavy precipitation
with snow levels above 10,000 feet.
If the atmospheric river storm lasts
long enough, flooding can result.
Shorter duration atmospheric rivers
associated with cool air and lower
snow levels result in storms that are
beneficial to snowpack and Califor-
nia’s water supply.
Typically, only a few strong atmo-
spheric river storms impact California
during the winter months, and on
average, atmospheric river storms
provide 30 to 50 percent of California’s
annual precipitation and 40 percent
of Sierra snowpack. With warmer
air, and changing ocean conditions,
atmospheric river episodes have the
potential to increase in duration and
intensity (Dettinger, 2011).
Over the past 10 years, DWR has begun
investing in observations to track the
characteristics of atmospheric rivers
as they make landfall in California.
The amount of atmospheric moisture,
structure of the winds with altitude,
and freezing elevation at several
locations are now monitored with
each storm. This effort is being carried
out in partnership with NOAA’s Earth
Systems Research Laboratory and the
Center for Western Weather and Water
Percentile rankings0 1 10 33 67 90 99 100
Record Dry Below Average Above Wet Record Dry Average Average Wet
Extremes (CW3E) at Scripps Institution
of Oceanography. Atmospheric river
data will be included in future reports.
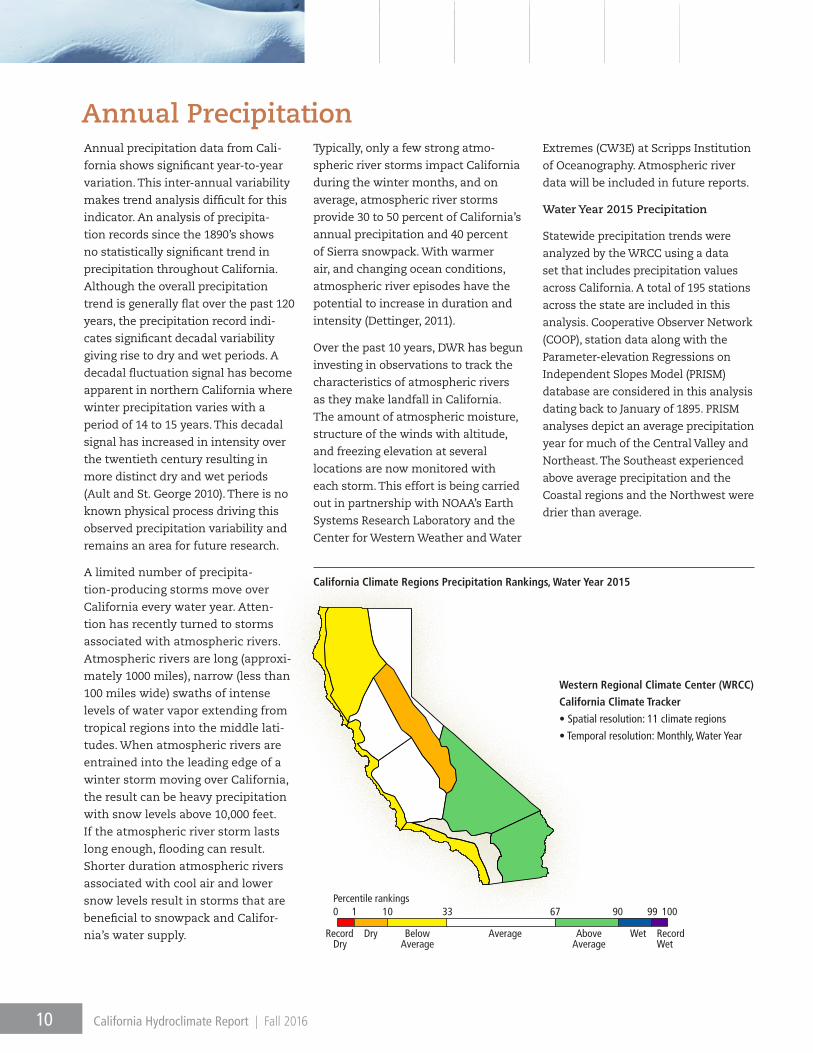
Water Year 2015 Precipitation
Statewide precipitation trends were
analyzed by the WRCC using a data
set that includes precipitation values
across California. A total of 195 stations
across the state are included in this
analysis. Cooperative Observer Network
(COOP), station data along with the
Parameter-elevation Regressions on
Independent Slopes Model (PRISM)
database are considered in this analysis
dating back to January of 1895. PRISM
analyses depict an average precipitation
year for much of the Central Valley and
Northeast. The Southeast experienced
above average precipitation and the
Coastal regions and the Northwest were
drier than average.
California Climate Regions Precipitation Rankings, Water Year 2015
Western Regional Climate Center (WRCC)
California Climate Tracker
• Spatial resolution: 11 climate regions
• Temporal resolution: Monthly, Water Year
10 California Hydroclimate Report | Fall 2016
Annual Precipitation
San Joaquin Precipitation: 5-Station Index
Oct 1 Nov 1 Dec 1 Jan 1 Feb 1 Mar 1 Apr 1 May 1 Jun 1 Jul 1 Aug 1 Sep 1 Oct 1Water Year (October 1 - September 30)
0
5
10
15
20
25
30
35
40
45
50
55
60
65
70
75
80
85
90Cumulative Daily/Monthly Precipitation (inches)
40.8Average (1961-2010)
14.81923-1924
77.41982-1983 (wettest)
65.21997-1998
19.02014-2015
CVT - Calaveras Big TreesStations:
HTH - Hetch HetchyYSV - Yosemite HeadquartersNFR - North Fork RS
HNT - Huntington Lake
Total Water Year Precipitation
50.0
17.11923-1924
88.51982-1983 (wettest)
82.41997-1998
37.22014-2015
MSC - Mount Shasta CitySHA - Shasta Dam
MNR - MineralQRD - QuincyBCM - Brush CreekSRR - Sierraville RSBYM - Blue Canyon
PCF - Paci�c House
Average (1961-2010)
Stations:
0
5
10
15
20
25
30
35
40
45
50
55
60
65
70
75
80
85
90
95
100
Oct 1 Nov 1 Dec 1 Jan 1 Feb 1 Mar 1 Apr 1 May 1 Jun 1 Jul 1 Aug 1 Sep 1 Oct 1Water Year (October 1 - September 30)
Total Water Year PrecipitationCumulative Daily/Monthly Precipitation (inches)
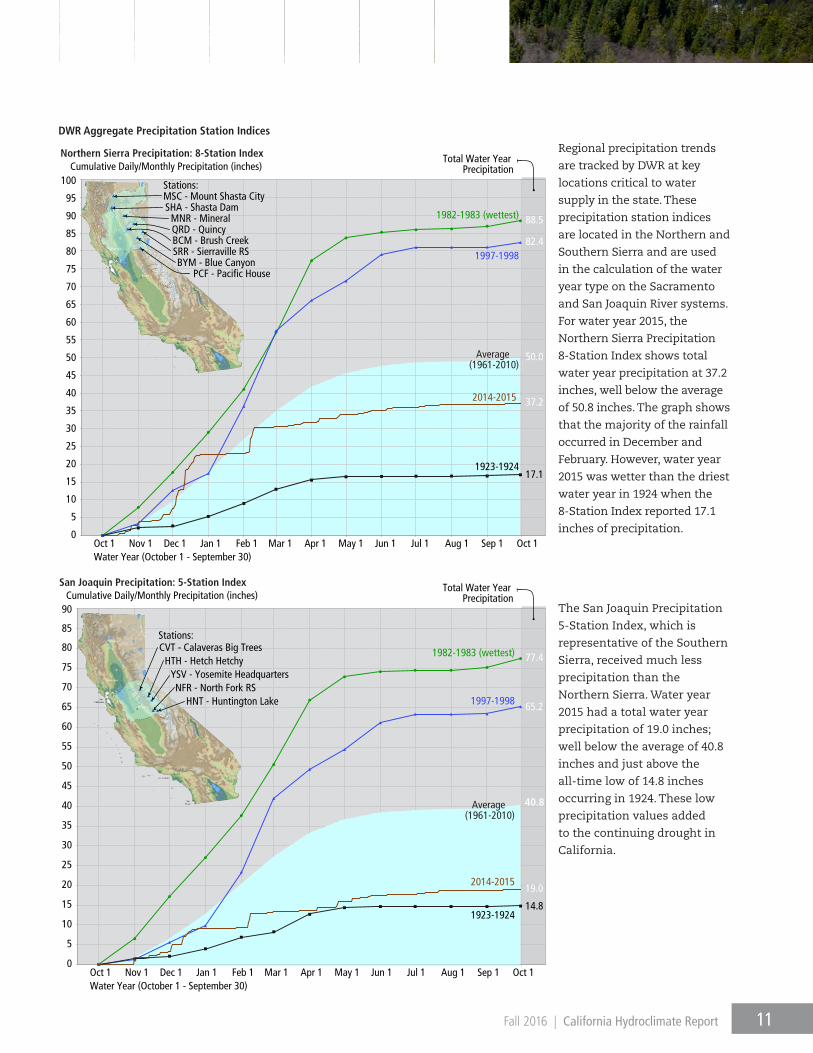
Northern Sierra Precipitation: 8-Station Index Regional precipitation trends
are tracked by DWR at key
locations critical to water
supply in the state. These
precipitation station indices
are located in the Northern and
Southern Sierra and are used
in the calculation of the water
year type on the Sacramento
and San Joaquin River systems.
For water year 2015, the
Northern Sierra Precipitation
8-Station Index shows total
water year precipitation at 37.2
inches, well below the average
of 50.8 inches. The graph shows
that the majority of the rainfall
occurred in December and
February. However, water year
2015 was wetter than the driest
water year in 1924 when the
8-Station Index reported 17.1
inches of precipitation.
The San Joaquin Precipitation
5-Station Index, which is
representative of the Southern
Sierra, received much less
precipitation than the
Northern Sierra. Water year
2015 had a total water year
precipitation of 19.0 inches;
well below the average of 40.8
inches and just above the
all-time low of 14.8 inches
occurring in 1924. These low
precipitation values added
to the continuing drought in
California.
DWR Aggregate Precipitation Station Indices
11Fall 2016 | California Hydroclimate Report
0
50
100
150
200
250
1955 1965 1975 1985 1995 2005 2015
Percent of average
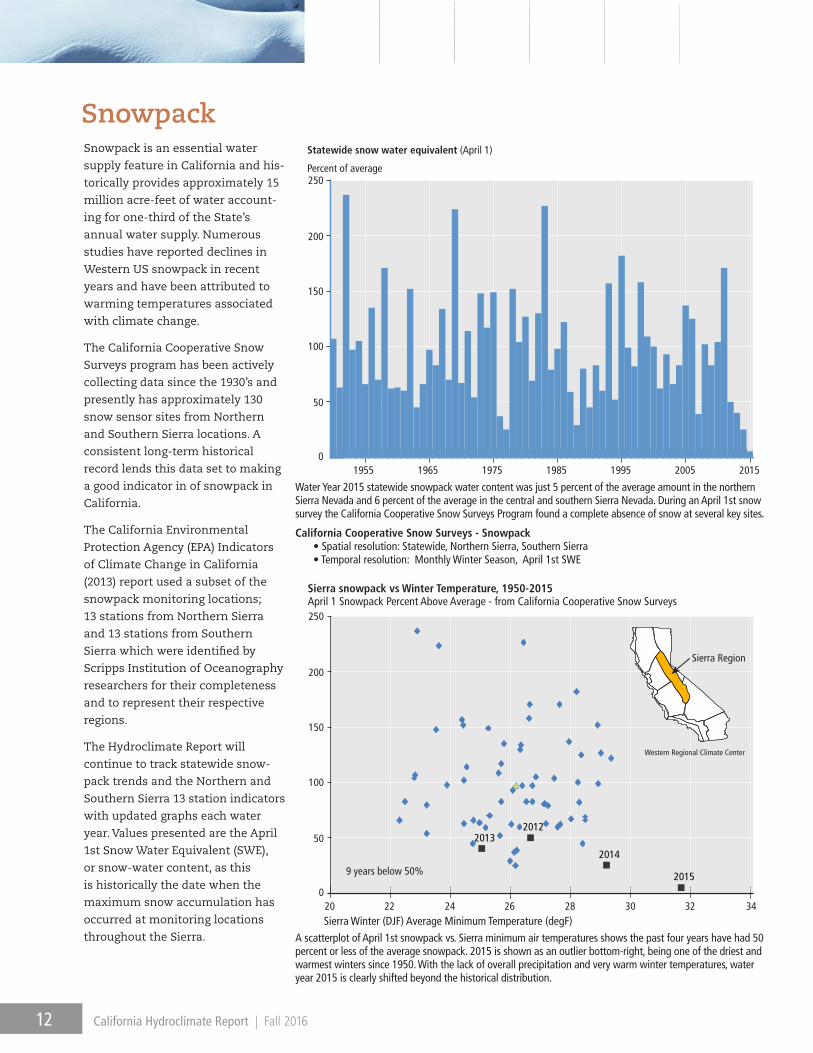
Statewide snow water equivalent (April 1) Snowpack is an essential water
supply feature in California and his-
torically provides approximately 15
million acre-feet of water account-
ing for one-third of the State’s
annual water supply. Numerous
studies have reported declines in
Western US snowpack in recent
years and have been attributed to
warming temperatures associated
with climate change.
The California Cooperative Snow
Surveys program has been actively
collecting data since the 1930’s and
presently has approximately 130
snow sensor sites from Northern
and Southern Sierra locations. A
consistent long-term historical
record lends this data set to making
a good indicator in of snowpack in
California.
The California Environmental
Protection Agency (EPA) Indicators
of Climate Change in California
(2013) report used a subset of the
snowpack monitoring locations;
13 stations from Northern Sierra
and 13 stations from Southern
Sierra which were identified by
Scripps Institution of Oceanography
researchers for their completeness
and to represent their respective
regions.
The Hydroclimate Report will
continue to track statewide snow-
pack trends and the Northern and
Southern Sierra 13 station indicators
with updated graphs each water
year. Values presented are the April
1st Snow Water Equivalent (SWE),
or snow-water content, as this
is historically the date when the
maximum snow accumulation has
occurred at monitoring locations
throughout the Sierra.
0
50
100
150
200
250
20 22 24 26 28 30 32 34
April 1 Snowpack Percent Above Average - from California Cooperative Snow Surveys
Sierra Winter (DJF) Average Minimum Temperature (degF)
9 years below 50%
Sierra snowpack vs Winter Temperature, 1950-2015
2012 2013
2014
2015
Water Year 2015 statewide snowpack water content was just 5 percent of the average amount in the northern Sierra Nevada and 6 percent of the average in the central and southern Sierra Nevada. During an April 1st snow survey the California Cooperative Snow Surveys Program found a complete absence of snow at several key sites.
California Cooperative Snow Surveys - Snowpack• Spatial resolution: Statewide, Northern Sierra, Southern Sierra• Temporal resolution: Monthly Winter Season, April 1st SWE
A scatterplot of April 1st snowpack vs. Sierra minimum air temperatures shows the past four years have had 50 percent or less of the average snowpack. 2015 is shown as an outlier bottom-right, being one of the driest and warmest winters since 1950. With the lack of overall precipitation and very warm winter temperatures, water year 2015 is clearly shifted beyond the historical distribution.
Sierra Region
Western Regional Climate Center
12 California Hydroclimate Report | Fall 2016
Snowpack
0
10
20
30
40
50
60
70
1950 1955 1960 1965 1970 1975 1980 1985 1990 1995 2000 2005 2010 2015
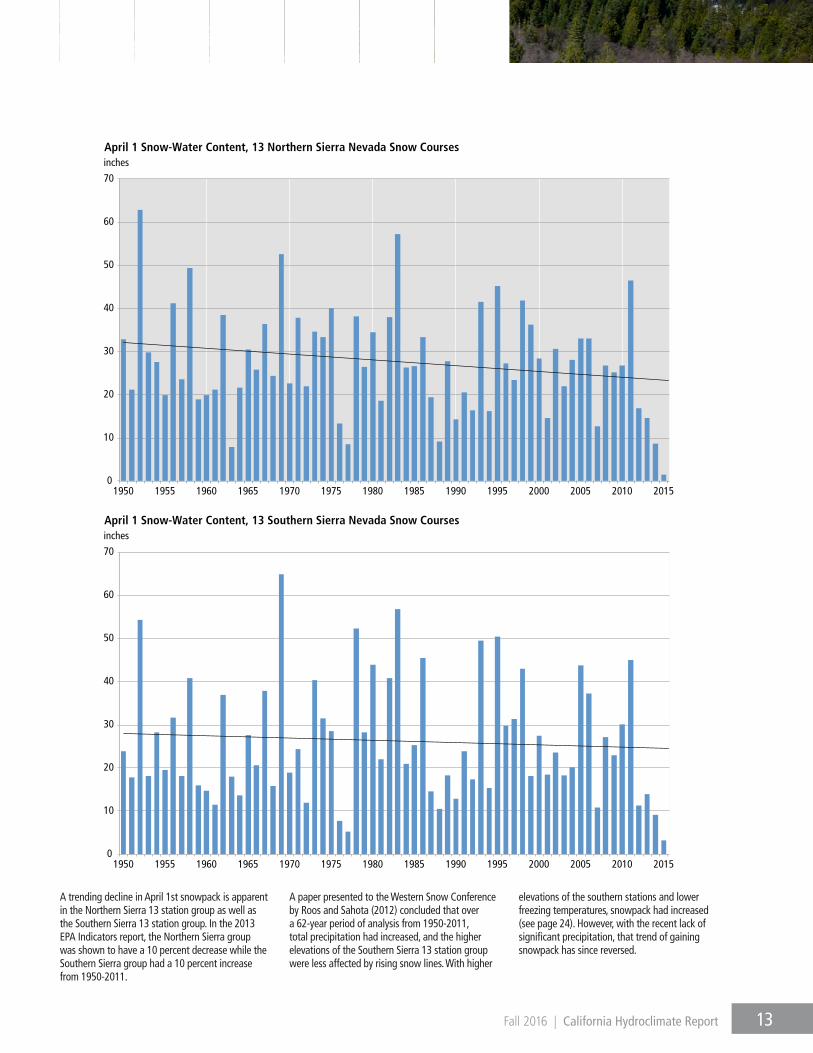
inchesApril 1 Snow-Water Content, 13 Northern Sierra Nevada Snow Courses
A trending decline in April 1st snowpack is apparent in the Northern Sierra 13 station group as well as the Southern Sierra 13 station group. In the 2013 EPA Indicators report, the Northern Sierra group was shown to have a 10 percent decrease while the Southern Sierra group had a 10 percent increase from 1950-2011.
0
10
20
30
40
50
60
70
1950 1955 1960 1965 1970 1975 1980 1985 1990 1995 2000 2005 2010 2015
inchesApril 1 Snow-Water Content, 13 Southern Sierra Nevada Snow Courses
A paper presented to the Western Snow Conference by Roos and Sahota (2012) concluded that over a 62-year period of analysis from 1950-2011, total precipitation had increased, and the higher elevations of the Southern Sierra 13 station group were less affected by rising snow lines. With higher
elevations of the southern stations and lower freezing temperatures, snowpack had increased (see page 24). However, with the recent lack of significant precipitation, that trend of gaining snowpack has since reversed.
13Fall 2016 | California Hydroclimate Report
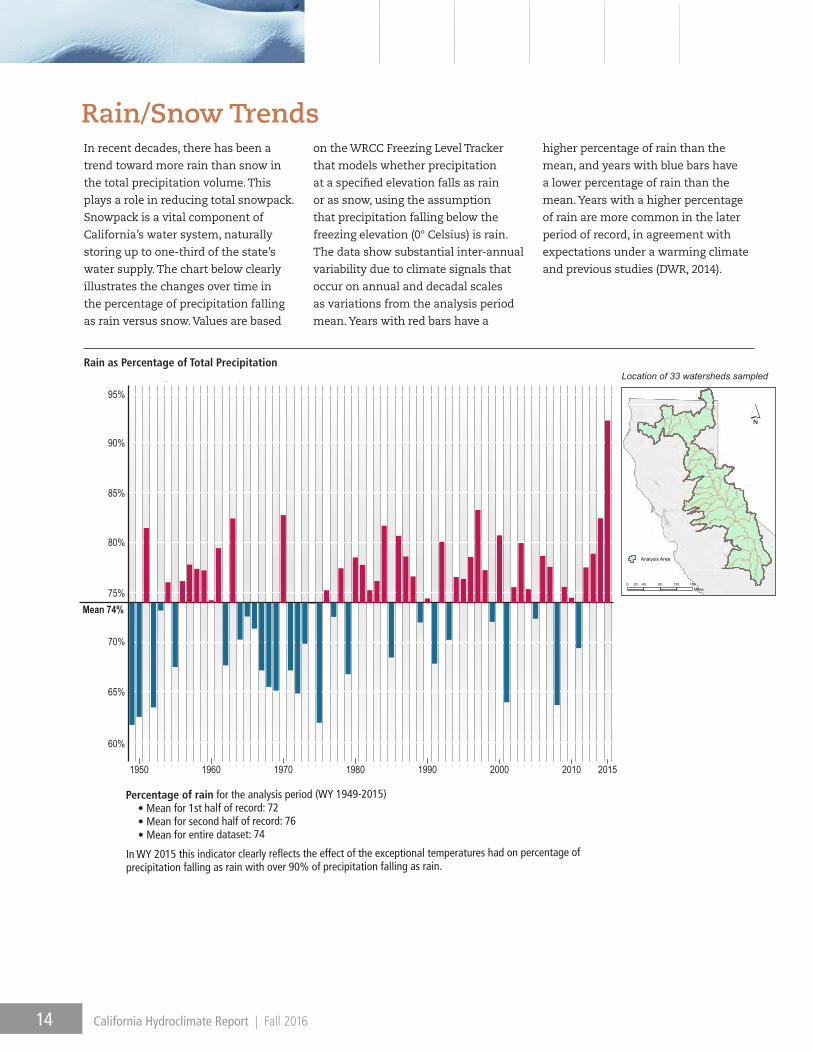
In recent decades, there has been a
trend toward more rain than snow in
the total precipitation volume. This
plays a role in reducing total snowpack.
Snowpack is a vital component of
California’s water system, naturally
storing up to one-third of the state’s
water supply. The chart below clearly
illustrates the changes over time in
the percentage of precipitation falling
as rain versus snow. Values are based
65%
70%
75%Mean 74%
60%
80%
85%
90%
95%
Rain as Percentage of Total Precipitation
2010200019901980197019601950 2015
Location of 33 watersheds sampled
´
0 40 80 120 16020Miles
Analysis Area
Rain as Percentage of Total Precipitation
on the WRCC Freezing Level Tracker
that models whether precipitation
at a specified elevation falls as rain
or as snow, using the assumption
that precipitation falling below the
freezing elevation (0° Celsius) is rain.
The data show substantial inter-annual
variability due to climate signals that
occur on annual and decadal scales
as variations from the analysis period
mean. Years with red bars have a
Percentage of rain for the analysis period (WY 1949-2015)• Mean for 1st half of record: 72• Mean for second half of record: 76• Mean for entire dataset: 74
In WY 2015 this indicator clearly reflects the effect of the exceptional temperatures had on percentage of precipitation falling as rain with over 90% of precipitation falling as rain.
higher percentage of rain than the
mean, and years with blue bars have
a lower percentage of rain than the
mean. Years with a higher percentage
of rain are more common in the later
period of record, in agreement with
expectations under a warming climate
and previous studies (DWR, 2014).
14 California Hydroclimate Report | Fall 2016
Rain/Snow Trends
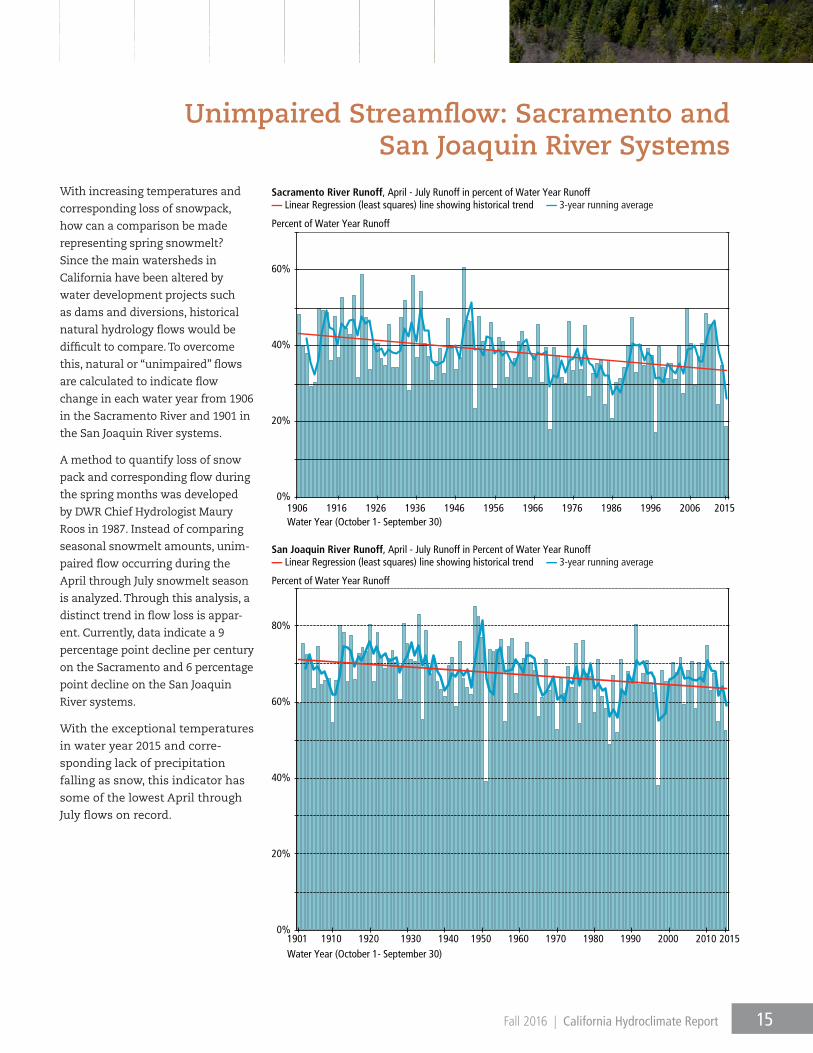
With increasing temperatures and
corresponding loss of snowpack,
how can a comparison be made
representing spring snowmelt?
Since the main watersheds in
California have been altered by
water development projects such
as dams and diversions, historical
natural hydrology flows would be
difficult to compare. To overcome
this, natural or “unimpaired” flows
are calculated to indicate flow
change in each water year from 1906
in the Sacramento River and 1901 in
the San Joaquin River systems.
A method to quantify loss of snow
pack and corresponding flow during
the spring months was developed
by DWR Chief Hydrologist Maury
Roos in 1987. Instead of comparing
seasonal snowmelt amounts, unim-
paired flow occurring during the
April through July snowmelt season
is analyzed. Through this analysis, a
distinct trend in flow loss is appar-
ent. Currently, data indicate a 9
percentage point decline per century
on the Sacramento and 6 percentage
point decline on the San Joaquin
River systems.
With the exceptional temperatures
in water year 2015 and corre-
sponding lack of precipitation
falling as snow, this indicator has
some of the lowest April through
July flows on record.
0%
20%
40%
60%
1906 1916 1926 1936 1946 1956 1966 1976 1986 1996 2006 2015
Percent of Water Year Runoff
Water Year (October 1- September 30)
Sacramento River Runoff, April - July Runoff in percent of Water Year Runoff — Linear Regression (least squares) line showing historical trend — 3-year running average
— Linear Regression (least squares) line showing historical trend — 3-year running average
0%
20%
40%
60%
80%
1901 1910 1920 1930 1940 1950 1960 1970 1980 1990 2000 2010 2015 Water Year (October 1- September 30)
San Joaquin River Runoff, April - July Runoff in Percent of Water Year Runoff
Percent of Water Year Runoff
15Fall 2016 | California Hydroclimate Report
Unimpaired Streamflow: Sacramento and San Joaquin River Systems
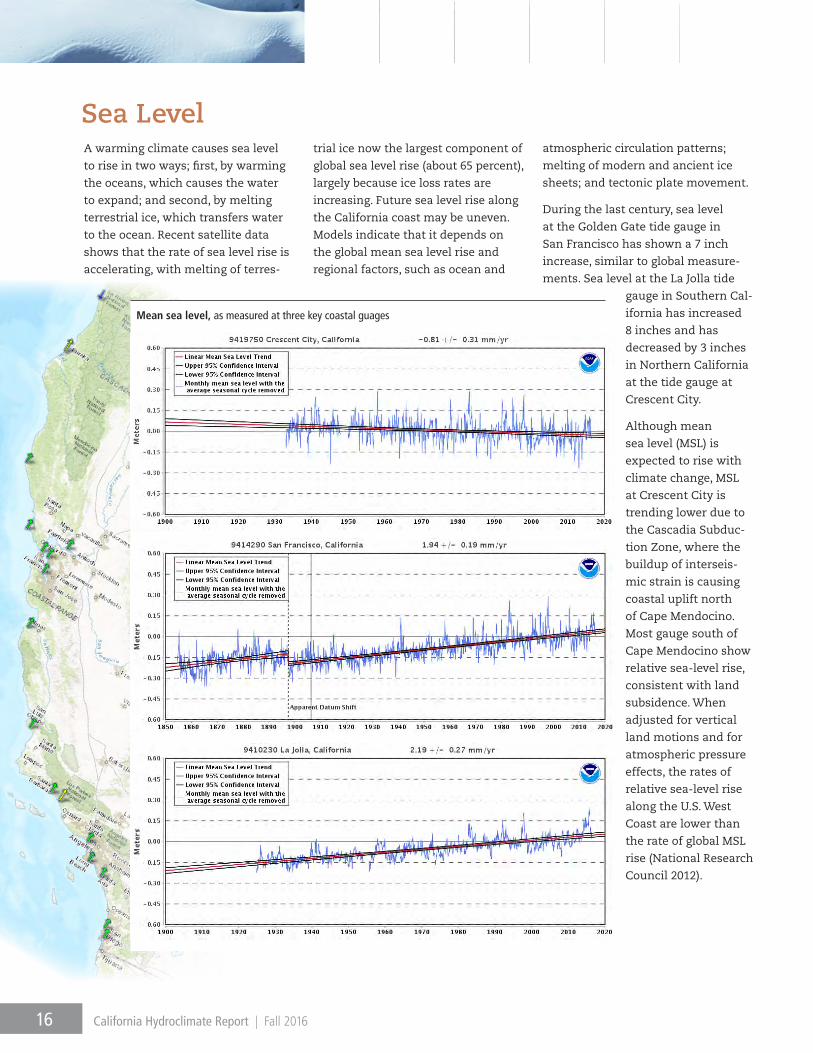
A warming climate causes sea level
to rise in two ways; first, by warming
the oceans, which causes the water
to expand; and second, by melting
terrestrial ice, which transfers water
to the ocean. Recent satellite data
shows that the rate of sea level rise is
accelerating, with melting of terres-
atmospheric circulation patterns;
melting of modern and ancient ice
sheets; and tectonic plate movement.
During the last century, sea level
at the Golden Gate tide gauge in
San Francisco has shown a 7 inch
increase, similar to global measure-
ments. Sea level at the La Jolla tide
gauge in Southern Cal-
ifornia has increased
8 inches and has
decreased by 3 inches
in Northern California
at the tide gauge at
Crescent City.
Although mean
sea level (MSL) is
expected to rise with
climate change, MSL
at Crescent City is
trending lower due to
the Cascadia Subduc-
tion Zone, where the
buildup of interseis-
mic strain is causing
coastal uplift north
of Cape Mendocino.
Most gauge south of
Cape Mendocino show
relative sea-level rise,
consistent with land
subsidence. When
adjusted for vertical
land motions and for
atmospheric pressure
effects, the rates of
relative sea-level rise
along the U.S. West
Coast are lower than
the rate of global MSL
rise (National Research
Council 2012).
trial ice now the largest component of
global sea level rise (about 65 percent),
largely because ice loss rates are
increasing. Future sea level rise along
the California coast may be uneven.
Models indicate that it depends on
the global mean sea level rise and
regional factors, such as ocean and
Mean sea level, as measured at three key coastal guages
16 California Hydroclimate Report | Fall 2016
Sea Level
Water year 2015 marked the fourth
year of statewide drought for Cali-
fornia. Water year 2014 ended with
record warm temperatures, and
included the end of a record dry 404
day period that started at the end of
2012. The peak snowpack in 2014 tied
the historic record low of 1977.
Expectations of a developing El Niño
event in the eastern tropical Pacific
fueled notions that water year 2015
would be wetter. However, during
October and November, the first two
months of the water year, warm tem-
peratures persisted and precipitation
continued to fall short of expecta-
tions. The developing El Niño event
stalled as California headed into the
heart of its wet season.
The months of December, Janu-
ary and February provide half the
expected annual precipitation. This
is also the main development period
of California’s snowpack. December
opened with a low pressure system
drifting down the coast. As the system
approached Southern California,
it encountered a surge of tropical
moisture leading to a warm rain event
for the state that didn’t match the
expected characteristics of an atmo-
spheric river event. The heavy rain led
to some minor landslides in Southern
California. A second stronger storm
arrived the following week hitting
Northern California. Heavy rainfall
was accompanied by wind speeds
across the crest of the Sierra Nevada
Mountains exceeding 100 mph. Res-
ervoir storage increased by more than
one million acre-feet in the north-
ern part of the state. Uncontrolled
tributary flow on the Sacramento
River yielded high water and flow
into the flood control bypass system.
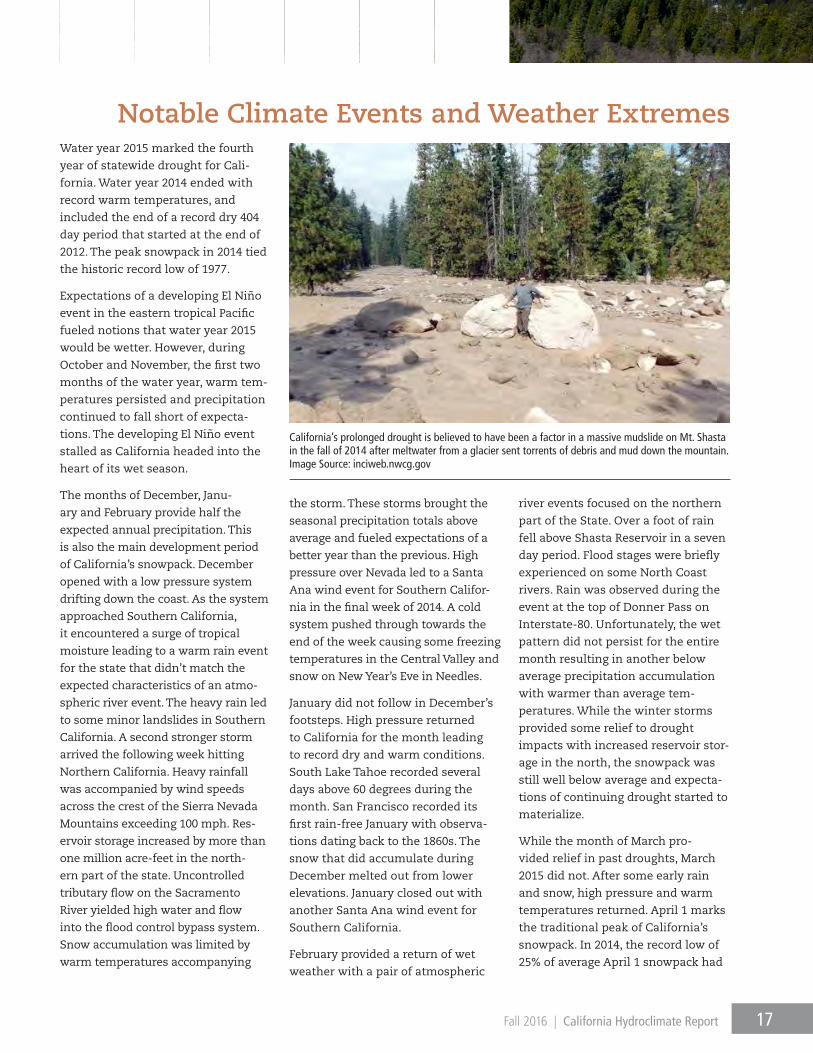
Snow accumulation was limited by
warm temperatures accompanying
California’s prolonged drought is believed to have been a factor in a massive mudslide on Mt. Shasta in the fall of 2014 after meltwater from a glacier sent torrents of debris and mud down the mountain. Image Source: inciweb.nwcg.gov
the storm. These storms brought the
seasonal precipitation totals above
average and fueled expectations of a
better year than the previous. High
pressure over Nevada led to a Santa
Ana wind event for Southern Califor-
nia in the final week of 2014. A cold
system pushed through towards the
end of the week causing some freezing
temperatures in the Central Valley and
snow on New Year’s Eve in Needles.
January did not follow in December’s
footsteps. High pressure returned
to California for the month leading
to record dry and warm conditions.
South Lake Tahoe recorded several
days above 60 degrees during the
month. San Francisco recorded its
first rain-free January with observa-
tions dating back to the 1860s. The
snow that did accumulate during
December melted out from lower
elevations. January closed out with
another Santa Ana wind event for
Southern California.
February provided a return of wet
weather with a pair of atmospheric
river events focused on the northern
part of the State. Over a foot of rain
fell above Shasta Reservoir in a seven
day period. Flood stages were briefly
experienced on some North Coast
rivers. Rain was observed during the
event at the top of Donner Pass on
Interstate-80. Unfortunately, the wet
pattern did not persist for the entire
month resulting in another below
average precipitation accumulation
with warmer than average tem-
peratures. While the winter storms
provided some relief to drought
impacts with increased reservoir stor-
age in the north, the snowpack was
still well below average and expecta-
tions of continuing drought started to
materialize.
While the month of March pro-
vided relief in past droughts, March
2015 did not. After some early rain
and snow, high pressure and warm
temperatures returned. April 1 marks
the traditional peak of California’s
snowpack. In 2014, the record low of
25% of average April 1 snowpack had
17Fall 2016 | California Hydroclimate Report
Notable Climate Events and Weather Extremes
been tied. That mark was shattered
on April 1, 2015 as the snowpack only
amounted to 5 percent of average.
Hot weather continued in August as
high pressure over the Great Basin
prevented cool Pacific air from pene-
trating inland. Offshore flow limited
coastal fog events. Mountain nighttime
temperatures dropped to near freezing
at the higher elevations near the end
of the month.
September closed out water year 2015
with more hot, dry weather across the
State. The remains of Hurricane Linda
moved into the South Coast region
and Southern Sierra in the middle of
the month causing thunderstorms
and locally heavy showers. For the city
of Los Angeles, September 15, 2015
was the wettest day of 2015, second
wettest day in any September, and the
month ended as the third wettest as a
result of the decaying tropical system.
The month and water year closed out
with fog along the coast and dry warm
conditions inland.
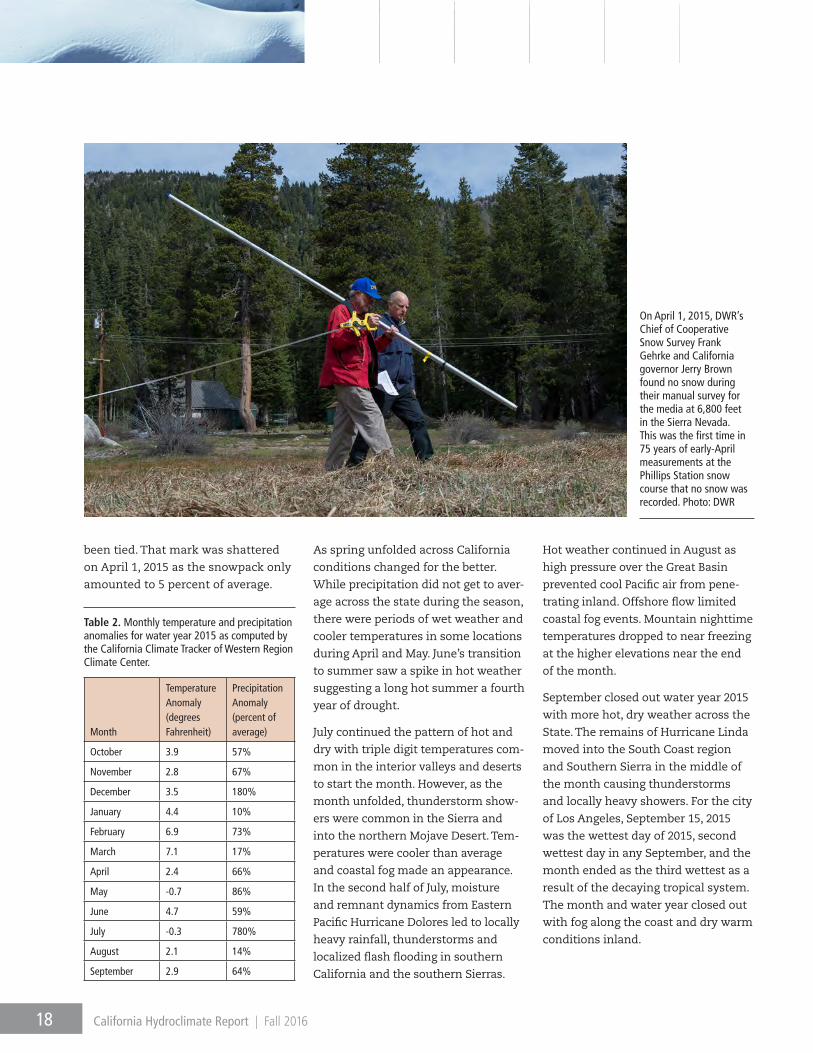
On April 1, 2015, DWR’s Chief of Cooperative Snow Survey Frank Gehrke and California governor Jerry Brown found no snow during their manual survey for the media at 6,800 feet in the Sierra Nevada. This was the first time in 75 years of early-April measurements at the Phillips Station snow course that no snow was recorded. Photo: DWR
As spring unfolded across California
conditions changed for the better.
While precipitation did not get to aver-
age across the state during the season,
there were periods of wet weather and
cooler temperatures in some locations
during April and May. June’s transition
to summer saw a spike in hot weather
suggesting a long hot summer a fourth
year of drought.
July continued the pattern of hot and
dry with triple digit temperatures com-
mon in the interior valleys and deserts
to start the month. However, as the
month unfolded, thunderstorm show-
ers were common in the Sierra and
into the northern Mojave Desert. Tem-
peratures were cooler than average
and coastal fog made an appearance.
In the second half of July, moisture
and remnant dynamics from Eastern
Pacific Hurricane Dolores led to locally
heavy rainfall, thunderstorms and
localized flash flooding in southern
California and the southern Sierras.
Table 2. Monthly temperature and precipitation anomalies for water year 2015 as computed by the California Climate Tracker of Western Region Climate Center.
Month
Temperature Anomaly (degrees Fahrenheit)
Precipitation Anomaly (percent of average)
October 3.9 57%
November 2.8 67%
December 3.5 180%
January 4.4 10%
February 6.9 73%
March 7.1 17%
April 2.4 66%
May -0.7 86%
June 4.7 59%
July -0.3 780%
August 2.1 14%
September 2.9 64%
18 California Hydroclimate Report | Fall 2016
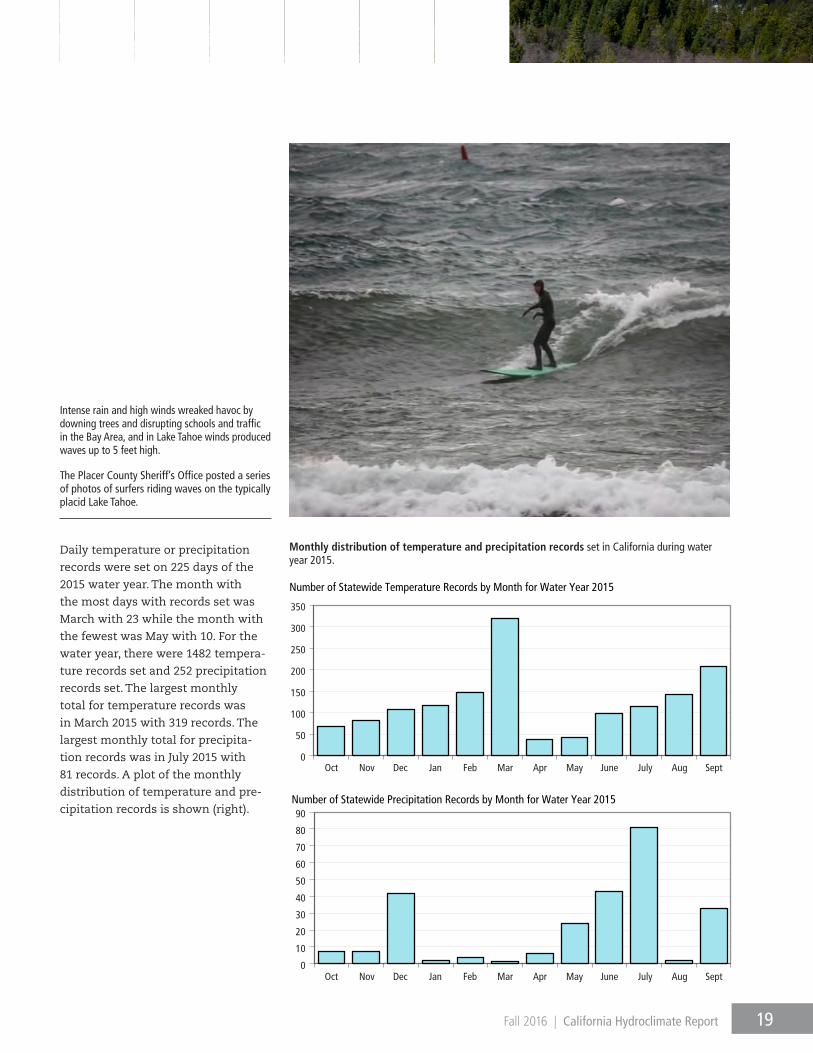
Intense rain and high winds wreaked havoc by downing trees and disrupting schools and traffic in the Bay Area, and in Lake Tahoe winds produced waves up to 5 feet high.
The Placer County Sheriff’s Office posted a series of photos of surfers riding waves on the typically placid Lake Tahoe.
0
50
100
150
200
250
300
350
Number of Statewide Temperature Records by Month for Water Year 2015
0
10
20
30
40
50
60
70
80
90Number of Statewide Precipitation Records by Month for Water Year 2015
Oct Nov Dec Jan Feb Mar Apr May June July Aug Sept
Oct Nov Dec Jan Feb Mar Apr May June July Aug Sept
Monthly distribution of temperature and precipitation records set in California during water year 2015.
Daily temperature or precipitation
records were set on 225 days of the
2015 water year. The month with
the most days with records set was
March with 23 while the month with
the fewest was May with 10. For the
water year, there were 1482 tempera-
ture records set and 252 precipitation
records set. The largest monthly
total for temperature records was
in March 2015 with 319 records. The
largest monthly total for precipita-
tion records was in July 2015 with
81 records. A plot of the monthly
distribution of temperature and pre-
cipitation records is shown (right).
19Fall 2016 | California Hydroclimate Report

• Anomaly: The difference of a value
over a specified period from the long-
term average value (e.g. 1949-2005)
over the same period.
• Average Maximum Temperature:
The average of all daily maximum
temperatures over a given time
period.
• Average Mean Temperature: The
mean value of the average maximum
temperature and the average
minimum temperature over a given
time period.
• Average Minimum Temperature:
The average of all daily minimum
temperatures over a given time
period.
• Calendar Year (to date): The interval
between January and December (or to
present month), inclusive.
• Climate: The average weather or
the statistical description in terms of
the mean and variability of relevant
quantities over a period of time,
ranging from months to thousands or
millions of years.
• Climate change: A change in the
state of the climate that can be
identified by changes in the mean
and/or the variability of its properties
(often by using statistical tests), and
that persists for an extended period,
typically decades or longer.
• Climate model: A numerical
representation of the climate system
based on the physical, chemical,
and biological properties of its
components, their interactions and
feedback processes, and accounting for
all or some of its known properties.
• Climate variability: Variations in
the mean state and other statistics
(such as standard deviations, the
occurrence of extremes, etc.) of the
climate on all spatial and temporal
scales beyond that of individual
weather events.
• COOP station: Cooperative Observer
Network (COOP), managed by the
National Weather Service, consists of
up to 12,000 weather stations across
the United States that report daily
measurements of precipitation and/
or temperature.
• Inhomogeneities: Variations in
data that are not attributed to
climate variations. Non-climatic
influences on the dataset can include
abrupt changes due to changes in
instrumentation or station location, as
well as gradual changes due to growth
of nearby vegetation or urban centers.
• Linear Trend: A simple method
that fits a line (linear trend) to
observations of a given variable over
some time period. Beside each linear
trend given on this set of pages is a
95% confidence interval that provides
a measure as to how likely a trend is
significant. For example, a trend of
+2°F/100 years with an uncertainty
interval of + or - 1°F/100 years says
that with 95% confidence there is a
positive linear trend, with a range
between +1° and +3°F/100 years. On
the other hand, a linear trend of
+ 2°F/100 years with an uncertainty
interval of +/- 5°F/100 years does
not provide conclusive evidence of a
linear trend, as the range is between
-3° to + 7°F/100 years. Confidence
Intervals are calculated according to
Santer et al 2000.
• PRISM: Parameter-elevation
Relationships on Independent Slopes
Model. A model that incorporates
point measurements and topographic
database to create a high resolution
gridded climate database. More
information on PRISM is available
from Oregon Climate Service.
• Percentile Ranking: The ranking of
a variable (e.g., temperature) over a
given time period versus comparable
time periods overall years of record,
normalized to a 0 (coldest) to 100
(warmest) scale.
• Precipitation: The accumulation
of water (in liquid form) that is
deposited to the surface over a given
time period.
• Streamflow: The amount of water
flowing in a river.
• Water Year (to date): The interval
between October and September (or to
present month). For example the water
year 2007 refers to the interval between
October 2006 and September 2007.
20 California Hydroclimate Report | Fall 2016
Glossary
Temperature and Precipitation
WRCC California Climate Tracker
http://www.wrcc.dri.edu/monitor/cal-mon/background_brief.html
The state of California is dominated by its diverse topography, ranging from
the coastal environs, to the great Central Valley, the Sierras and the Mohave-So-
noran Desert. California’s varying landscape gives way for a number of physical
mechanisms that not only influence the average climate, but also climate
variability across the state. The analysis of climate variability and trends is a
crucial and necessary component in understanding the role of climate change.
Although there is clear indication of changes in the global surface tempera-
ture, the regional manifestation of climate change is not well quantified at
the present time. Driven by the interests of the governmental, economic, and
scientific communities it is pertinent to develop an objective method to define
and monitor climate not only for the state as a whole, but also for its distinct
climate regions.
The National Climatic Data Center (NCDC) has developed climate divisions
that span the contiguous United States, whereby each state has been subdi-
vided into 10 or fewer climate divisions. Across much of the western United
States climate divisions were guided mostly by watershed and river basins, as
opposed to climatological patterns. Consequently, the divisions suffer from a
number of problems in the western United States, where complex topography
plays a strong role in dictating regional climate patterns. For example, the
current climate divisions in California make no distinction between the Sierra
Nevada Mountains and the Central Valley. Not only do the Central Valley and
Sierra differ greatly in terms of average temperature and precipitation, but also
in terms of variations in temperature and precipitation.
Data:
Monthly station data, taken from cooperative observers (COOP), along with grid-
ded data from the PRISM database, are used to assess climate across the state.
The primary variables that are considered in this process are monthly average
mean temperatures and monthly precipitation totals. COOP stations across the
state that reported over 75% of observations over the time period 1949-2005, and
continued to report in 2006. A total of 195 stations across the state are included
in this analysis. We consider COOP station data along with the PRISM database
dating back to January of 1895. Temperature data from the COOP stations have
been adjusted for inhomogeneities, a procedure used to “correct” for non-climate
shifts in temperature. No effort is made to adjust for urbanization or land-use
changes. Inhomogeneity detection includes the entire period of record; however
we caution that the dataset contains larger uncertainties prior to 1918 due to the
limited number of stations reporting statewide.
Methodology:
Variations in climate are at the forefront of both the public mind and of climate
researchers. The initial steps in creating the California Climate Tracker were
to identify cohesive regions of climate variability within the state. Using an
infilled dataset an analysis is performed on the COOP station data using both
21Fall 2016 | California Hydroclimate Report
Appendix
monthly precipitation and average monthly mean temperature. This analysis
focuses on how stations vary with one another. 11 distinct regions across the
state wherein stations located within a region vary with one another in a simi-
lar fashion. An analogous analysis is performed with the PRISM data, resulting
in striking similar results. These 11 regions hereafter define the climate regions.
The collection of data from both station and PRISM data from these regions is
used to create a single value for each variable for each month. This is a two-
step process, dependent on the timing of data availability of both COOP station
based data and the gridded PRISM based data. An effort is made to create a
seamless translation between these two datasets. At the beginning of each
month only COOP data is available, and often from around only 60% of the 195
stations statewide. Data are first screened for outliers (defined as a data anom-
aly that exceeds more than two standard deviations from any other anomaly
within the state). Temperature datasets are also screened for inhomogeneities,
which lead to an abrupt, non-climatic, change in the time series of a given
station. An effort is then made to estimate missing stations from anomaly
regression with highly correlated reference stations. At this point, the regional
value is computed by the average of the collection of COOP stations within a
region. Further adjustment is then made to adjust for inherent biases between
the COOP based value and the PRISM-based areal average (e.g., COOP stations
in mountainous terrain are generally located at elevations lower than the mean
topography of the region, and are regularly warmer than the areal average of
the domain of interest). Note that for the first couple weeks of each month that
the most updated value is generated by station based data.
The PRISM group at Oregon State calculates monthly datasets within the first
few weeks of each month. As the monthly data becomes available it is then
incorporated into the California Climate Tracker by taking the areal average of
the gridded data with respect to each region. Concurrent with the updating of
the PRISM based values, we rerun the COOP based dataset as values continue
to be ingested throughout the month. The monthly value reported at this sec-
ond and final stage is a hybrid value that is weighted equally for PRISM-based
data and station-based data.
The statewide average is computed by weighting the regional value by the area
covered by each region. An extensive time series dating back to the late 19th
century is formed for each region, and for the state as a whole. These time
series are used to both categorize and track climate across the spatially diverse
state of California in order to place the present climate in context to climate
variations back to the late 19th century.
22 California Hydroclimate Report | Fall 2016
NOAA U.S. Climate Divisional Dataset
https://www.ncdc.noaa.gov/monitoring-references/maps/us-climate-divisions.php
For many years the Climate Divisional Dataset was the only long-term tempo-
rally and spatially complete dataset from which to generate historical climate
analyses (1895-2013) for the contiguous United States (CONUS). It was originally
developed for climate-division, statewide, regional, national, and popula-
tion-weighted monitoring of drought, temperature, precipitation, and heating/
cooling degree day values. Since the dataset was at the divisional spatial scale,
it naturally lent itself to agricultural and hydrological applications.
There are 344 climate divisions in the CONUS. For each climate division,
monthly station temperature and precipitation values are computed from
the daily observations. The divisional values are weighted by area to compute
statewide values and the statewide values are weighted by area to compute
regional values. (Karl and Koss, 1984).
Precipitation- DWR 8 Station and 5 Station Indices
Department of Water Resources hydrologists use two mountain precipitation
indexes to track daily accumulation of rain and snow during the winter rainy
season for the major Central Valley basins. The first is the Northern Sierra
8 station average, a group of 8 precipitation stations extending from Mount
Shasta in the north to near Lake Tahoe in the south, which corresponds quite
well to the water year runoff of the Sacramento River system (the Sacramento
four river index). A southern group of 5 Sierra stations comprise the 5 station
index which correspond fairly well to water year runoff for the San Joaquin
River (the San Joaquin four river index).
The 8 station precipitation index includes: Mt Shasta City, Shasta Dam, Mineral,
Quincy, Brush Creek, Sierraville, Blue Canyon, Pacific House.
http://cdec.water.ca.gov/cgi-progs/stationInfo?station_id=8SI
The 5 station precipitation index includes: Calaveras Big Trees, Hetch Hetchy,
Yosemite, North Fork RS, Huntington Lake
http://cdec.water.ca.gov/cgi-progs/stationInfo?station_id=5SI
23Fall 2016 | California Hydroclimate Report
Snowpack
Bulletin 120 and Water Supply Index forecasts
Water Supply Index (WSI) and Bulletin 120 (B120) forecasts are posted at:
WSI: http://cdec.water.ca.gov/cgi-progs/iodir/wsi
B120: http://cdec.water.ca.gov/cgi-progs/iodir?s=b120
Contrasting Snowpack Trends In The Sierra Nevada Of California (Roos and Sahota, 2012)
http://www.westernsnowconference.org/sites/westernsnowconference.org/
PDFs/2012Roos.pdf
Widespread reports of decreases in western mountain snowpacks have been
reported in recent years by many observers and scientists (Mote, 2003 and 2005)
and attributed to global warming. In California, Sierra Nevada snowpack has
been decreasing over the last 60 years. In both northern and southern regions the
portion of water year runoff during the April through July snowmelt season has
decreased, although less so in the southern Sierra river basins, which are higher in
elevation.
Originally a group of 13 northern courses and 13 southern Sierra courses were
chosen by Scripps researchers for use by the California Environmental Protec-
tion Agency, Office of Environmental Health Hazard Assessment, for inclusion
in a roughly 180 page 2009 report “Indicators of Climate Change in Califor-
nia” (CA EPA, 2009). The report has a large number of indicators for measured
changes in economic factors, greenhouse gases, climate and temperature,
physical systems, and biological systems with time. Over 30 indicators were
discussed; the list included Sierra river runoff trends, the snowpack record, and
two charts showing snow water content trends from1950 through 2008 for a
group of northern Sierra Nevada snow courses and a group of southern Sierra
Nevada snow courses.
Unimpaired Flow (Runoff)
http://cdec.water.ca.gov/cgi-progs/iodir/WSIHIST
Unimpaired runoff represents the natural water production of a river basin, unal-
tered by upstream diversions, storage, export of water to or import of water from
other basins. Sacramento River Runoff is the sum (in maf) of Sacramento River at
Bend Bridge, Feather River inflow to Lake Oroville, Yuba River at Smartville, and
American River inflow to Folsom Lake. The water year sum is also known as the
Sacramento River Index, and was previously referred to as the “4 River Index”
or “4 Basin Index”. It was previously used to determine year type classifications
under State Water Resources Control Board (SWRCB) Decision 1485.
Sacramento Valley Water Year Index = 0.4 * Current Apr-Jul Runoff Forecast (in
maf) + 0.3 * Current Oct-Mar Runoff in (maf) + 0.3 * Previous Water Year’s Index-
(if the Previous Water Year’s Index exceeds 10.0, then 10.0 is used). This index,
originally specified in the 1995 SWRCB Water Quality Control Plan, is used to
24 California Hydroclimate Report | Fall 2016
determine the Sacramento Valley water year type as implemented in SWRCB
D-1641. Year types are set by first of month forecasts beginning in February.
Final determination is based on the May 1 50% exceedence forecast.
Sacramento Valley Water Year Hydrologic Classification:
Year Type: .......... Water Year Index:
Wet ............... Equal to or greater than 9.2
Above Normal ...... Greater than 7.8, and less than 9.2
Below Normal ...... Greater than 6.5, and equal to or less than 7.8
Dry ................ Greater than 5.4, and equal to or less than 6.5
Critical ............ Equal to or less than 5.4
San Joaquin River Runoff is the sum of Stanislaus River inflow to New Melones
Lake, Tuolumne River inflow to New Don Pedro Reservoir, Merced River inflow
to Lake McClure, and San Joaquin River inflow to Millerton Lake (in maf). San
Joaquin Valley Water Year Index = 0.6 * Current Apr-Jul Runoff Forecast (in maf)
+ 0.2 * Current Oct-Mar Runoff in (maf) + 0.2 * Previous Water Year’s Index(if the
Previous Water Year’s Index exceeds 4.5, then 4.5 is used). This index, originally
specified in the 1995 SWRCB Water Quality Control Plan, is used to determine the
San Joaquin Valley water year type as implemented in SWRCB D-1641. Year types
are set by first of month forecasts beginning in February. Final determination for
San Joaquin River flow objectives is based on the May 1 75% exceedence forecast.
San Joaquin Valley Water Year Hydrologic Classification:
Year Type: ..........Water Year Index:
Wet ............... Equal to or greater than 3.8
Above Normal ...... Greater than 3.1, and less than 3.8
Below Normal ...... Greater than 2.5, and equal to or less than 3.1
Dry ................ Greater than 2.1, and equal to or less than 2.5
Critical ............ Equal to or less than 2.1
Eight River Index = Sacramento River Runoff + San Joaquin River Runoff. This
Index is used from December through May to set flow objectives as imple-
mented in SWRCB Decision 1641.
The current water year indices based on forecast runoff are posted at:
http://cdec.water.ca.gov/water_supply.html
And published in DWR Bulletin 120:
http://cdec.water.ca.gov/snow/bulletin120
These indices have been used operationally since 1995, and are defined in SWRCB
Decision 1641: http://www.waterrights.ca.gov/baydelta/d1641.htm
This report is updated each fall once the data is available.
25Fall 2016 | California Hydroclimate Report
Snowpack and Snowmelt Changes- Maury Roos Chief Hydrologist, California Department
of Water Resources (1/03/2012).
http://www.water.ca.gov/climatechange/blog/
Sea Level Trends
http://tidesandcurrents.noaa.gov/sltrends/sltrends.html
http://tidesandcurrents.noaa.gov/sltrends/sltrends_station.shtml?stnid=9419750
http://tidesandcurrents.noaa.gov/sltrends/sltrends_station.shtml?stnid=9414290
http://tidesandcurrents.noaa.gov/sltrends/sltrends_station.shtml?stnid=9410230
The Center for Operational Oceanographic Products and Services has been
measuring sea level for over 150 years, with tide stations of the National Water
Level Observation Network operating on all U.S. coasts. Changes in Mean Sea
Level (MSL), either a sea level rise or sea level fall, have been computed at 142
long-term water level stations using a minimum span of 30 years of obser-
vations at each location. These measurements have been averaged by month
to remove the effect of higher frequency phenomena in order to compute an
accurate linear sea level trend. The trend analysis has also been extended to
240 global tide stations using data from the Permanent Service for Mean Sea
Level (PSMSL). This work is funded in partnership with the NOAA OAR Climate
Observation Division.
The mean sea level (MSL) trends measured by tide gauges that are presented
on this web site are local relative MSL trends as opposed to the global sea
level trend. Tide gauge measurements are made with respect to a local fixed
reference level on land; therefore, if there is some long-term vertical land
motion occurring at that location, the relative MSL trend measured there is
a combination of the global sea level rate and the local vertical land motion.
The global sea level trend has been recorded by satellite altimeters since 1992
and the latest calculation of the trend can be obtained from NOAA’s Laboratory
for Satellite Altimetry, along with maps of the regional variation in the trend.
The University of Colorado’s Sea Level Research Group compares global sea
level rates calculated by different research organizations and provides detailed
explanations about the issues involved.
26 California Hydroclimate Report | Fall 2016
Abatzoglou, J.T., K.T. Redmond, L.M.
Edwards, 2009, Classification of
Regional Climate Variability in the
State of California, Journal of Applied
Meteorology and Climatology, 48, 1527-
1541.
Ault, T. and St. George, S. 2010.
The Magnitude of Decadal and
Multidecadal Variability in North
American Precipitation. Journal of
Climate. 23, 842-850.
California Environmental Protection
Agency. 2013. Indicators of Climate
Change in California.
CA Department of Water Resources.
2014. Estimating Historical California
Precipitation Phase Trends Using Gridded
Precipitation, Precipitation Phase, and
Elevation Data. Memorandum report.
Dettinger, M. 2011. Climate Change,
Atmospheric Rivers, and Floods in
California – A 26 Multimodel Analysis
of Storm Frequency and Magnitude
Changes. Journal of the American Water
Resources Association. 47, 515-523.
Hansen, J., R. Ruedy, M. Sato, and K.
Lo.2010. Global surface temperature
change. Reviews of Geophysics, 48
(RG4004).
IPCC. 2014. Fifth assessment synthesis
report - Climate Change 2014 synthesis
report (1 November 2014) by Myles R.
Allen, Vicente R. Barros, John Broome, et
al. edited by Paulina Aldunce, Thomas
Downing, Sylvie Joussaume, et al.
Karl, T. and Koss, W.,1984. Historical
Climatology Series 4-3: Regional
and National Monthly, Seasonal and
Annual Temperature Weighted by
Area, 1895-1983.
Mote, P.W. 2003. Trends in snow water
equivalent in the Pacific Northwest
and their climatic causes. Geophysical
Research Letters 30 (12): 1601.
Mote, Philip W. 2006. Climate Driven
Variability and Trends in Mountain
Snowpack in Western North America.
Journal of Climate, 19 6209-1620.
National Research Council. 2012. Sea-
Level Rise for the Coasts of California,
Oregon, and Washington.
Pierce, D. W., T. Das, D. R. Cayan,
E. P. Maurer, N. L. Miller, Y. Bao, M.
Kanamitsu, K. Yoshimura, M. A.
Snyder, L. C. Sloan, G. Franco, M. Tyree,
2013. Probabilistic estimates of future
changes in California temperature
and precipitation using statistical
and dynamical downscaling. Climate
Dynamics, 40 839-856.
Roos, M. 1987. Possible changes in
California snowmelt patterns, Proc.,
4th Pacific Climate Workshop, Pacific
Grove, California, 22-31.
Roos, M. 2008. Poster paper, Changing
Sierra Nevada Runoff Patterns,
CALFED Science Conference, Oct 2008,
Sacramento, California.
Roos , M. and Sahota, S.. 2012.
Contrasting Snowpack Trends In The
Sierra Nevada Of California, 80th
Annual Western Snow Conference,
May 2012, Anchorage, Alaska.
Santer, B., et al. 2000. Statistical
significance of trends and trend
differences in layer-average
atmospheric temperature time series.
Journal of Geophysical Research. 105
7337-7356.
WRCC. 2013. “California Climate
Tracker.” Western Regional Climate
Center. Retrieved July 20, 2016, http://
www.wrcc.dri.edu/monitor/cal-mon/
index.html.
27Fall 2016 | California Hydroclimate Report
References
CALIFORNIA DEPARTMENT OF WATER RESOURCES
California State Climatologist
Dr. Michael Anderson
http://www.climate.water.ca.gov
Mailing address:
P.O. Box 219000, Sacramento, CA 95821-9000
For all California Hydroclimate Reports, please go to:
http://www.water.ca.gov/floodmgmt/hafoo/csc/