hydrocarbon exploration in the south yellow sea based on
TRANSCRIPT

Journal of Earth Science, Vol. 27, No. 4, p. 686–698, August 2016 ISSN 1674-487X Printed in China DOI: 10.1007/s12583-015-0607-y
Li, W. Y., Liu, Y. X., Li, B., et al., 2016. Hydrocarbon Exploration in the South Yellow Sea Based on Airborne Gravity, China. Jour-nal of Earth Science, 27(4): 686–698. doi:10.1007/s12583-015-0607-y. http://en.earth-science.net
Hydrocarbon Exploration in the South Yellow Sea Based on Airborne Gravity, China
Wenyong Li*, Yanxu Liu, Bing Li, Feng Luo
China Aero Geophysical Survey & Remote Sensing Center for Land and Resources, Beijing 100083, China
ABSTRACT: Differences between the Cenozoic and pre-Cenozoic strata and structures in the middle- south South Yellow Sea are analyzed using high-resolution airborne gravity data combined with data from offshore wells, seismic exploration and the regional geological background, using forward and in-verse methods. We discuss why hydrocarbon exploration has so far failed in the South Yellow Sea, and put forward alternative future exploration plans. The results show that there are thick Cenozoic strata over Jurassic–Cretaceous continental strata in the southern basin of the South Yellow Sea, contrasted with thick Mid-Paleozoic marine strata preserved in the middle uplift area. In the mid-southern South Yellow Sea, airborne Bouguer gravity anomalies are fragmentized with scattered local anomalies. Many tensile normal faults and minor fault blocks occur in the Cenozoic strata. In contrast, reverse faults and nappe structures are found in pre-Cenozoic strata. The essential reasons for the lack of a breakthrough in hydrocarbon exploration are the complexity of geological structures, hydrocarbon accumulation en-vironments, seismic-geologic conditions, and the difficulty of interpreting and understanding these fea-tures, rather than an imbalance of exploration framework. Hydrocarbon exploration should be tar-geted at Mid-Cenozoic continental strata, especially of Paleogene age, in the middle to southern parts of the South Yellow Sea. Special attention should be paid to the favorable structural belts SYI1, SYI2, SYI3 and SYI4 in the southern basin of the South Yellow Sea, where detailed seismic exploration or drilling should be carried out. Attention should also be given to Mid-Paleozoic marine strata in the middle uplift area of the South Yellow Sea. Key strategies that could lead to a hydrocarbon exploration breakthrough are improving exploration resolution, conducting detailed studies of fine structures, and accurately locating minor structures. KEY WORDS: airborne gravity, strata and structures, hydrocarbon exploration, Paleogene, South Yellow Sea.
0 INTRODUCTION
The South Yellow Sea lies to the east of Shandong and Jiangsu provinces of China and to the west of the Korean Penin-sula. Geophysical prospecting for petroleum in the South Yellow Sea began in the 1960s and many results and new insights have been obtained during 50 years of geological and geophysical sur-veying (Cao et al., 2009; Gu and Zhang, 2009; Hou et al., 2008; Xing et al., 2005; Liang et al., 2003; Gong, 2002; Xiao, 2002). Meso–Cenozoic continental strata are well developed in this shelf area along with a thick organic-rich Paleo–Mesozoic marine stratal sequence so that there are good potential hydrocarbon prospects, which have attracted many petroleum geologists (Wu and Lu, 2011; Hu, 2010; Wan and Hao, 2010; Ouyang et al., 2009; Ma et al., 2007; Zhao et al., 2007; Dai et al., 2005; Yang et al., 2003). However, there has not been a major breakthrough in seis-mic exploration for hydrocarbons for many years because *Corresponding author: [email protected] © China University of Geosciences and Springer-Verlag Berlin Heidelberg 2016 Manuscript received September 20, 2014. Manuscript accepted April 30, 2015.
of special coastal geographic conditions and poor quality deep seismic reflection imaging. Oil has been found in Paleogene strata but no industry-suitable reservoir and there has been no success in drilling the Paleozoic. Some scholars have imputed failure in the 1960s and 1970s to a lag in technical capability which produced only poor-quality low signal-to-noise ratio seis-mic profiles (Wu and Lu, 2011). Others have blamed the failure in the 1980s on an imbalance of exploration thinking (Fan, 2001), such as giving weight to the southern South Yellow Sea but ne-glecting the north, taking the Paleogene seriously while disre-garding the Mesozoic and Paleozoic; taking account of oil but leaving gas aside; thinking highly of oil and gas exploration in shallow but ignoring in deep. All has led to new prospecting strategies covering five aspects: first, considering new horizons, especially marine Mesozoic and Paleozoic; second, exploring continental Mesozoic and Cenozoic deposits; third, surveying new areas such as uplifts or swells on the one hand, and sags on the other; fourth, prospecting for both oil and gas; fifth, applying new technology. Despite such efforts, as yet there has still been no breakthrough in hydrocarbon exploration.
China introduced an advanced international airborne gra-vimetry system (GT-1A) for geological surveying during the Eleventh Five-Year Plan (2006–2010) and conducted a suc-

Hydrocarbon Exploration in the South Yellow Sea Based on Airborne Gravity, China
687
cessful experiment and survey (Li W Y et al., 2012b, 2010a, b, c). This paper analyses strata and structures, discusses the rea-sons for the lack of a breakthrough in hydrocarbon exploration, and suggests possible future exploration emphasis in this ma-rine area on the basis of recent airborne gravity surveying of the middle-south South Yellow Sea. 1 GEOLOGICAL SETTING
The South Yellow Sea is located in the northeast part of the Yangtze Block, and is bounded by the Tanlu fault to the west and the Sujiao-Qianliyan-Linjin orogenic belt to the north. This area belongs to the lower Yangtze subprovince of the Yangtze strati-graphic province (Chang and Zhao, 2012; Li W Y et al., 2012a; Xu et al., 2008). The South Basin of the South Yellow Sea and the adjacent Subei Basin on land both belong to the same Mid-Cenozoic continental sedimentary basin, controlled by the Tanlu fault. Both basins lie within the area of the same gravity low, and have the same strata sequences and structures (Zhao et al., 2007). Exploration wells drilled in both basins have pene-trated Sinian, marine Paleozoic and Triassic, continental Jurassic and Cretaceous, and Cenozoic strata (Zhai et al., 2002). Regional faults have a principal NE-SW trend, and secondary trends ap-proximately E-W and NW-SE. Faults control the structure of the basin as well as the distribution pattern of depressions and uplifts, sags and swells. The structural elements of the South Yellow Sea are subdivided according to the distribution and thickness of Jurassic–Cretaceous and Paleogene strata from north to south into the North Basin, the middle uplift area, the South Basin, and the Wunansha uplift area (Fig. 1). Drilling has revealed hydro-
carbon in the Paleogene the North and South basins, and a great many hydrocarbon reservoirs in the Paleogene. There are also a few hydrocarbon reservoirs in the Paleozoic of the Subei Basin on the adjacent mainland.
2 GEOPHYSICAL CHARACTERISTICS 2.1 Physical Properties
Density statistics of the rocks in the study area and its adja-cent area have been compiled according to measured physical parameters and drilling density data (Table 1). Three density lay-ers are distinguished in a vertical stratigraphic sequence, from bottom to top in pre-Jurassic, Jurassic–Cretaceous, and Cenozoic strata. There are two marked density interfaces between them: a density contrast of 0.36 g/cm3, between the Cenozoic and the Jurassic–Cretaceous, and 0.18 g/cm3 between Jurassic–Cretaceous and pre-Jurassic. This density structure provides advantageous geophysical conditions for the separation of airborne gravity anomalies and the estimation of interface depths.
2.2 Airborne Bouguer Gravity Field
The airborne Bouguer gravity field in the middle-south South Yellow Sea has the following features (Fig. 2).
(1) The half-wavelength resolution of the airborne Bouguer gravity achieves 2–3 km. We can not only see many large-scale strips or blocks of gravity anomalies in the gravity map, but also distinguish some small-scale gravity anomalies with the half-wavelength of about 2–3 km in Fig. 2. Such half-wavelength resolution of the airborne Bouguer gravity provides the high-precision basic data for the interpretation of
Weihai Seoul
JizhouIsland
Qingdao
Nanjing
Shanghai
Subei Basin
Jiaolai Basin
North Yellow Sea
Orogenic belt
Fault (zone)
Sedimentary basin
Sea-land boundary
North Basin
Lianyungang Middle uplift area
Airbornegravimetry area
Tan
lu f
au
lt
South Basin East uplift area
Wunansha uplift area
Sulu uplift area
Sunan uplift area
Sujiao-Qianliyan-Linjin orogenic belt
South Yellow Sea
○
○
○
○
○
. .
. . . . .
. . . . . . . . .
. . . . . . . . . . . . .
. .
. . . . . . . . . . . . .
. . . . . . . .
. . . . .
. . . . .
. .
. .
. . .
. . . .
○
N
35
º3
3º
37
ºN
126ºE120º 122º 124º
Figs. 2, 3, 4, 7, 8, 9, 11
100 km
. .
. . . .
. . . . . . .
. .
. .
. .
. .
. . . . .
. . . . . . . . . . .
. . .
. . . . . . . . . . . . .
. . . . .
. . . . . .
. . .
.
. . . . .
Figure 1. Sketch map showing the regional tectonic location of the South Yellow Sea (from Li W Y et al., 2012a). Purple dashed rectangle is the area of the
present airborne gravitimetry survey and also the area of Figs. 2, 3, 4, 7, 8, 9, and 11.

Wenyong Li, Yanxu Liu, Bing Li and Feng Luo
688
Table 1 Density of strata in the study area
Strata
System Formation
Lithology Average density
(g/cm3)
Density
layers
Q Neogene
Yancheng (N1-2y)
Sandy conglomerate, sandstone, mudstone, ande-
site, basalt, clay, sand layer, gravel beds 2.10
Sanduo (E3s)
Dainan (E2d)
Paleogene
Funing (E1f)
Sandstone, mudstone 2.29
2.20 A
Taizhou (K2t)
Chishan (K2c)
Cretaceous
Pukou (K2p)
Mudstone, sandstone, conglomerate 2.53
Jurassic Conglomerate, sandstone, shale, andesite,
trachyandesite, trachyte, tuff 2.59
2.56 B
Silurian–Triassic Limestone, dolostone, sandstone, shale 2.69
Sinian–Ordovician Limestone, dolostone
Pre-Sinian Phyllite, marble, granulitite, amphibolite, schist,
gneiss, migmatite
2.78 2.74 C
structural elements and local geological bodies.
(2) Most airborne Bouguer gravity anomalies are positive, and only a minority are negative. Abnormal values range from -16 to 32 mGal. Positive gravity anomalies are widely distrib-uted over the study area but there are also some negative anomalies in the southwest and middle.
(3) High and low anomalies are distributed unevenly and may occur in different assemblages and gravity anomaly divisions.
The north part of the the study area displays high gravity anomalies among low anomalies, and most of the high anomalies are strip-shaped with NE-SW trending major axes while most of the low anomalies are oval. The low anomalies cover less than one-third of the area of the high anomalies and so we have given the northern area the name Middle South Yellow Sea high gravity anomaly area. The east also displays high gravity anomalies among local low anomalies, but the high and low anomalies are all strip-shaped with E-W trending major axes. The low anoma-lies only cover about one-tenth of the area of the high anomalies, and so we call this area the east high gravity anomaly area. The middle and the southwest part of the study area being in con-trast to the north, low gravity anomalies occur among local high anomalies, low gravity anomalies occur among high anomalies, and most of their axial trends are NEE-SWW or even E-W, with high anomalies covering about one-tenth of the area of low anomalies, so we denominate this area the south South Yellow Sea low gravity anomaly area. The south also shows high anomalies among low anomalies but all anomalies trend NEE-SWW or E-W. The low anomalies cover about one-fourth of the area of the high anomalies. Thus we call this area the Wunansha high gravity anomaly area.
(4) Although there are many Bouguer gravity gradient belts, giant gravity gradient belts are few. Bouguer gravity gra-dient belts are a response to abrupt zones of change such as faults and are caused by great density contrasts. Most of the gravity gradient belts in the study area extend for only a short distance (e.g., Nos. 4, 5, 6 … 46 in Fig. 2). There are about 60 gravity gradient belts longer than 10 km in the study area and
they have poor continuity and multiple complex directions. Only three in the middle of the study area (Nos. 1, 2, 3 in Fig. 2) are longer than 150 km, while the others are shorter than 60 km. Although the trends of the gravity gradient belts are complex, three principal trends can be distinguished, namely NE-SW, near E-W and NW-SE. In the north of the study area, the ma-jority of the gravity gradient belts have an NE-SW trend while a minority has an NW-SE trend. In the middle, the east and the south of the study area, the majority of gravity gradient belts have a near E-W trend, while a minority is NW-SE and NE-SW trending. The regularity and multiplicity of the airborne Bouguer gravity gradient belts suggest multiple phases and complexity of tectonic movements in the study area.
(5) Contours of airborne Bouguer gravity change dramati-cally and gravity anomalies are broken, with a great many local gravity anomalies. It is difficult to map stable extensions of con-tours along any direction over a larger range and instead it is rather common for contour to curve and change over short dis-tances. The mingling of overall high or overall low anomaly areas with local gravity low anomalies or gravity high anomalies not only destroys the regional stability and continuity of airborne Bouguer gravity anomalies, but makes it very difficult to find regional gravity anomalies over a large range. It also interferes with the directions of the gravity anomalies and makes the identi-fication of directions difficult, and causes many local gravity anomalies. We have discovered about 139 local gravity anomalies in the study area by using statistics.
The above-mentioned features all reflect the complexity of tectonism and magmatic activity in the study area in response to the presence of fault blocks, sedimentary facies changes and magmatic rocks.
3 STRUCTURES AND STRATA 3.1 Structures 3.1.1 Cenozoic structures
Cenozoic structures were mainly controlled by the Himalaya (or Sanduo) movement. Airborne Bouguer gravity measurements

Hydrocarbon Exploration in the South Yellow Sea Based on Airborne Gravity, China
689
Figure 2. Airborne Bouguer gravity map of the middle-south South Yellow Sea. The area of this figure is outlined in Fig. 1 and is the same as Figs. 3, 4, 7, 8, 9, and 11.
(Fig. 2), their vertical first derivatives (Fig. 3) and their directional derivatives reveal the presence of more than 100 faults in the study area. They are on different scales, mostly small-medium with a minority of large ones. They have various trends divided into three principal groups, NE-SW, NW-SE, and near E-W. The overwhelming majority of faults are extensional; some of them are posthumous Cenozoic reactivation faults following earlier orienta-tions, and the rest are new faults that formed in the Paleogene. All these faults controlled Cenozoic (especially Paleogene) sedimen-tary thicknesses and distributions, and result in a structural framework of north-south sectioning, northwest zonation and northeast segmentation.
Considering faults and Cenozoic sedimentary thicknesses and distribution, we have divided the study area into four 1st-order structural elements, 11 2nd-order structural elements and 47 3rd-order structural elements (Fig. 4, Table 2). The 1st-order structural elements represent basin and uplift areas, including the middle uplift area, the South Basin, the east uplift area and Wunansha uplift area while the 2nd-order structural elements represent depressions and the uplifts within larger
basins or uplifts. The 3rd-order structural elements represent sags (negative elements) and swells (positive elements) in de-pressions or uplifts. 3.1.2 Pre-Cenozoic structures
The faults revealed by the present airborne gravimetry are mostly extensional faults controlling Meso–Cenozoic sedimen-tation. However, regional geotectonic environment studies (Chang and Zhao, 2012; Li S Z et al., 2012; Shinn et al., 2010; Yoon et al., 2010; Xu et al., 2008) suggested that the lower Yangtze block underwent regional compressional tectonic stress field in the Indosinian and Yanshanian epochs that not only intensively deformed Sinian–Triassic and Jurassic– Cretaceous strata, but also caused a series of compressional or compresso-shear structures, such as folds, thrust faults and nappes which have been verified by exploration in the South Yellow Sea (Zhai et al., 2002).
For example, fault F33 revealed by the present airborne gravimetry survey tallies with previous seismic exploration results. It lies at the boundary between the north 3rd sag and the

Wenyong Li, Yanxu Liu, Bing Li and Feng Luo
690
1st low swell in the north depression of the South Basin (Fig. 4) and corresponds to a NE-direction linear Bouguer gravity gra-dient belt and is an extensional normal fault controlling Paleo-gene sedimentation, with NW inclination, northwest side downthrown and southwest side upthrown. Drilling of Well CZ12-1-1(A) located on the rising side of the above mentioned linear gravity gradient zone (namely, the 1st low swell) re-vealed an overfold and thrust fault in the footwall of fault F33. The overfold involved Upper Carboniferous and Permian strata, and the thrust fault originated in the Carboniferous and caused repetition of strata (Fig. 5).
Seismic profiles also display many thrust faults in Paleozoic–Triassic strata in the south depression of the South Basin of the South Yellow Sea (Fig. 6). 3.2 Stratigraphic Sequences 3.2.1 Cenozoic strata
We have calculated the depth to the base of the Cenozoic and Cenozoic thickness in the middle-south South Yellow Sea by Euler deconvolution based on the airborne Bouguer gravity data (Li et al., 2012b; Yang et al., 2012; Hansen and Suciu, 2002). Euler decovolution is an inverse method applied to a
gravitational potential field to estimate the source location based on the Euler homogeneous equation. It locates an anom-aly source using the potential anomaly, its spatial derivative and specific structure index of various geologic bodies.
Simple regular models satisfy the Euler equation
0 0 0( ) ( ) ( ) [ ]P P P
x x y y z z C B Px y z
where (x0, y0, z0) is the location of potential source, (x, y, z) is the measuring point, ∆P is the potential anomaly (such as the gravity anomaly), B is the regional field or background field, C is the structure index of geologic body.
By the above formula, we can calculate the source depth based on grid data of airborne gravity. The structure index (C) of different gravity sources are listed in Table 3.
Cenozoic thicknesses and distributions (Fig. 7) are as fol-lows: (1) Cenozoic strata are widely distributed across the whole study area but there is a large variation in thickness with a range of 960–4 750 m. They are thicker in the South Basin, mostly more than 2 000 m, and thin in the middle uplift, the east uplift area and the Wunansha uplift area, mostly less than
Figure 3. Vertical first derivative of airborne Bouguer gravity anomalies in the study area.

Hydrocarbon Exploration in the South Yellow Sea Based on Airborne Gravity, China
691
Figure 4. Cenozoic faults and structural elements in the area of the airborne gravity survey. Colors indicate Bouguer gravity values. Names of structural ele-
ments listed in Table 2.
2 000 m; (2) in the South Basin, about four-fifths of the area has thicknesses over 2 500 m, and there is a thick belt with a near E-W trend (the middle depression) and two thick centers (Haian sag and Baiju sag in the Dongtai depression); (3) previous seis-mic profiles show that Cenozoic strata in the middle uplift area,
east uplift area, Wunansha uplift area, and in the uplifts or swells of the South Basin are mostly composed of Neogene strata, but Cenozoic strata occurring in the sags of the South Basin include not only Neogene, but also thick Paleogene; (4) previous seismic profiles also show that Neogene thickness in the whole

Wenyong Li, Yanxu Liu, Bing Li and Feng Luo
692
Table 2 Structural elements in the study area
1st-order structural
elements
2nd-order structural
elements
3rd-order structural elements
Middle uplift area of
South Yellow Sea
1. 1st sag; 2. 1st swell; 3. 2nd sag; 4. 2nd swell; 5. 3rd sag; 6. 3rd swell; 7. 4th sag; 8. 4th swell;
9. 5th swell; 10. 5th sag; 11. 6th swell; 12. 6th saag; 13. 7th swell; 14. 7th sag; 15. 8th sag
North depression 21. North 1st sag; 22. North 1st swell; 23. North 2nd sag; 24. North 3rd sag; 25. 1st low
swell; 26. 1st slope
North uplift
Middle depression 34. Middle 1st sag; 35. Middle 2nd sag; 36. Middle 3rd sag; 37. Middle 4th sag; 38. Mid-
dle 5th sag
South depression 39. South 1st swell; 40. South 1st sag; 41. 2nd low swell; 42. South 2nd sag
Yanfu depression 27. Zhongxingzao swell; 28. Yancheng sag
Jianhu uplift 29. Yannan swell
South Basin of South
Yellow Sea
Dongtai depression 30. Baiju sag; 31. Yuhua swell; 32. Xiaohai swell; 33. Haian sag
East uplift area of South
Yellow Sea
16. East 1st swell; 17. East 1st sag; 18. East 2nd swell; 19. East 2nd sag; 20. East 3rd
swell
Wunansha uplift area 43. Tongyang swell; 44. Wunansha 1st swell; 45. Wunansha 1st sag; 46. Wunansha 2nd
swell; 47. Wunansha 2nd sag
Figure 5. Profile of borehole CZ12-1-1(A) showing an overfold and reverse
fault (from Zhai et al., 2002).
South Yellow Sea is relatively stable and thus the Cenozoic thickness changes in Fig. 7 mainly reflect Paleogene thickness differences. 3.2.2 Jurassic–Cretaceous strata
We have estimated the depth to the pre-Jurassic top in the middle-south South Yellow Sea from our airborne Bouguer gravity data by stripping the gravity anomalies caused by the Cenozoic strata and the basement and performing a Parker iteration (Li et al., 2010a; Li and Oldenburg, 1998; Oldenburg,
Figure 6. Seismic profile showing reverse faults in the south depression of the
South Basin of the South Yellow Sea (from Zhai et al., 2002). Location of the
seismic profile shown in Fig. 4.
Table 3 Structure factors of different gravity anomaly sources
Gravity sources Structure index
Evenness quality horizontal cylinder 1
Finite incline staircase 1
Evenness quality sphericity 2
1974; Parker, 1974) to calculate the Jurassic–Cretaceous thick-ness (Fig. 8).
The Jurassic–Cretaceous strata have the following features: (1) they are poorly developed and have a limited distribution, only appearing in the middle and southwest of the study area, and a few sags in the east and the south, and they are absent in most of the uplift areas in the north, the east and the southeast; (2) there is a large variation in thickness, with a range of 0–3 300 m. The Jurassic–Cretaceous thickness in the Haian and Baiju sags is greater, and mostly the thickness values are 2 250–3 000 m. The thickness in the Xiaohai and Yuhua swells and the northwestern corner of the middle 5th sag of the South Basin is smaller, and mostly less than 1 250 m, whereas the thickness values in the other Jurassic–Cretaceous distribution areas are mostly 1 250– 2 500 m.

Hydrocarbon Exploration in the South Yellow Sea Based on Airborne Gravity, China
693
Figure 7. Cenozoic thickness and distribution in the study area estimated by
the airborne gravity data. Color code interval in meters.
Figure 8. Jurassic–Cretaceous thickness and distribution in the study area
estimated by the airborne gravity data. The color code interval is X meter.
3.2.3 Sinian–Triassic strata
We estimate the depth to the top of the pre-Sinian mag-netic basement from our airborne Bouguer gravity data by the tangent method (Zhu, 2012; Li et al., 2010a), and calculate the Sinian–Triassic thickness (Fig. 9).
The Sinian–Triassic strata have the following features: (1) they are widely distributed in the whole marine basin area, but there is a large variation of residual thicknesses with values ranging from 460 to 7 700 m; (2) the thickness distribution presents block-like features. From the thickness values, the whole area can be divided into three areas; large, medium and small. The large thickness area includes the majority of the northwest and south of the study area, with thickness values of 3 000–7 700 m. In the northwest, most of the thickness values
Figure 9. Sinian–Triassic thickness and distribution of study area estimated
by airborne gravity and magnetic data. Note that the area of this figure is the
same as Fig. 2. The color code interval is X meter.
are 4 000–7 500 m; in the south, most of the thickness values are 3 500–7 000 m. The medium thickness area mainly lies in the northeast of the study area, with values of 2 000–4 000 m. The small thickness area includes the middle, the south margin and the northwest corner of the study area, with the values less than 2 000 m; (3) in the same area, the Sinian–Triassic thick-ness is comparatively steady without obvious breaks and sud-den changes.
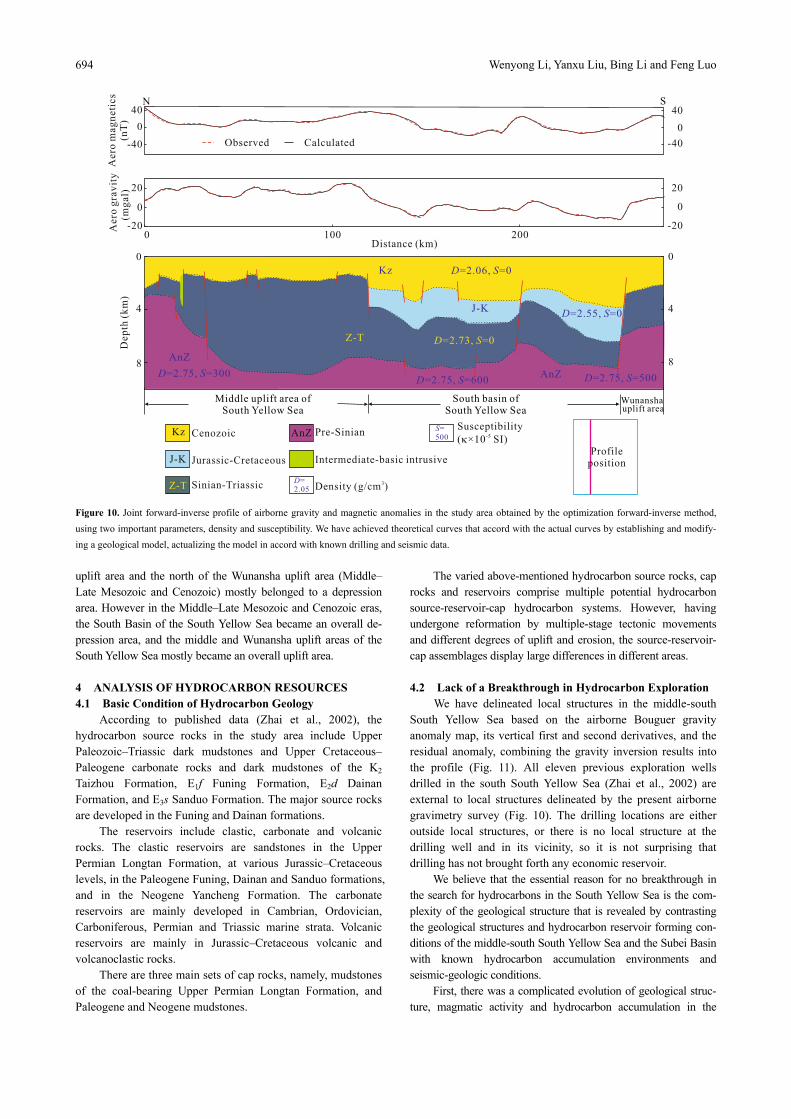
Here we should point out by contrasting the Sinian– Triassic thickness map (Fig. 9) with the Cenozoic map (Fig. 7) that the thickness and distribution of the Sinian–Triassic and the Cenozoic are very different. The difference between the two stratal sequences shows that there were different distribution patterns of uplifts and depressions during their sedimentary periods, and there was no general posthumous reactivation of pre-Triassic patterns of uplifts and depressions. The Sinian– Triassic depression area with a large stratal thickness in the northwest of the study area corresponds to the Cenozoic uplift area with a small thickness (mostly in the middle uplift area of the South Yellow Sea). The Sinian–Triassic depression area with a large Sinian–Triassic thickness in the south approxi-mately corresponds to the south depression of the South Basin of the South Yellow Sea with a medium-small Cenozoic thick-ness. The middle of the study area displays a small Sinian– Triassic thickness roughly corresponding to the major (middle) depression of the South Basin of the South Yellow Sea with a large Cenozoic thickness. The majority of the northeast of the study area with medium Sinian–Triassic thicknesses corre-sponds to the Cenozoic uplift area with a small Cenozoic thickness (the southeast of the middle uplift area of the South Yellow Sea). Figure 10 is a forward-inverse profile which dis-plays the aforementioned features clearly.
To sum up, during Paleozoic to Early Mesozoic times the South Basin of the South Yellow Sea (Middle–Late Mesozoic and Cenozoic) belonged mostly to an uplift area, and the middle
Wenyong Li, Yanxu Liu, Bing Li and Feng Luo
694
-40
0
40
20
0
-20Aero
grav
ity
(m
gal)
Aero
mag
neti
cs
(n
T)
2001000Distance (km)
0
4
8
Middle uplift area of
South Yellow Sea
-40
0
40
20
0
-20
S
Observed Calculated
Kz Cenozoic
Sinian-Triassic
Jurassic-Cretaceous
Pre-Sinian
Density (g/cm )3
Susceptibility
SI)( ×10�-5
Intermediate-basic intrusive
=2.06, =0D S
J-K
=2.75, =300D S
Z-T D S=2.73, =0
Kz
=2.75, =500D SAnZ
0
4
8
=2.55, =0D S
=2.75, =600D S
AnZ
N
South basin of
South Yellow Sea
Wunanshauplift area
AnZ
Profile
position
Z-T=
2.05
D
=
500
S
Dep
th (
km
)
J-K
Figure 10. Joint forward-inverse profile of airborne gravity and magnetic anomalies in the study area obtained by the optimization forward-inverse method,
using two important parameters, density and susceptibility. We have achieved theoretical curves that accord with the actual curves by establishing and modify-
ing a geological model, actualizing the model in accord with known drilling and seismic data.
uplift area and the north of the Wunansha uplift area (Middle– Late Mesozoic and Cenozoic) mostly belonged to a depression area. However in the Middle–Late Mesozoic and Cenozoic eras, the South Basin of the South Yellow Sea became an overall de-pression area, and the middle and Wunansha uplift areas of the South Yellow Sea mostly became an overall uplift area. 4 ANALYSIS OF HYDROCARBON RESOURCES 4.1 Basic Condition of Hydrocarbon Geology
According to published data (Zhai et al., 2002), the hydrocarbon source rocks in the study area include Upper Paleozoic–Triassic dark mudstones and Upper Cretaceous– Paleogene carbonate rocks and dark mudstones of the K2 Taizhou Formation, E1f Funing Formation, E2d Dainan Formation, and E3s Sanduo Formation. The major source rocks are developed in the Funing and Dainan formations.
The reservoirs include clastic, carbonate and volcanic rocks. The clastic reservoirs are sandstones in the Upper Permian Longtan Formation, at various Jurassic–Cretaceous levels, in the Paleogene Funing, Dainan and Sanduo formations, and in the Neogene Yancheng Formation. The carbonate reservoirs are mainly developed in Cambrian, Ordovician, Carboniferous, Permian and Triassic marine strata. Volcanic reservoirs are mainly in Jurassic–Cretaceous volcanic and volcanoclastic rocks.
There are three main sets of cap rocks, namely, mudstones of the coal-bearing Upper Permian Longtan Formation, and Paleogene and Neogene mudstones.
The varied above-mentioned hydrocarbon source rocks, cap rocks and reservoirs comprise multiple potential hydrocarbon source-reservoir-cap hydrocarbon systems. However, having undergone reformation by multiple-stage tectonic movements and different degrees of uplift and erosion, the source-reservoir- cap assemblages display large differences in different areas. 4.2 Lack of a Breakthrough in Hydrocarbon Exploration
We have delineated local structures in the middle-south South Yellow Sea based on the airborne Bouguer gravity anomaly map, its vertical first and second derivatives, and the residual anomaly, combining the gravity inversion results into the profile (Fig. 11). All eleven previous exploration wells drilled in the south South Yellow Sea (Zhai et al., 2002) are external to local structures delineated by the present airborne gravimetry survey (Fig. 10). The drilling locations are either outside local structures, or there is no local structure at the drilling well and in its vicinity, so it is not surprising that drilling has not brought forth any economic reservoir.
We believe that the essential reason for no breakthrough in the search for hydrocarbons in the South Yellow Sea is the com-plexity of the geological structure that is revealed by contrasting the geological structures and hydrocarbon reservoir forming con-ditions of the middle-south South Yellow Sea and the Subei Basin with known hydrocarbon accumulation environments and seismic-geologic conditions.
First, there was a complicated evolution of geological struc-ture, magmatic activity and hydrocarbon accumulation in the

Hydrocarbon Exploration in the South Yellow Sea Based on Airborne Gravity, China
695
South Yellow Sea, and the South Basin belongs to a complicated fault-block oil-and-gas field, which is similar to the North Sea oil and gas fields of Europe (Glennie, 1998).
(1) Regarding the structures. By comparison, the structural environment in South Yellow Sea area is similar to the North Sea area of Europe (Glennie, 1998). The North Sea area of Europe has experienced a long geological period and has formed a compli-cated fault system associated with the rifting apart of the North Atlantic Ocean. The rifting caused extensional faulting within the continental shelf and in turn gave rise to faults and other structures associated with oil and gas fields. The Subei Basin has experi-enced a tortuous exploration history, and has been gradually un-derstood by petroleum geologists during many decades of devel-opment. The basin is one of the most complicated fault-block oil-and-gas fields in the world, with countless third-order and smaller faults and broken structures. The overwhelming majority of oil-and-gas fields occupy an area of 0.1–0.2 km2 and belong to small minor fault blocks. The South Basin of the South Yellow Sea and the Subei Basin are actually parts of the same basin that has a complicated fault system consisting of many low-order faults derived from the Tanlu fault at different geological periods. Multiple activity and stress-field transformations associated with the Tanlu fault have resulted in reversing, compounding and com-bining different oil-controlling faults that could have played dif-ferent roles, such as a pathway, sealing, adjustment, and destruc-tion; giving rise to small, fragmentary, lean narrow reservoirs in different space-time courses of hydrocarbon accumulation.
(2) Regarding magmatic activity. By comparison, mag-matic activity in the South Yellow Sea area may also be similar to the North Sea area of Europe (Glennie, 1998). Igneous activity in the major oil and gas fields of the North Sea area is related to rifting apart of the North Atlantic Ocean associated with a large magmatic province, and affected the hydrocarbon migration, ac-cumulation and preservation. The exploration and exploitation of the Subei Basin shows that there are multiple sets of igneous rocks at shallow, middle and deep levels of the major depressions. These igneous rocks include basalt, andesite, diabase and granite. The present airborne gravimetry has revealed the development of ig-neous rocks in the middle-south South Yellow Sea. On the one hand, magmatic activity might have had three kinds of positive action on the hydrocarbon accumulation course in this area; it accelerated hydrocarbon source rock maturity by increasing the geothermal gradient; igneous rocks with excellent secondary po-rosity could become hydrocarbon reservoirs; and tight igneous rocks could become hydrocarbon barriers. On the other hand, the development of the igneous rocks might also have had negative effects on the hydrocarbon accumulation. The igneous rocks might have affected the preservation of oil pays and reservoirs, and caused a long adjustment, reformation or destruction of oil pays or reservoirs, and resulted in the increase of exploration risk and difficulty. Igneous rock obstruction might also have affected the normal direction and speed of hydrocarbon migration, large-scale igneous rock bodies could have made perfect oil-free (dry structure) traps.
(3) Regarding sedimentary facies and hydrocarbon reservoirs. The marginal coarse facies belt of the lacustrine basin in the South Basin of the South Yellow Sea was eroded but the interior fine facies belt was mostly preserved. So the physical properties of
potential reservoirs for hydrocarbon accumulation varied greatly in different districts of the study area.
(4) Regarding hydrocarbon generation. The major hydrocarbon-generating Funing Formation in the South Basin underwent subsidence and rising temperatures, and two episodes of uplift and heat dissipation resulting in thin scattered but mature hydrocarbon source rocks. These source rocks are mostly distrib-uted in the deep sags.
(5) Regarding hydrocarbon preservation. The South Basin underwent uplift several times especially after the epoch when the Sanduo Formation was deposited, when the basin was uplifted and eroded for 13.4 Ma. Moreover, polyphase magmatic intrusion substantially reduced hydrocarbon preservation. The whole study area subsided and stable cap rocks formed in the Neogene; this was advantageous to the preservation of secondary hydrocarbon generation and accumulation.
Secondly, seismic studies reveal complicated geologic condi-tions which cause difficult homing and poor reflection imaging in the South Yellow Sea. These conditions had two effects: (1) this marine area developed complicated small fault blocks, which certainly affects seismic imaging of faults. Countless third-order and smaller faults undoubtedly demand higher resolution seismic exploration and data processing. The exploration and exploitation of the Subei Basin show that indistinct seismic imaging of faults and inaccurate homing directly affect the choice of well positions. Most oil pay zones are very narrow in the study area, and if drill-ing targets deviate from the high points of traps, the oil pays will not be drilled; (2) multiple sets of igneous rocks in major depres-sions make seismic profiles complicated. Igneous rocks mainly have three influences on the seismic effective reflections. Firstly, there is a very strong wave impedance interface between igneous rocks and country rocks, and it usually causes strong seismic re-flection and shielding of the underlying strata, resulting in very weak reflections from the underlying strata. Secondly, high seis-mic velocities in igneous rocks distort downward seismic wave rays and cause CMP (common middle point) scattering and poor stacking and imaging. Thirdly, multiple reflections from igneous rocks interfere with effective reflection, and badly affect recogni-tion of target layers and interpretation of structures.
All these features contribute to uncertain interpretation and understanding of the extent of hydrocarbon reserves in the South Yellow Sea. 4.3 Distribution of Local Structure Belts
In the airborne Bouguer gravity figures, the vertical first and second derivatives and the residual anomalies of the study area, local structures which are favorable for hydrocarbon ac-cumulation present local gravity-high anomalies in response to small folds or other positive structures against a regional low gravity background, or local arc-shaped high gravity anomalies, the majority of which are the response to nose-shaped structures, abruptly bulging out toward the low-value side of linear gravity gradient belts. A local structure belt should correspond to the concentration of a series of local high gravity anomalies against a regional low gravity background. We have delineated alto-gether ten favorable structural belts, six of which are relatively favorable in the study area according to the hydrocarbon migra-tion direction, hydrocarbon source, local structure distri-

Wenyong Li, Yanxu Liu, Bing Li and Feng Luo
696
Figure 11. Jurassic–Paleogene tectonic divisions and local structure distribution interpreted by airborne gravity of study area. 1. 1st sag; 2. 1st swell; 3. 2nd sag; 4.
2nd swell; 5. 3rd sag; 6. 3rd swell; 7. 4th sag; 8. 4th swell; 9. 5th swell; 10. 5th sag; 11. 6th swell; 12. 6th sag; 13. 7th swell; 14. 7th sag; 15. 8th sag; 16. east 1st swell;
17. east 1st sag; 18. east 2nd swell; 19. east 2nd sag; 20. east 3rd swell; 21. north 1st sag; 22. north 1st swell; 23. north 2nd sag; 24. north 3rd sag; 25. 1st low swell;
26. 1st slope; 27. Zhongxingzao swell; 28. Yancheng sag; 29. Yannan swell; 30. Baiju sag; 31. Yuhua swell; 32. Xiaohai swell; 33. Haian sag; 34. middle 1st sag; 35.
middle 2nd sag; 36. middle 3rd sag; 37. middle 4th sag; 38. middle 5th sag; 39. south 1st swell; 40. south 1st sag; 41. 2nd low swell; 42. south 2nd sag; 43. Tongyang
uplift; 44. Wunansha 1st swell; 45. Wunansha 1st sag; 46. Wunansha 2nd swell; 47. Wunansha 1st sag.
bution and controlling effect of faults (Fig. 11).
A favorable structure belt is an important area for hydrocarbon migration and accumulation where there are favorable local structures, good source-reservoir-cap assemblages, and no slight fault destruction. We have delineated ten favorable structural belts in the study area, SYI1-10. SYI5 and SYI6 are
located on the land to the west of the coast and have been verified by exploration and exploitation of the Subei oil-and-gas field. The other structural belts are all located in the South Basin of the South Yellow Sea. We wish to emphasize that the favorable belts SYI1-4 are all local swell belts located in the very favorable hydrocarbon-bearing depressions; they are typical swell structures

Hydrocarbon Exploration in the South Yellow Sea Based on Airborne Gravity, China
697
in sags or depressions, with adequate potential hydrocarbon source rocks, good hydrocarbon migration directions and source-reservoir-cap assemblages. They have great possibilities for hydrocarbon accumulation and are well worth prospecting.
Other relatively favorable structural belts are also reasonable areas for hydrocarbon migration and accumulation, with relatively developed local structures and source-reservoir- cap assemblages. We have delineated six such belts, namely SYII1, SYII2, SYII3, SYII4, SYII5 and SYII6. These structural belts are mostly on the edge of hydrocarbon-bearing depressions, and they are usually controlled by larger-scale faults with mostly nose-shaped structures. 4.4 Future Emphasis and the Key to Hydrocarbon Exploration
Synthesizing previous exploration work in the middle- south South Yellow Sea, geological structures and hydrocarbon accumulation conditions, we think that future hydrocarbon exploration in this marine area should emphasize these factors as the key to successful exploration.
Future hydrocarbon exploration should have a foothold in the Mid-Cenozoic continental strata, especially Paleogene; and also the Mid-Paleozoic marine strata. Although faults have developed in the Mid-Cenozoic continental strata, especially the Paleogene in the South Basin of the South Yellow Sea, there are relatively good cap rocks, shorter periods of uplift. Besides, erosion have occurred, and the local structures mostly formed before hydrocarbon generation and expulsion, so they are rela-tively favorable to hydrocarbon accumulation. We should pay special attention to the favorable structure belts SYI1-4, and carry through detailed seismic exploration or drilling soon.
In the middle uplift area of the South Yellow Sea, the Mid-Paleozoic marine strata are well developed, thick with good hydrocarbon generating conditions, but this region has been part of the East China active continental margin since the Mesozoic, and underwent uplift, erosion and intense faulting during the Jurassic–Cretaceous around 176 Ma and in the Pa-leogene, when the original hydrocarbon reservoirs were mostly destroyed. Therefore, hydrocarbon exploration should aim at local reservoirs of secondary hydrocarbon generation, even though reservoir scales are probably small.
Above all future hydrocarbon exploration should improve exploration resolution and intensify and refine study of fine structures. In the study area, most of the oil pay zones are nar-row, and we must aim precisely at trap culminations to capture reservoirs. 5 CONCLUSIONS
(1) Airborne gravimetry has an important application value for research into hydrocarbon-bearing basins. Successful application of new airborne gravity geological surveys has provided a new method for studying complex hydrocarbon- bearing basins in the South Yellow Sea. We have not only in-terpret strata and structures, but also delineated local structures and structure belts.
(2) Both strata and structures of different areas and eras in the middle-south South Yellow Sea have strong differences. Cenozoic and Jurassic–Cretaceous continental strata are well
developed in the South Basin of the South Yellow Sea, with thick Mid-Paleozoic marine strata preserved in the middle up-lift area of the South Yellow Sea. Airborne Bouguer gravity anomalies in the middle-south South Yellow Sea are frag-mented, and complex tensile normal faults and minor fault blocks are developed in Cenozoic strata, whereas there are reverse faults and nappe structures developed in pre-Cenozoic strata.
(3) To gain a foothold in Mid-Cenozoic continental strata (especially the Paleogene) and strengthen research on the fine structures in the South Basin of the South Yellow Sea are the keys that will lead to a hydrocarbon exploration breakthrough.
The essential reason for the lack of a breakthrough in hydro-carbon exploration so far is the complexity of the geological structure, the hydrocarbon accumulation environment and seis-mic-geologic conditions, and uncertain interpretation and under-standing of the features, rather than an imbalance of exploration framework and orientation. We should pay special attention to favorable structure belts in the South Basin of the South Yellow Sea, and take a lead in carrying out detailed seismic exploration and drilling.
ACKNOWLEDGMENTS
We are sincerely grateful to Profs. Ping Wang, Shengqing Xiong and Jianxin Zhou from China Aero Geophysical Survey & Remote Sensing Center for Land and Resources, for their support and direction. We also thank Profs. Xihua Zhou and Zhihong Guo for their great help in this study, and Jianchun Xu for his participa-tion in field work in this study. This study was supported by the National Important Special Project of Science and Technology of China (No. GZH200600301). The final publication is available at Springer via http://dx.doi.org/10.1007/s12583-015-0607-y.
REFERENCES CITED Cao, Q., Ye, J. R., Wang, W., et al., 2009. Preliminary Prediction
and Evaluation on Source Rock in Low Exploration Basin— A Case Study from the Northeast Depression, South Yellow Sea Basin, East China. Journal of Earth Science, 20(5): 836–847. doi:10.1007/s12583-009-0070-8
Chang, K. H., Zhao, X. X., 2012. North and South China Suturing in the East End: What Happened in Korean Peninsula? Gondwana Research, 22(2): 493–506. doi:10.1016/j.gr.2011.12.010
Dai, C. S., Yang, Y. Q., Yan, G. J., 2005. Modelling of Burial and Hydrocarbon-Generation Histories of Meso-Paleozoic Marine Residual Basins in South Yellow Sea and Its Geologic Significance. Oil & Gas Geology, 26(1): 49–56 (in Chinese with English Abstract)
Fan, X. L., 2001. A Discussion on Hydrocarbon Resources Exploration in Marine Strata in the South Yellow Sea Basin. Marine Origin Petroleum Geology, 6(4): 35–40 (in Chinese with English Abstract)
Glennie, K. W., 1998. Petroleum Geology of the North Sea: Basic Concepts and Recent Advances. Blackwell Publishing, Oxford. 42–84
Gong, J. M., 2002. Mesozoic Strata Correlations of the South Yellow Sea Basin and Its Adjacent Areas. Marine Geology & Quaternary Geology, 22(3): 83–91 (in Chinese with

Wenyong Li, Yanxu Liu, Bing Li and Feng Luo
698
English Abstract) Gu, Z. F., Zhang, Z. X., 2009. Shallow Seismic Stratigraphy and
Sedimentary Character in the Western South Yellow Sea. Marine Geology & Quaternary Geology, 29(4): 95–106
Hansen, R. O., Suciu, L., 2002. Multiple-Source Euler Deconvolution. Geophysics, 67(2): 525–535. doi:10.1190/1.1468613
Hou, F. H., Zhang, Z., Zhang, X. H., et al., 2008. Geologic Evolution and Tectonic Styles in the South Yellow Sea Basin. Marine Geology & Quaternary Geology, 28(5): 61–67 (in Chinese with English Abstract)
Hu, F., 2010. Hydrocarbon Resources Potential Study in Mesozoic–Palaeozoic Marine Strata in the South Yellow Sea Basin. Offshore Oil, 30(3): 1–8 (in Chinese with English Abstract)
Li, S. Z., Zhao, G. C., Dai, L. M., et al., 2012. Mesozoic Basins in Eastern China and their Bearing on the Deconstruction of the North China Craton. Journal of Asian Earth Sci-ences, 47: 64–79. doi:10.1016/j.jseaes.2011.06.008
Li, W. Y., Lu, W. F., Liu, Y. X., et al., 2012a. Superimposed Versus Residual Basin: The North Yellow Sea Basin. Geoscience Frontiers, 3(1): 33–39. doi:10.1016/j.gsf.2011.11.001
Li, W. Y., Zhou, J. X., Xiong, S. Q., et al., 2012b. Effect and Prospect of Basic Geological Survey Based on Airborne Gravimetry in China. Acta Geologica Sinica (English Edition), 86(1): 38–47. doi:10.1111/j.1755-6724.2012.00609.x
Li, W. Y., Zhou, J. X., Guo, Z. H., et al., 2010a. Tectonolayering Methods of Airborne Gravimetry. Progress in Geophysics, 25(5): 1641–1647 (in Chinese with English Abstract)
Li, W. Y., Zhou, J. X., Xiong, S. Q., et al., 2010b. Tectonic Geome-try of Tan-Lu faults in the Bohai Sea and Its Adjacent Areas Viewed from Airborne Gravity. Acta Geoscientica Sinica, 31(4): 549–556 (in Chinese with English Abstract)
Li, W. Y., Zhou, J. X., Zhou, X. H., et al., 2010c. Geological-Genetic Classification and Prospecting Significance on Local Anomaly of Airborne Gravimetry. Advances in Earth Science, 25(10): 1061–1069 (in Chinese with English Abstract)
Li, Y. G., Oldenburg, D. W., 1998. 3-D Inversion of Gravity Data. Geophysics, 63(1): 109–119. doi:10.1190/1.1444302
Liang, R. C., Pei, Y. L., Zheng, Y. P., et al., 2003. Gravity and Magnetic Field and Tectonic Structure Character in the Southern Yellow Sea. Chinese Science Bulletin, 48(S1): 64–73. doi:10.1007/bf02900942
Ma, L. Q., Chen, H. L., Dong, Y., et al., 2007. Tectonic Evolution of Subei-South Nanhuanghai Superimposed Basin from the Late Mesozoic to the Cenozoic and Marine Petroleum Potential. Oil & Gas Geology, 28(1): 35–42 (in Chinese with English Abstract)
Oldenburg, D. W., 1974. The Inversion and Interpretation of Gravity Anomalies. Geophysics, 39(4): 526–536. doi:10.1190/1.1440444
Ouyang, K., Zhang, X. H., Li, G., 2009. Characteristics of Stratigraphic Distribution in the Middle Uplift of South Yellow Sea. Marine Geology & Quaternary Geology, 29(1): 59–66.
doi:10.3724/sp.j.1140.2009.01059 Parker, R. L., 1974. Best Bounds on Density and Depth from
Gravity Data. Geophysics, 39(5): 644–649. doi:10.1190/1.1440454
Shinn, Y. J., Chough, S. K., Hwang, I. G., 2010. Structural Development and Tectonic Evolution of Gunsan Basin (Cretaceous–Tertiary) in the Central Yellow Sea. Marine and Petroleum Geology, 27(2): 500–514. doi:10.1016/j.marpetgeo.2009.11.001
Wan, T. F., Hao, T. Y., 2010. Mesozoic–Cenozoic Tectonics of the Yellow Sea and Oil-Gas Exploration. Acta Geologica Sinica (English Edition), 84(1): 77–90. doi:10.1111/j.1755-6724.2010.00172.x
Wu, Z. Q., Lu, K., 2011. Characteristics of P-Wave Velocity and Seismic Reflection of the Sedimentary Layer in the South Yellow Sea. Marine Geology & Quaternary Geology, 31(2): 73–78. doi:10.3724/sp.j.1140.2011.02073
Xiao, G. L., 2002. Reassessment of Petroleum Geologic Features and Potential Researves in the South Yellow Sea Basin. Marine Geology & Quaternary Geology, 22(2): 81–87 (in Chinese with English Abstract)
Xing, T., Zhang, X. H., Zhang, W. G., 2005. Progress in Geo-physical Survey and Researches in the South Yellow Sea. Marine Geology Letters, 21(6): 1–4 (in Chinese with Eng-lish Abstract)
Xu, Y., Hao, T. Y., Li, Z. W., et al., 2008. Analysis of Lithosphere Structure and Tectonics of Chinese Marginal Seas and Adjacent Regions. Earth Science Frontiers, 15(3): 55–63. doi:10.1016/s1872-5791(08)60062-7
Yang, S. C., Cai, D. S., Feng, X. J., et al., 2003. Thermal Maturation and Hydrocarbon Generation Stages of the Pre-Tertiary Source Rocks in South Basin, the Southern Yellow Sea. China Offshore Oil and Gas (Geology), 17(6): 370–375 (in Chinese with English Abstract)
Yang, W. C., Wang, J. L., Zhong, H. Z., et al., 2012. Analysis of Regional Magnetic Field and Source Structure in Tarim Basin. Chinese J. Geophys., 55(4): 1278–1287 (in Chinese with English Abstract)
Yoon, Y., Lee, G. H., Han, S., et al., 2010. Cross-Section Restoration and One-Dimensional Basin Modeling of the Central Subbasin in the Southern Kunsan Basin, Yellow Sea. Marine and Petroleum Geology, 27(7): 1325–1339. doi:10.1016/j.marpetgeo.2010.03.017
Zhai, G. M., Gao, W. L., Song, J. G., et al., 2002. Petroleum Geology of China (Vol. 16). Petroleum Industry Press, Beijing. 301–383 (in Chinese)
Zhao, Y. Q., Duan, T. J., Yuan, D. F., et al., 2007. Importance of Zhujiadun Gas Field Reservoir Researches to the Gas Explorations in South Basin of South Yellow Sea Basin. Marine Geology & Quaternary Geology, 27(4): 91–96 (in Chinese with English Abstract)
Zhu, Y., 2012. Tangent and Diagram Methods for Analysis of Dip Magnetized Models. Geological Publishing House, Beijing (in Chinese)