hydro geo chem by baro-pneumatic estimation of landfill gas generation rates at four southeastern...
TRANSCRIPT
HYDROGEOCHEM
by
www.hgcinc.com
BARO-PNEUMATIC ESTIMATION OF LANDFILL GAS GENERATION RATES AT FOUR SOUTHEASTERN U.S. LANDFILLS
Harold W. Bentley, Stewart J. Smith,and Todd Schrauf
Hydro Geo Chem, Inc.Tucson, Arizona

HYDROGEOCHEM

HYDROGEOCHEM
Modeled vs. Actual Pressures for SVI-1, Harrison Landfill, Tucson
13.20
13.25
13.30
13.35
13.40
0.0 0.5 1.0 1.5 2.0 2.5 3.0Time (days)
Pre
ss
ure
(p
si)
Measured Atmospheric PressureMeasured Pressure 100' BGSModeled Pressure 100' BGS (without LFG)Modeled Pressure 100' BGS (with LFG)
LFG = 740 cfm
Kv(vertical permeability= 15 darcies (.015 cm/sec)φg (gas porosity) ~ 0.24

Governing Equation For Gas Flow (Based on Darcy’s Law and the Continuity Equation)
is the effective gas permeability tensor
is the unit normal vector ρ is the gas density P is the pressure at a point in
the landfill g is gravitational acceleration
φ is gas-filled porosity µ is gas dynamic viscosity t is time is gas generation per unit
volume porous material µ and ρ are dependent on t, P,
and gas composition is the gradient operator
Q
ek
n
HYDROGEOCHEM
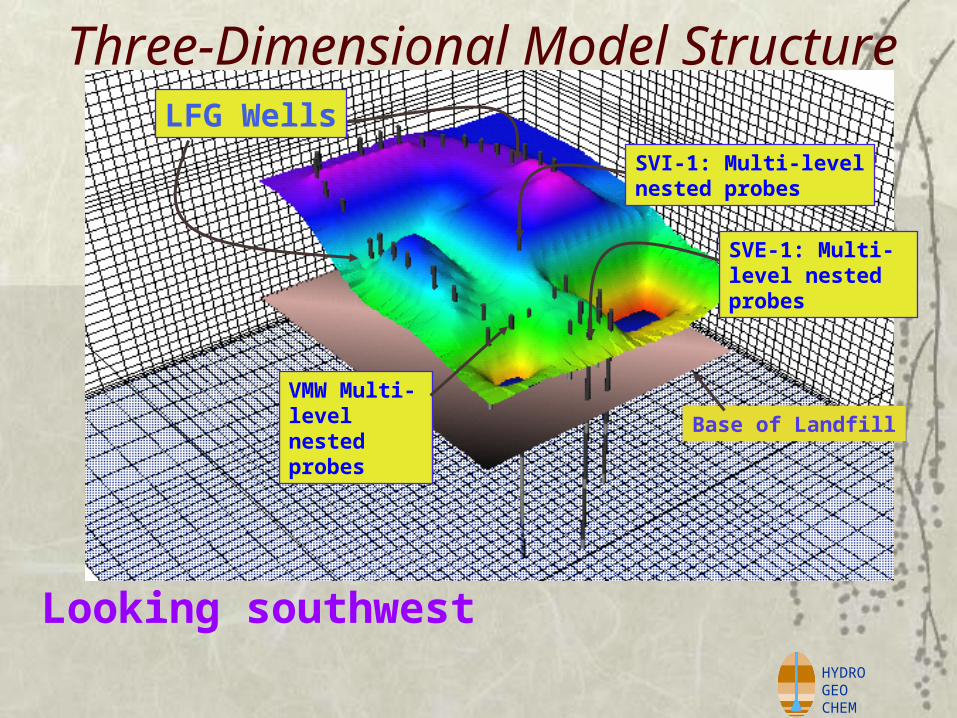
Three-Dimensional Model Structure
Looking southwest
LFG WellsSVI-1: Multi-levelnested probes
SVE-1: Multi-level nested probes
VMW Multi-level nested probes
Base of Landfill

HYDROGEOCHEM
Why This Approach? Other Methods Not Very Accurate
Methods that depend on site-specific, field measurements: are plagued by heterogeneous permeabilities and LFG production or don’t work at all (EPA Method 2E, Tier III method)
(G. Walter, 2003. J. Air & Waste Management 53, p 461)
Those depending on generic estimates of rate (k) and methane potential (L0 ),don’t account for site conditions that affect LFG rates.
Baro-pneumatic interpretation is based on rigorous, well-established gas-flow equations Variety of tested numerical and analytical models available for analysis

HYDROGEOCHEM
What is the Value of More Quantitative LFG Measurement ?
Whenever LFG needs to be measured, collected, or controlled, the ability to quantitatively estimate and model LFG generation rates provides Better engineering, Ability to simulate and optimize system performance Produce more efficient LFG collection and control systems Less risk of project failure.

HYDROGEOCHEM
Quantify potential methane (energy) resource* Predict costs and revenues of LFG-to-energy system* Quantify carbon credits Evaluate landfill emissions Odor control Evaluate anaerobic bioreactor Method provides numerical landfill model* for Design, evaluation, optimization, and cost estimates:
LFG collection systems* LFG-to-energy systems* Gas migration or emissions control systems*
Can provide calibrated 1st order decay model * to estimate future LFG production* discussed in this presentation
Potential Applications

HYDROGEOCHEM
Saint Landry Parish Landfill, Louisiana
PLAN VIEW, TOPOGRAPHY, AND PRESSURE-MONITORING LOCATIONS
33 acresFill: 1986-2002 1.06 x10⁶ tons
HYDROGEOCHEM
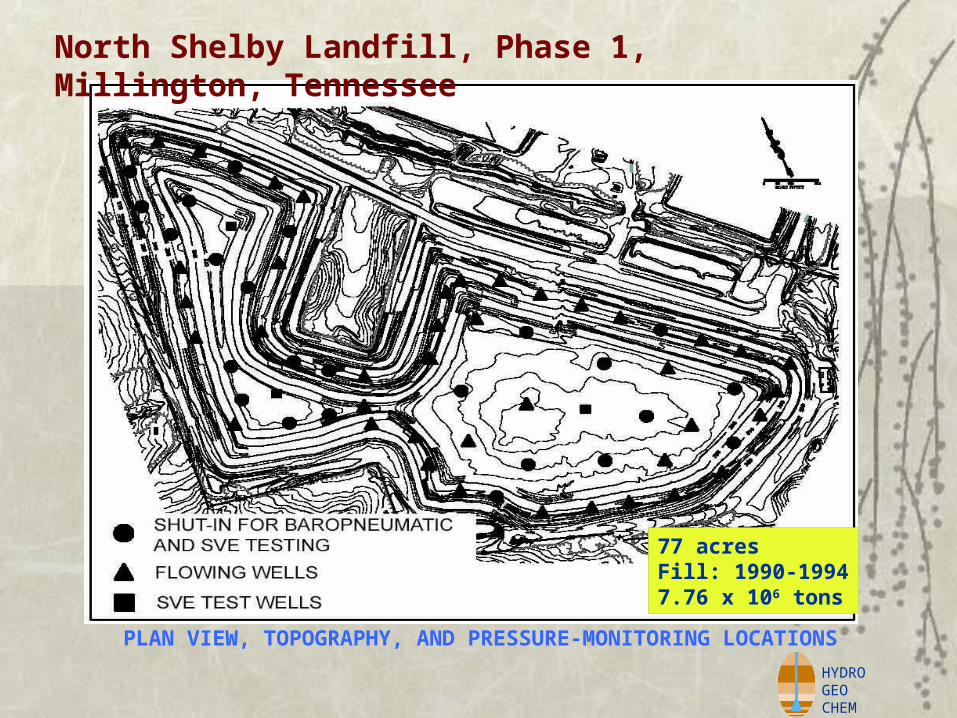
North Shelby Landfill, Phase 1, Millington, Tennessee
PLAN VIEW, TOPOGRAPHY, AND PRESSURE-MONITORING LOCATIONS
77 acresFill: 1990-19947.76 x 106 tons

HYDROGEOCHEM
-5000 -4800 -4600 -4400 -4200 -4000 -3800 -3600 -3400
NO RTHIN G
5000
5200
5400
5600
5800
6000
6200
EA
ST
ING
B-9
B-6B-3
B-8B-5
B-2
B-1B-4B-7B-10
VE-1
VE-2
VE-3
VE-4
M O NITO RING PRO BE PAIRB-1 VE-1
VAPO R EXTRACTIO N W ELL
AREA OF ACTIVE FILLING
MEASURED AREA
PLAN VIEW, TOPOGRAPHY, AND PRESSURE-MONITORING LOCATIONS
Decatur County Landfill, Georgia
35 acresFill: 1982-present0.97 x 106 tons

HYDROGEOCHEM
Houser’s Mill Road Landfill, Orange County, Georgia
PLAN VIEW, TOPOGRAPHY, AND PRESSURE-MONITORING LOCATIONS
32 acresFill: 1979-19930.73 x 106 tons

HYDROGEOCHEM
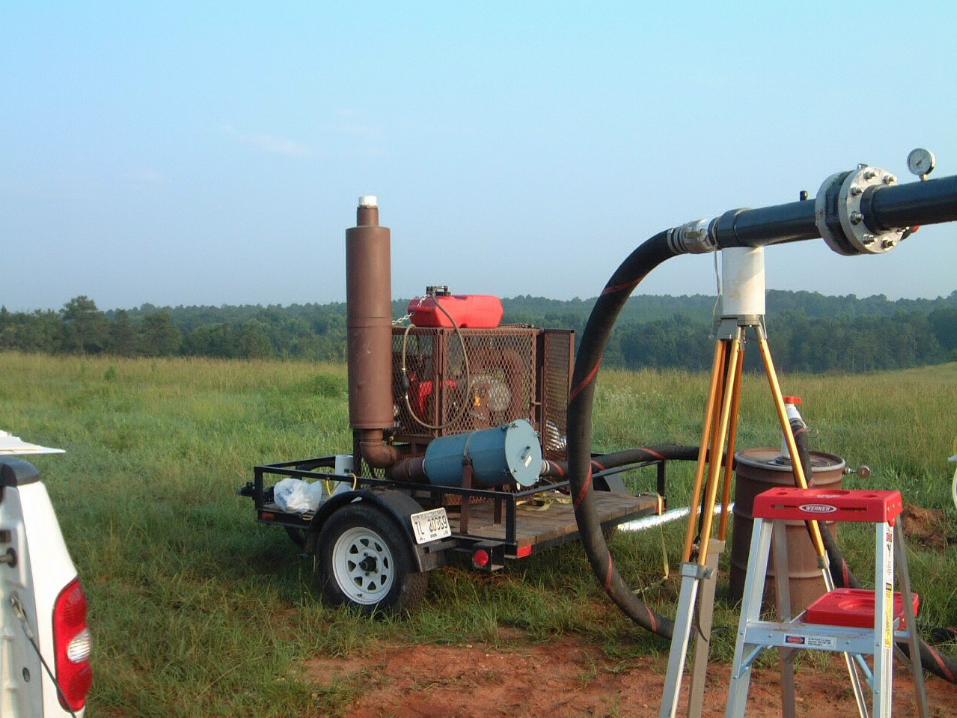
Data Acquisition System (DAS)
0.001 kPaSetraTransducer
Computer-operated16-Port ValcoSwitching Valve
Laptopand dataacquisitionsystem
Tubing toprobes, one portto atmosphere
Note: 1 kPa ~ 0.15 pounds/inch2 (psi)
HYDROGEOCHEM
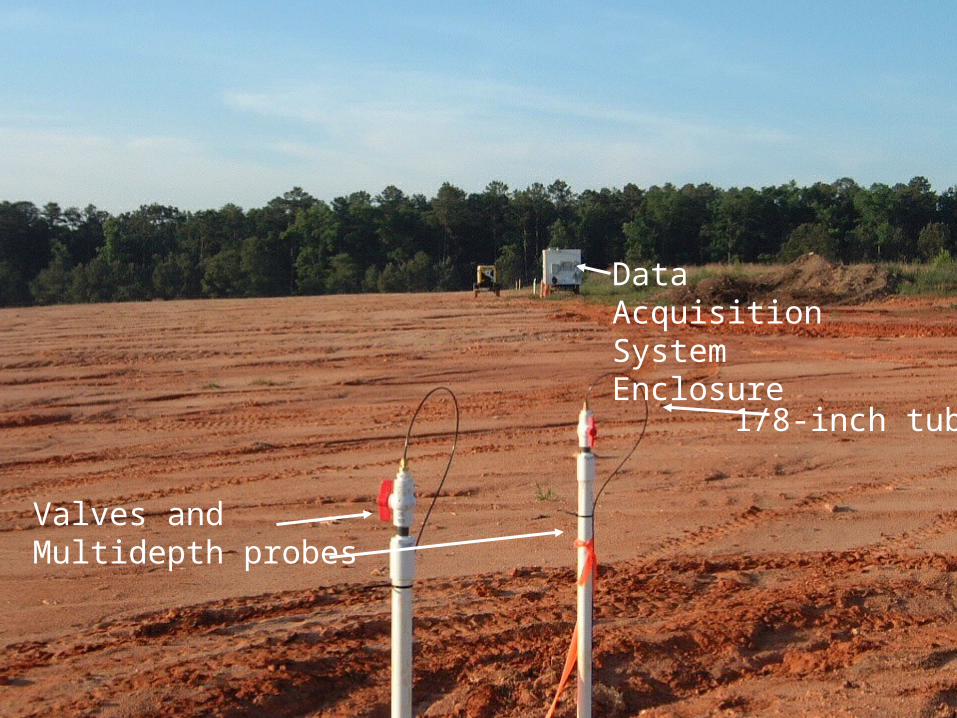
Valves and Multidepth probes
Data Acquisition System Enclosure
1/8-inch tubing

HYDROGEOCHEM
Downhole barometer/ data acquisition system18.2 mm (In Situ Inc.)
ALTERNATIVE DAS SYSTEM(Used at Houser’s Mill Road Landfill)

HYDROGEOCHEM
Example of Baro-Pneumatic Data: Phase V Cell, Probe Nest 101
14.6
14.65
14.7
14.75
14.8
14.85
14.9
0 1000 2000 3000 4000 5000 6000 7000
Elapsed Time (min)
Pre
ssu
re (
psi
)
101-70'101-30'Atm
atmospheric
101-30'
101-70'
Note higher pressure with depth
Baro-pneumatic Data Obtained at a Probe Nest at St. Landry Parish Landfill, Louisiana
Atmospheric Pressure

HYDROGEOCHEM
14.6
14.7
14.8
14.9
15.0
15.1
15.2
15.3
15.4
15.5
15.6
2000 3000 4000 5000 6000 7000 8000 9000
Elapsed Time (minutes)
Pre
ss
ure
(p
sia
)Monitoring data from 12 probes plus atmosphere
West Sector, Decatur County Landfill, Georgia
Atmospheric Pressure

HYDROGEOCHEM
14.35
14.40
14.45
14.50
14.55
14.60
14.65
0 2 4 6 8Elapsed time (days)
Pre
ss
ure
(p
sia
)
HYDROGEOCHEM, INC. FIGUREDATEAPPROVED
TS 11/30/04
BARO-PNEUMATIC PRESSURE RESPONSE IN HOUSERS MILL ROAD WEST MAIN LANDFILL
4
Elapsed Time (days)
Baro-pneumatic data from 7 probes and the atmosphere,Houser’s Mill Road Landfill, Georgia
AtmosphericPressure
SVE Test
HYDROGEOCHEM
HYDROGEOCHEM
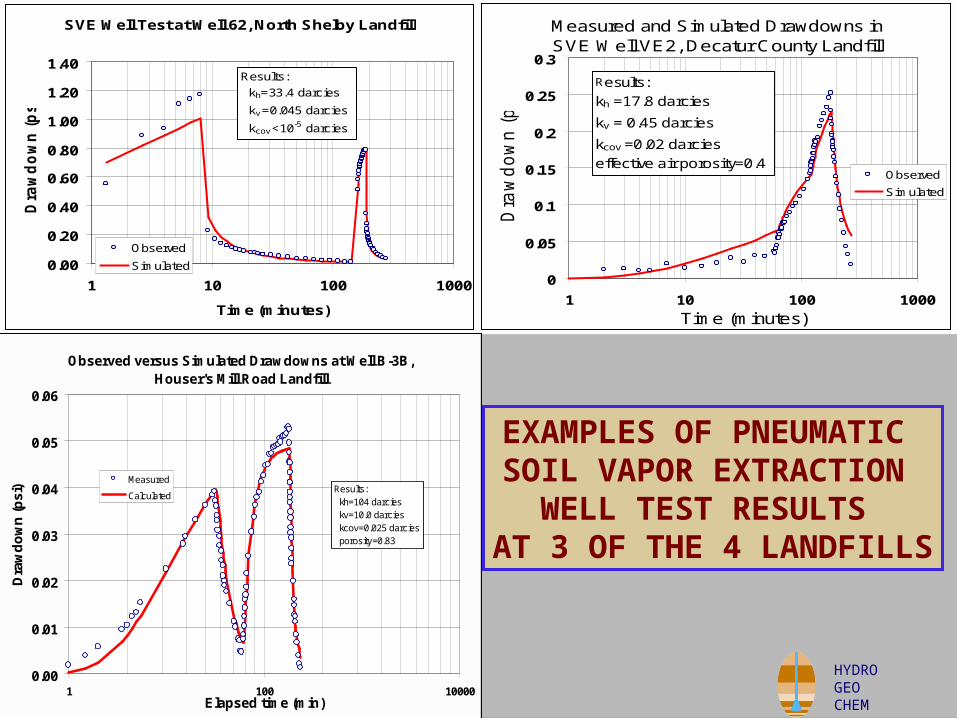
Measured and Simulated Drawdowns in SVE Well VE2, Decatur County Landfill
0
0.05
0.1
0.15
0.2
0.25
0.3
1 10 100 1000
Time (minutes)
Dra
wd
ow
n (
psi)
Observed
Simulated
Results:
kh =17.8 darcies
kv = 0.45 darcies
kcov =0.02 darcies
effective air porosity=0.4
SVE Well Test at Well 62, North Shelby Landfill
0.00
0.20
0.40
0.60
0.80
1.00
1.20
1.40
1 10 100 1000
Time (minutes)
Dra
wd
ow
n (
ps
i)
Observed
Simulated
Results:
kh=33.4 darcies
kv =0.045 darcies
kcov <10-5 darcies
Observed versus Simulated Drawdowns at Well B-3B, Houser's Mill Road Landfill
0.00
0.01
0.02
0.03
0.04
0.05
0.06
1 100 10000Elapsed time (min)
Dra
wd
ow
n (p
si)
Measured
CalculatedResults: kh=104 darcies kv=10.0 darcies kcov=0.025 darcies porosity=0.83
EXAMPLES OF PNEUMATIC SOIL VAPOR EXTRACTION
WELL TEST RESULTS AT 3 OF THE 4 LANDFILLS
HYDROGEOCHEM

HYDROGEOCHEM
Summary of Pneumatic Well Test Results
Pump Well
Obs. Well
Horizontal Permeability
kh (darcies)
Vertical Permeability
kv
(darcies)
Gas Porosity
kcov er
(darcies)Pump Well
Obs. Well
Horizontal
Permeability
kh(darcies)
Vertical Permeability
kv
(darcies)
Gas Porosity
kcov er
(darcies)
North Shelby Landfill Decatur County Landfill
EW-38 EW-38 8.9 0.01 na <10-5 VE1 B8-A 2.1 0.16 0.30 0.01
EW-46 EW-46 11.2 0.19 na <10-5 VE1 B8-B 45.0 4.50 0.70 1.0x10⁻⁴
Well 62 Well 62 33.4 0.05 na <10-5 VE1 B7-B 12.0 1.00 0.18 0.30
AVERAGE 17.8 0.08 <10-5 VE2 B3-A 30.0 0.20 0.40 1.0x10⁻³
Houser's Mill Road Landfill VE2 B3-B 17.8 0.45 0.40 0.02
SVE-1SVE-1 50.9 2.82 na 2.82 VE2 B6-A 40.0 0.10 0.30 1.0x10⁻³
SVE-2SVE-2 28.5 6.11 na 6.11 VE3 B5-B 2.2 0.52 0.10 1.3x10⁻³
SVE-3SVE-3 51.3 0.03 na 0.03 VE3 B2-A 32.6 3.22 0.09 1.0x10⁻⁴
A-1 C-1A 3.0 0.30 0.27 0.37 VE4 B4-A 3.1 1.0x10⁻³ 0.19 1.0x10⁻⁴
A-1 C-1B 8.6 0.86 0.08 0.00 VE4 B1-A 5.0 7.9x10⁻⁴ 0.03 4.8x10⁻⁷
A-2 C-4A 42.3 4.23 0.30 0.48 AVERAGE 20.9 1.43 0.22 0.03
A-2 C-4B 43.7 4.37 0.30 0.28
A-2 C-3A 200.0 20.00 0.23 0.19
A-3 B-3B 104.0 10.00 0.83 0.25
AVERAGE 59.1 5.41 0.23 1.17
= deleted from average
HYDROGEOCHEM
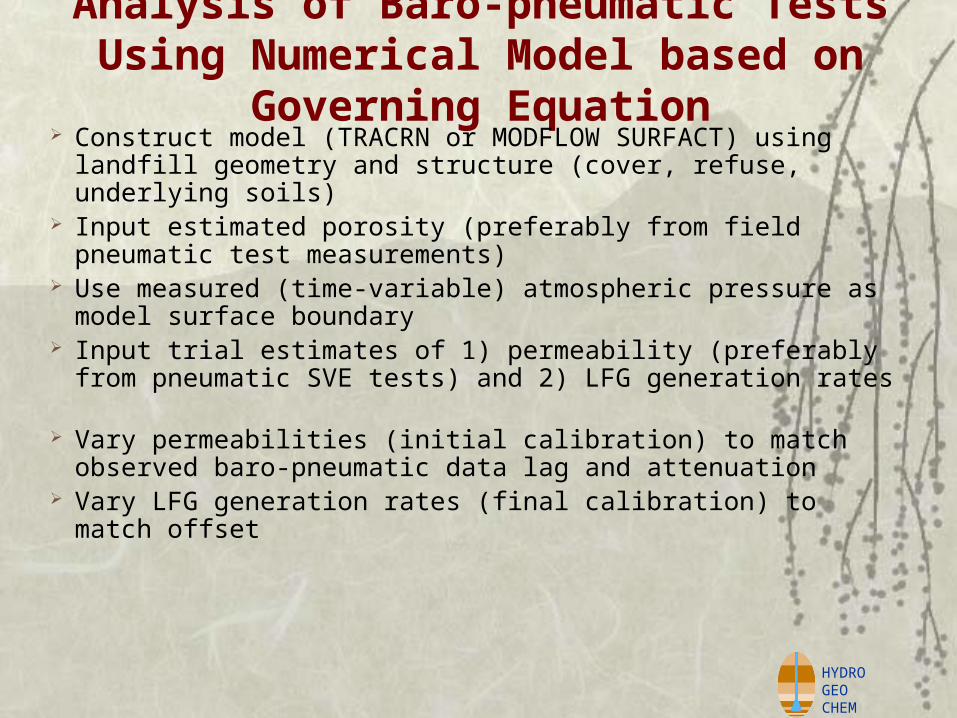
Analysis of Baro-pneumatic Tests Using Numerical Model based on Governing Equation
Construct model (TRACRN or MODFLOW SURFACT) using landfill geometry and structure (cover, refuse, underlying soils)
Input estimated porosity (preferably from field pneumatic test measurements)
Use measured (time-variable) atmospheric pressure as model surface boundary
Input trial estimates of 1) permeability (preferably from pneumatic SVE tests) and 2) LFG generation rates
Vary permeabilities (initial calibration) to match observed baro-pneumatic data lag and attenuation
Vary LFG generation rates (final calibration) to match offset

HYDROGEOCHEM
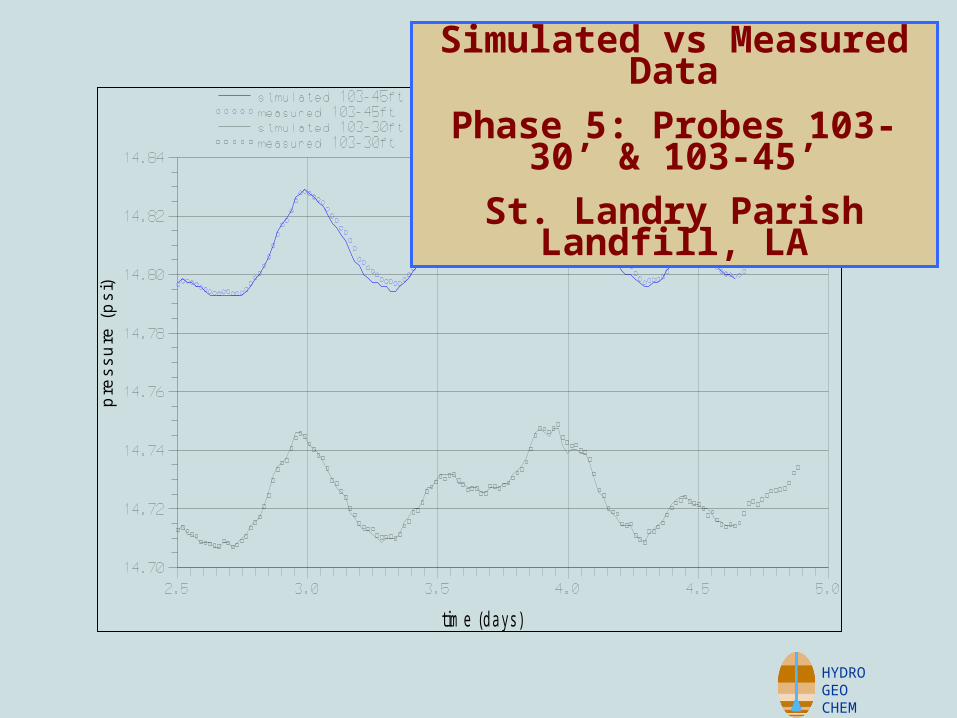
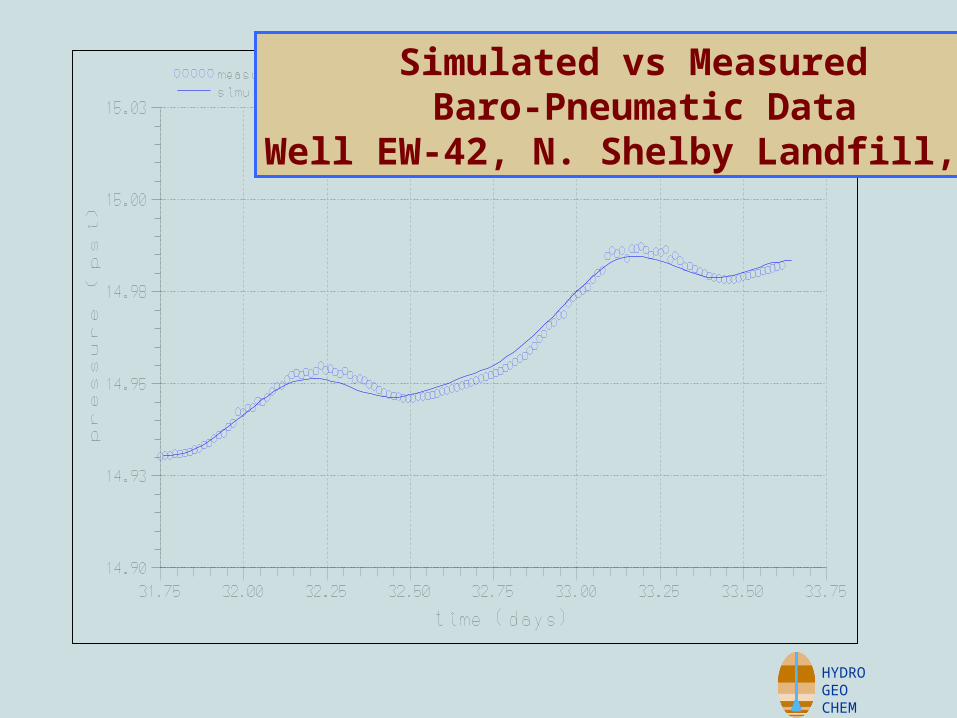
tim e (days)
pres
sure
(ps
i)Simulated vs Measured Data
Phase 5: Probe 101-30’ and 101-70’St. Landry Parish Landfill, LA
HYDROGEOCHEM
tim e (days)
pres
sure
(ps
i)
Simulated vs Measured Data
Phase 5: Probes 103-30’ & 103-45’
St. Landry Parish Landfill, LA
HYDROGEOCHEM
Simulated vs Measured Baro-Pneumatic Data
Well EW-42, N. Shelby Landfill, TN

HYDROGEOCHEM
Measured and SimulatedBaro-Pneumatic Data at
Location B-3, Decatur County Landfill, GA
HYDROGEOCHEM
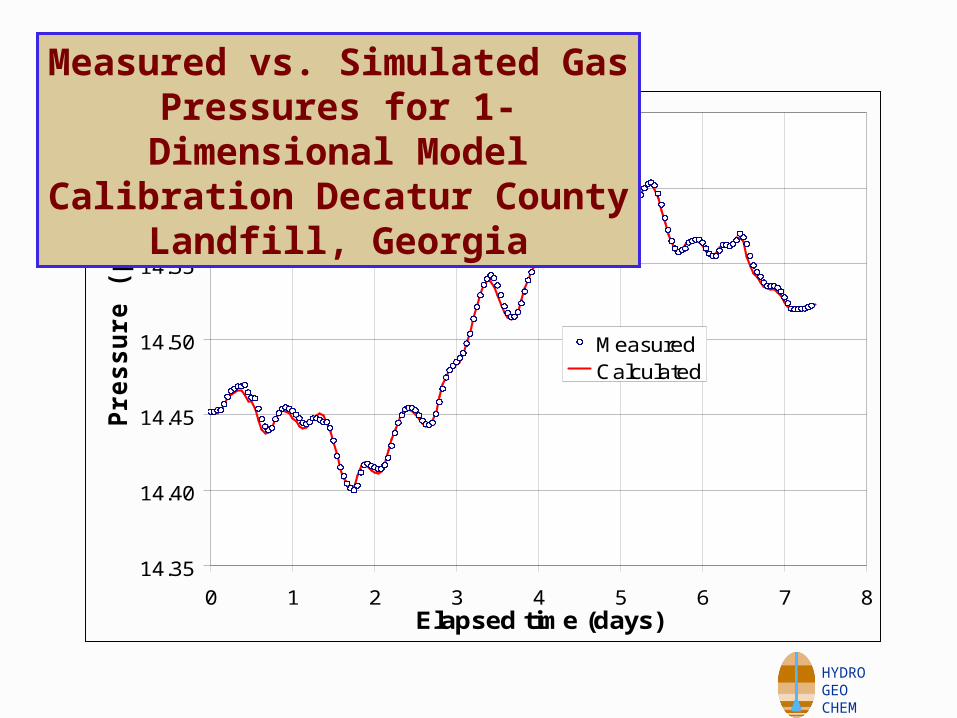
14.35
14.40
14.45
14.50
14.55
14.60
14.65
0 1 2 3 4 5 6 7 8Elapsed time (days)
Pre
ss
ure
(p
sia
)
MeasuredCalculated
Measured vs. Simulated Gas Pressures for 1-Dimensional Model Calibration
Decatur County Landfill, Georgia
HYDROGEOCHEM
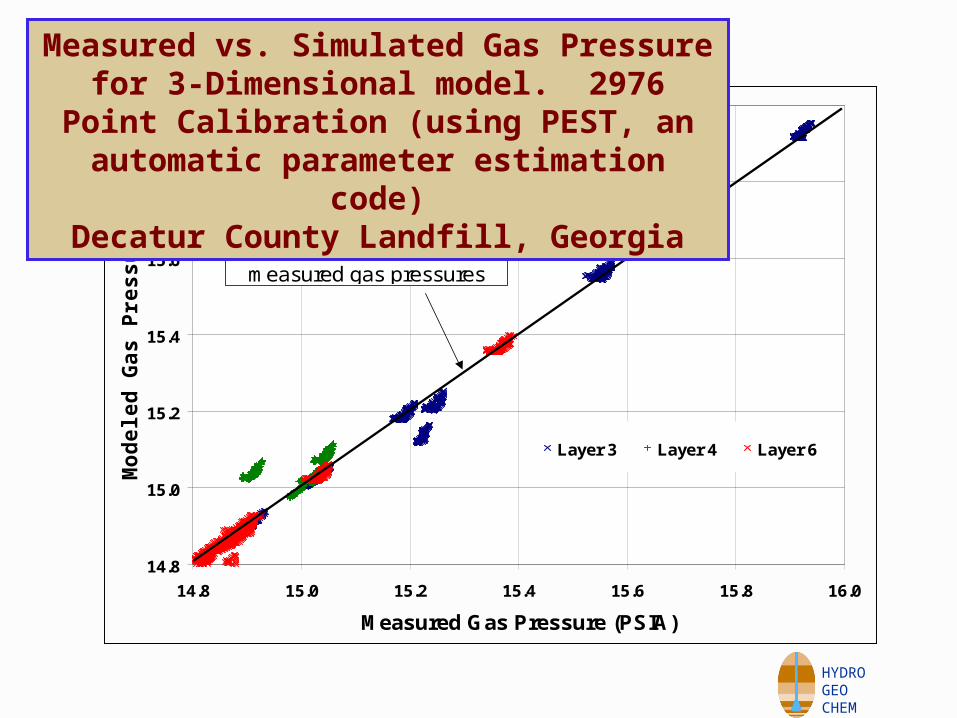
14.8
15.0
15.2
15.4
15.6
15.8
16.0
14.8 15.0 15.2 15.4 15.6 15.8 16.0
Measured Gas Pressure (PSIA)
Mo
de
led
Ga
s P
res
su
re (
PS
IA)
Layer 3 Layer 4 Layer 6
Line indicating perfect matchbetween modeled and
measured gas pressures
Measured vs. Simulated Gas Pressure for 3-Dimensional model. 2976 Point Calibration (using
PEST, an automatic parameter estimation code)Decatur County Landfill, Georgia
HYDROGEOCHEM
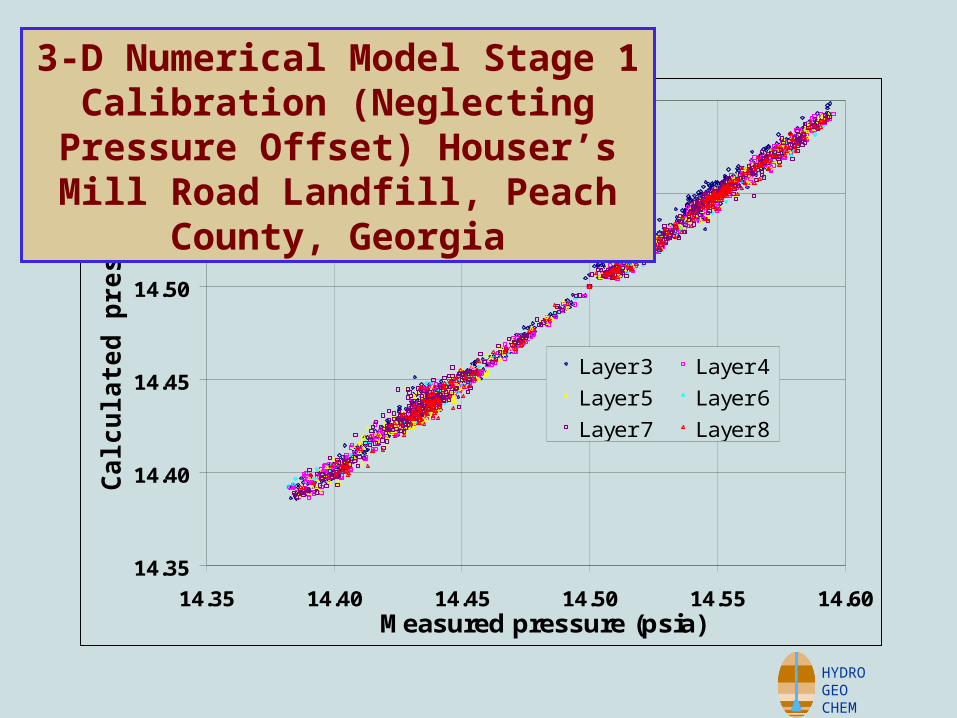
14.35
14.40
14.45
14.50
14.55
14.60
14.35 14.40 14.45 14.50 14.55 14.60Measured pressure (psia)
Ca
lcu
late
d p
res
su
re (
ps
ia)
Layer 3 Layer 4
Layer 5 Layer 6
Layer 7 Layer 8
3-D Numerical Model Stage 1 Calibration (Neglecting Pressure Offset) Houser’s Mill
Road Landfill, Peach County, Georgia

HYDROGEOCHEM
14.35
14.40
14.45
14.50
14.55
14.60
14.65
14.35 14.40 14.45 14.50 14.55 14.60 14.65
Measured pressure (psia)
Ca
lcu
late
d p
res
su
re (
ps
ia)
Layer 3 Layer 4Layer 5 Layer 6Layer 7 Layer 8
3-D Numerical Model Stage 2 Calibration (Including Pressure Offset) Houser’s Mill
Road Landfill, Peach County, Georgia
HYDROGEOCHEM
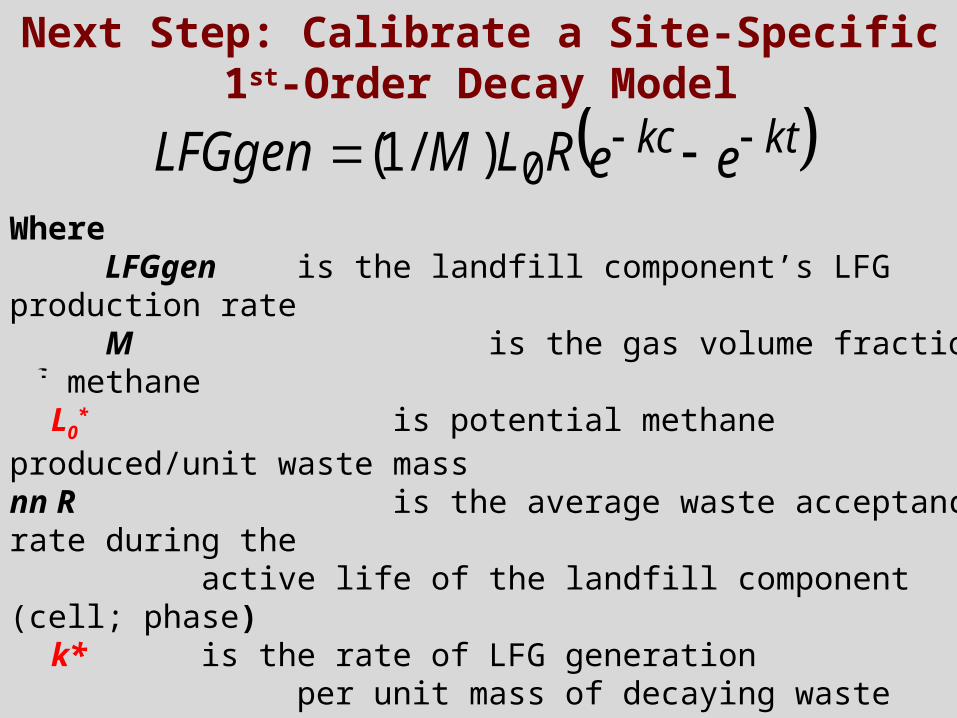
Where LFGgen is the landfill component’s LFG production rate M is the gas volume fraction of methane L0
* is potential methane produced/unit waste mass nn R is the average waste acceptance rate during the active life of the landfill component (cell; phase) k* is the rate of LFG generation
per unit mass of decaying waste t is the time since the landfill component opened c is the time since the landfill component closed * variables to be estimated
eeRLMLFGgen ktkc 0)/1(
Next Step: Calibrate a Site-Specific1st-Order Decay Model
HYDROGEOCHEM
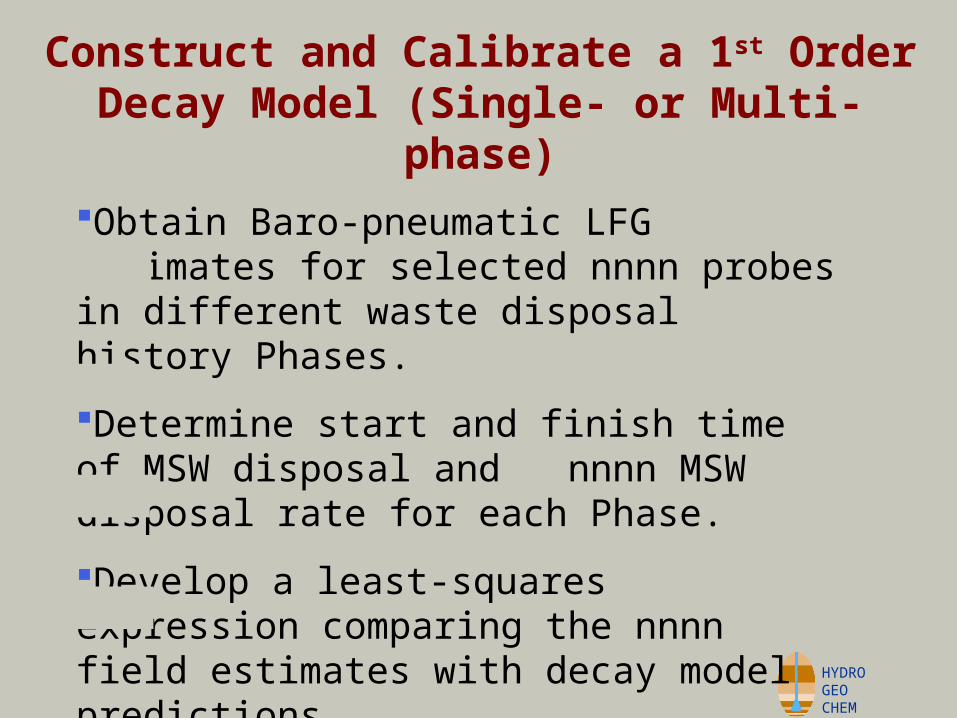
Construct and Calibrate a 1st Order Decay Model (Single- or Multi-phase)
Obtain Baro-pneumatic LFG estimates for selected nnnn probes in different waste disposal history Phases.
Determine start and finish time of MSW disposal and nnnn MSW disposal rate for each Phase.
Develop a least-squares expression comparing the nnnn field estimates with decay model predictions.
Get best-fit 1st Order Decay Equation variables by nnnn minimizing least squares

HYDROGEOCHEM
TABLE 4. PARAMETERS AND PREDICTIONS OF THE CALIBRATED 1ST-ORDER DECAY MODELS (Southeastern USA Landfills)
LandfillL o
(m3/Mg)F s
k s
(yr-1
)
k r
(yr-1
)
Methane Gas
Fraction
LFG flow Q (Baro-
pneumatic)
(ft3/min)
LFG flow Q (Calibrated
1st Order Decay Model)
Time Since Close (yrs)
Refuse, tons (at time of test)
N. Shelby Memphis TN
103 1 0.078 - 0.5 1,969 1,969 10 7.76E+06
Georgia Landfill
108 1 0.086 - 0.56 142 146 10 4.75E+05
Decatur County, GA
114.9 1 0.179 - 0.5 551 551 0-6 9.73E+05
St. Landry Parish, LA
111 1 0.2 - 0.56 785 757 active 1.06E+06
Louisiana Landfill
110 1 0.238 - 0.506 7,098 7,028 active 3.74E+06
Houser's Mill Road, GA
102 1 0.148 - 0.5 510 510 12 7.26E+05
St. Landry Parish, LA (2-
PHASE)121 0.722 0.104 0.693 0.56 785 784 active 1.06E+06
Mean 108.15 0.155% Standard Deviation
4.56 41.1
Results of the Calibrated 1st-order Decay Models
(Southeastern U.S. Landfills)
HYDROGEOCHEM
0
2,000
4,000
6,000
8,000
10,000
12,000
Time (years)
LF
G F
low
Rat
e (c
fm) AP-42 Default Values:
Lo=100 m3/Mg, k=0.04/yr
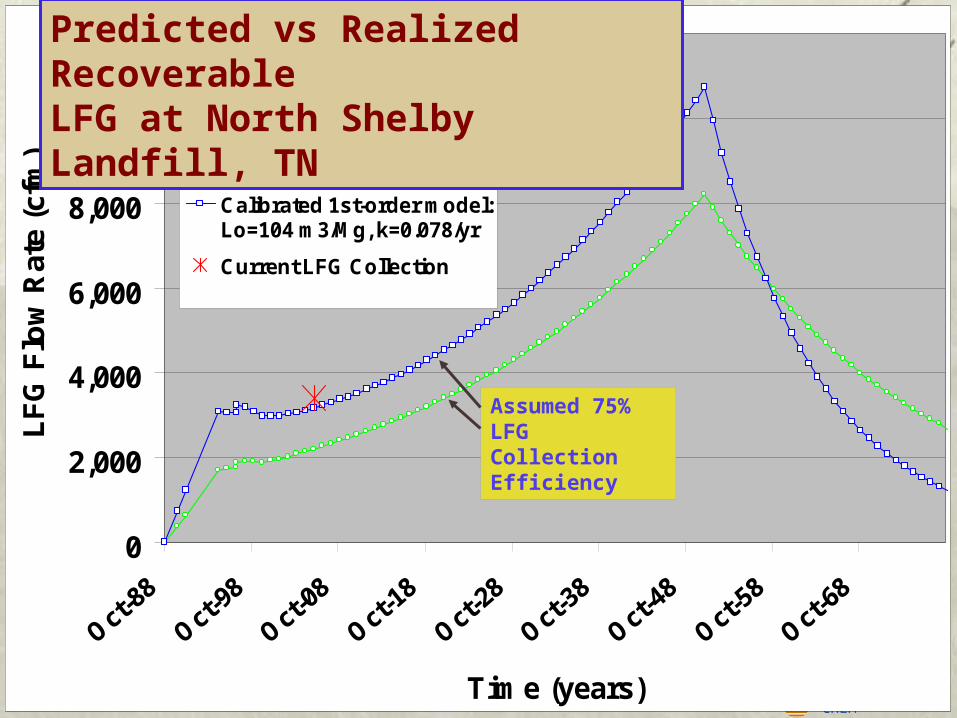
Calibrated 1st-order model:Lo=104 m3/Mg, k=0.078/yr
Current LFG Collection
Predicted vs Realized Recoverable LFG at North Shelby Landfill, TN
Assumed 75% LFG Collection Efficiency
HYDROGEOCHEM
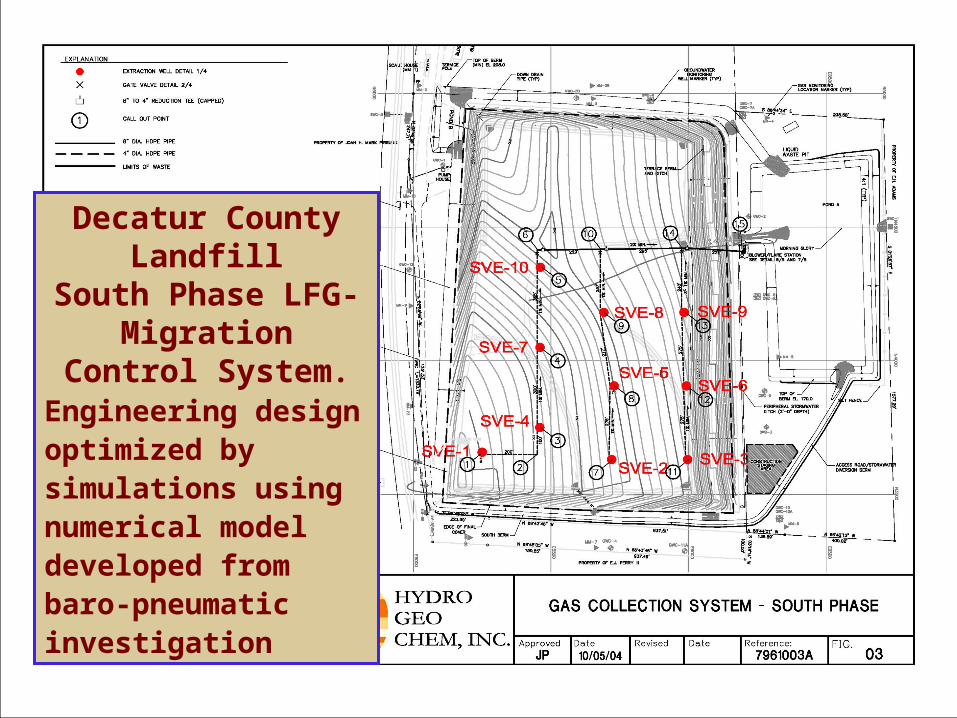
Decatur County LandfillSouth Phase LFG- Migration Control
System.Engineering design optimized by simulations using numerical model developed from baro-pneumatic investigation

HYDROGEOCHEM
UncontrolledArea
(Currently Filling)
Controlled(Closed)
Area
Per
cen
t L
FG
Co
nce
ntr
ati
on
Simulated Steady-state Soil LFG Distribution in the Vicinity of the Decatur County Landfill equipped with the South Phase LFG Control System
N
HYDROGEOCHEM
Results The baro-pneumatic method shows great promise:
Quantitative estimate of pneumatic properties including LFG generation and gas permeabilities
Provides important insights into landfill behaviorProduces numerical model suitable for engineering
design, optimization, performance simulation
Allows calibration of site-specific 1st-order decay models, reducing risk of mis-assessing
future LFG generation.

HYDROGEOCHEM
Conclusions
The consistency and plausibility of the results support the validity of the baro-pneumatic method :
1. Excellent model fits to data in numerical calibration
2. Narrow range and reasonable values for calibrated model L0
3. LFG collection data (where available) confirm results

HYDROGEOCHEM
Recommendation
Questions regarding the baro-pneumatic method should be addressed, and resolved, by careful, scientific tests at one or more adequately monitored landfills.
Success of such tests would Accelerate acceptance by the Landfill IndustryHelp overcome regulatory inertiaAllow energy-related and environmental benefits of a
validated baro-pneumatic method to be more quickly realized