hydraulic laboratory report hl-2004-03 elwha river · pdf filehydraulic laboratory report...
TRANSCRIPT

Hydraulic Laboratory Report HL-2004-03
Elwha River Surface-Water Intake Structure Port Angeles, Washington Physical Model Study
U.S. Department of the Interior Bureau of Reclamation Technical Service Center Water Resources Research Laboratory Denver, Colorado April 2005

U.S. Department of the Interior Bureau of Reclamation Technical Service Center Water Resources Research Laboratory Denver, Colorado April 2005
Hydraulic Laboratory Report HL-2004-03
Elwha River Surface-Water Intake Structure Port Angeles, Washington Physical Model Study by Brent Mefford

Mission S
The mission of the Department of the Ito our Nation's natural and cultural herto Indian Tribes and our commitments
_____________ The mission of the Bureau of Reclamawater and related resources in an envirmanner in the interest of the American
Acknowledgments The author would like to thank Mr. Rudy Campbellmanagement and testing. Mr. Steve Higinbotham, construction of model features. Mr. Robert HamiltoRandle (D-8540) and Ms. Jennifer Bountry (D-8540reviewed by Bob Einhellig (D-8560). Hydraulic Laboratory Reports The Hydraulic Laboratory Report series is producedResearch Laboratory (Mail Code D-8560), PO Boxof publication, this report was also made available o
http://www.usbr.gov/pmts/hydra Disclaimer No warranty is expressed or implied regarding the ucontained in this report. References to commercialReclamation and may not be used for advertising or
tatements
nterior is to protect and provide access itage and honor our trust responsibilities to island communities. ______________
tion is to manage, develop, and protect onmentally and economically sound public.
for assisting with model design, construction URS Corporation, provided prototype design data for n (PN-6309), Tom Hepler (D-8130), Timothy ) provided technical support. This report was peer
by the Bureau of Reclamation’s Water Resources 25007, Denver, Colorado 80225-0007. At the time nline at
ulics_lab/pubs/HL/HL-2004-03.pdf
sefulness or completeness of the information products do not imply endorsement by the Bureau of promotional purposes.

Contents
Page Summary ..................................................................................................................1 Background..............................................................................................................2 Physical Model.........................................................................................................3 Model Objective.......................................................................................................3 Model Scaling ..........................................................................................................3 Sediment Modeling............................................................................................5 River Sediment.............................................................................................5 Model Sediment ...........................................................................................6 Bed Load......................................................................................................6 Time Scale for Sedimentation Process ........................................................7 Model Operation ......................................................................................................7 Model Flow Boundaries.....................................................................................8 Diversion Structure ..................................................................................................8 Site Selection .....................................................................................................8 Diversion Dam and Intake Design.....................................................................9 Moveable Bed Sediment Tests.................................................................................9 Steady-State Test ...............................................................................................9 Results........................................................................................................10 Simulated Flood Hydrograph Tests ...........................................................10 Flow Hydrograph Test Results, 6,500 ft3/s Peak Flow .............................11 Flow Hydrograph Test Results, 10,000 ft3/s Peak Flow ...........................11 Flow Hydrograph Test Results, 14,400 ft3/s Peak Flow ...........................12 Intake Modifications ..............................................................................................12 Modified Intake Flow Uniformity Tests ..........................................................13 Results........................................................................................................13 Addition of Upstream Guide Wall.............................................................14 Intake Sediment Sluice ..............................................................................14 Rock Ramp Modifications .....................................................................................15 Bibliography ..........................................................................................................16 Photographs............................................................................................................18 Figures....................................................................................................................34 Photographs Photograph Page 1 View looking from the right bank across the existing Elwha surface-water intake diversion dam. .......................................................19 2 View of existing Elwha surface-water intake structure. ............................19
Elwha River Surface-Water Intake Structure i

Photograph Page 3 View of model construction showing intake structure and downstream rock-ramp ............................................................................................20 4 View looking upstream of Elwha surface-water intake model. .................20 5 Sediment feeders used to regulate bed load delivered to the model. .........21 6 View of model during a steady-state flow of 4,000 ft3/s. ..........................22 7 View of initial sediment deposit formation upstream of the dam during early stages of the alluvial bed building process. ........................23 8 View of flow and bed sediment passing the front of the intake structure...................................................................................................23 9 View looking down on flow adjacent to intake structure. Red dye was injected upstream and inline with the intake. Dye shows flow separating off the upstream face of the structure and then entering the intake downstream ..............................................................24 10 View of bed deposits upstream of dam crest following 4,000 ft3/s steady-state flow. ....................................................................................24 11 View of string contours of sediment deposited upstream of dam following steady-state flow of 4,000 ft3/s. ..............................................25 12 View of sediment deposited upstream of dam following steady-state flow of 4,000 ft3/s. ..................................................................................25 13 View of bed material moving across the dam crest near the left bank during a flow of 6,500 ft3/s. ....................................................................26 14 View of bed sediment moving across dam crest and down the low-flow channel during peak flow conditions. .....................................27 15 View of string contours of sediment deposited upstream of dam following 6,500 ft3/s peak flow hydrograph. ..........................................27 16 View of 10,000 ft3/s river flow showing transport of bed sediments across the dam crest. ...............................................................................28 17 Close up view of flow and bed sediment moving past the front of the intake structure........................................................................................29 18 View looking down on the dam crest following the 10,000 ft3/s hydrograph test. Flow shown is 2,000 ft3/s............................................29 19 View looking down of sediment deposits upstream of the dam crest following the 10,000 ft3/s hydrograph test. ....................................30 20 View of 14,400 ft3/s flow transporting sediment over the dam. ................31 21 View during descending flow following the 14,400 ft3/s peak flow. Flow shown is 7,000 ft3/s........................................................................32 22 View of sediment deposits upstream of the dam following passage of a 14,400 ft3/s peak flow hydrograph. ......................................................32 23 View of the upstream guide wall modification to the intake structure. .....33 24 View looking downstream of rock ramp with mid-channel boulders shown in black ........................................................................................33
Elwha River Surface-Water Intake Structure ii

Figures Figure Page 1 Plan view of hydraulic model showing river topography and rock-ramp diversion dam. .......................................................................35 2 Contour map of Elwha River near surface-water diversion dam...............36 3 Comparison of particle settling velocity for sand and lignite coal. ...........37 4 Sediment scaling relationships based on critical shear and particle fall velocity, 12 mm diameter particle. .........................................................38 5 Sediment scaling relationships based on critical shear and particle fall velocity, 6.1 mm diameter particle. ..................................................39 6 Sediment scaling relationships based on critical shear and particle fall velocity, 1.0 mm diameter particle. ..................................................40 7 Sediment scaling relationships based on critical shear and particle fall velocity, 1.0 mm diameter particle. ..................................................41 8 Sediment scaling relationships based on critical shear and particle fall velocity, 0.5 mm diameter particle. ..................................................42 9 Gradation of sand and small gravel material in Lake Mills compared to the material gradation used in the model. ...........................................43 10 Velocity vector field upstream of existing diversion measured on June 3, 2003. ...........................................................................................44 11 Plan and sections of surface-water diversion intake structure. ..................45 12 Plot of river stage measured in the model upstream of the dam (sta. 18350), at the downstream end of the rock-ramp (sta.17886) and downstream near the bridge crossing (sta. 17373)...........................46 13 Hec-Ras generated comparison river stage between the existing diversion dam and the proposed diversion dam......................................46 14 Plan and sections of initial intake structure. ..............................................47 15 Map showing model test results of predicted sediment deposition following steady-state river flows of 4,000 ft3/s. ...................................48 16 6,500 ft3/s peak flow hydrograph simulated in model tests. .....................48 17 10,000 ft3/s peak flow hydrograph simulated in model tests. ...................49 18 14,470 ft3/s peak flow hydrograph simulated in model tests. ...................49 19 Sediment feed rate used in the model scaled to prototype.........................50 20 Map showing model test results of sediment deposition following a normalized flood hydrograph of 6,500 ft3/s peak flow. .........................50 21 Map showing model test results of sediment deposition following a normalized flood hydrograph of 10,000 ft3/s peak flow. .......................51 22 Map showing model test results of sediment deposition following a normalized flood hydrograph of 14,400 ft3/s peak flow. .......................51 23 Plan and sections of modified intake structure. .........................................52 24 Velocity vectors measured in front of the intake trashracks during 1,600 ft3/s river flow and 75 ft3/s diversion flow. .................................54 25 Velocity vectors measured in front of the intake trashracks during 1,600 ft3/s river flow and 150 ft3/s diversion flow. ...............................54
Elwha River Surface-Water Intake Structure iii

Figure Page 26 Plot of flow velocities given in s 24 and 25 expressed as sweeping (parallel to trashrack) and approach (normal to trashrack) velocity components. ............................................................................................55 27 Velocity vectors measured in front of the intake trashracks during 3,000 ft3/s river flow and 75 ft3/s diversion flow. .................................55 28 Velocity vectors measured in front of the intake trashracks during 3,000 ft3/s river flow and 150 ft3/s diversion flow. ...............................56 29 Plot of flow velocities given in s 27 and 28 expressed as sweeping (parallel to trashrack) and approach (normal to trashrack) velocity components. ............................................................................................56 30 Velocity vectors measured in front of the intake trashracks during 5,000 ft3/s river flow and 75 ft3/s diversion flow. .................................57 31 Velocity vectors measured in front of the intake trashracks during 5,000 ft3/s river flow and 150 ft3/s diversion flow. ...............................57 32 Plot of flow velocities given in s 30 and 31 expressed as sweeping (parallel to trashrack) and approach (normal to trashrack) velocity components. ............................................................................................58 33 Velocity vectors measured in front of the intake trashracks with the upstream guide wall during 1,600 ft3/s river flow and 75 ft3/s diversion flow. ........................................................................................58 34 Velocity vectors measured in front of the intake trashracks with the upstream guide wall during 1,600 ft3/s river flow and 150 ft3/s diversion flow. ........................................................................................59 35 Plot of flow velocities given in s 33 and 34 expressed as sweeping (parallel to trashrack) and approach (normal to trashrack) velocity components. ............................................................................................59 36 Velocity vectors measured in front of the intake trashracks with the upstream guide wall during 3,000 ft3/s river flow and 75 ft3/s diversion flow. ........................................................................................60 37 Velocity vectors measured in front of the intake trashracks with the upstream guide wall during 3,000 ft3/s river flow and 150 ft3/s diversion flow. ........................................................................................60 38 Plot of flow velocities given in s 36 and 37 expressed as sweeping (parallel to trashrack) and approach (normal to trashrack) velocity components. ............................................................................................61 39 Velocity vectors measured in front of the intake trashracks with the upstream guide wall during 5,000 ft3/s river flow and 75 ft3/s diversion flow. ........................................................................................61 40 Velocity vectors measured in front of the intake trashracks with the upstream guide wall during 5,000 ft3/s river flow and 150 ft3/s diversion flow. ........................................................................................61 41 Plot of flow velocities given in s 39 and 40 expressed as sweeping (parallel to trashrack) and approach (normal to trashrack) velocity components. ............................................................................................62 Elwha River Surface-Water Intake Structure iv

Elwha River Surface-Water Intake Structure v
Figure Page 42 Plot of flow velocity components measured in front of the trashrack comparing open and closed conditions for the surface fish bypass at a river flow of 5,000 ft3/s....................................................................62 43 Initial rock ramp concept design with horizontal bench between the low flow channel and left bank. ........................................................63 44 Cross section showing modified rock ramp with slope from the low flow channel to the left river bank. .........................................................63 45 Plot of average flow velocity in the thalweg channel and mid-channel boulder field. ...........................................................................................64

Elwyha River Surface-Water Intake Structure
Physical Model Study
Summary This report presents the results of a Bureau of Reclamation hydraulic model study of the proposed Elwha Surface-water Intake Structure. A 1:20 Froude-scale model of the proposed facility was tested to determine the interaction of flows and bed load sediments near the facility during and following dam removal. The location of the diversion was moved 180 ft upstream to a location of strong right bank flow and approximately where the natural thalweg crosses from the right to the left bank. The existing rock rubble diversion dam was replaced by rock-ramp weir with a crest elevation of 69.0 and a 1.5 percent slope. Near the right bank, a 12-ft–wide low-flow channel passed through the dam at elevation 66.5 ft. The new diversion intake was located upstream of the weir crest on the right bank. The intake sill was set at elevation 67.0 ft. For the model, granular coal was used to simulate bed load sediment. Sediment movement and velocities in front of the intake were monitored during the study. Model tests focused on 150 ft3/s diversion flow for river flows between 500 ft3/s and 5,000 ft3/s and simulated flood hydrographs with peak flows of 6,500 ft3/s, 10,000 ft3/s and 14,400 ft3/s. The location and orientation of the proposed dam site were found favorable for excluding bed load sediments. Upstream of the dam, bed material deposits were heaviest along the left bank. Major deposition influenced by the dam extended about 700 ft upstream totaling an estimated 8,000 cubic yards of material. During river flows in excess of about 3,000 ft3/s, bed sediments passed over the dam crest largely to the left of the dam centerline. To a lesser degree, bed sediments were carried in front of the intake structure and passed downstream through the low-flow channel. The model was tested with a fixed intake sill elevation of 67.0 ft to observe worst-case conditions for sediment entrainment. An adjustable sill is proposed for the prototype. Tests of the initial intake design revealed entrainment of bed material was enhanced by the action of flow separating off the upstream corner of the intake structure. Turbulent flow suspended bed material into the water column allowing its entrainment over the intake sill. This was corrected by adding a guide wall upstream of the intake that eliminated flow separation near the intake. The intake design includes a sluiceway flume mounted in the vault on the inside of the intake sill wall. The flume runs along the wall beneath the intake sill and slopes upstream to downstream. The flume connects to a 30-inch diameter pipe that passes through the downstream wall of the vault. The pipe follows a 1 percent grade for a distance of 300 ft before intercepting the surface of the rock-ramp. The sediment flume is designed to trap large sand and gravel material entrained into the intake. Opening the sluice pipe was effective in cleaning the downstream one-third of the sediment flume. The upstream two thirds will require periodic mechanical cleaning.
1

Elwyha River Surface-Water Intake Structure Strong eddy patterns were noted in the intake vault. These patterns were felt to present the potential for disorientation and long residence times for surface oriented fish entering the intake vault. This problem was addressed by adding an opening in the downstream wall of the intake vault to create a surface escape route with a strong flushing flow. The invert of the portal was set at elevation 71.0 ft to prevent impacting low-river flow diversions. Flow through the outlet portal was regulated by a weir gate mounted on the inside wall. Flow conditions on the rock-ramp were not investigated in detail due to the shallow-flow in the model. Of interest are the placements of near-bank boulder fields on the rock-ramp to reduce near-bank flow velocity. In the model, boulders were placed along the right bank of the low-flow channel to strengthen the influence of bank roughness and therefore create a stronger low velocity buffer along the bank. Background The Elwha surface-water diversion is located on the right bank of the Elwha River near Port Angles, Washington, at approximately river mile (RM) 3.4. The diversion supplies municipal water to the town of Port Angles, industrial water for a pulp mill and a state fish facility. The maximum diversion is 150 ft3/s. The existing diversion dam is a rock weir with a low notch located near the center (see photograph 1). The diversion dam is considered a partial barrier to upstream fish movement. The diversion intake is a concrete box structure with trashracks (see photograph 2). The intake is located near the right abutment of the rock dam. Flow diverted through the intake passes through a horseshoe tunnel to a downstream open-channel flow-control structure. The focus of this study is the hydraulic design of a new water diversion dam and intake structure. Replacement of the water diversion structure is a sub-project of a major river and anadromous fishery restoration project focused on the removal of Glines and Elwha Dams, two large dams located upstream of the diversion. Removal of the upstream dams is expected to release significant sediment to the river for several years. Both physical and numerical models of the river and new diversion were used to evaluate the design of the diversion with respect to sediment entrainment/exclusion and fish passage and protection. This report covers physical modeling of the diversion conducted at the Bureau of Reclamation’s Water Resources Research Laboratory (WRRL) in Denver, Colorado. The physical model study provided design support to URS Corp, the principle designer for the project.
2

Elwyha River Surface-Water Intake Structure
Physical Model A 1:20 geometric-scale physical model of the river and diversion dam facility was constructed at the WRRL (see photograph 3). The extent of the model is shown in figure 1. Fish screen facilities are located off-channel and were not included in this study. River stationing referenced in this report is based on stationing established by the Corp of Engineers HEC-RAS flood plain modeling conducted as part of the dam removal project. The model represented the bankfull river channel between RM 3.6 (HEC station 19,000) and RM 3.26 (HEC station 17,225). Generally, topography between elevations 55 and 80 ft was modeled. Some areas along the left bank that failed to reach elevation 80 for substantial distances from the river were not contained within the model. These areas are not expected to convey significant overbank flow or affect sediment movement patterns. The model topography allowed river flows up to the 2-year flood of 14,470 ft3/s to be modeled. The existing riverbed was modeled as hard topography using URS surface survey data and USBR river bathymetry data obtained in June 2003 (figure 2). The existing rock-boulder dam and downstream scour hole were not modeled. In the model, these features were replaced by the proposed diversion structure. Model Objective Objectives of the model study were to evaluate and optimize the design of the major components of the diversion dam and intake structure with respect to river flow, intake flow, sediment entrainment and exclusion and fish protection and passage. These objectives were pursued through the following study tasks:
• Investigate the position and orientation of the diversion dam and diversion intake structure in relation to flow and bed sediment movement.
• Investigate the movement and deposition of bed load sediment within the
backwater influence of the diversion dam. • Evaluate sediment deposition and sluicing within the intake structure. • Investigate intake structure hydraulics with respect to fish entrainment and
passage.
Model Scaling Physical model scaling is used to create similitude between model and prototype of major forces controlling the physical processes being studied. Not all forces can be properly scaled simultaneously. Generally, open channel flow problems are modeled based on a Froude number relationship. The Froude number relates
3

Elwyha River Surface-Water Intake Structure inertia and gravity forces expressed as, gdvFr /= (v = flow velocity, g = acceleration of gravity and d = flow depth). Similitude between model and prototype is achieved when the Froude number in the model and prototype are the same. By Froude scale the following relationships apply to the 1:20 geometric scale chosen:
788,120
8920
47.420
20
5.2/
5.1/
/
/
==
==
==
=
mp
mp
mp
mp
Q
q
V
L
where: L is length or depth, V is velocity, q is discharge per unit width, Q is discharge, and p/m refers to a ratio of prototype to model Forces not related in the Froude number, such as surface tension and viscosity do not scale by the Froude relationship. The effect on model similitude of distorting these forces must be evaluated separately. Surface tension can normally be neglected unless very shallow-flows are anticipated in the model. Viscosity can be neglected when flow in the model and prototype is fully turbulent. The transition between laminar flow (viscous flow) and turbulent flow is defined by a relationship of viscous forces to inertial forces referred to as the Reynolds number, ν/re VdR = (V = average velocity, dr = hydraulic radius and ν = kinematic viscosity). Turbulent flow occurs when the Reynolds number is larger than about 2000. For physical models of natural channels, a Reynolds number threshold of 5000 is often used due to the high variability of flow velocity and depth. Based on Froude scaling, the Reynolds number in the model will be distorted by the Froude scale ratio to the exponent 1.5. The 20:1 geometric scale selected for the model yields a distortion of the model Reynolds number of 89.4. Therefore, model Reynolds numbers are equal to prototype values divided by 89.4. Model Reynolds numbers were determined using Hec-Ras flow modeling to predict average flow velocity and hydraulic depth as a function of river flow for a number of channel cross-sections adjacent to the new diversion structure. For each cross-section prototype Reynolds numbers were calculated and divided by the model distortion factor to determine model values. Reynolds number did not vary greatly for different river cross-sections upstream of the dam. The values presented in Table 1 represent average Re between stations 18322 and 19000. Model Reynolds numbers are greater than 2000 for modeled river flows above 500 ft3/s and greater than 5000 for modeled river flows above about 1000 ft3/s.
ee
4
Elwyha River Surface-Water Intake Structure
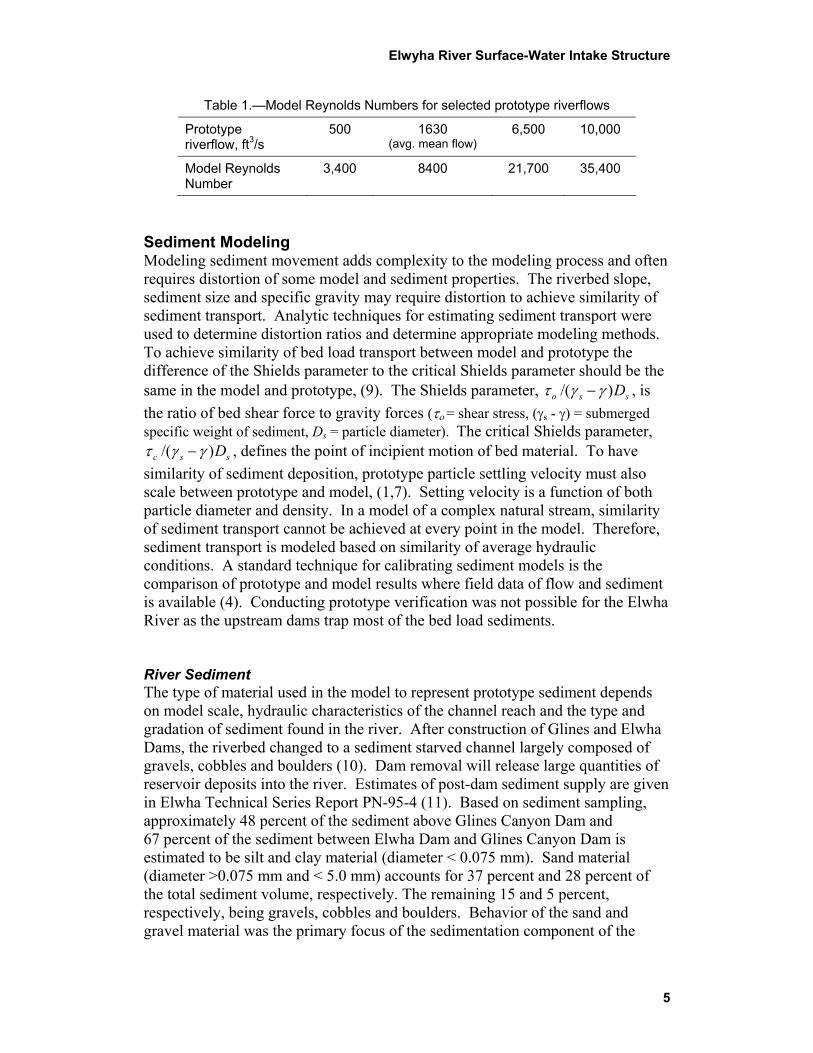
Table 1.—Model Reynolds Numbers for selected prototype riverflows
Prototype riverflow, ft3/s
500 1630 (avg. mean flow)
6,500 10,000
Model Reynolds Number
3,400 8400 21,700 35,400
Sediment Modeling Modeling sediment movement adds complexity to the modeling process and often requires distortion of some model and sediment properties. The riverbed slope, sediment size and specific gravity may require distortion to achieve similarity of sediment transport. Analytic techniques for estimating sediment transport were used to determine distortion ratios and determine appropriate modeling methods. To achieve similarity of bed load transport between model and prototype the difference of the Shields parameter to the critical Shields parameter should be the same in the model and prototype, (9). The Shields parameter, sso D)/( γγτ − , is the ratio of bed shear force to gravity forces (το = shear stress, (γs - γ) = submerged specific weight of sediment, Ds = particle diameter). The critical Shields parameter,
ssc D)/( γγτ − , defines the point of incipient motion of bed material. To have similarity of sediment deposition, prototype particle settling velocity must also scale between prototype and model, (1,7). Setting velocity is a function of both particle diameter and density. In a model of a complex natural stream, similarity of sediment transport cannot be achieved at every point in the model. Therefore, sediment transport is modeled based on similarity of average hydraulic conditions. A standard technique for calibrating sediment models is the comparison of prototype and model results where field data of flow and sediment is available (4). Conducting prototype verification was not possible for the Elwha River as the upstream dams trap most of the bed load sediments. River Sediment The type of material used in the model to represent prototype sediment depends on model scale, hydraulic characteristics of the channel reach and the type and gradation of sediment found in the river. After construction of Glines and Elwha Dams, the riverbed changed to a sediment starved channel largely composed of gravels, cobbles and boulders (10). Dam removal will release large quantities of reservoir deposits into the river. Estimates of post-dam sediment supply are given in Elwha Technical Series Report PN-95-4 (11). Based on sediment sampling, approximately 48 percent of the sediment above Glines Canyon Dam and 67 percent of the sediment between Elwha Dam and Glines Canyon Dam is estimated to be silt and clay material (diameter < 0.075 mm). Sand material (diameter >0.075 mm and < 5.0 mm) accounts for 37 percent and 28 percent of the total sediment volume, respectively. The remaining 15 and 5 percent, respectively, being gravels, cobbles and boulders. Behavior of the sand and gravel material was the primary focus of the sedimentation component of the
5

Elwyha River Surface-Water Intake Structure model study. Silt and clay material was not represented in the model. The river will likely transport this material as suspended load. Removal of suspended load from the diverted flow will be accomplished through the construction of a new water treatment plant located downstream of the intake and fish screen facility. Model Sediment Coal was selected to represent bed sediments in the model. Coal is often used in sediment modeling to represent granitic sands and gravels. The density of lignite coal is about one-half that of sand and it has a settling velocity ranging from 40 to 45 percent that of sand (figure 3). Using a less dense material for sediment allows a larger average gradation of material to be used in the model. Shield’s diagrams of dimensionless shear versus the particle Reynolds number for model and prototype material are given in figures 4-8. Each plot presents bed material scaling for a given particle size covering a range of hydraulic radii typical of the Elwha River near the water diversion. Prototype material larger than about 1.0 mm diameter scales approximately by Lp/m = 3 with no distortion of energy slope. The settling velocity relationship of particles smaller than about 1.0 mm differs from larger particles. Figure 8 shows the sediment scale relationships applied to a 0.5mm prototype particle. Although the shear relationships model according to that established for larger particle sizes, the actual settling velocity of the model particle is only about thirty percent that of the scaled prototype settling velocity. This means, small sands suspended in the prototype will settle to the bed faster than a simulated particle in the model. Therefore, the model can be viewed conservative for evaluating entrained bed load. A comparison of the grain size distribution for Lake Mills behind Glines Dam (sands and fine gravels only) and crushed coal for the model is given in figure 9. A plot of the prototype distribution scaled by the sediment grain size relationships presented above is also shown. Due to the large amounts of model sediment needed for the model, the crushed coal grain size distribution was used and no selective sieving of material was conducted. Bed Load Shen (1971) recommends scaling bed load for sand and gravel dominated systems using the Meyer-Peter and Mueller (1948) bed load equation. The bed load per second per unit width is expressed as:
2/1
2/12/32/32/3 )()
)((8
γγγ
γγττ gk
kb s
s
cl −
−−
= (1)
where bl =bed load, k=grain diameter and g = acceleration of gravity
6

Elwyha River Surface-Water Intake Structure
The ratio of bed load between prototype and model can then be expressed as:
2/3
2/3
2/3
2/3
2/3
2/3
)(
)(
)(
)(
m
p
ms
ps
mc
pc
ml
pl
k
k
TT
TTbb
γγ
γγ
−
−
−
−= (2)
where, T –Tc = Shields parameter – critical Shields parameter
Given the p/m ratio of T –Tc is one, the specific weight of coal is 1.29 and a particle geometric scale ratio of 3, bed load per unit width scales by the factor,
703129.1165.2 2/3
2/3
=
−−
=
mpwidthunit
loadbed (3)
Time Scale for Sedimentation Process Based on Froude scale, time scales by the square root of the length scale. This time scale often differs from a time scale derived using similarity of bed load transport. Shen proposes using a time scale based on:
)/( λλ −
=slbaT (4)
where, T = characteristic time, a= channel cross sectional area and bl = bed load based on Meyer-Peter and Mueller Equation 4 written in terms of scale ratios equals,
2/32/12/32 )()( −−− −−=mp
mps
mpc
mp
mp kTTLT γγ (5)
where p/m = prototype to model scale ratio Entering scale ratio’s into equation 5 gives a model time scale of,
8.323*5.5*1*20 2/32/12/32 == −−−
mpT (6)
Model Operation
Flow was provided to the model from the laboratory permanent pump and water measurement facility. Model discharge was measured using permeate laboratory venturi meters. At the head of the model, flow entered a model headbox where it passed through a ported pipe diffuser and over a fixed weir. Coal was used in the model to represent sediment for all moveable beds tests. Sediment was added to
7

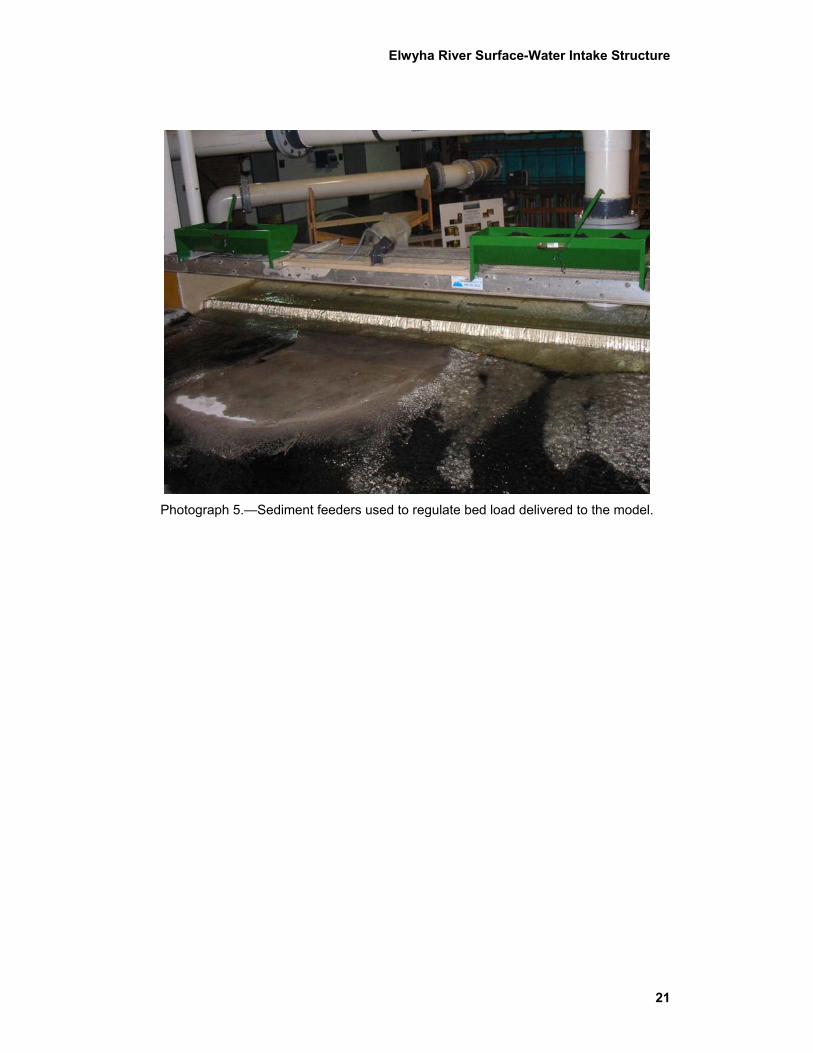
Elwyha River Surface-Water Intake Structure the flow downstream of the headbox using two 2-ft-wide lawn fertilizer spreaders with horizontal paddles as sediment injection hoppers, photograph 5. A gear motor was connected to the axle of each hopper to control the feed rate. Initial operation of the hoppers revealed problems with the coal bridging above the paddles and not flowing continuously to the paddles. This was corrected by placing a water spray bar above each hopper. As coal was injected a fine water spray was applied to the surface of the coal. This worked well to keep a continuous flow of material. Sediment added at the upstream end of the model either deposited within the model topography or moved through the model and was trapped in a downstream settling basin. Approximately two cubic yards of coal was processed for the model study. After each test, material in the settling basin was collected and reused in subsequent tests. Sediment hoppers were positioned at the upstream extent of the model at about Hec river station 19000. The river in this location flows around an island. Therefore, a sediment hopper was placed above the thalweg of each channel. Water surface elevations were measured using surface mounted point gages upstream of the dam (sta. 18350), at the downstream end of the rock-ramp (sta. 17886) and at the downstream end of the model (sta. 17376). Tailwater elevation was controlled by adjusting model tailboards located at the downstream end of the model.
Model Flow Boundaries
Upstream and downstream model flow boundaries were defined using prototype velocity profile measurements obtained by USBR on June 3, 2003, combined with water surface profiles generated from HEC-RAS. Prototype velocity measurements were obtained using an Acoustic Doppler Current Profiler manufactured by RD Instruments Corporation. A map of existing dominant velocity patterns in the river is given in figure 10. Velocity vectors shown were developed by converting velocity profile data to depth averaged point velocities. Diversion Structure Site Selection Generally, a good location for a diversion is on the outside of a stable bend upstream of the point at which the channel crosses over leading into the next downstream bend. Flow around a bend induces transverse secondary currents that move along the bed from the outside bank toward the inside bank. This transverse flow sets up favorable conditions for diversion on the outside of the bend by carrying bed load inward. The bend must be stable to ensure the river geometry does not move relative to the intake altering the transverse flow pattern. Where natural stream curvature and channel stability are not available or sufficiently pronounced, various designs of guide walls, bottom sills or surface vanes have been used (1,2,3,5,6) to create transverse flow upstream of the diversion. The locations of the model dam crest and diversion intake were moved
8

Elwyha River Surface-Water Intake Structure
upstream about 180 ft (sta. 18320) from the existing prototype location (sta. 18140) to take advantage of the river topography and a change in orientation of the flow field from the right bank toward the left bank. Diversion Dam and Intake Design The initial design of the replacement diversion dam and intake structure is shown in figure 11. The diversion dam was changed to a low gradient (1.5 percent) rock-ramp with a 12 ft wide low-flow channel along the right bank. The dam crest was set at elevation 69.0 ft with the low-flow channel invert at elevation 66.5. The intake structure was a rectangular vault, 46.0 ft long by 15 ft wide. Trashracks were mounted on the structure’s long face set at sill elevation of 67.0 ft. The intake chamber connected to two diversion tunnels (6.0 ft and 7.0 ft diameter) and a 3 ft diameter sluiceway pipe (figure 11). The intake was initially designed to divert 228 ft3/s flow at a low river flow of 500 ft3/s and water surface elevation 69.5 ft. Prior to starting model testing, the design diversion flow was reduced to 150 ft3/s due to water right issues. The lower design diversion flow was used during the model study. River stages based on HEC-RAS models at the three point gage measurement locations used in the physical model are given in figure 12. Flow over the dam was not affected by downstream tailwater submergence within the range of model flows. A comparison of HEC-RAS simulations of river stage versus river flow between the existing diversion and the proposed design is given in figure 13. The proposed diversion was designed to increase upstream head at low river flows and maintain approximately the same upstream water surface elevation during flood flows as the existing structure. Moveable Bed Sediment Tests Steady-State Test The initial bed form in the model was built by operating the model under steady-state conditions at a prototype flow of 4,000 ft3/s while adding sediment (photograph 6). Sediment was added slowly at a model rate of 0.24 ft3/hr/ft of hopper until the rate of sediment passing over the diversion dam reached equilibrium with the rate of supply. The model was operated for 16 hours during the initial bed forming stage. During the steady-state flow test, 150 ft3/s of flow was diverted at the intake structure. Both tunnels were operated with 75 ft3/s passing through each tunnel. Sediment movement near the intake and dam were documented using visual observations. Sediment entrainment into the diversion was monitored using sediment collection boxes on the downstream end of each diversion tunnel.
9

Elwyha River Surface-Water Intake Structure Results Upstream of the dam, sediment deposits first started developing to the left of the river centerline (photograph 7). These deposits continued to build with time until material started passing over the dam crest. The highest movement of bed material over the dam crest occurred within a zone 60 to a 100 ft left of the intake. To a lesser degree, bed material moved along the intake face below the intake sill elevation (photograph 8). This material passed downstream through the low-flow notch. Material entrained into the intake was largely fine suspended sediment (<0.5 mm dia. prototype). A thin layer of this material settled out in the upstream one-third of the intake structure. A small amount of bed load size material (>0.5 mm dia. prototype) was recovered from the intake structure. Observation of flow and movement of bed material near the intake indicate entrained bed load was likely lifted off the bottom by turbulent flow separating off the upstream face of the intake structure. Photograph 9 shows dye injected upstream of the flow separation zone. Flow entering the intake passed largely through the downstream two-thirds of the trashrack. The upstream one-third of the intake chamber and trashrack were dominated by a reverse flow eddy. Flow in the downstream portion of the intake chamber was dominated by weak vortices driven by diversion through the tunnel inlets. Photographs 10, 11 and 12 show the bed material deposits following the steady-state test. Sediment deposits upstream of the dam were greatest along the left side of the river channel. Figure 15 gives the spatial distribution and depth of sediment deposits remaining after the model test. The data was obtained by contouring the sediment deposits with string as shown in photographs 11 and 12. During the steady-state test, approximately 7,800 yd3 of bed material deposited between station 19,000 and the dam crest. Quantities of sediment deposition are presented to illustrate relative differences based on location and flow conditions. As the model could not be calibrated against field sedimentation data, model predictions of deposition should not be used as quantitative data for design purposes. Simulated Flood Hydrograph Tests Tests were conducted to evaluate sediment movement and entrainment for simulated flood hydrographs with peak discharges of 6,500 ft3/s, 10,000 ft3/s and 14,470 ft3/s. A flow of 14,470 ft3/s is equal to a flood return period of two years. Hydrographs were developed for each flow by extracting historic events of similar peak flow from average daily flow records. Non-linear regression of several similar flood events was used to develop a typical prototype hydrograph for each flow, figures 16 -18. Discharge values were then selected from the hydrographs at time increments of four hours prototype for model simulation. For modeling, prototype hydrographs were normalized to a base flow of 2000 ft3/s and hydrograph flow duration of 64 hours. The sediment feed rate was adjusted during the hydrograph tests based on the histogram given in figure 19. The sediment supply histogram was formulated based on supplying sediment to the
10

Elwyha River Surface-Water Intake Structure
model at a rate about equal to the flow’s maximum sediment transport rate at river station 19000. The maximum sediment transport rate was defined by observing incipient deposition as a function of river discharge in the model. Flow Hydrograph Test Results, 6,500 ft3/s Peak Flow The pattern of bed material movement over the dam crest was similar to observations during steady-state operation. The majority of bed material moved across the left side of the dam as shown in photograph 13. During peak flow, a strong movement of bed material was observed along the intake sill. Most of the material moved steadily downstream along the bottom passing through the low-flow notch (photograph 14). However, a strong flow separation off the upstream face of the intake structure (noted in steady-state test) suspended significant amounts of bed material upward in the water column. This material was largely entrained into the intake structure. In addition, deposits of fine sediments that transported in the model as suspended load accumulated on the upstream one-half of the intake chamber floor. Upstream of the dam, bed material moved downstream largely along the left riverbank. A view of sediment deposits formed during the flow hydrograph is shown on photograph 15. The distribution of sediment deposits following the 6500 ft3/s flow hydrograph is given in figure 20. Approximately 8,400 yd3 of bed material was contained in the deposits between the dam crest and the upstream riffle at river station 18900. Flow Hydrograph Test Results, 10,000 ft3/s Peak Flow During flows greater than about 7,000 ft3/s, significant bed load movement occurred across the entire dam crest within the main channel prism (photograph 16). Across the dam crest, the zones of highest bed load transport occurred at the low-flow notch and between 60 ft and 100 ft left of the intake. Approximately 0.75 yd3 (prototype) of bed material was entrained into the intake during the test hydrograph. Entrainment of bed material into the intake structure appeared to be largely material suspended by turbulent flow induced by flow separation off the upstream face of the intake structure. Photograph 17 shows a scoured area adjacent to the upstream corner of the intake followed downstream by bed material drawn toward the trashrack. Upstream of the dam, bed material again moved downstream across the entire riverbed with the highest transport occurring on the left side. Observations during the test indicated some scouring of deposits upstream of the dam likely occurred during high flows followed by deposition during the falling end of the hydrograph (photograph 18). No attempt was made to measure scour during flow. Following the 10,000 ft3/s hydrograph test, sediment deposits totaling approximately 7,800 yd3 remained between the dam crest and the upstream riffle at river
11

Elwyha River Surface-Water Intake Structure station 18900. Figure 21 shows the area upstream of the dam that was covered by significant sediment deposition. A view of sediment deposits in the model is shown on photograph 19. Flow Hydrograph Test Results, 14,470 ft3/s Peak Flow General patterns of bed load movement were similar to those observed for smaller peak flow hydrographs. Photograph 20 illustrates the large transport of bed material that occurred across the dam at peak discharge. Sediment moved across the entire dam crest at peak flow. Based on visual observations, the concentration of sediment again appeared to be highest left of river centerline. Approximately 2.2 yd3 (prototype) of bed material was entrained into the intake during the test hydrograph. Entrainment of bed material into the intake structure again appeared to be largely material suspended by turbulent flow in front of the intake.
During the declining limb of the hydrograph bed load transport over the dam decreased sharply, indicating material stored in pre-existing deposits upstream of the dam scoured during the high flow followed by rebuilding of deposits during declining flow. Photograph 21 shows the pattern of sediment transport across the dam as the river flow declined to 7,000 ft3/s. Following the 14,470 ft3/s hydrograph test, sediment deposits totaling approximately 6,700 yd3 remained between the dam crest and river station 18900. Figure 22 shows sediment deposits upstream of the dam following the hydrograph test. General deposition patterns were similar to those measured following peak flows of 6,500 ft3/s and 10,000 ft3/s. A view of sediment deposits in the model is shown on photograph 22. Intake Modifications Test results from the steady-state and simulated hydrograph runs identified three flow problems associated with the intake structure. First, the structure protruded into the flow initiating strong flow separation and turbulence at the upstream face. The turbulent flow suspended bed load into the water column increasing the probability of entrainment with diversion flow. Second, the intake structure was initially designed for a maximum diversion of 228 ft3/s. Therefore, the intake as initially designed was larger than necessary for a diversion of 150 ft3/s. The large intake combined with flow patterns in front of the structure resulted in poor uniformity of flow through the intake trashrack. Third, the near-surface flow inside the intake structure was dominated by large eddies that provided poor escape guidance for surface oriented fish entrained with diversion flow. The exposure of the intake to river flow was reduced by moving the intake structure and low-flow channel 5 ft into the right bank. The length of the intake structure was reduced to 35 feet containing two 15-ft-long trashracks bays (figure 23). Moving the structure and reducing its length also required adjusting
12

Elwyha River Surface-Water Intake Structure
the location of the sluice inlet and tunnel inlets. A surface fish bypass was added to the downstream wall of the intake structure to allow fish near the surface to pass through the intake chamber directly back to the river (figure 23, section A). The invert of the bypass portal was set at elevation 71.0 ft to prevent impacting low river flow diversion. Flow through the surface bypass could be regulated by a weir gate mounted on the inside wall. Modified Intake Flow Uniformity Tests Flow velocity was measured along the trashrack at 3.5 ft intervals at a distance of 10 inches (prototype) in front of the trashrack. Horizontal velocity components parallel and normal to the trashrack were measured at mid-depth between the intake sill (elevation 67.0) and the water surface. Velocities were measured using a three-component acoustic doppler velocity meter. The meter measures point velocity at a frequency of 25 hertz. Average velocity components were calculated based on 30 seconds of data. Velocity profiles along the trashrack were measured for six conditions covering three river flows and two diversion flows. Measurements were made at river flows of 1,600 ft3/s, 3,000 ft3/s and 5,000 ft3/s. At each flow, velocity measurements were made with diversion flows of 75 ft3/s and 150 ft3/s with the surface fish pass fully open. Results
Velocity vectors measured in front of the trashrack during a river flow of 1600 ft3/s and diversion flows of 75 ft3/s and 150 ft3/s are plotted on figures 24 and 25 respectively. These velocity vectors are given in terms of sweeping (parallel) and approach (normal) velocity components in figure 26. A zone of flow separation off the upstream face of the intake structure is evident by the low sweeping and approach velocities measured along the upstream end of the trashrack. The drop off of velocities indicated near the center of the trashrack is due to the influence of a center pier between trashracks. Downstream of the flow separation zone measured sweeping and approach velocity were about 3.0 ft/s and 1.5 ft/s, respectively. An increase in trashrack approach velocities of about 0.25 ft/s occurred when diversion was doubled from 75 ft3/s to150 ft3/s. Velocity vectors measured in front of the trashrack during a river flow of 3000 ft3/s and diversion flows of 75 ft3/s and 150 ft3/s are plotted on figures 27 and 28 respectively. These velocity vectors are given in terms of sweeping (parallel) and approach (normal) velocity components in figure 29. The zone of flow separation off the upstream face of the intake structure increased with increased river flow. Flow through the upstream trashrack was depressed and highly skewed. Measured sweeping and approach velocity along the downstream trashrack were about 4.0 ft/s and 2.0 ft/s, respectively. Velocity vectors measured in front of the trashrack during a river flow of 5,000 ft3/s and diversion flows of 75 ft3/s and 150 ft3/s are plotted on figures 30 and 31 respectively. These velocity vectors are given in terms of sweeping
13

Elwyha River Surface-Water Intake Structure (parallel) and approach (normal) velocity components in figure 32. The zone of flow separation off the upstream face of the intake structure was similar to that measured at 3,000 ft3/s. Sweeping velocities increased to about 5.5 ft/s with little change in approach velocity compared to measurements taken at 3,000 ft3/s. Addition of Upstream Guide Wall A vertical guide wall was installed from the intake upstream to improve the flow distribution on the upstream trashrack. The guide wall is shown on photograph 23. Velocity profiles were again measured with diversion flows of 75 ft3/s and 150 ft3/s along the trashrack during river flows of 1,600 ft3/s, 3,000 ft3/s and 5,000 ft3/s. Velocity vectors measured in front of the trashrack during a river flow of 1600 ft3/s and diversion flows of 75 ft3/s and 150 ft3/s are plotted on figures 33 and 34 respectively. Sweeping and approach velocity components to the trashrack are plotted in figure 35. Velocity vectors measured in front of the trashrack during a river flow of 3000 ft3/s and diversion flows of 75 ft3/s and 150 ft3/s are plotted on figures 36 and 37 respectively. Velocity components relative to the trashrack are plotted in figure 38. Velocity vectors measured in front of the trashrack during a river flow of 5000 ft3/s and diversion flows of 75 ft3/s and 150 ft3/s are plotted on figures 39 and 40 respectively. Velocity components are plotted in figure 39. A single test at 5000 ft3/s river flow was conducted with the surface fish bypass closed for comparison (figure 41). An increase of less than 0.5 ft/s in trashrack approach and sweeping velocity was measured at 5000 ft3/s river flow for the open bypass compared to no surface bypass. The upstream guide wall improved the flow distribution along the trashrack. The velocity distribution was reasonably even except for a localized acceleration of flow at the start of the trashrack and a flow disturbance caused by the center pier. Flow through the surface fish bypass creates localized flushing of surface flow within the intake chamber and provides opportunity for fish to return directly to the river. Surface bypass flow was not found to significantly alter eddy patterns in the upstream one-half of the intake chamber. Intake Sediment Sluice The intake design includes a sluiceway flume mounted in the vault on the inside of the intake sill wall (figure 23, sections A and B). The flume runs along the wall beneath the intake sill and slopes upstream to downstream at six percent. The flume connects to a 30-inch diameter pipe that passes through the downstream wall of the vault. The pipe follows a one percent grade for a distance of 300 ft before intercepting the surface of the rock-ramp. The sediment flume trapping large sand and gravel material entrained into the intake. Opening the sluice pipe was effective in cleaning the downstream one-third of the sediment flume. The upstream two thirds will require periodic mechanical cleaning.
14

Elwyha River Surface-Water Intake Structure
Rock Ramp Modifications
Two modifications to the rock ramp were tested to improve flow conditions for fish passage. The initial concept design of the ramp included a thalweg or low flow channel following the right bank (figure 43). The low flow channel was a trapezoidal channel with a 12 ft bottom width, 4:1 side slopes set 2.5 ft below grade. To the left of the low flow channel the rock ramp was horizontal in the direction normal to the flow. The distance from the left bank of the low flow channel to the left riverbank (herein referred to as the bench area) was about 100 ft. Small river flows that exceeded the low flow channel capacity spread out over the bench area forming a large area of shallow flow. Resource agency comments identified a concern that shallow flows on the bench could result in stranding of fish. To correct this problem, the cross section of the rock ramp was modified to a continuous slope between the thalweg channel and the left river bank (figure 44). This resulted in a slope normal to the flow of about 3 percent. The crest elevation of the diversion dam was not changed. Therefore, the ramp downstream of the diversion crest transitioned from horizontal to 3 percent.
The second ramp modification tested was the addition of 3 to 4 ft diameter (prototype) boulders placed on the surface of the rock ramp to provide streamwise avenues of high flow resistance. Protruding boulders are commonly used in rock fishways and rock ramps to increase flow resistance and diversity for fish passage. Reclamation has studied and utilized boulders in a number of rock fishways and rock ramps since the mid-1990s (Mefford and Campbell 2002, Sayer and Glickman, 2002, White and Mefford, 2002 Mefford 1998). In 2002, design guidelines for using boulders in fishways based on work in Europe was published in “Fish Passes, Design Dimensions and Monitoring” from the United Nations Food and Agriculture Organization (FAO).
A mid-channel boulder field was chosen for testing in the model because of the natural flow spilt that occurs around the debris island located immediately downstream of the rock ramp. Boulders were modeled using 2 to 2.5 inch diameter stones. These were buried about one quarter of their diameter, thus exposing most of the boulders to the flow. Boulders were placed along the entire length of the rock ramp. Boulders were placed starting at the left edge of the low flow channel and extended across the channel for a width of 40 to 50 ft. Boulders were placed in low density arrays containing boulders spaced about 3 to 5 diameters apart. The boulder field created a mid-channel low velocity buffer composed of a series of weak chutes and eddies. The boulder field is shown on photograph 24. Dye was injected into the flow to evaluate the affect of the boulder field as a function of placement and density of boulders. Average flow velocities measured in the model using dye are shown in figure 45. Velocities are based on the time required for dye to travel the length of the rock ramp. The reduction in flow velocity measured through the boulder field compared to thalweg flow is due to a combination of boulder form drag loss and, to a lesser extent, an increase in bed friction loss associated with lower flow depth within the boulder field cross section. For boater safety, boulders should be positioned at the
15

Elwyha River Surface-Water Intake Structure upstream extent of the boulder field in a manor that signals rafters to move away from the boulder field. In the model, three large boulders were placed on the crest of the rock ramp to provide a boater visual queue. Bibliography
1. Dodge R. A. 1988. Overtopping Flow on Low Embankment Dams – Summary Report of Model Tests. US Bureau of Reclamation Hydraulics Laboratory. Report No. REC-ERC 88-3.
2. Dodge R.A. 1954. Milburn Diversion Dam Model Study Missouri River Basin Project, Nebraska, Progress Report No. 4. General Studies of Headworks and Sluiceway Structures. U.S. Bureau of Reclamation Hydraulics Laboratory. Report No. Hyd-385.
3. Enger P.F. 1954. Hydraulic Model Studies of Bartley Diversion Dam, Progress Report No. 3, General Studies of Headworks and Sluiceway Structures Missouri Basin Project, Nebraska. U.S. Bureau of Reclamation Hydraulics Laboratory. Report No. Hyd-384.
4. Franco J. J., 1978. Guidlelines for the Design, Adjustment and Operation of Models for the Study of River Sedimentation Problems. U.S. Army Corps of Engineers, Waterways Experiment Station.Vicksburg, Mississippi.
5. Hanson O. S. and Carlson E. J. 1954. Hydraulic Model Studies of the Republic Diversion Dam, Headworks and Sluiceway Structures – Progress Report No. 2, General Studies of Headworks and Sluiceway. US Bureau of Reclamation Hydraulics Laboratory. Report No. Hyd-316.
6. Mefford, B. and Campbell, R. 2002. Tongue and Yellowstone Rivers Diversion Dam Fishway Feasibility Study. Bureau of Reclamation Water Resources Research Laboratory. Report PAP ?, Denver Colorado
7. Mefford, B. 1998. Physical Model Study of Marble Bluff Dam CUI-UI Passage. Bureau of Reclamation Water Resources Research Laboratory. Report PAP ?, Denver, Colorado
8. Melone A. M., Richardson E.V., and Simons D.B., 1975. Exclusion and Ejection of Sediment from Canals. Colorado State University. Fort Collins, Colorado
9. Pugh A. C. 1985. Hydraulic Model Studies of Fuse Plug Embankments. U.S. Bureau of Reclamation Hydraulics Laboratory. Report No. REC-ERC 85-7.
16

Elwyha River Surface-Water Intake Structure
10. Rhone J. T. 1957. Hydraulic Model Studies to Develop a Sediment Control Arrangement for Angostura Diversion – Middle Rio Grande Project, New Mexico. U.S. Bureau of Reclamation Hydraulics Laboratory. Report No. Hyd-419.
11. Sayer, K and Glickman, A, May 2004, “Design Summary/Designer’s Operating Criteria – Fish Passage Facility at PNM Diversion Dam – San Juan Basin Recovery Program, New Mexico,” Bureau of Reclamation, Technical Service Center, Denver, Colorado
12. Shen, W. Hsiew, 1971. River Mechanics Vol. II. Chapter 21, Modeling of Fluvial Processes, Colorado State University, Fort Collins, Colorado
13. Deutscher Verband fur Wasserwirtschaft und Kulturbau (DVWK) “Fish Passes, Design Dimensions and Monitoring” , United Nations Food and Agriculture Organization (FAO), Rome, 2002
14. US Bureau of Reclamation, 1996. Elwha River Ecosystem and Fisheries Restoration Project, Washington, Elwha Technical Series PN-95-5, Alluvium Distribution in the Elwha River Channel Between Glines Canyon Dam and the Strait of Juan De Fuca, Washington. U.S. Department of the Interior, Bureau of Reclamation, Pacific Northwest Region Boise, Idaho.
15. US Bureau of Reclamation, 1995. Elwha River Restoration Project, Washington, Elwha Technical Series PN-95-4, Alluvium Distribution in Lake Mills, Glines Canyon Project and Lake Aldwell, Elwha Project, Washington. U.S. Department of the Interior, Bureau of Reclamation, Pacific Northwest Region Boise, Idaho.
16. White, R.G., and Mefford, B., “Assessment of Behavior and Swimming Ability of Yellowstone River Sturgeon for Design of Fish Passage Devices”, U.S. Bureau of Reclamation, Water Resources Research Laboratory, PAP ?, January 10, 2002.
17

Elwyha River Surface-Water Intake Structure
Elwyha River Surface-Water Intake Structure
Photographs
18 18

Elwyha River Surface-Water Intake Structure
Photograph 1.—View looking from the right bank across the existing Elwha surface-water intake diversion dam.
Photograph 2.—View of existing Elwha surface-water intake structure.
19

Elwyha River Surface-Water Intake Structure
Photograph 3.—View of model construction showing intake structure and downstream rock-ramp.
Photograph 4.—View looking upstream of Elwha surface-water intake model.
20
Elwyha River Surface-Water Intake Structure
Photograph 5.—Sediment feeders used to regulate bed load delivered to the model.
21

Elwyha River Surface-Water Intake Structure
Photographs of 4,000 Steady-state Flow Tests
Photograph 6.—View of model during a steady-state flow of 4,000 ft3/s.
22

Elwyha River Surface-Water Intake Structure
Photograph 7.—View of initial sediment deposit formation upstream of the dam during early stages of the alluvial bed building process.
Photograph 8.—View of flow and bed sediment passing the front of the intake structure.
23

Elwyha River Surface-Water Intake Structure
Photograph 9.—View looking down on flow adjacent to intake structure. Red dye was injected upstream and inline with the intake. Dye shows flow separating off the upstream face of the structure and then entering the intake downstream.
Photograph 10.—View of bed deposits upstream of dam crest following 4,000 ft3/s steady-state flow.
24

Elwyha River Surface-Water Intake Structure
Photograph 11.—View of string contours of sediment deposited upstream of dam following steady-state flow of 4,000 ft3/s.
Photograph 12.—View of sediment deposited upstream of dam following steady-state flow of 4,000 ft3/s.
25

Elwyha River Surface-Water Intake Structure
Simulated Hydrograph Tests 6,500 ft3/s Peak Flow
Photograph 13.—View of bed material moving across the dam crest near the left bank during a flow of 6,500 ft3/s.
26

Elwyha River Surface-Water Intake Structure
Photograph 14.—View of bed sediment moving across dam crest and down the low-flow channel during peak flow conditions.
Photograph 15.—View of string contours of sediment deposited upstream of dam following 6,500 ft3/s peak flow hydrograph.
27

Elwyha River Surface-Water Intake Structure
Simulated Hydrograph Tests 10,000 ft3/s Peak Flow
Photograph 16.—View of 10,000 ft3/s river flow showing transport of bed sediments across the dam crest.
28

Elwyha River Surface-Water Intake Structure
Photograph 18.—View looking down on the dam crest following the 10,000 ft3/s hydrograph test. Flow shown is 2,000 ft3/s.
Photograph 17.—Close up view of flow and bed sediment moving past the front of the intake structure.
29

Elwyha River Surface-Water Intake Structure
30
Photograph 19.—View looking down of sediment deposits upstream of the dam crest following the 10,000 ft3/s hydrograph test.

Elwyha River Surface-Water Intake Structure
Simulated Hydrograph Tests 14,400 ft3/s Peak Flow
Photograph 20.—View of 14,400 ft3/s flow transporting sediment over the dam.
31

Elwyha River Surface-Water Intake Structure
Photograph 21.—View during descending flow following the 14,400 ft3/s peak flow. Flow shown is 7,000 ft3/s.
Photograph 22.—View of sediment deposits upstream of the dam following passage of a 14,400 ft3/s peak flow hydrograph.
32

Elwyha River Surface-Water Intake Structure
P
hotograph 23.—View of the upstream guide wall modification to the intake structure.
Photograph 24.—View looking downstream of rock ramp with mid-channel boulders shown in black.
33

Elwyha River Surface-Water Intake Structure
Figures
34

Elwyha River Surface-Water Intake Structure
35
Figure 1.—Plan view of hydraulic model showing river topography and rock-ramp diversion dam.

Elwyha River Surface-Water Intake Structure
Figure 2.—Contour map of Elwha River near surface-water diversion dam.
Existing Diversion Dam
36

Elwyha River Surface-Water Intake Structure
Settling Velocity in Water
0.01
0.1
1
10
0.001 0.01 0.1 1Settling Velocity (m/s)
SandCoal
Figure 3.—Comparison of particle settling velocity for sand and lignite coal.
37

Elwyha River Surface-Water Intake Structure
0.010
0.100
1.000
10.000
100.000
0.100 1.000 10.000 100.000 1000.000 10000.000
Re* Grain Reynolds Number
Tau
*, D
imen
sion
less
she
arShields Parameter PrototypeShields Parameter ModelCritical Shields parameter
PrototypeGamma 62.4Hyd Rad, R (proto) 3 5 7 10 12Grain Size, d (ft) 0.04 12.19 mmK viscosity 0.000014Slope, S 0.0027Shear, GRS 0.505 0.842 1.179 1.685 2.022Dimless Shear, F*(proto) 0.123 0.204 0.286 0.409 0.491Shear vel, U* 0.505 0.652 0.772 0.922 1.010Grain Re, Re* 1443.558 1863.625 2205.071 2635.564 2887.116Shield's Fc* 0.067 0.068 0.069 0.070 0.070Ratio of F*(proto)/Fc* 1.844 3.012 4.166 5.881 7.017F*(proto)-Fc* 0.056 0.137 0.218 0.339 0.421
Fall Velocity ,ft/s (m/s) 1.17 0.38
ModelModel Scale 20Specfic Weight, coal 79Gamma 62.4Hyd Rad, R (model) 0.150 0.250 0.350 0.500 0.600Grain SK viscosity 0.000014Slope, S 0.0027Shear, GRS 0.025 0.042 0.059 0.084 0.101Dimless Shear, F*(model) 0.117 0.195 0.273 0.390 0.468Shear vel, U* 0.113 0.146 0.173 0.206 0.226Grain Re, Re* 104.907 135.434 160.247 191.532 209.813 Shield's Fc* 0.045 0.048 0.049 0.051 0.052Ratio of F*(model)/Fc* 2.606 4.108 5.555 7.665 9.042F*(proto)-Fc* 0.072 0.148 0.224 0.339 0.417
Scaled Fall Velocity (ft/s) 0.262Actual fall velocity (ft/s) 0.243
(F*(proto)-Fc*)/(F* (model)-Fc*) 0.778 0.925 0.971 1.000 1.010
ize, d (ft) 0.013 3.96 mm
38
Figure 4.—Sediment scaling relationships based on critical shear and particle fall velocity, 12 mm diameter particle.

Elwyha River Surface-Water Intake Structure
39
PrototypeGamma 62.4Hyd Rad, R (proto) 3 5 7 10 12Grain Size, d (ft) 0.02 6.10 mmK viscosity 0.000014Slope, S 0.0027Shear, GRS 0.505 0.842 1.179 1.685 2.022Dimless Shear, F*(proto) 0.245 0.409 0.573 0.818 0.981Shear vel, U* 0.505 0.652 0.772 0.922 1.010Grain Re, Re* 721.779 931.813 1102.535 1317.782 1443.558Shield's Fc* 0.062 0.064 0.065 0.066 0.067Ratio of F*(proto)/Fc* 3.949 6.403 8.817 12.393 14.756F*(proto)-Fc* 0.183 0.345 0.508 0.752 0.915
Fall Velocity ,ft/s (m/s) 0.83 0.27
ModelModel Scale 20Specfic Weight, coal 79Gamma 62.4Hyd Rad, R (model) 0.150 0.250 0.350 0.500 0.600Grain Size, d (ft) 0.0067 2.04 mmK viscosity 0.000014Slope, S 0.0027Shear, GRS 0.025 0.042 0.059 0.084 0.101Dimless Shear, F*(model) 0.227 0.379 0.530 0.757 0.909Shear vel, U* 0.113 0.146 0.173 0.206 0.226Grain Re, Re* 54.067 69.800 82.589 98.713 108.134 Shield's Fc* 0.038 0.041 0.043 0.044 0.045Ratio of F*(model)/Fc* 5.922 9.274 12.471 17.091 20.091F*(proto)-Fc* 0.189 0.338 0.488 0.713 0.864
Scaled Fall Velocity (ft/s) 0.185Actual fall velocity (ft/s) 0.174
0.010
0.100
1.000
10.000
100.000
0.100 1.000 10.000 100.000 1000.000 10000.000
Re* Grain Reynolds Number
Tau
*, D
imen
sion
less
she
arShields Parameter PrototypeShields Parameter ModelCritical Shields parameter
(F*(proto)-Fc*)/(F* (model)-Fc*) 0.970 1.021 1.041 1.054 1.059
Figure 5.—Sediment scaling relationships based on critical shear and particle fall velocity, 6.1 mm diameter particle.

Elwyha River Surface-Water Intake Structure
PrototypeGamma 62.4Hyd Rad, R (proto) 3 5 7 10 12Grain Size, d (ft) 0.0035 1.07 mmK viscosity 0.000014Slope, S 0.0027Shear, GRS 0.505 0.842 1.179 1.685 2.022Dimless Shear, F*(proto) 1.402 2.337 3.271 4.674 5.608Shear vel, U* 0.505 0.652 0.772 0.922 1.010Grain Re, Re* 126.311 163.067 192.944 230.612 252.623Shield's Fc* 0.047 0.049 0.051 0.053 0.054Ratio of F*(proto)/Fc* 29.952 47.341 64.144 88.683 104.734F*(proto)-Fc* 1.355 2.287 3.220 4.621 5.555
Fall Velocity ,ft/s (m/s) 0.35 0.11
ModelModel Scale 20Specfic Weight, coal 79Gamma 62.4Hyd Rad, R (model) 0.150 0.250 0.350 0.500 0.600Grain Size, d (ft) 0.0011 0.34 mmK viscosity 0.000014Slope, S 0.0027Shear, GRS 0.025 0.042 0.059 0.084 0.101Dimless Shear, F*(model) 1.384 2.307 3.229 4.613 5.536Shear vel, U* 0.113 0.146 0.173 0.206 0.226Grain Re, Re* 8.877 11.460 13.559 16.207 17.753 Shield's Fc* 0.031 0.030 0.030 0.030 0.031Ratio of F*(model)/Fc* 44.366 75.998 106.779 151.394 180.244F*(proto)-Fc* 1.353 2.276 3.199 4.583 5.505
Scaled Fall Velocity (ft/s) 0.077Actual fall velocity (ft/s) 0.071
(F*(proto)-Fc*)/(F* (model)-Fc*) 1.002 1.005 1.007 1.008 1.009
0.010
0.100
1.000
10.000
100.000
0.100 1.000 10.000 100.000 1000.000 10000.000
Re* Grain Reynolds Number
Tau
*, D
imen
sion
less
she
arShields Parameter PrototypeShields Parameter ModelCritical Shields parameter
Figure 6.—Sediment scaling relationships based on critical shear and particle fall velocity, 1.0 mm diameter particle.
40

Elwyha River Surface-Water Intake Structure
PrototypeGamma 62.4Hyd Rad, R (proto) 3 5 7 10 12Grain Size, d (ft) 0.01 3.05 mmK viscosity 0.000014Slope, S 0.0027Shear, GRS 0.505 0.842 1.179 1.685 2.022Dimless Shear, F*(proto) 0.491 0.818 1.145 1.636 1.963Shear vel, U* 0.505 0.652 0.772 0.922 1.010Grain Re, Re* 360.889 465.906 551.268 658.891 721.779Shield's Fc* 0.057 0.059 0.060 0.061 0.062Ratio of F*(proto)/Fc* 8.652 13.901 19.035 26.606 31.591F*(proto)-Fc* 0.434 0.759 1.085 1.574 1.901
Fall Velocity ,ft/s (m/s) 0.59 0.19
ModelModel Scale 20Specfic Weight, coal 79Gamma 62.4Hyd Rad, R (model) 0.150 0.250 0.350 0.500 0.600Grain Size, d (ft) 0.0033 1.01 mmK viscosity 0.000014Slope, S 0.0027Shear, GRS 0.025 0.042 0.059 0.084 0.101Dimless Shear, F*(model) 0.461 0.769 1.076 1.538 1.845Shear vel, U* 0.113 0.146 0.173 0.206 0.226Grain Re, Re* 26.630 34.379 40.678 48.620 53.260 Shield's Fc* 0.033 0.034 0.036 0.037 0.038Ratio of F*(model)/Fc* 14.130 22.321 30.057 41.134 48.274F*(proto)-Fc* 0.429 0.734 1.041 1.500 1.807
Scaled Fall Velocity (ft/s) 0.131Actual fall velocity (ft/s) 0.122
(F*(proto)-Fc*)/(F* (model)-Fc*) 1.012 1.033 1.042 1.049 1.052
0.010
0.100
1.000
10.000
0.100 1.000 10.000 100.000 1000.000 10000.000
Re* Grain Reynolds Number
Tau
*, D
imen
sion
less
she
arShields Parameter PrototypeShields Parameter ModelCritical Shields parameter
Figure 7.—Sediment scaling relationships based on critical shear and particle fall velocity, 1.0 mm diameter particle.
100.000
41

Elwyha River Surface-Water Intake Structure
PrototypeGamma 62.4Hyd Rad, R (proto) 3 5 7 10 12Grain Size, d (ft) 0.0016 0.49 mmK viscosity 0.000014Slope, S 0.0027Shear, GRS 0.505 0.842 1.179 1.685 2.022Dimless Shear, F*(proto) 3.067 5.112 7.156 10.223 12.268Shear vel, U* 0.505 0.652 0.772 0.922 1.010Grain Re, Re* 57.742 74.545 88.203 105.423 115.485Shield's Fc* 0.039 0.041 0.043 0.045 0.046Ratio of F*(proto)/Fc* 78.660 123.208 165.744 227.274 267.244F*(proto)-Fc* 3.028 5.070 7.113 10.178 12.222
Fall Velocity ,ft/s (m/s) 0.23 0.08
ModelModel Scale 20Specfic Weight, coal 79Gamma 62.4Hyd Rad, R (model) 0.150 0.250 0.350 0.500 0.600Grain Size, d (ft) 0.0005 0.15 mmK viscosity 0.000014Slope, S 0.0027Shear, GRS 0.025 0.042 0.059 0.084 0.101Dimless Shear, F*(model) 3.045 5.075 7.105 10.149 12.179Shear vel, U* 0.113 0.146 0.173 0.206 0.226Grain Re, Re* 4.035 5.209 6.163 7.367 8.070 Shield's Fc* 0.040 0.036 0.034 0.032 0.032Ratio of F*(model)/Fc* 75.789 140.700 208.782 313.378 383.716F*(proto)-Fc* 3.005 5.039 7.071 10.117 12.148
Scaled Fall Velocity (ft/s) 0.052Actual fall velocity (ft/s) 0.014
(F*(proto)-Fc*)/(F* (model)-Fc*) 1.008 1.006 1.006 1.006 1.006
0.010
0.100
1.000
10.000
100.000
0.100 1.000 10.000 100.000 1000.000 10000.000
Re* Grain Reynolds Number
Tau
*, D
imen
sion
less
she
arShields Parameter PrototypeShields Parameter ModelCritical Shields parameter
Figure 8.—Sediment scaling relationships based on critical shear and particle fall velocity, 0.5 mm diameter particle.
42

Elwyha River Surface-Water Intake Structure
Prototype and Model Sediment Distribution
0102030405060708090
100
0.01 0.1 1 10 100
Sediment Size, mm
Perc
ent P
assi
ng
Mills Lake Gradation(sand and smallgravels only)Crushed CoalGradation
Model Gradationscaled to Prototype
Figure 9.—Gradation of sand and small gravel material in Lake Mills compared to the material gradation used in the model.
43

Elwyha River Surface-Water Intake Structure
Figure 10.—Velocity vector field upstream of existing diversion measured on June 3, 2003.
44

Elwyha River Surface-Water Intake Structure
Figure 11.—Plan and sections of surface-water diversion intake structure.
45

Elwyha River Surface-Water Intake Structure
Figure 12.—Plot of river stage measured in the model upstream of the dam (sta. 18350), at the downstream end of the rock-ramp (sta.17886) and downstream near the bridge crossing (sta. 17373).
55
60
65
70
75
80
0 2500 5000 7500 10000 12500 15000
River Flow, cfs
Riv
er S
tage
, ft
River sta. 18350River sta.17886River sta.17376
6566676869707172737475
0 1000 2000 3000 4000 5000 6000
Flow, cfs
Stag
e, ft
Proposed Diversion Damat IntakeExisting Diversion Damat IntakeExisting Diversion atLocation of New Intake
Figure 13.—Hec-Ras generated comparison river stage between the existing diversion dam and the proposed diversion dam.
46

Elwyha River Surface-Water Intake Structure
Figure 14.—Plan and sections of initial intake structure.
47

Elwyha River Surface-Water Intake Structure
Figure 15.—Map showing model test results of predicted sediment deposition following steady-state river flows of 4,000 ft3/s.
0
1000
2000
3000
4000
5000
6000
7000
0 12 24 35 47 59 71 82 94 106
118
129
141
153
165
176
Time, h
Flow
, cfs
6,500 cfshydrograqph
rs
Figure 16.—6,500 ft3/s peak flow hydrograph simulated in model tests.
48

Elwyha River Surface-Water Intake Structure
0
2000
4000
6000
8000
10000
12000
0 4 8 12 16 20 24 28 32 36 40 44 48 52 56 60
Time, hrs
Flow
, cfs
10,000 cfshydrograqph
Figure 17.—10,000 ft3/s peak flow hydrograph simulated in model tests.
0
2000
4000
6000
8000
10000
12000
14000
16000
0 4 8 12 16 20 24 28 32 36 40 44 48 52 56 60
Time, cfs
Flow
, cfs
14,470 cfshydrograqph
Figure 18.—14,470 ft3/s peak flow hydrograph simulated in model tests.
49

Elwyha River Surface-Water Intake Structure
0
100
200
300
400
500
600
700
4000 6500 10000 14470
River Flow, ft3/s
Tota
l Bed
Loa
d, Y
ds3 /h
r
Figure 19.—Sediment feed rate used in the model scaled to prototype.
F ing a normalized flood hydrograph of 6,500 ft /s peak flow.
igure 20.—Map showing model test results of sediment deposition follow3
50

Elwyha River Surface-Water Intake Structure
Figure 21.—Map showing model test results of sediment deposition following a no 3rmalized flood hydrograph of 10,000 ft /s peak flow.
Figure 22.—Map showing model test results of sediment deposition following a normalized flood hydrograph of 14,400 ft3/s peak flow.
51

Elwyha River Surface-Water Intake Structure
Figure 23.—Plan and sections of modified intake structure.
52

Elwyha River Surface-Water Intake Structure
53

Elwyha River Surface-Water Intake Structure
Figure 24.—Velocity vectors measured in front of the intake trashracks during 1,600 ft3/s river flow and 75 ft3/s diversion flow.
Figure 25.—Velocity vectors measured in front of the intake trashracks during 1,600 ft3/s river flow and 150 ft3/s diversion flow.
54

Elwyha River Surface-Water Intake Structure
Elwha River Intake Qriver = 1600 cfs
-1.0
0.0
1.0
2.0
3.0
4.0
5.0
0 5 10 15 20 25 30 35Trashrack Location - Upstream to Downstream, ft
Velo
city
(pro
to)
ft/s
Sweeping - 75 cfsApproach - 75 cfsSweeping - 150 cfsApproach - 150 cfsTrashrack piers
Figure 26.—Plot of flow velocities given in figures 24 and 25 expressed as sweeping (parallel to trashrack) an approach (normal to trashrack) velocity components.
d
Figure 27.—Velocity vectors measured in front of the intake trashracks during 3,000 ft3/s river flow and 75 ft3/s diversion flow.
55

Elwyha River Surface-Water Intake Structure
Figure 28.—Velocity vectors measured in front of the intake trashracks during 3,000 ft3/s river flow and 150 ft3/s diversion flow.
Elwha River Intake Qriver = 3000 cfs
-1.0
0.0
1.0
2.0
3.0
4.0
5.0
6.0
0 5 10 15 20 25 30 35
Trashrack Location - Upstream to Downstream, ft
Velo
city
(pro
to)
ft/s
Sweeping - 75 cfsApproach - 75 cfsSweeping - 150 cfsApproach - 150 cfsTrashrack Piers
Figuswe shrack) velocity components.
re 29.—Plot of flow velocities given in figures 27 and 28 expressed as eping (parallel to trashrack) and approach (normal to tra
56

Elwyha River Surface-Water Intake Structure
Figure 30.—Velocity vectors measured in front of the intake trashracks during 5,000 ft3/s river flow and 75 ft3/s diversion flow.
Figure 31.—Velocity vectors measured in front of the intake trashracks during 5,000 ft3/s river flow and 150 ft3/s diversion flow.
57

Elwyha River Surface-Water Intake Structure
Elwha River Intake Qriver = 5000 cfs
-1.00.01.02.03.04.05.06.07.0
0 5 10 15 20 25 30 35Trashrack Location - Upstream to Downstream, ft
Velo
city
(pro
to)
ft/s
Sweeping - 75 cfsApproach - 75 cfsSweeping - 150 cfsApproach - 150 cfsTrashrack Piers
Figure 32.—Plot of flow velocities given in figures 30 and 31 expressed as sweeping (parallel to trashrack) and approach (normal to trashrack) velocity components.
Figure 33.—Velocity vectors measured in front of the intake trashracks with the
. upstream guide wall during 1,600 ft3/s river flow and 75 ft3/s diversion flow
58

Elwyha River Surface-Water Intake Structure
Figu the ups /s diversion flow.
re 34.—Velocity vectors measured in front of the intake trashracks with tream guide wall during 1,600 ft3/s river flow and 150 ft3
Elwha River Intake Qriver = 1600 cfs
-1.0
0.0
1.0
2.0
3.0
4.0
5.0
0 5 10 15 20 25 30 35
Trashrack Location - Upstream to Downstream, ft
Velo
city
(pro
to)
ft/s
Sweeping - 75 cfsApproach - 75 cfsSweeping - 150 cfsApproach - 150 cfsTrashrack Piers
Figure 35.—Plot of flow velocities given in figures 33 and 34 expressed a sweeping (parallel to trashrack) and approach (normal to trashrack) velocity com
s
ponents.
59

Elwyha River Surface-Water Intake Structure
Figure 36.—Velocity vectors measured in front of the intake trashracks with the upstream guide wall during 3,000 ft3/s river flow and 75 ft3/s diversion flow.
Figure 37.—Velocity vectors measured in front of the intake trashracks with the upstream guide wall during 3,000 ft3/s river flow and 150 ft3/s diversion flow.
60

Elwyha River Surface-Water Intake Structure
Elwha River Intake Qriver = 3000 cfs
-1.00.01.02.03.04.05.06.0
0 5 10 15 20 25 30 35
Trashrack Location - Upstream to Downstream, ft
Velo
city
(pro
to)
ft/s
Sweeping - 75 cfsApproach - 75 cfsSweeping - 150 cfsApproach - 150 cfsTrashrack Piers
Figure 38.—Plot of flow velocities given in figures 36 and 37 expressed as sweeping (parallel to trashrack) and approach (normal to trashrack) velocity components.
Figure 39.—Velocity vectors measured in front of the intake trashracks with the upstream guide wall during 5,000 ft3/s river flow and 75 ft3/s diversion flow.
Figure 40.—Velocity vectors measured in front of the intake trashracks with the upstream guide wall during 5,000 ft3/s river flow and 150 ft3/s diversion flow.
61

Elwyha River Surface-Water Intake Structure
Elwha River Intake Qriver = 5000 cfs
-2.0-1.00.01.02.03.04.05.06.07.0
0 5 10 15 20 25 30 35Trashrack Location - Upstream to Downstream, ft
Velo
city
(pro
to)
ft/s
Sweeping - 75 cfsApproach - 75 cfsSweeping - 150 cfsApproach - 150 cfsTrashrack Piers
Figure 41.—Plot of flow velocities given in figures 39 and 40 expressed a sweeping (parallel to trashrack) and approach (normal to trashrack) velocity
s
components.
Elwha River Intake Qriver = 5000 cfs
-2.00.0
2.04.0
6.08.0
0 5 10 15 20 25 30 35
Trashrack Location - Upstream to Downstream, ft
Velo
city
(pro
to)
ft/s
Sweeping - 75 cfs, Open BypassApproach -75 cfs, Open BypassSweeping - 75 cfs, Bypass ClosedApproach - 75 cfs, Bypass ClosedTrashrack Piers
Figure 42comparing5,000 ft3/s.
.—Plot of flow velocity components measured in front of the trashrack pen and closed conditions for the surface fish bypass at a river flow of
62

Elwyha River Surface-Water Intake Structure
Figure 43.—Initial rock ramp concept design with horizontal bench between the low flow channel and left bank.
Figure 44.—Cross section showing modified rock ramp with slope from the low flow channel to the left river bank.
63

Elwyha River Surface-Water Intake Structure
0
1
2
3
4
5
6
7
River Flow, cfs
Aver
age
Flow
Vel
ocity
, ft/s
Thalweg ChannelBoulder Field
0 2000 4000 6000
Ffie
igure 45.—Plot of average flow velocity in the thalweg channel and mid-channel boulder ld.
64