hydraulic efficiency of grate and curb … · hydraulic efficiency of grate and curb-opening inlets...
TRANSCRIPT

Report No. CDOT-2012-3 Final Report
HYDRAULIC EFFICIENCY OF GRATE AND CURB-OPENING INLETS UNDER CLOGGING EFFECT
James C.Y. Guo, Principle Investigator Ken MacKenzie, Project Manager
April 2012 COLORADO DEPARTMENT OF TRANSPORTATION DTD APPLIED RESEARCH AND INNOVATION BRANCH

The contents of this report reflect the views of the
author(s), who is(are) responsible for the facts and
accuracy of the data presented herein. The contents
do not necessarily reflect the official views of the
Colorado Department of Transportation or the
Federal Highway Administration. This report does
not constitute a standard, specification, or regulation.

1. Report No.
CDOT-2012-3 2. Government Accession No.
3. Recipient's Catalog No.
4. Title and Subtitle
HYDRAULIC EFFICIENCY OF GRATE AND CURB-OPENING INLETS UNDER CLOGGING EFFECT
5. Report Date
April 2012
6. Performing Organization Code
7. Author(s)
James C.Y. Guo and Ken MacKenzie
8. Performing Organization Report No.
CDOT-2012-3
9. Performing Organizations
University of Colorado Denver and Urban Drainage and Flood Control District, Denver, Colorado
10. Work Unit No. (TRAIS) 11. Contract or Grant No.
105.81
12. Sponsoring Agency Name and Address
Colorado Department of Transportation - Research 4201 E. Arkansas Ave. Denver, CO 80222
13. Type of Report and Period Covered
14. Sponsoring Agency Code
15. Supplementary Notes
Prepared in cooperation with the US Department of Transportation, Federal Highway Administration 16. Abstract The goal of this project is to investigate the hydraulic efficiencies of Type 13 (bar inlets), Type 16 (vane inlets), and Type R (curb-opening inlets) for street and roadway drainage. Although these inlets have been widely used in many metropolitan areas, the design empirical formulas and coefficients have not been verified. In this study, a flume was constructed in the laboratory to simulate street gutter flows ranging from 6 to 18 inch of flow depths. Type 13, 16, and curb-opening inlet models were built using a 1/3 scale to investigate the depth-flow relations under both on-grade and in-sump conditions. It was found that the flow interception capacity for a sump inlet is determined by either weir or orifice hydraulics, whichever is less for the given flow depth. Two new splash-velocity curves were developed to model the street gutter flow around a Type 13 or 16 inlet on a grade. In this study, a decay-based clogging factor was developed and recommended for the design of a series of inlets. The clogging effect shall be applied to the effective wetted length for an inlet that operates like a weir, or to the effective opening area for an inlet that operates like an orifice in a sump. 17. Implementation
A new chapter of Inlet and Sewer Designs was introduced to the CDOT Hydraulic Design Manual. This design procedure has been coded into the design tool: UDINLET (MS Spread Sheet Model). Visit WWW.UDFCD.org to download. to. Keywords
bar grate inlets, vane grate inlets, curb-opening inlets, combination inlets, decay-based clogging effects
18. Distribution Statement
No restrictions. This document is available to the public through the National Technical Information Service www.ntis.gov or CDOT’s Research Report website http://www.coloradodot.info/programs/research/pdfs
19. Security Classif. (of this report)
Unclassified 20. Security Classif. (of this page)
Unclassified 21. No. of Pages
90 22. Price
Form DOT F 1700.7 (8-72) Reproduction of completed page authorized

ii
ACKNOWLEDGEMENTS
The authors gratefully acknowledge the Colorado Department of Transportation’s financial support during the course of this study. The authors would also like to extend their deep appreciation to the members of the Colorado Department of Transportation Research Study Panel including Amanullah Mommandi (Project Development Branch), Mr. Alfred Gross (R-1 Hydraulics), Mr. Stuart Gardner (R-3 Hydraulics), Aziz Khan (Applied Research and Innovative Branch) and Jake Kononov (Applied Research and Innovative Branch) for their technical assistance, guidance, and review of this document.

iii
HYDRAULIC EFFICIENCY OF GRATE AND CURB-OPENING INLETS
UNDER CLOGGING EFFECT
James C. Y. Guo, Principle Investigator
and Ken MacKenzie, Project Manager
Report No CDOT-2012-3
Prepared for Colorado Department of Transportation
Applied Research and Innovation Branch
Prepared by University of Colorado Denver
and Urban Drainage and Flood Control District
April 2012

iv
TABLE OF CONTENTS 1.0 INTRODUCTION .....................................................................................................................1 1.1 Objectives ...........................................................................................................................1
2.0 LITERATURE REVIEW ..........................................................................................................3
3.0 LABORATORY STREET MODEL .........................................................................................5 3.1 Testing Equipment and Model Scaling ...............................................................................5 3.2 Cases of Street Flow Conditions Tested .............................................................................7 3.3 Model Inlet Construction ..................................................................................................10
4.0 MODEL OPERATION AND TESTING PROCEDURE ........................................................20 4.1 Data Collection .................................................................................................................23
5.0 INLET CLOGGING ................................................................................................................24
6.0 STREET HYDRAULICS ........................................................................................................26
7.0 ON-GRADE GRATE INLET ..................................................................................................28
8.0 ON-GRADE CURB-OPENING (TYPE R) INLET ................................................................32
9.0 IN-SUMP GRATE INLET ......................................................................................................34
10.0 IN-SUMP CURB-OPENING INLET ....................................................................................37
11.0 COMBINATION INLET IN SUMP .....................................................................................40
12.0 CONCLUSIONS AND RECOMMENDATIONS ................................................................42
13.0 REFERENCES ......................................................................................................................43
APPENDIX A: USDCM GRATE INLET SCHEMATICS ..........................................................45
APPENDIX B: ON-GRADE TEST DATA ..................................................................................49
APPENDIX C: SUMP TEST DATA ............................................................................................60
APPENDIX D: INLET CONSTRUCTION DRAWINGS ............................................................63
APPENDIX E: ADDITIONAL PARAMETERS ..........................................................................68
APPENDIX F: CALCULATED EFFICIENCY ............................................................................78

v
LIST OF FIGURES Figure 2.1 Dimensions of Grate and Curb-Opening Inlets ............................................................ 3 Figure 3.1 Laboratory Layout of Model Street and Inlet………………………………….……...5 Figure 3.2 Flume Cross-Section Sketch (prototype scale)…………………………………….….6 Figure 3.3 Curb Inlet Gutter Panel During Fabrication (Type R) ................................................11 Figure 3.4 Combination Inlet Gutter Panel During Fabrication (Type 13 and 16 grates) ...........11 Figure 3.5 Type 13 Grate Photograph .......................................................................................... 12 Figure 3.6 Type 16 Grate During Fabrication ............................................................................. 12 Figure 3.7 Single No. 13 Combination Photograph ..................................................................... 13 Figure 3.8 Double No. 13 Combination Photograph ................................................................... 13 Figure 3.9 Triple No. 13 Combination Photograph ..................................................................... 13 Figure 3.10 Single No. 13 Combination with 4-in. Curb Opening Photograph .......................... 14 Figure 3.11 Single No. 13 Combination with Grate Only Photograph ........................................ 14 Figure 3.12 Single No. 13 Curb Opening Only Photograph ........................................................ 14 Figure 3.13 Single No. 13 Combination Debris Test One Photograph ....................................... 15 Figure 3.14 Single No. 13 Combination Debris Test Two Photograph ....................................... 15 Figure 3.15 Single No. 16 Combination Photograph ................................................................... 15 Figure 3.16 Double No. 16 Combination Photograph ................................................................. 16 Figure 3.17 Triple No. 16 Combination Photograph ................................................................... 16 Figure 3.18 Single No. 16 with 4-in. Curb Opening Photograph ................................................ 16 Figure 3.19 Single No. 16 Grate Only Photograph ...................................................................... 17 Figure 3.20 Single No. 16 Combination Debris Test One Photograph ....................................... 17 Figure 3.21 Single No. 16 Combination Debris Test Two Photograph ....................................... 17 Figure 3.22 R5 Curb Inlet Photograph ......................................................................................... 18 Figure 3.23 R9 Curb Inlet Photograph ......................................................................................... 18 Figure 3.24 R12 Curb Inlet Photograph ....................................................................................... 18 Figure 3.25 R15 Curb Inlet Photograph ....................................................................................... 19 Figure 3.26 R5 with 4-in. Curb Opening Photograph .................................................................. 19 Figure 3.27 R5 with Safety Bar Photograph ................................................................................ 19 Figure 4.1 Laboratory Layout for Street-Inlet Study ................................................................... 20 Figure 4.2 Data Collection Cart (looking upstream) ...................................................................22 Figure 5.1 Decay of Inlet Clogging Percentage ........................................................................... 24 Figure 5.2 Decay of Debris Amount on Grates ........................................................................... 24 Figure 6.1 Illustration of Street Flow ........................................................................................... 26 Figure 7.1 Splash-Over Flow Over Type 13 Grate ...................................................................... 28 Figure 7.2 Predicted vs. Observed Efficiency for Type 13 Combination .................................... 30 Figure 7.3 Predicted vs. Observed Efficiency for Type 16 Combination .................................... 31 Figure 8.1 Predicted vs. Observed Efficiency for Type R Inlet ................................................... 33 Figure 9.1 Comparison Between Observed and Predicted Data for Type 13 Bar Grate ............. 35 Figure 9.2 Comparison Between Observed and Predicted Data for Type 16 Vane Grate ........... 36 Figure 10.1 Horizontal Throat for Type 13 and Type 16 Combo ................................................ 37 Figure 10.2 Comparison Between Observed and Predicted Data for 3-ft Curb Opening ............ 38 Figure 10.3 Comparison Between Observed and Predicted Data for 5-ft Curb Opening ............ 39 Figure 11.1 Observed and Predicted Flow Interception for Type 13 Combination ..................... 41 Figure 11.2 Observed and Predicted Flow Interception for Type 16 Combination ..................... 41

vi
LIST OF TABLES
Table 2.1 Dimensions of Various Types of Inlets Used in This Study...........................................3 Table 2.2 Summary of FHWA Model Characteristics ....................................................................4 Table 3.1 Prototype Dimension ......................................................................................................6 Table 3.2 Scaling Ratios for Geometry, Kinematics and Dynamics ..............................................7 Table 3.3 Test Matrix for 0.33-ft Prototype Flow Depth ................................................................8 Table 3.4 Test Matrix for 0.5-ft Prototype Flow Depth ..................................................................9 Table 3.5 Test Matrix for 1-ft Prototype Flow Depth ...................................................................10 Table 3.6 Additional Sump Tests (prototype scale) .....................................................................10 Table 4.1 Discharge Measurement-Instrument Ranges ................................................................21 Table 4.2 Empirically-Derived Weir Parameters ..........................................................................22 Table 5.1 Clogging Factors for Inlet Design ................................................................................25 Table 7.1 Coefficients for Estimating Splash-Over Velocity .......................................................29 Table 7.2 Sample On-Grade Test Data .........................................................................................30 Table 8.1 New Coefficients for Curb-Opening Inlet Derived in This Study ................................32 Table 9.1 Grate Coefficients for Grate Inlet in Sump ...................................................................34 Table 9.2 Sample Sump Test Data ................................................................................................35 Table 10.1 Coefficients for Curb-Opening Inlet ...........................................................................38

1
1.0 INTRODUCTION As recommended for urban street drainage design by the Colorado Department of Transportation (CDOT) and the Urban Drainage and Flood Control District (UDFCD), Type R curb-opening inlets, Type 13 steel-bar grates, and Type 16 vane grates have been widely installed in the Denver metropolitan area (UDFCD 2001, CDOT 2004). These inlets have not been sufficiently tested for their hydraulic efficiency in flow interception. Current design practices are based upon the empirical formulas documented in “Hydraulic Engineering Circular 22 (HEC22)” (FHWA 2001). Although HEC 22 covers the general types of bar and vane inlets, it provides no specific guidance for these three inlets recommended by the UDFCD and CDOT. A task committee was established to conduct the research study to evaluate the hydraulic efficiency of Type 13, Type 16, and Type R inlets, including a 1/3 scaled street model built at the Hydraulic Laboratory in the Colorado State University (CSU), data analyses and modifications on the design methods performed in the Department of Civil Engineering, U of Colorado Denver, and a new chapter of street hydraulics and inlet sizing prepared for CDOT and UDFCD drainage design manuals. It was concluded that the HEC22 design procedures and formula can fairly represent the hydraulic performance of these three inlets. However, the design parameters used in the empirical formulas must be revised to agree with the laboratory data. 1.1 Objectives Storm runoff is conveyed through the drainage network that consists of streets, gutters, inlets, storm sewer pipes, and treatment facilities. Design methods for grate and curb-opening inlets presented in the Chapter of Street Inlet and Sewer in the Urban Storm Design Criteria Manual (USDCM 2001) generally follow the HEC 22 procedures. Uncertainties in sizing Type 13, 16, and R inlets lie in the empirical parameters associated with orifice and weir flows. In this study, improvements to current design methods are discussed as follows: (1) Although the bar-grate inlets specified in HEC 22 are similar to, but not exactly the same as, Type 13 grates, subtle differences exist in the flow area due to the grate’s geometry can result in miscalculations of hydraulic performances. (2) The vane grate specified in HEC 22 has a different inclined angle from the Type 16 vane grate. A new set of empirical parameters needs to be developed from the laboratory data. (3) A Type R inlet has an inlet depression greater than what is described in HEC 22 and capable of capturing more flow. (4) A combination inlet, that is formed by a grate and a curb-opening inlet used together, presents a complicated hydraulic condition. Guidance provided in the USDCM 2001 is to ignore the curb-opening inlet or the inlet efficiency is solely determined based on the grate capacity. Some degree of conservatism is provided when determining efficiency in this manner, but

2
performance of the combination inlet may be under-predicted when flow submerges the grate portion. (5) Current practice suggests that an inlet be firstly sized without clogging and then its unclogged capacity be reduced by 50% due to clogging. For instance, a 15-ft inlet suggested by the non-clogging design procedure will become a 30-ft inlet. Over the years, this procedure has linearly doubled the number of inlets and results in street inlets excessively long. In this study, the HEC 22 design procedure is modified with a decay-based clogging approach. Hydraulics of street flow may or may not be uniform in any given situation, and the assumption of uniform flow may not be entirely valid. The relevance of uniform flow in analysis of the test data will be examined.

As shownwithin thIn compacombinatplaced onwhere theindicated
Grate Di
Grate LeGrate WCurb OpCurb OpThroat WSteel BarVane ang
(
HEC 22 pInlets Stuinlet equastudy titlGrades” provides
n in Figure 2he gutter widarison, curb-tion inlet is fn a continuoe inlet is inst
d in Table 2.
Table 2imension
ength in ft Width in ft pening Heighpening HorizWidth in ft r Width in ftgle in degree
(a) grate inle
Fig
procedures wudy.” Ultimaations provided “Hydraul(FHWA, 19a summary
2.
2.1, an inlet dth in the stre-opening inleformed by a us sloping sttalled, the fl1.
.1 DimensioTy
BG31
ht in ft zontal
t 0es
et
gure 2.1 Dim
were develoately, it was ded in HEC lic and Safet
977) describeof physical c
0 LITERA
grate is formeet. A curb-oets are less sset of gratestreet while aow intercept
ons of Varioype 13 Bar
Grate
TypVaGr
3.27 3.1.87 1.
0.14 4
(b) cur
mensions of
oped, in part,that FHWA22 and usedty Characteres the modelcharacteristi
3
ATURE R
med by steel opening inleusceptible tos and curb-oan in-sump intion depends
ous Types ofpe 16 ane rate
Typ5-ft Cope
27 587 0.
5o
rb opening in
f Grate and
from a FHWA study that pd in the USDristics of Sell built and thics of the FH
REVIEW
bars and oftt is installedo debris clog
opening unitsnlet is placeds on the inlet
f Inlets Usepe R Curb-ening
Typ3-ftop
5.0
.50 0 0
nlet (c
Curb-Open
WA report tiprovided dat
DCM 2001. Vlected Grate he testing meHWA model.
ten placed hod vertically ogging than gs. An on-grad in a low pot’s length an
d in This Stpe 13/16 t Curb-pening
TyC
3.0
0.50 0.44
c ) combinati
ning Inlets
itled “Bicyclta for develoVolume 1 ofInlets on Co
ethods used. .
orizontally on the curb fagrate inlets. Aade inlet is oint. No mat
nd width as
tudy ype 13
Combo TypCo
3.27 31.87 10.50 00.44 0
0.14 4
ion inlet
le-Safe Grateopment of thef the FHWAontinuous Table 2.2
face. A
tter
pe 16 ombo
.27
.87 0.50 0.4
45o
e e
A

4
Table 2.2 Summary of FHWA Model Characteristics Feature FHWA
Scale (prototype : model) 1:1 Gutter section width (ft) 2 Street section width (ft) 6 Street section length (ft) 60 Approach section length (ft) None Curb height (ft) None Longitudinal slopes (%) 0.5 – 13 Cross slopes (%) 2 - 6.25 Maximum flow (cubic feet per second (cfs)) 5.6 Manning’s roughness 0.016 - 0.017 Surface material 3/4-in. PermaPly® (fiberglass) Inflow control vertical sluice gate Inflow measurement Orifice-Venturi meter Outflow measurement weir / J-hook gage Flow type (uniform or non-uniform) Uniform Inlet length (ft) 2 – 4 Gutter cross slope type Uniform Maximum depth of flow (ft) 0.45
A total of eleven grate inlets were tested for structural integrity and bicycle safety characteristics in the FHWA study. Of these, seven were tested hydraulically. A total of 1,680 tests were carried out at the U. S. Bureau of Reclamation (USBR) Hydraulic Laboratory. Efforts were made to separately measure the gutter-captured flow within the gutter width and the side-captured flow from the traffic lanes. Grate efficiency was defined as the ratio of captured flow to total street flow.

5
3.0 LABORATORY STREET MODEL Testing was performed on three different types of curb and grate inlet from January 2006 through November 2008. Emphasis was placed on collection of curb depth and flow data to facilitate completion of research objectives. Two basic street drainage conditions were tested in this study for a total of 318 tests. First was a sump condition, in which all of the street flow was captured by the inlets. Second was an on-grade condition, in which only a portion of the total street flow was captured and the rest of the flow bypassed the inlets. All three inlets (Type 13, Type 16, and Type R) were tested in the sump and on-grade conditions at three depths. 3.1 Testing Equipment and Model Scaling Model construction and testing was performed at the CSU. A photograph of the laboratory 1/3 scaled street and inlet model is presented in Figure 3.1. The model consisted of a head-box to supply water, a flume section containing the street and inlets, supporting pumps, piping, several flow-measurement devices, a tail-box to capture returning flow, and the supporting superstructure.
Figure 3.1 Laboratory Layout of Model Street and Inlet
Headbox
Sharp-crested Weirs
Pumps
Pipe Network
Tailbox
Inlets
Sump Inlet
Street Section
Flume Section

Containelaboratorpanel, anin. tubulaachievedfrom 0.5%approachscreen wturbulencapproachpresented
ed within thery space allond a sidewalkar steel fram
d by the use o% to 4% lon
h section wasas installed ace and to dish section prod in Table 3.
Fi
Scale (pGutter sStreet seStreet seApproacCurb heLongituCross slMaximuManningSurface Inflow cInflow m
OutflowFlow typInlet lenGutter cMaximu
e flume sectiwed for conk as presente
mework and dof eight scissngitudinally as constructedat the junctio
stribute flow vided stabili.1, which can
igure 3.2 Flu
T
Featuprototype : msection widthection widthection lengthch section le
eight (ft) udinal slopes lopes (%) um flow (cfsg’s roughnesmaterial
control measuremen
w measuremepe (uniform
ngth (ft) cross slope tyum depth of
on were the nstruction of ed in Figuredecked with sor jacks plaand from 1%d to allow floon between tevenly acro
ized flow. Pn be directly
ume Cross-
Table 3.1 Pr
ure model) h (ft) h (ft) h (ft) ength (ft)
(%)
s) ss
nt
ent or non-unifo
ype flow (ft)
6
model streeta flume that3.2. The str1/8-in. thick
aced under th% to 2% laterow to stabilithe headbox
oss the widthPrototype dimy compared t
Section Ske
rototype Dim
3:1 2 16 63 42 0.5 0.5 -1 – 2Over 0.0151/80-butterelectrdifferweir
form) Varie3.3 -comp1
t and inlet cot is shaped wreet section wk sheet steel.he street sectrally. Upstrize after exit
x and the apph of the modemensions anto Table 2.1
etch (protot
mensions
Prototyp
4
r 100 5 -in. steel platrfly valve / dro-magnetic rential press/ point gage
es 9.9
posite
omponents. with two trafwas construc. Slope adjution, and adj
ream of the sting the headproach sectioel. The long
nd characterifor the FHW
type scale)
pe design
te diffuser screflow meter ure meter
Sufficient ffic lanes, a gcted as a 2-b
ustment was justment ranstreet sectiondbox. A diffon to minimig horizontal stics are
WA model.
een or
gutter by-4
nged n, an fuser ize

7
A Froude number based laboratory model was chosen for this study. Table 3.2 provides scaling ratios used in the model. The length scaling ratio was determined to be 3 in prototype to 1 in model. A similar study performed at The Johns Hopkins University identified the minimum reliable scale to be 3 to 1 based on correlation of laboratory and field test data (Li, 1956).
Table 3.2 Scaling Ratios for Geometry, Kinematics and Dynamics
Geometry Scale Ratios
Length, width, and depth (Lr) 3.00
All slopes 1.00
Kinematics Scale Ratios
Velocity (Vr) 1.73
Discharge (Qr) 15.62
Dynamics Scale Ratios
Fluid density 1.00
Manning’s roughness (nr) 1.20
An analysis of Manning’s roughness coefficient was conducted for the model street section to create a surface with the scaled roughness of asphalt. Roughness was established by adding coarse sand to industrial enamel paint (at about 15% by weight), and painting the street section. An average value of 0.013 was determined for the laboratory model, which corresponds to a prototype value of 0.015 (the mean value for asphalt). 3.2 Cases of Street Flow Conditions Tested A test matrix was developed to organize the variation of parameters through three inlet types, two lateral slopes, four longitudinal slopes, three flow depths, and several inlet lengths. Type 13 and 16 combination inlets were configured to 3.3-, 6.6-, and 9.9-ft prototype lengths. Type R curb inlets were configured to 5-, 9-, 12-, and 15-ft prototype lengths. Required flow depths were provided by the UDFCD and consisted of 0.33-, 0.5-, and 1-ft depths at the prototype scale. Rationale for selection of these depths was based on curb height. A depth of 0.33 ft is below a standard 0.5-ft curb, a depth of 0.5 ft is at the curb height, and a depth of 1 ft is above the standard 0.5-ft curb. A total of 318 independent tests resulted from variation of these parameters, and each test matrix is presented in Tables 3.3 through 3.6 by depth of flow. At the request of the UDFCD, twelve additional sump tests and twenty additional debris tests were performed beyond the original 286 tests. Additional debris tests were performed at 4% longitudinal and 1% cross slope to provide data for combination inlets of varying lengths. They were performed for type 1 (flat – 50% coverage) and type 2 (3d – 25% coverage) debris. Additional sump condition tests were performed to provide two additional depths for the Type 13 and 16 combination inlets. Table 3.6 provides a list of these additional sump tests. Tabular versions of each test matrix were developed with test identification (ID) numbers for organizing the results and are presented in Appendices B and C. In the tabular version, each unique slope

8
and inlet configuration was given an ID number (1 through 286), with additional sump tests AT1 through AT12 and additional debris tests AT287 through AT305. Each inlet was tested under two basic conditions. First was the sump condition, where the inlet was placed such that all the flow was captured and none of the flow was bypassed. Roadway cross slope was a constant 1% with no longitudinal slope. Second was an on-grade condition, where some of the flow was captured by the inlets and the remainder was bypassed off the road section. Both the longitudinal and cross slope were varied for the on-grade condition, for a total of six slope configurations ranging from 0.5% to 4% longitudinal and 1% to 2% lateral.
Table 3.3 Test Matrix for 0.33-ft Prototype Flow Depth
Flow Depth = 0.33 ft
TOTAL:
SUMP TEST
ON-GRADE TEST
Longitudinal Slope 0.00% 0.50% 0.50% 2.00% 2.00% 4.00% 4.00%
Cross Slope 1.00% 1.00% 2.00% 1.00% 2.00% 1.00% 2.00%
Single No. 13 1 1 1 1 1 1 1 7 Single No. 13 - Debris Test One 1 1 1 3 Single No. 13 - Debris Test Two 1 1 1 1 4 Double No. 13 - Debris Test One 1 1 Double No. 13 - Debris Test Two 1 1
Triple No. 13 - Debris Test One 1 1 Triple No. 13 - Debris Test Two 1 1
Double No. 13 1 1 1 1 1 1 1 7 Triple No. 13 1 1 1 1 1 1 1 7
Single No. 16 1 1 1 1 1 1 1 7 Single No. 16 - Debris Test One 1 1 1 1 4 Single No. 16 - Debris Test Two 1 1 1 3 Double No. 16 - Debris Test One 1 1 Double No. 16 - Debris Test Two 1 1
Triple No. 16 - Debris Test One 1 1 Triple No. 16 - Debris Test Two 1 1
Double No. 16 1 1 1 1 1 1 1 7 Triple No. 16 1 1 1 1 1 1 1 7
5-ft Type R (R5) 1 1 1 1 1 1 1 7 9-ft Type R (R9) 1 1 1 1 1 1 1 7
12-ft Type R (R12) 1 1 1 1 1 1 1 7 15-ft Type R (R15) 1 1 1 1 1 1 1 7
TOTAL: 10 10 14 10 14 20 14 92
No. 13 – Type 13; No. 16 – Type 16

9
Table 3.4 Test Matrix for 0.5-ft Prototype Flow Depth
Flow Depth = 0.5 ft
TOTAL:
SUMP TEST
ON-GRADE TEST
Longitudinal Slope 0.00% 0.50% 0.50% 2.00% 2.00% 4.00% 4.00%
Cross Slope 1.00% 1.00% 2.00% 1.00% 2.00% 1.00% 2.00%
Single No. 13 1 1 1 1 1 1 1 7 Single No. 13 - Debris Test One 1 1 1 3 Single No. 13 - Debris Test Two 1 1 1 1 4 Double No. 13 - Debris Test One 1 1 Double No. 13 - Debris Test Two 1 1
Triple No. 13 - Debris Test One 1 1 Triple No. 13 - Debris Test Two 1 1
Single No. 13 - Curb Opening Only 1 1 1 1 4 Single No. 13 - Grate Only 1 1 1 1 4
Single No. 13 - Grate & 4-in. Curb Opening 1 1 1 1 4 Double No. 13 1 1 1 1 1 1 1 7 Triple No. 13 1 1 1 1 1 1 1 7
Single No. 16 1 1 1 1 1 1 1 7 Single No. 16 - Debris Test One 1 1 1 1 4 Single No. 16 - Debris Test Two 1 1 1 3 Double No. 16 - Debris Test One 1 1 Double No. 16 - Debris Test Two 1 1
Triple No. 16 - Debris Test One 1 1 Triple No. 16 - Debris Test Two 1 1
Single No. 16 - Grate Only 1 1 1 1 4 Single No. 16 - Grate & 4-in. Curb Opening 1 1 1 1 4
Double No. 16 1 1 1 1 1 1 1 7 Triple No. 16 1 1 1 1 1 1 1 7
5-ft Type R (R5) 1 1 1 1 1 1 1 7 5-ft Type R (R5) - Horizontal Safety Bar 1 1 1 1 4
5-ft Type R (R5) - 4-in. Curb Opening 1 1 1 1 4 9-ft Type R (R9) 1 1 1 1 1 1 1 7
12-ft Type R (R12) 1 1 1 1 1 1 1 7 15-ft Type R (R15) 1 1 1 1 1 1 1 7
TOTAL: 17 10 21 10 21 20 21 120
No. 13 – Type 13; No. 16 – Type 16

10
Table 3.5 Test Matrix for 1-ft Prototype Flow Depth
Flow Depth = 1 ft
TOTAL:
SUMP TEST
ON GRADE TEST
Longitudinal Slope 0.00% 0.50% 0.50% 2.00% 2.00% 4.00% 4.00%
Cross Slope 1.00% 1.00% 2.00% 1.00% 2.00% 1.00% 2.00%
Single No. 13 1 1 1 1 1 1 1 7 Single No. 13 - Curb Opening Only 1 1 1 1 4
Single No. 13 - Grate Only 1 1 1 1 4 Single No. 13 - Grate & 4-in. Curb Opening 1 1 1 1 4
Double No. 13 1 1 1 1 1 1 1 7 Triple No. 13 1 1 1 1 1 1 1 7
Single No. 16 1 1 1 1 1 1 1 7 Single No. 16 - Grate Only 1 1 1 1 4
Single No. 16 - Grate & 4-in. Curb Opening 1 1 1 1 4 Double No. 16 1 1 1 1 1 1 1 7 Triple No. 16 1 1 1 1 1 1 1 7
5-ft Type R 1 1 1 1 1 1 1 7 5-ft Type R - 4-in. Curb Opening 1 1 1 1 4
9-ft Type R 1 1 1 1 1 1 1 7 12-ft Type R 1 1 1 1 1 1 1 7 15-ft Type R 1 1 1 1 1 1 1 7
TOTAL: 16 10 16 10 16 10 16 94
No. 13 – Type 13; No. 16 – Type 16
Table 3.6 Additional Sump Tests (prototype scale)
Flow Depth = 0.75 ft Flow Depth = 1.5 ft
TOTAL:
Longitudinal Slope 0.00% 0.00%
Cross Slope 1.00% 1.00%
Single No. 13 1 1 2 Double No. 13 1 1 2 Triple No. 13 1 1 2 Single No. 16 1 1 2
Double No. 16 1 1 2 Triple No. 16 1 1 2
TOTAL: 6 6 12 No. 13 – Type 13; No. 16 – Type 16
3.3 Model Inlet Construction Curb and gutter sections were fabricated from 1/8-in. thick sheet metal, and construction is shown in Figures 3.3 and 3.4. Removable gutter sections for both the Type R curb inlet and the Type 13 and 16 combination inlets allowed the inlet length to be adjusted. Modular construction methods were utilized to facilitate exchanging curb inlets with combination inlets, which

11
simplified reconfiguration of the model. Construction drawings of each inlet type are presented in Appendix D.
Figure 3.3 Curb Inlet Gutter Panel During Fabrication (Type R)
Figure 3.4 Combination Inlet Gutter Panel During Fabrication (Type 13 and 16 grates)
Adjustable Opening Width
Removable Gutter Sections
Removable Gutter Pans
Note Curb Opening

Solid Plebrass barthe Typeinlet croslengths inremoved out any ir
Figu
Type 13 opening ithe curb gutters in With refeis most sinclined twas reduheight, thcombinatblocked-photogra
exiglas was mr stock were 16 grate wess slope weren each inlet tand relocaterregularities
re 3.5 Type
and 16 inletin addition topening use
n which the i
erence to theimilar to thethroat type.
uced in somehe curb portition inlet waoff complete
aphs provided
milled to proused to fabr
ere constructe built into thtype, the guted within the in the curb,
e 13 Grate P
s were used to the grate. d in the cominvert of the
e figures pree vertical thro
There were e way: the cuion of a comas obstructedely, or a horid in Figures
oduce the Tyricate the Typted of copperhe gutter pantter panels we gutter pane gutter, and
Photograph
in a combinThe Type R
mbination inlcurb inlet w
sented previoat type, whseveral othe
urb portion ombination inled with debrisizontal safet3.7 through
12
ype 13 grate pe 16 grate sr pipe. Trannels. As a re
were built as el frameworkinlet surface
F
nation inlet cR inlet is onlyet configura
was lower tha
iously, the cuhereas the Tyer configuratof a combinaet was blocks, the grate py bar was us
h 3.27 illustra
shown in Fishown in Fig
nsitions fromesult of the nmodular elek. Modelinges.
Figure 3.6 TF
configurationy a curb ope
ation. The man the bottom
urb inlet porype R curb intions in whic
ation inlet waked-off compportion of a csed across thate the inlet
igure 3.5. Cgure 3.6. Cu
m the gutter cneed for variements whichg clay was u
Type 16 GraFabrication
n, in which thening, whichmodel incorpm of the gutt
rtion of the cnlet is most ch the flow aas reduced topletely, the gcombinationhe Type R intypes and co
opper pipe aurved vanes cross slope toiable openinh could be
used to smoo
ate During
here was a ch differed froorated depreter flow line
combination similar to tharea of the ino a “4-in.” grate portionn inlet was nlet. The onfiguration
and on o the
ng
oth-
curb om essed e.
inlet he nlet
n of a
s.

13
Figure 3.7 Single No. 13 Combination Photograph
Figure 3.8 Double No. 13 Combination Photograph
Figure 3.9 Triple No. 13 Combination Photograph

14
Figure 3.10 Single No. 13 Combination with 4-in. Curb Opening Photograph
Figure 3.11 Single No. 13 Combination with Grate Only Photograph
Figure 3.12 Single No. 13 Curb Opening Only Photograph
Note Reducing Plate

15
Figure 3.13 Single No. 13 Combination Debris Test One Photograph
Figure 3.14 Single No. 13 Combination Debris Test Two Photograph
Figure 3.15 Single No. 16 Combination Photograph

16
Figure 3.16 Double No. 16 Combination Photograph
Figure 3.17 Triple No. 16 Combination Photograph
Figure 3.18 Single No. 16 with 4-in. Curb Opening Photograph
Note Reducing Plate

17
Figure 3.19 Single No. 16 Grate Only Photograph
Figure 3.20 Single No. 16 Combination Debris Test One Photograph
Figure 3.21 Single No. 16 Combination Debris Test Two Photograph

18
Figure 3.22 R5 Curb Inlet Photograph
Figure 3.23 R9 Curb Inlet Photograph
Figure 3.24 R12 Curb Inlet Photograph

19
Figure 3.25 R15 Curb Inlet Photograph
Figure 3.26 R5 with 4-in. Curb Opening Photograph
Figure 3.27 R5 with Safety Bar Photograph
Note Reducing Plate
Note Safety Bar

A headbocomponesketch ofsection, tlarge pipprototypepumps dracre ft inback into
4.0 MO
ox was used ents, and a taf the entire mthen exits intes and valvee-scale depthrew water fr
n volume. Lio the sump.
ODEL OPE
to supply wailbox was umodel. Waterto the tailboxes. A 40-horhs, and a 75-rom a sump lined channel
Figure 4.1 L
ERATION
water to the msed to catch r flowed fromx. Two pumrsepower (hp-hp pump walocated benels below the
Laboratory
20
N AND TE
model, a flumflow that by
m the inlet vmps fed watep) pump wasas used for teath the labo
flume conv
y Layout for
ESTING P
me section coypassed the ivalve to the her to the heads used for ththe 1-ft protooratory floor,eyed flow aw
r Street-Inle
PROCEDU
ontained theinlets. Figurheadbox, thrdbox through
he 0.33-ft andotype-scale f, which was way from th
et Study
URE
e street and inre 4.1 providrough the fluh a network d 0.50-ft flow depth. approximate
he tailbox and
nlet des a ume of
Both ely 1 d

21
Flow entering and exiting the model was measured as part of the data-collection process. Flow entered the model headbox through pipes as pressurized flow. Measurement-instrument selection for inflow was based on the anticipated flow required for each test, and the associated pump and pipelines used. Two instruments were used: 1) a differential pressure meter (annubar) manufactured by the Rosemount division of the Emerson Process Management Company, and 2) an electro-magnetic flow meter (mag meter) manufactured by the Endress and Hauser Company. Table 4.1 summarizes flow-measurement characteristics of each instrument.
Table 4.1 Discharge Measurement-Instrument Ranges
Instrument Type
Flow Range (cfs)
Pipeline Pump Accuracy
mag meter 0.13 - 10 18 in. 40 hp 0.5% annubar 6.5 - 15 24 in. 75 hp 2.5%
Outflow from the model flume section was either conveyed through the inlets or bypassed off the road section. In either case, the flow passed through an opening in the tailbox of the flume and into channels below. Flow exiting the channels was measured by either a rectangular weir for bypassed flow or V-notch sharp-crested weir for inlet captured flow. Both weirs were constructed in accordance with published specifications (Bos, 1989; USBR, 2001). Calibration was performed for each weir prior to testing of the model. Rating equations in the form of Eq 4.1 were developed by regression analysis of depth-flow data over the expected operating range of each weir. Coefficients and exponents used in these equations are given in Table 4.2. For slope configurations greater than 0.5% longitudinal, the tailwater depth was noted to rise significantly in the tailbox of the model. When this occurred the weirs were raised and recalibrated:
baHQ (4.1)
where: Q = discharge (cfs); a = coefficient of discharge; H = head above the weir crest (ft); and b = depth exponent.

22
Table 4.2 Empirically-Derived Weir Parameters
Slopes V-notch
Weir Rectangular
Sharp-crested Weir
4% and 2%; 4% and 1%; 2% and 2%; 2% and 1%
a = 2.64 a = 15.78 b = 2.50 b = 1.58
R2 = 0.999 R2 = 0.999
0.5% and 1%; 0.5% and 2% a = 2.52 a = 13.5 b = 2.45 b = 1.35
R2 = 0.999 R2 = 0.999 Flow depth required for each test was measured at the same location roughly 5 prototype feet upstream of the first inlet. This location was chosen to be free of surface curvature from flow being drawn into the inlets, free of ripples generated from the upstream approach transition, and served as a control section to establish the depth and adjust the flow into the model for each test. Depth of flow was measured using a point gage with ±0.001 ft accuracy, which was mounted on a data-collection cart designed to slide along the model and perform other water-surface measurements as well. Figure 4.2 provides a photograph of the data-collection cart. A camera tripod was mounted on the data-collection cart providing one of the three photograph points: 1) an elevated oblique view from the data-collection cart, 2) a view laterally opposite from the inlets, and 3) a plan view from directly above the inlets.
Figure 4.2 Data Collection Cart (looking upstream) Following a standardized testing procedure assured consistency and facilitated data collection by multiple technicians. Prior to testing, the street slope and inlet type were configured. The flow depth was then set on the point gage and the flow into the model was adjusted to contact the point gage. Technicians waited approximately 10 minutes once the target depth was achieved for flow conditions to stabilize. Outflow measurement point gages were checked periodically
Camera Tripod
Point Gage
Tape Measure Used for Longitudinal Positioning

23
during this time until the readings stabilized. Test conditions were then checked and recorded on the data sheet. If the slope and inlet configurations did not change for a subsequent test, a new depth was set on the point gage and the flow adjusted accordingly. If a new slope or inlet configuration was required, the pumps were shut off and the model was reconfigured. If the spread of water did not cover the street section for any given test, the extent of flow was recorded to provide a top width at every longitudinal station. A fixed measuring tape was used to determine longitudinal stations along the flume. Lateral positions across the flume were determined with a measuring tape affixed to the data-collection cart. Both tapes were graduated in tenths of a foot and had ±0.01 ft accuracy. Data collection was documented by completing a data sheet for each test, taking still photographs, and shooting short videos. The data-collection sheet used for all testing is presented in Appendix E. Data collection was comprised of the following information: date, operator name, water temperature, test ID number, start and end times, slope configuration, inlet configuration, discharge and measurement devices used, depth of flow, extent of flow, and flow characteristics. Flow characteristics consisted of any general observations that the operator recorded for a particular test. Typical observations included the condition of flow around the inlets (if waves emanated or splashing occurred), and if possible an approximation of flow percentage passing through each inlet was made. Several measures were taken to maintain data quality. After the testing procedures described above were followed, data were entered into the database by the operator, and then checked by another person for accuracy with the original data sheets. A survey of the model was performed every time the model inlet type was changed. This confirmed that the model was not shifting or settling, and that the slope was accurate to within allowable limits of 0.05% for longitudinal and cross slopes. 4.1 Data Collection A 1/3-scale model of a two-lane street section was constructed in the laboratory. Variations in street longitudinal slope, cross slope, inlet length, and flow depth were accomplished to provide data on captured inlet flow and bypassed street flow. In addition, the spread of flow was measured along the street section. Surface roughness of the prototype was designed to be 0.015, which is the mean value for asphalt. Inflow to the model was measured using either a magnetic flow meter or a differential pressure meter. Outflow from the model was measured using sharp-crested weirs for captured inlet flow and bypassed street flow. Photographs were taken and video recordings were made to facilitate later inspection of flow conditions in the model. From the collected test data, qualitative and quantitative observations will be made for determination of efficiency for each inlet. The complete test data set is presented in Appendices B and C, where it is organized by: test ID number, inlet configuration, slopes, flow depth, total flow, efficiency, top width of flow at the upstream control section, and top width of flow downstream of the inlets. In addition to the laboratory tests, field observations of inlet performance were also conducted during storm events. The records of photos and video clips provide a basis to analyze clogging effects on a single inlet and a series of inlets.

24
5.0 INLET CLOGGING The operation of an Inlet in Figure 5.1 is subject to the clogging due to urban debris that is varied with respect to location and season. To be conservative, a clogging factor of 50% is recommended for a single grate and 10% for a single curb-opening inlet.
Figure 5.1 Decay of Inlet Clogging Percentage For an inlet with multiple units as shown in Figure 5.1, it is observed that the clogging effect decays from the front to the last inlet unit as shown in Figure 5.2. As recommended, the clogging factor, Clog%, decays as the number of inlet units increases (Guo 2006).
Figure 5.2 Decay of Debris Amount on Grates
As a result, the clogging factor for multiple inlets in serial is equal to the total clogging percentage divided by the number of inlet units as (Guo 2000c):
Ni
i
iNg e
N
CCeCeCeeCC
NC
1
1132 .........1 (5.1)
in which Cg = multiple-unit clogging factor, C = single-unit clogging factor, e = decay ratio less than unity, and N = number of inlets. Table 5.1 is the comparison between the observed and recommended clogging factors using e = 0.25 for curb opening inlet and e =0.5 for grate inlet.

25
Table 5.1 Clogging Factors for Inlet Design
Number of Unit Curb Opening Inlet Grate Inlet
Observed Predicted with
e=0.25
Observed Predicted with e=0.5
1.00 0.12 0.12 0.50 0.50 2.00 0.08 0.08 0.35 0.38 3.00 0.05 0.05 0.25 0.29 4.00 0.03 0.04 0.20 0.23
The interception capability of an on-grade inlet is proportional to the inlet wetted length, and an in-sump inlet is proportional to the inlet opening area. Therefore, the effective length of an on-grade inlet is calculated as: LCL ge )1( (5.2)
in which L= total wetted length, Cg= clogging percentage selected for the number of inlet units, and Le = effective (unclogged) length. Similarly, the effective opening area of an in-sump inlet is calculated as: ACA ge )1( (5.3)
in which A = total opening area, and Ae = unclogged opening area.

26
6.0 STREET HYDRAULICS Figure 6.1 illustrates a typical street gutter cross section. Storm water flow carried in a street gutter can be divided into gutter flow and side flow. The gutter flow is the amount of flow carried within the gutter width, W, and the side flow is the amount of flow carried by the water spread, Tx, encroaching into the traffic lanes.
W Tx
QwQx
Side Walk
Y
Emergency Lane
Ds
Street
CrownSxD
Dm
Sw
Tm
Ts
T
Figure 6.1 Illustration of Street Flow In practice, a depression of 2 inches is often introduced at street curb in order to increase the gutter conveyance capacity. As a result, the transverse slope across the gutter width is:
W
DSS s
xw (6.1)
in which Sw = gutter cross slope in ft/ft, W= gutter width of 2 feet, Ds = gutter depression of 2 inches, Sx = street transverse slope. The water depth at the curb face, D, is the sum of the flow depth, Y, and gutter depression, Ds, as illustrated in Figure 6.1. sDYD (6.2) The corresponding water spread for the water depth, D, in the gutter is
ws S
DT (6.3)
For convenience, the total water spread, T, is divided into gutter-flow width, W, and side-flow width, Tx, that can be calculated as:
x
sx S
DDT
(6.4)
Applying the open channel flow theory to the gutter and side flow yields:

27
oxxx STSn
Q 67.267.156.0 (6.5)
ossww SWTTSn
Q ])([56.0 67.267.267.1 (6.6)
in which Qx = side flow in cfs, Qw = gutter flow in cfs within gutter width, W = gutter width which is usually 2 feet wide, Ts = water spread in feet for water depth, D in feet, in the gutter, and n = surface roughness coefficient of 0.016. The total flow, Qs in cfs, on the street is the sum as: wxs QQQ (6.7)
The flow cross sectional area in sq feet for a composite street is calculated as:
2
sWDYTA
(6.8)
The average cross sectional flow velocity, V in fps, is calculated as:
A
QV s (6.9)

28
7.0 ON-GRADE GRATE INLET Storm water carried in a street gutter is divided into the gutter flow that is carried within the gutter width, and the side flow that is spread into the traffic lanes. The ratios of the flow distribution on the street area calculated as:
s
ww Q
QE (7.1)
w
s
xx E
Q
QE 1 (7.2)
in which Ew= ratio of gutter flow, Qw, to total street flow, Qs, and Ex= ratio of side flow, Qx, to street flow. The capacity of an on-grade grate is estimated by the interception percentage. For the side flow, the interception percentage, Rx, is estimated as:
3.2
8.115.01
1
ex
x
LS
VR (7.3)
For the gutter flow, the interception percentage, Rf, depends on the flow splash-over velocity that can be empirically estimated as: eeeo LLLV 32 (7.4)
The coefficients, α, β, γ, ζ are defined in Table 7.1. It is noted that the coefficients for Type 13 and Type 14 grates are derived using the data collected in this study.
Figure 7.1 Splash-Over Flow Over Type 13 Grate

29
Table 7.1 Coefficients for Estimating Splash-Over Velocity
Type of Grate α β γ η Type 13 Bar Grate or Combo* 0 0.583 0.030 0.0001 Type 16 Vane Grate or Combo* 0 0.815 0.074 0.0024 Bar P-1-7/8 2.22 4.03 0.65 0.06 Bar P-1-7/8-4 0.74 2.44 0.27 0.02 Bar P-1-1/8 1.76 3.12 0.45 0.03 45º Bar 0.99 2.64 0.36 0.03 30º Bar 0.51 2.34 0.20 0.01 Reticuline 0.28 2.28 0.18 0.01
* derived from the 1/3 scaled laboratory model The ratio of gutter flow captured by the inlet is expressed as:
of VVR 09.00.1 if V>Vo ; otherwise Rf =1.0 (7.5)
where Rf = ratio of gutter flow captured, V= cross-sectional flow velocity in Eq 6.9, and Vo = splash-over velocity in fps. As a result, the interception capacity for the grate inlet is equal to QERERQRQRQ xxwfxxwfi )( (7.6)
Where Qi = interception capacity in cfs. The hydraulic efficiency for an inlet on grade is defined as:
s
i
Q
QE (7.7)
The carry-over flow, Qco, is the difference between Qs and Qi as: isco QQQ (7.8)
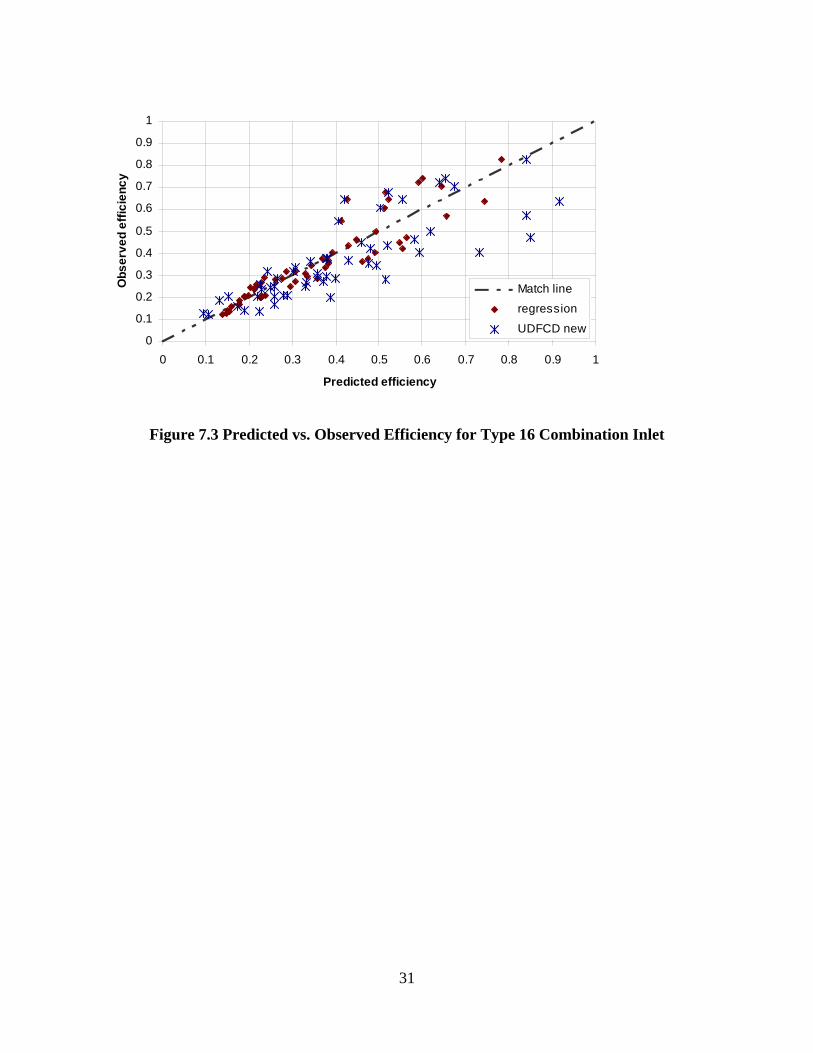
Table 7.2 presents a sample of data collected for the model Type 13 grate placed on a continuous grade. It was found that the HEC 22 method tends to over-predict the capacity of Type 13 grate by an average of 10%. Applying the multiple regression analyses to the data collected from Type 13 grate and Type 13 combination inlet, a set of new coefficients, α, β, γ, ζ, was derived as presented in Table 7.1. Figures 7.2 and 7.3 present good agreement between the observed and predicted hydraulic efficiency using the above design procedure.

30
Table 7.2 Sample On-Grade Test Data
Test ID Number
Configuration
Longitudinal Slope (%)
Cross Slope (%)
Flow Depth (ft)
Prototype Total Flow (cfs)
Efficiency (%)
Top Width at Control (ft)
Top Width Downstream of Inlets (ft)
56 Triple No. 13 0.5 1 0.333 4.4 82.1 15.8 9.0 57 Triple No. 13 0.5 1 0.501 20.6 43.2 18.2 18.2 58 Triple No. 13 0.5 1 0.999 126.6 22.7 18.2 18.2 59 Double No. 13 0.5 1 0.333 4.7 73.3 16.0 10.7 60 Double No. 13 0.5 1 0.501 22.6 35.9 18.2 18.2 61 Double No. 13 0.5 1 0.999 127.8 16.2 18.2 18.2 62 Single No. 13 0.5 1 0.333 4.8 61.3 16.0 15.8 63 Single No. 13 0.5 1 0.501 26.2 23.8 18.2 18.2 64 Single No. 13 0.5 1 0.999 126.4 9.9 18.2 18.2
0
0.1
0.2
0.3
0.4
0.5
0.6
0.7
0.8
0.9
1
0 0.1 0.2 0.3 0.4 0.5 0.6 0.7 0.8 0.9 1
Predicted efficiency
Ob
serv
ed e
ffic
ien
cy
Match line
regression
UDFCD new
Figure 7.2 Predicted vs. Observed Efficiency for Type 13 Combination Inlet
31
0
0.1
0.2
0.3
0.4
0.5
0.6
0.7
0.8
0.9
1
0 0.1 0.2 0.3 0.4 0.5 0.6 0.7 0.8 0.9 1
Predicted efficiency
Ob
se
rve
d e
ffic
ien
cy
Match line
regression
UDFCD new
Figure 7.3 Predicted vs. Observed Efficiency for Type 16 Combination Inlet

32
8.0 ON-GRADE CURB-OPENING (TYPE R) INLET To install a curb opening inlet on a continuous grade, the required curb opening length, Lt, for a complete interception of the design storm runoff, Qs, on the street is computed by:
c
e
bL
aT nS
SNQL
1 (8.1)
wwxe ESSS (8.2)
in which Lt = required length for a 100% runoff interception, So = street longitudinal slope, n = Manning's roughness of 0.016, and Se = equivalent transverse street slope. The analysis of the laboratory data collected in this study leads to a new set of coefficients for Eq 8.1. Table 8.1 presents the improvement to HEC22 procedures.
Table 8.1 New Coefficients for Curb-Opening Inlet Derived in This Study
Coefficients in Eq 8.1 N a b c n Recommended by HEC 22 0.60 0.42 0.30 0.60 0.016 Newly derived in this study 0.38 0.51 0.06 0.46 0.016
Substituting the new coefficients into Eq 8.1 yields:
46.0
06.051.0 138.0
eot nS
SQL (8.3)
The curb-opening inlet shall have a length less than, but close to, Lt. The interception capacity of a curb-opening inlet is calculated as:
80.1
11t
ei L
LQQ (8.4)
in which Qi = inlet capacity, and Le = effective length of curb opening inlet. For the Type R inlet, the HEC 22 method was modified with new coefficients in Eq 8.3. The comparison between observed and predicted hydraulic efficiency is presented in Figure 8.1.

33
0
0.1
0.2
0.3
0.4
0.5
0.6
0.7
0.8
0.9
1
0 0.1 0.2 0.3 0.4 0.5 0.6 0.7 0.8 0.9 1
Predicted efficiency
Ob
serv
ed e
ffic
ien
cy
Match line
Regression
UDFCD new
Figure 8.1 Predicted vs. Observed Efficiency for Type R Inlet

34
9.0 IN-SUMP GRATE INLET As reported (Guo, MacKenzie and Mommandi, 2008), the flow through a sump inlet is varied with respect to the water depth on the grate and continuously changes from weir flow, through mixing flow, to orifice flow when the water becomes deep enough. A grate is formed by steel bars or vanes. Therefore, the original formulas for orifice and weir flows are modified with weir length or area opening ratios as: 2/3)2( DLWCNQ egwww for weir flow through grate (9.1)
gDLWCNQ egooo 2 for orifice flow through grate (9.2)
Where Qw = weir flow in cfs, Qo = orifice flow in cfs, Wg =grate width in feet, Le =effective grate length in feet, D=water depth in feet on street curb, Nw= weir length opening ratio after subtracting steel bar’s width, No = orifice areal opening ratio, Cw = weir discharge coefficient, and Co = orifice discharge coefficient. The transient process between weir and orifice flows is termed mixing flow that is modeled as: owmm QQCQ for mixing flow (9.3)
Where Qm= mixing flow in cfs and Cm = mixing flow coefficient. In practice, for the given water depth, it is suggested that the interception capacity for the in-sump grate be the smallest among the weir, orifice, and mixing flows as: ),,min( omwi QQQQ (9.4)
The recommended coefficients, Cw, Cm, and Co are listed in Table 9.1 as:
Grate Inlet Nw Cw No Co Cm
Type 13 Bar Grate 0.55 2.73 0.44 0.57 0.97 Type 16 Vane Grate 0.62 2.38 0.32 0.61 0.97
Table 9.1 Grate Coefficients for Grate Inlet in Sump
A tabular sample of the sump test data is presented as Table 9.2. All of the flow into the model was captured by the inlets in the sump test condition. The entire sump test data set is included as Appendix C.

35
Table 9.2 Sample Sump Test Data
Test ID Number
Configuration
Longitudinal Slope (%)
Cross Slope (%)
Flow Depth (ft)
Prototype Flow (cfs)
1 Triple No. 13 0 1 0.333 2.5 2 Triple No. 13 0 1 0.501 8.6 3 Triple No. 13 0 1 0.999 42.2 4 Double No. 13 0 1 0.333 2.3 5 Double No. 13 0 1 0.501 7.8 6 Double No. 13 0 1 0.999 27.1 7 Single No. 13 0 1 0.333 2.0 8 Single No. 13 0 1 0.501 5.9 9 Single No. 13 0 1 0.999 15.3
The test data comparing with the HEC 22 procedure and UDINLET computer model are plotted in Figures 9.1 and 9.2 for increasing flow depth for the three inlets tested.
Type 13 Grate in Sump
0.00.20.40.60.81.01.21.41.61.8
0.0 5.0 10.0 15.0 20.0
Flow Interception in cfs
Gu
tter
Dep
th i
n f
eet
Observed Predicted UDINLET
Figure 9.1 Comparison Between Observed and Predicted Data for Type 13 Bar Grate

36
Type 16 Vane Grate in Sump
0.0
0.2
0.4
0.6
0.8
1.0
1.2
1.4
1.6
1.8
0.0 2.0 4.0 6.0 8.0 10.0 12.0
Flow Interception in cfs
Gu
tter
Dep
th i
n f
eet
Observed Predicted UDINLET
Figure 9.2. Comparison Between Observed and Predicted Data for Type 16 Vane Grate

37
10.0 IN-SUMP CURB-OPENING INLET Like a grate inlet, a curb-opening inlet operates like weir, orifice, or mixing flow. The capacity of a 5-ft Type R Inlet is estimated based on its curb opening geometry as: 2/3DLNCQ ewww for weir flow through curb opening (10.1)
)5.0(2)( cceooo HDgHLNCQ for orifice flow through curb opening (D>Hc) (10.2)
Where Hc = height of curb-opening inlet. As illustrated in Figure 10.1, the capacity of a 3-ft curb opening inlet associated with a Type 13 or 16 Combo Inlet is estimated based on its horizontal throat opening geometry as: 2/3DLNCQ ewww for weir flow through curb opening (10.3)
gDHLNCQ weooo 2)( for orifice flow through throat (10.4)
Where Hw = horizontal throat width as shown in Figure 10.1. The standard throat width is 0.44 foot for Type 13 and 16 Combo Inlets.
Figure 10.1 Horizontal Throat for Type 13 and Type 16 Combo The transient process between weir and orifice flows is termed mixing flow that is modeled as: owmm QQCQ for mixing flow through curb opening (10.5)
Where Qm= mixing flow and Cm = mixing flow coefficient. In practice, for the given water depth, it is suggested that the interception capacity of the curb-opening inlet be the smallest among the weir, orifice, and mixing flows as: ),,min( omwi QQQQ (10.6)

38
With the flow data collected from the laboratory model, regression analyses were conducted to produce the best fitted empirical coefficients in Eq’s 10.1 through 10.6. Results are presented in Table 10.1.
Curb-opening Inlet Nw Cw No Co Cm
3-ft Curb Opening Inlet 1.0 2.59 1.0 0.67 0.905-ft Curb Opening Inlet 1.0 3.55 1.0 0.67 0.73
Table 10.1 Coefficients for Curb-Opening Inlet
Figures 10.2 and 10.3 present the performance curves for 3-ft and 5-ft curb opening inlets. A curb opening acts like a side weir. The data reveal that a curb opening is a more efficient weir than the grate because both 3-ft and 5-ft curb opening have a higher value for Cw. In comparison, the HEC-22 procedure overestimates the capacity of a curb-opening inlet when water depth is shallow, and then becomes underestimating when water depth exceeds 7 inches. On the contrary, the proposed new equation agrees with the observed well.
3-ft Curb Opening in Sump
0.0
0.2
0.4
0.6
0.8
1.0
1.2
1.4
1.6
1.8
0.0 2.0 4.0 6.0 8.0 10.0
Flow Interception in cfs
Gu
tter
Dep
th i
n f
eet
Observed Predicted UDINLET
Figure 10.2 Comparison Between Observed and Predicted Data for 3-ft Curb Opening

39
5-ft Curb Opening in Sump
0.0
0.2
0.4
0.6
0.8
1.0
1.2
1.4
1.6
1.8
0.0 2.0 4.0 6.0 8.0 10.0 12.0 14.0 16.0
Flow Interception in cfs
Gu
tter
Dep
th i
n f
eet
Observed Predicted UDINLET
Figure 10.3 Comparison Between Observed and Predicted Data for 5-ft Curb Opening

40
11.0 COMBINATION INLET IN SUMP A combination inlet consists of a horizontal grate placed in the gutter and a vertical curb opening inlet on the curb face. The advantage to adopt a combination inlet is to reduce the risk of being completely clogged by debris. For instance, if the grate becomes clogged, the curb opening remains functional or vice versa. When water flows through a combination inlet, the grate intercepts the shallow flow. As a result, the curb opening will not function until the grate is submerged. Different approaches were developed to size a combination inlet. For instance, it has been recommended that the capacity of a combination inlet be the larger interception between the grate and the curb opening or a reduction on the algebraic sum of the total interception (Guo 1999). However, no clear recommendation has ever been made or verified for such a capacity reduction. In practice, the street flow is first intercepted by a grate as if the curb opening did not exist, and then the remaining flow is applied to the curb opening inlet as if the grate did not exist (USWDCM 2001). Nevertheless, the hydraulics of a combination inlet remains unclear even though hundreds of combination inlets have been installed in metro areas every year. In this study, a new approach was formulated to model the interception capacity of a combination inlet. It is suggested that a reduction factor be applied to the algebraic sum of the total interception as:
cgcgt QQKQQQ (11.1)
Where Qt = interception capacity for combination inlet, Qg = interception for grate, Qc = interception for curb opening, and K= reduction factor. Combination 13 inlet is composed of a horizontal bar grate and a 3-ft long curb opening. Similarly, Combination 16 inlet was formed with a vane grate and 3-ft long curb opening. Having collected several sets of data, the least square method was set up to minimize the squared errors using the reduction factor, K. It was found that K=0.37 for Combination 13 inlet as shown in Figure 11.1, and K=0.21 for Combination 16 inlet as shown in Figure 11.2. A higher reduction factor implies that the higher interference between the grate and the curb opening. For instance, the vane grate is more susceptible to inundation because of its low area-open ratio. As a result, the vane grate is more likely to operate under high water depths or both the vane grate and its curb opening can constructively function together. On the contrary, a bar grate in the Combination 13 inlet can intercept the majority of the gutter flow. Its curb opening is therefore not fully utilized until the bar grate is submerged under an overwhelming inflow. The HEC22 procedure assumes that the grate and curb opening can independently work. As a result, it consistently overestimates the capacity of a combination inlet. In this study, a capacity reduction is introduced to Eq 11.1. Of course, the value of K is a lumped, average parameter representing the range of observed water depths in the laboratory. During the model tests, it was observed that when the grate surface area is subject to a shallow water flow, the curb opening intercepted the flow at its two low corners, or it did not behave as a side weir to collect the flow along its full length. Under a deep water flow, the vortex circulation dominates the flow pattern. As a result, the central portion of the curb opening seems to more actively draw water into the inlet box. Although Eq 11.1 appears simple for use, it best represents the range of the observed data.

41
Type 13 Combo Inlet in Sump
0.0
0.2
0.4
0.6
0.8
1.0
1.2
1.4
1.6
0.0 5.0 10.0 15.0 20.0 25.0
Flow Interception in cfs
Gu
tter
Dep
th in
fee
t
Observed Predicted UDINLET
Figure 11.1 Observed and Predicted Flow Interception for Type 13 Combination Inlet
Type 16 Combo Inlet in Sump
0.0
0.2
0.4
0.6
0.8
1.0
1.2
1.4
1.6
1.8
8.0 12.0 16.0
Flow Interception in cfs
Gu
tte
r D
ep
th in
fe
et
Observed Predicted UDINLET
Figure 11.2 Observed and Predicted Flow Interception for Type 16 Combination Inlet

42
12.0 CONCLUSIONS AND RECOMMENDATIONS
As illustrated in USDCM 2001, the current state-of-the-art methods in determining the inlet efficiency for Type 13, 16, and R inlets have not been sufficiently verified. In this study, physically-meaningful test conditions that are likely to be encountered in the field were reproduced in the laboratory. The data collected and analyzed provided considerable insight to understand the performance of the Type 13, 16, and R inlets under varying hydraulic conditions. It was found that agreement with observed test data was generally poor with a hydraulic efficiency over-predicted by an average of 20% for the Type 13 and 16 inlets and under-predicted by an average of 7% for the Type R inlet. Methods given in the USDCM 2001 have been improved by developing a new set of splash-over velocity coefficients for the Type 13 and 16 combination inlets. This was done by calibrating the HEC 22 formula outlined in the USDCM 2001. A third-order polynomial regression was then fitted to the calculated splash-over velocity data to provide updated coefficients. The splash-over velocity coefficients are reflective of the combination inlet performance, not the grate-only inlet performance, and provide a considerable improvement when comparing with the observed data. Similarly, the existing HEC-22 formula for Type R inlet is improved by the regression analysis using the observed data. The form of the original equation was preserved, and the overall fit to the observed efficiency data was improved considerably with efficiency errors averaging 3.8%. A comparison of on-grade hydraulic efficiency was conducted among a combination inlet, a grate-only inlet, and a curb-only inlet for single Type 13 and 16 configurations. An average difference of 3% efficiency was observed when the combination and the grate-only inlets were compared, and an average difference of 12% efficiency was observed when the combination and curb-only inlets were compared. Vane grate was invented to be safe for bicycles and to be efficient for flow interception. The laboratory data indicate that the interception capacity of a sump vane grate is only 75 to 80% of a bar grate in sump. The width of inclined vanes significantly reduces the area and width opening ratios. As a result, the efficiency of a vane grate is substantially compromised by its safety. In comparison, a combination inlet with a bar grate has a higher reduction factor than that using a vane grate. All cases investigated in the laboratory were conducted under no clogging condition. As recommended, a decay-based clogging factor is applied to the grate area when the grate operates as an orifice or to the wetted perimeter when the grate operates as a weir (Guo 2000C, 2006). The clogging decay coefficients are 0.5 for grate inlet and 0.25 for curb-opening inlet. Lastly, the relevance of uniform flow in the model was examined by repeating the analysis with the observed test data adjusted to conditions of uniform flow. An average difference in hydraulic efficiency is approximately 3%, for all inlets under uniform or non-uniform flow conditions in the model. As a result, it is concluded that the impact of the uniformity of the street flow immediately upstream of the inlet is negligible.

43
13.0 REFERENCES Agrawal, S.K., Henry, J.J., and Mayer, W.E., (1977). "Measurement of Hydroplaning Potential”, Final Report to Pennsylvania Department of Transportation, Report No. FHWA-PA-72-6. Bos, M. G. (1989). Discharge Measurement Structures. Third Edition revised, The Netherlands: Institute for Land Reclamation and Improvement.
Chaudhry, M. H. (2008). Open Channel Flow. Second Edition, New York, NY: Springer.
CDOT (2004). "Hydraulic Design Criteria for Highways", Hydraulic Division, Colorado Department of Transportation (CDOT), Denver, Colorado. Comport, B.C., Thornton C. I., and Cox A., (2009). “Hydraulic Capacity of Grate and Curb Inlets for Urban Storm Drainage”, Engineering Research Center, Colorado State University, Ft. Collins, Colorado. Federal Highway Administration (2001). Hydraulic Engineering Circular No. 22, Second Edition, Urban Drainage Design Manual. Publication FHWA-NHI-01-021, Springfield, VA: U. S. National Technical Information Service. Federal Highway Administration (1977). Hydraulic and Safety Characteristics of Selected Grate Inlets on Continuous Grades, Vol 1. Publication FHWA-RD-77-24, Springfield, VA: U. S. National Technical Information Service. Guo, James C.Y. and McKenzie, K, and Mommandi, A. (2008) “Sump Inlet Hydraulics”, ASCE J. of Hydraulic Engineering, Vol 135, No 1, Nov. Guo, James C.Y. (2006). “Decay-based Clogging Factor for Curb Inlet Design”, Vol 132, No. 11, ASCE J. of Hydraulic Engineering, November. Guo, James C.Y. (2000a). “Street Storm Water Conveyance Capacity,” ASCE J. of Irrigation and Drainage Engineering, Vol 126, No 2, Mar/Apr, Guo, James C.Y. (2000b). “Street Storm Water Storage Capacity”, J. of Water Environment Research, Vol 27, No 6., Sept./Oct. Guo, James C.Y. (2000c). “Design of Grate Inlets with a Clogging Factor,” Advances in Environmental Research, Vol 4, Elsvier Science, Ireland. Guo, James C.Y. (1999). "Sand Recovery for Highway Drainage Designs," ASCE J. of Drainage and Irrigation Engineering, Vol 125, No 6, Nov. Guo, James C.Y. (1998). "Risk-cost Approach to Interim Drainage Structure Designs," ASCE J. of Water Resources Planning and Management, Vol 124, No 6, Nov/Dec.

44
Li, W. H. (1956). Design of Storm-Water Inlets. The Johns Hopkins University, Baltimore, MD. U. S. Bureau of Reclamation (2001). Water Measurement Manual. Third Edition, U. S. Department of the Interior, Denver, CO. UDFCD (2001). Urban Storm Drainage Criteria Design Manual, Volumes 1 and 2, Urban Drainage and Flood Control District, Denver, CO.

45
APPENDIX A: USDCM GRATE INLET SCHEMATICS

46
Figure A-1 CDOT Type 13 Bar Grate

47
Figure A-2 Type 16 Vane Grate

48
Figure A-3 CDOT Type R Curb Opening Inlet

49
APPENDIX B: ON-GRADE TEST DATA

50
On-Grade Test Results All three inlets (Types 13, 16, and R) were tested in the on-grade condition at various slopes.
Table B-1 0.5% and 1% On-Grade Test Data
Test ID Number
Configuration
Longitudinal Slope (%)
Cross Slope (%)
Flow Depth (ft)
Prototype Total Flow (cfs)
Efficiency (%)
Top Width at Control (ft)
Top Width Down-stream of Inlets (ft)
44 15-ft Type R (R15)0.5 1 0.333 4.4 89.3 16.0 10.2 45 15-ft Type R (R15)0.5 1 0.501 20.3 50.8 17.5 16.0 46 15-ft Type R (R15)0.5 1 0.999 128.8 23.6 18.2 18.2 47 12-ft Type R (R12)0.5 1 0.333 3.9 84.0 16.0 10.0 48 12-ft Type R (R12)0.5 1 0.501 21.8 37.9 18.2 18.2 49 12-ft Type R (R12)0.5 1 0.999 126.3 19.5 18.2 18.2 50 9-ft Type R (R9) 0.5 1 0.333 4.2 70.4 16.0 12.0 51 9-ft Type R (R9) 0.5 1 0.501 21.5 34.8 18.2 18.2 52 9-ft Type R (R9) 0.5 1 0.999 127.8 14.5 18.2 18.2 53 5-ft Type R (R5) 0.5 1 0.333 4.4 50.0 16.0 15.6 54 5-ft Type R (R5) 0.5 1 0.501 22.3 24.5 18.2 18.2 55 5-ft Type R (R5) 0.5 1 0.999 125.5 8.3 18.2 18.2 56 Triple No. 13 0.5 1 0.333 4.4 82.1 15.8 9.0 57 Triple No. 13 0.5 1 0.501 20.6 43.2 18.2 18.2 58 Triple No. 13 0.5 1 0.999 126.6 22.7 18.2 18.2 59 Double No. 13 0.5 1 0.333 4.7 73.3 16.0 10.7 60 Double No. 13 0.5 1 0.501 22.6 35.9 18.2 18.2 61 Double No. 13 0.5 1 0.999 127.8 16.2 18.2 18.2 62 Single No. 13 0.5 1 0.333 4.8 61.3 16.0 15.8 63 Single No. 13 0.5 1 0.501 26.2 23.8 18.2 18.2 64 Single No. 13 0.5 1 0.999 126.4 9.9 18.2 18.2 65 Single No. 16 0.5 1 0.333 5.1 60.6 16.0 15.8 66 Single No. 16 0.5 1 0.501 21.4 28.5 18.2 18.2 67 Single No. 16 0.5 1 0.999 126.9 13.5 18.2 18.2 68 Double No. 16 0.5 1 0.333 5.3 70.6 17.0 12.8 69 Double No. 16 0.5 1 0.501 23.2 34.2 18.2 18.2 70 Double No. 16 0.5 1 0.999 124.7 20.9 18.2 18.2 71 Triple No. 16 0.5 1 0.333 4.5 82.8 15.7 9.0 72 Triple No. 16 0.5 1 0.501 23.7 40.1 18.2 18.2 73 Triple No. 16 0.5 1 0.999 125.8 26.9 18.2 18.2

51
Table B-2 0.5% and 2% On-Grade Test Data
Test ID Number
Configuration
LongitudinalSlope (%)
Cross Slope (%)
Flow Depth (ft)
Prototype Total Flow (cfs)
Efficiency (%)
Top Width at Control (ft)
Top Width Down-stream of Inlets (ft)
74 Triple No. 16 0.5 2 0.333 3.4 63.6 14.0 13.6 75 Triple No. 16 0.5 2 0.501 11.2 47.2 18.2 13.8 76 Triple No. 16 0.5 2 0.999 93.8 28.2 18.2 18.2 77 Double No. 16 0.5 2 0.333 3.3 57.1 14.0 13.4 78 Double No. 16 0.5 2 0.501 11.2 40.3 18.2 14 79 Double No. 16 0.5 2 0.999 94.5 19.8 18.2 18.2 80 Single No. 16 0.5 2 0.333 3.7 50.0 14.0 13.6 81 Single No. 16 0.5 2 0.501 11.5 35.1 18.2 14 82 Single No. 16 0.5 2 0.999 95.6 17.0 18.2 18.2 83 Single No. 16, Grate only 0.5 2 0.501 11.4 35.6 18.2 13.9 84 Single No. 16, Grate only 0.5 2 0.999 94.3 14.9 18.2 18.2 85 Single No. 16, grate and 4-in. opening 0.5 2 0.501 11.2 34.7 18.2 14 86 Single No. 16, grate and 4-in. opening 0.5 2 0.999 95.4 16.2 18.2 18.2 87 Single No. 16, Debris Test 1 0.5 2 0.333 3.4 50.0 14.0 13.4 88 Single No. 16, Debris Test one 0.5 2 0.501 10.9 34.3 18.2 13.9 89 Single No. 16, Debris Test two 0.5 2 0.333 3.3 47.6 14.0 13.6 90 Single No. 16, Debris Test two 0.5 2 0.501 10.9 32.9 18.2 13.9 91 Single No. 13 0.5 2 0.333 3.0 63.2 12.0 13.4 92 Single No. 13 0.5 2 0.501 10.1 38.5 18.2 18.2 93 Single No. 13 0.5 2 0.999 95.1 13.1 18.2 18.2 94 Single No. 13, Debris Test one 0.5 2 0.333 3.7 45.8 14.0 13.6 95 Single No. 13, Debris Test one 0.5 2 0.501 11.8 32.9 18.2 14 96 Single No. 13, Debris Test two 0.5 2 0.333 3.4 54.5 14.0 13.5 97 Single No. 13, Debris Test two 0.5 2 0.501 12.0 33.8 14.0 13.7 98 Single No. 13, Grate only 0.5 2 0.501 10.4 34.3 18.2 13.9 99 Single No. 13, Grate only 0.5 2 0.999 93.2 11.0 18.2 18.2 100 Single No. 13, Grate and 4-in. Opening 0.5 2 0.501 11.2 34.7 18.2 13.9 101 Single No. 13, Grate and 4-in. Opening 0.5 2 0.999 94.3 12.7 18.2 18.2 102 Single No. 13, Curb opening only 0.5 2 0.501 11.2 23.6 18.2 14 103 Single No. 13, Curb opening only 0.5 2 0.999 94.3 7.1 18.2 18.2 104 Double No. 13 0.5 2 0.333 3.3 61.9 14.0 13.3 105 Double No. 13 0.5 2 0.501 11.2 44.4 18.2 18.2 106 Double No. 13 0.5 2 0.999 98.2 20.5 18.2 18.2 107 Triple No. 13 0.5 2 0.333 3.6 73.9 14.0 13.3 108 Triple No. 13 0.5 2 0.501 13.4 50.0 18.2 18.2 109 Triple No. 13 0.5 2 0.999 108.3 43.3 18.2 18.2 110 5-ft Type R (R5) 0.5 2 0.333 3.0 57.9 14.0 13.3 111 5-ft Type R (R5) 0.5 2 0.501 11.1 39.4 18.2 13.8 112 5-ft Type R (R5) 0.5 2 0.999 93.2 11.7 18.2 18.2 113 5-in. Type R (R5), w/ 4-in. Curb Opening 0.5 2 0.501 11.2 38.9 18.2 13.8

52
Test ID Number
Configuration
LongitudinalSlope (%)
Cross Slope (%)
Flow Depth (ft)
Prototype Total Flow (cfs)
Efficiency (%)
Top Width at Control (ft)
Top Width Down-stream of Inlets (ft)
114 5-in. Type R (R5), w/ 4-in. Curb Opening 0.5 2 0.999 94.3 9.8 18.2 18.2 115 5-ft Type R (R5), w/Horizontal Safety Bar0.5 2 0.501 11.1 39.4 18.2 13.8 116 9-ft Type R (R9) 0.5 2 0.333 3.1 65.0 14.0 13.1 117 9-ft Type R (R9) 0.5 2 0.501 11.2 47.2 18.2 13.7 118 9-ft Type R (R9) 0.5 2 0.999 93.8 19.3 18.2 18.2 119 12-ft Type R (R12) 0.5 2 0.333 2.8 83.3 14.0 13.1 120 12-ft Type R (R12) 0.5 2 0.501 10.9 52.9 18.2 13.7 121 12-ft Type R (R12) 0.5 2 0.999 93.8 25.4 18.2 18.2 122 15-ft Type R (R15) 0.5 2 0.333 3.3 90.5 14.0 13 123 15-ft Type R (R15) 0.5 2 0.501 10.9 60.0 18.2 13.6 124 15-ft Type R (R15) 0.5 2 0.999 94.3 30.7 18.2 18.2

53
Table B-3 2% and 1% On-Grade Test Data
Test ID Number
Configuration
Longitudinal Slope (%)
Cross Slope (%)
Flow Depth (ft)
Prototype Total Flow (cfs)
Efficiency (%)
Top Width at Control (ft)
Top Width Down-stream of Inlets (ft)
125 15-ft Type R (R15) 2 1 0.333 14.8 44.2 18.2 16 126 15-ft Type R (R15) 2 1 0.501 33.5 30.2 18.2 18.2 127 15-ft Type R (R15) 2 1 0.999 178.5 17.6 18.2 18.2 128 12-ft Type R (R12) 2 1 0.333 13.4 43.0 18.2 16 129 12-ft Type R (R12) 2 1 0.501 32.9 27.0 18.2 18.2 130 12-ft Type R (R12) 2 1 0.999 176.1 14.7 18.2 18.2 131 9-ft Type R (R9) 2 1 0.333 13.4 36.0 18.2 16 132 9-ft Type R (R9) 2 1 0.501 29.6 22.6 18.2 18.2 133 9-ft Type R (R9) 2 1 0.999 173.0 11.4 18.2 18.2 134 5-ft Type R (R9) 2 1 0.333 13.1 25.0 18.2 16 135 5-ft Type R (R9) 2 1 0.501 28.4 16.5 18.2 18.2 136 5-ft Type R (R9) 2 1 0.999 179.0 7.6 18.2 18.2 137 Triple No. 16 2 1 0.333 13.2 44.7 18.2 16 138 Triple No. 16 2 1 0.501 39.9 30.9 18.2 18.2 139 Triple No. 16 2 1 0.999 155.1 23.6 18.2 18.2 140 Double No. 16 2 1 0.333 14.7 36.2 18.2 16 141 Double No. 16 2 1 0.501 32.7 27.1 18.2 18.2 142 Double No. 16 2 1 0.999 177.1 18.7 18.2 18.2 143 Single No. 16 2 1 0.333 15.3 28.6 18.2 16 144 Single No. 16 2 1 0.501 34.0 20.6 18.2 18.2 145 Single No. 16 2 1 0.999 176.6 12.3 18.2 18.2 146 Single No. 13 2 1 0.333 15.9 27.5 18.2 16 147 Single No. 13 2 1 0.501 33.7 20.4 18.2 18.2 148 Single No. 13 2 1 0.999 166.6 9.4 18.2 18.2 149 Double No. 13 2 1 0.333 14.3 33.7 18.2 16 150 Double No. 13 2 1 0.501 33.7 23.6 18.2 18.2 151 Double No. 13 2 1 0.999 176.6 13.3 18.2 18.2 152 Triple No. 13 2 1 0.333 13.1 42.9 18.2 16 153 Triple No. 13 2 1 0.501 31.0 28.6 18.2 18.2 154 Triple No. 13 2 1 0.999 177.7 17.7 18.2 18.2

54
Table B-4 2% and 2% On-Grade Test Data
Test ID Number
Configuration
Longitudinal Slope (%)
Cross Slope (%)
Flow Depth (ft)
Prototype Total Flow (cfs)
Efficiency (%)
Top Width at Control (ft)
Top Width Down-stream of Inlets (ft)
155 Triple No. 13 2 2 0.333 7.8 74.0 16.0 8.3 156 Triple No. 13 2 2 0.501 22.1 43.7 18.2 18.2 157 Triple No. 13 2 2 0.999 163.2 19.1 18.2 18.2 158 Double No. 13 2 2 0.333 8.1 63.5 16.0 8.3 159 Double No. 13 2 2 0.501 23.4 34.7 18.2 18.2 160 Double No. 13 2 2 0.999 161.3 14.3 18.2 18.2 161 Single No. 13 2 2 0.333 7.8 50.0 14.8 9 162 Single No. 13 2 2 0.501 24.8 23.9 18.2 18.2 163 Single No. 13 2 2 0.999 155.9 8.9 18.2 18.2 164 Single No. 13, Debris Test one 2 2 0.333 7.3 40.4 14.0 8.3 165 Single No. 13, Debris Test one 2 2 0.501 24.0 17.5 18.2 18.2 166 Single No. 13, Debris Test two 2 2 0.333 7.2 47.8 14.0 8.3 167 Single No. 13, Debris Test two 2 2 0.501 24.0 19.5 18.2 18.2 168 Single No. 13, Grate Only 2 2 0.501 23.2 19.5 18.2 18.2 169 Single No. 13, Grate Only 2 2 0.999 154.3 6.6 18.2 18.2 170 Single No. 13, Grate and 4-in. Opening 2 2 0.501 22.3 25.2 18.2 15.8 171 Single No. 13, Grate and 4-in. Opening 2 2 0.999 164.1 8.2 18.2 18.2 172 Single No. 13, Curb opening only 2 2 0.501 24.2 9.7 18.2 18.2 173 Single No. 13, Curb opening only 2 2 0.999 155.9 3.7 18.2 18.2 174 Single No. 16 2 2 0.333 7.9 54.9 14.0 8.6 175 Single No. 16 2 2 0.501 22.3 31.5 18.2 15.6 176 Single No. 16 2 2 0.999 162.9 12.6 18.2 18.2 177 Single No. 16, Grate only 2 2 0.501 22.9 27.2 18.2 15.7 178 Single No. 16, Grate only 2 2 0.999 162.9 10.3 18.2 18.2 179 Single No. 16, Grate and 4-in. Opening 2 2 0.501 22.3 28.7 18.2 18.2 180 Single No. 16, Grate and 4-in. Opening 2 2 0.999 164.1 11.5 18.2 18.2 181 Single No. 16, Debris Test one 2 2 0.333 8.1 53.8 14.0 8.9 182 Single No. 16, Debris Test one 2 2 0.501 24.0 27.3 18.2 18.2 183 Single No. 16, Debris Test two 2 2 0.333 8.4 51.9 14.0 8.9 184 Single No. 16, Debris Test two 2 2 0.501 24.9 25.6 18.2 18.2 185 Double No. 16 2 2 0.333 7.9 64.7 14.0 8.3 186 Double No. 16 2 2 0.501 23.7 36.8 18.2 18.2 187 Double No. 16 2 2 0.999 163.7 20.3 18.2 18.2 188 Triple No. 16 2 2 0.333 8.4 72.2 14.0 8.3 189 Triple No. 16 2 2 0.501 22.6 46.2 18.2 18.2 190 Triple No. 16 2 2 0.999 162.9 25.7 18.2 18.2 191 5-ft Type R (R5) 2 2 0.333 7.3 38.3 17.8 11.3 192 5-ft Type R (R5) 2 2 0.501 22.9 18.4 18.2 18.2 193 5-ft Type R (R5) 2 2 0.999 166.0 7.1 18.2 18.2 194 5-ft Type R (R5), w/ 4-in. Curb Opening 2 2 0.999 166.8 5.4 18.2 18.2

55
Test ID Number
Configuration
Longitudinal Slope (%)
Cross Slope (%)
Flow Depth (ft)
Prototype Total Flow (cfs)
Efficiency (%)
Top Width at Control (ft)
Top Width Down-stream of Inlets (ft)
195 5-ft Type R (R5), w/ 4-in. Curb Opening 2 2 0.501 22.8 18.5 18.2 18.2 196 5-ft Type R (R5), w/Horizontal Safety Bar2 2 0.501 23.1 18.2 18.2 18.2 197 9-ft Type R (R9) 2 2 0.333 6.2 65.0 11.0 6.8 198 9-ft Type R (R9) 2 2 0.501 21.8 33.6 18.2 14.3 199 9-ft Type R (R9) 2 2 0.999 166.0 11.6 18.2 18.2 200 12-ft Type R (R12) 2 2 0.333 7.5 70.8 14.0 9.8 201 12-ft Type R (R12) 2 2 0.501 21.7 42.4 18.2 15.8 202 12-ft Type R (R12) 2 2 0.999 166.8 15.2 18.2 18.2 203 15-ft Type R (R15) 2 2 0.333 7.0 84.4 14.0 8.3 204 15-ft Type R (R15) 2 2 0.501 21.5 48.6 18.2 15.8 205 15-ft Type R (R15) 2 2 0.999 166.8 18.8 18.2 18.2

56
Table B-5 4% and 1% On-Grade Test Data
Test ID Number
Configuration
Longitudinal Slope (%)
Cross Slope (%)
Flow Depth (ft)
Prototype Total Flow (cfs)
Efficiency (%)
Top Width at Control (ft)
Top Width Down-stream of Inlets (ft)
206 15-ft Type R (R15) 4 1 0.333 13.1 44.0 18.2 16 207 15-ft Type R (R15) 4 1 0.501 38.3 26.8 18.2 18.2 208 15-ft Type R (R15) 4 1 0.999 143.4 18.6 18.2 18.2 209 12-ft Type R (R12) 4 1 0.333 12.6 42.0 18.2 16 210 12-ft Type R (R12) 4 1 0.501 38.3 23.6 18.2 18.2 211 12-ft Type R (R12) 4 1 0.999 152.9 14.9 18.2 18.2 212 9-ft Type R (R9) 4 1 0.333 13.9 34.8 18.2 16 213 9-ft Type R (R9) 4 1 0.501 38.2 18.8 18.2 18.2 214 9-ft Type R (R9) 4 1 0.999 141.5 11.7 18.2 18.2 215 5-ft Type R (R5) 4 1 0.333 13.7 21.6 18.2 16 216 5-ft Type R (R5) 4 1 0.501 38.2 11.4 18.2 18.2 217 5-ft Type R (R5) 4 1 0.999 140.3 6.9 18.2 18.2 218 Triple No. 16 4 1 0.333 12.6 42.0 18.2 16 219 Triple No. 16 4 1 0.501 38.2 29.4 18.2 18.2 220 Triple No. 16 4 1 0.999 145.7 24.8 18.2 18.2 221 Double No. 16 4 1 0.333 13.2 37.6 18.2 16 222 Double No. 16 4 1 0.501 36.6 25.1 18.2 18.2 223 Double No. 16 4 1 0.999 145.0 20.4 18.2 18.2 224 Single No. 16 4 1 0.333 13.1 33.3 18.2 16 225 Single No. 16 4 1 0.501 37.9 20.2 18.2 18.2 226 Single No. 16 4 1 0.999 141.2 14.0 18.2 18.2 227 Single No. 13 4 1 0.333 12.9 25.3 18.2 16 228 Single No. 13 4 1 0.501 37.7 12.8 18.2 18.2 229 Single No. 13 4 1 0.999 142.6 8.4 18.2 18.2 230 Double No. 13 4 1 0.333 13.2 37.6 18.2 16 231 Double No. 13 4 1 0.501 36.6 21.3 18.2 18.2 232 Double No. 13 4 1 0.999 138.7 13.5 18.2 18.2 233 Triple No. 13 4 1 0.333 12.6 40.7 18.2 16 234 Triple No. 13 4 1 0.501 38.2 24.9 18.2 18.2 235 Triple No. 13 4 1 0.999 146.8 17.9 18.2 18.2

57
Table B-6 4% and 2% On-Grade Test Data
Test ID Number
Configuration
LongitudinalSlope (%)
Cross Slope (%)
Flow Depth (ft)
Prototype Total Flow (cfs)
Efficiency (%)
Top Width at Control (ft)
Top Width Down-stream of Inlets (ft)
236 Triple No. 13 4 2 0.333 8.4 74.1 15.5 7.7 237 Triple No. 13 4 2 0.501 25.7 42.4 18.2 14.3 238 Triple No. 13 4 2 0.999 128.6 20.5 18.2 18.2 239 Double No. 13 4 2 0.333 8.3 66.0 15.5 7.8 240 Double No. 13 4 2 0.501 26.0 32.9 18.2 14.3 241 Double No. 13 4 2 0.999 127.8 15.9 18.2 18.2 242 Single No. 13 4 2 0.333 9.0 43.1 15.5 7.7 243 Single No. 13 4 2 0.501 27.3 20.6 18.2 13.7 244 Single No. 13 4 2 0.999 129.7 9.5 18.2 18.2 245 Single No. 13, Debris Test one 4 2 0.333 8.6 34.5 16.0 8.6 246 Single No. 13, Debris Test one 4 2 0.501 26.5 15.9 17.5 14.3 247 Single No. 13, Debris Test two 4 2 0.333 8.4 40.7 16.0 8 248 Single No. 13, Debris Test two 4 2 0.501 27.1 16.7 18.2 14.3 249 Single No. 13, Curb opening only 4 2 0.501 26.5 9.4 18.2 14.3 250 Single No. 13, Curb opening only 4 2 0.999 119.2 4.7 18.2 18.2 251 Single No. 13, Grate Only 4 2 0.501 21.8 19.3 18.2 9.8 252 Single No. 13, Grate Only 4 2 0.999 117.7 6.5 18.2 18.2 253 Single No. 13, Grate and 4-in. Opening 4 2 0.501 24.5 21.7 18.2 14.3 254 Single No. 13, Grate and 4-in. Opening 4 2 0.999 113.3 9.9 18.2 18.2 255 Single No. 16, Grate and 4-in. Opening 4 2 0.501 28.2 31.5 18.2 14.3 256 Single No. 16, Grate and 4-in. Opening 4 2 0.999 123.1 15.3 18.2 18.2 257 Single No. 16, Grate only 4 2 0.501 30.4 28.7 18.2 12.8 258 Single No. 16, Grate only 4 2 0.999 133.4 12.7 18.2 18.2 259 Single No. 16, Debris Test one 4 2 0.333 8.1 55.8 18.2 7.4 260 Single No. 16, Debris Test one 4 2 0.501 26.5 25.9 18.2 14.3 261 Single No. 16, Debris Test two 4 2 0.333 8.1 48.1 18.2 8 262 Single No. 16, Debris Test two 4 2 0.501 26.8 17.4 18.2 14.3 263 Single No. 16 4 2 0.333 7.5 64.6 14.6 7.8 264 Single No. 16 4 2 0.501 28.1 31.7 18.2 14.3 265 Single No. 16 4 2 0.999 129.4 15.7 18.2 18.2 266 Double No. 16 4 2 0.333 8.7 67.9 14.6 7.8 267 Double No. 16 4 2 0.501 26.5 37.6 18.2 14.3 268 Double No. 16 4 2 0.999 130.9 24.6 18.2 18.2 269 Triple No. 16 4 2 0.333 8.4 74.1 14.6 7.7 270 Triple No. 16 4 2 0.501 25.7 43.6 18.2 14.3 271 Triple No. 16 4 2 0.999 127.8 29.0 18.2 18.2 272 5-ft Type R (R5) 4 2 0.333 8.1 34.6 16.0 8.6 273 5-ft Type R (R5) 4 2 0.501 26.7 17.0 18.2 14.3 274 5-ft Type R (R5) 4 2 0.999 118.9 7.9 18.2 18.2 275 5-ft Type R (R5), w/ 4-in. Curb Opening 4 2 0.501 27.4 16.5 18.2 14.3

58
Test ID Number
Configuration
LongitudinalSlope (%)
Cross Slope (%)
Flow Depth (ft)
Prototype Total Flow (cfs)
Efficiency (%)
Top Width at Control (ft)
Top Width Down-stream of Inlets (ft)
276 5-ft Type R (R5), w/ 4-in. Curb Opening 4 2 0.999 128.6 6.2 18.2 18.2 277 5-ft Type R (R5), w/Horizontal Safety Bar4 2 0.501 26.7 16.4 18.2 14.3 278 9-ft Type R (R9) 4 2 0.333 7.9 62.7 16.0 8.6 279 9-ft Type R (R9) 4 2 0.501 25.9 30.1 18.2 14.3 280 9-ft Type R (R9) 4 2 0.999 117.7 13.2 18.2 18.2 281 12-ft Type R (R12) 4 2 0.333 8.7 69.6 16.0 8 282 12-ft Type R (R12) 4 2 0.501 25.3 38.3 18.2 14.3 283 12-ft Type R (R12) 4 2 0.999 113.8 18.2 18.2 18.2 284 15-ft Type R (R15) 4 2 0.333 7.8 80.0 16.0 7.7 285 15-ft Type R (R15) 4 2 0.501 23.4 46.0 18.2 14.3 286 15-ft Type R (R15) 4 2 0.999 123.1 21.3 18.2 18.2

59
Table B-7 Additional Debris Tests (4% and 1% on-grade)
Test ID Number*
Configuration**
LongitudinalSlope (%)
Cross Slope (%)
Flow Depth (ft)
Prototype Total Flow (cfs)
Efficiency (%)
Top Width at Control (ft)
Top Width Down-stream of Inlets (ft)
AT287 Single No. 13 - 25% flat 4 1 0.333 14.50 21.51 18.2 16.0 AT288 Single No. 13 - 25% flat 4 1 0.501 38.03 11.48 18.2 18.2 AT291 Double No. 13 - 25% flat 4 1 0.333 14.65 27.66 18.2 16.0 AT293 Double No. 13 - 25% flat 4 1 0.501 38.81 18.88 18.2 18.2 AT303 Triple No. 13 - 25% flat 4 1 0.333 14.34 40.22 18.2 16.0 AT306 Triple No. 13 - 25% flat 4 1 0.501 37.57 24.90 18.2 18.2 245 Single No. 13 - 50% flat 4 1 0.333 8.57 34.55 18.2 16.0 246 Single No. 13 - 50% flat 4 1 0.501 26.50 15.88 18.2 18.2 AT295 Double No. 13 - 50% flat 4 1 0.333 14.50 33.33 18.2 16.0 AT297 Double No. 13 - 50% flat 4 1 0.501 38.35 17.48 18.2 18.2 AT300 Triple No. 13 - 50% flat 4 1 0.333 14.65 39.36 18.2 16.0 AT301 Triple No. 13 - 50% flat 4 1 0.501 38.03 24.59 18.2 18.2 261 Single No. 16 - 25% 3d 4 1 0.333 8.11 48.08 18.2 16.0 262 Single No. 16 - 25% 3d 4 1 0.501 26.81 17.44 18.2 18.2 AT296 Double No. 16 - 25% 3d 4 1 0.333 14.34 34.78 18.2 16.0 AT298 Double No. 16 - 25% 3d 4 1 0.501 38.03 16.39 18.2 18.2 AT299 Triple No. 16 - 25% 3d 4 1 0.333 14.65 36.17 18.2 16.0 AT302 Triple No. 16 - 25% 3d 4 1 0.501 37.88 21.40 18.2 18.2 AT289 Single No. 16 - 50% 3d 4 1 0.333 14.19 27.47 18.2 16.0 AT290 Single No. 16 - 50% 3d 4 1 0.501 38.03 11.89 18.2 18.2 AT292 Double No. 16 - 50% 3d 4 1 0.333 14.65 34.04 18.2 16.0 AT294 Double No. 16 - 50% 3d 4 1 0.501 38.50 16.60 18.2 18.2 AT304 Triple No. 16 - 50% 3d 4 1 0.333 14.34 35.87 18.2 16.0 AT305 Triple No. 16 - 50% 3d 4 1 0.501 37.72 20.66 18.2 18.2 *AT – additional test **flat – type 1 debris; 3d – type 2 debris

60
APPENDIX C: SUMP TEST DATA

61
Sump Test Data All three inlets (Types 13, 16, and R) were tested in the sump condition.
Table C-1 Sump Test Data
Test ID Number
Configuration
Longitudinal Slope (%)
Cross Slope (%)
Flow Depth (ft)
Prototype Flow (cfs)
1 Triple No. 13 0 1 0.333 2.5 2 Triple No. 13 0 1 0.501 8.6 3 Triple No. 13 0 1 0.999 42.2 4 Double No. 13 0 1 0.333 2.3 5 Double No. 13 0 1 0.501 7.8 6 Double No. 13 0 1 0.999 27.1 7 Single No. 13 0 1 0.333 2.0 8 Single No. 13 0 1 0.501 5.9 9 Single No. 13 0 1 0.999 15.3 10 Single No. 13, Curb opening only 0 1 0.501 5.1 11 Single No. 13, Curb opening only 0 1 0.999 6.1 12 Single No. 13, Grate only 0 1 0.501 10.3 13 Single No. 13, Grate only 0 1 0.999 11.4 14 Single No. 13, w/ 4-in. opening 0 1 0.501 5.8 15 Single No. 13, w/ 4-in. opening 0 1 0.999 15.1 16 Single No. 16, Grate only 0 1 0.501 3.6 17 Single No. 16, Grate only 0 1 0.999 13.7 18 Single No. 16, w/ 4-in. opening 0 1 0.501 5.5 19 Single No. 16, w/ 4-in. opening 0 1 0.999 7.5 20 Single No. 16 0 1 0.333 2.3 21 Single No. 16 0 1 0.501 6.2 22 Single No. 16 0 1 0.999 13.9 23 Double No. 16 0 1 0.333 2.5 24 Double No. 16 0 1 0.501 7.6 25 Double No. 16 0 1 0.999 26.5 26 Triple No. 16 0 1 0.333 2.8 27 Triple No. 16 0 1 0.501 8.4 28 Triple No. 16 0 1 0.999 37.4 29 5-ft Type R (R5) 0 1 0.333 2.2 30 5-ft Type R (R5) 0 1 0.501 7.3 31 5-ft Type R (R5) 0 1 0.999 12.6
32 5-ft Type R (R5), w/ 4-in. Curb Opening 0 1 0.501 6.4
33 5-ft Type R (R5), w/ 4-in. Curb Opening 0 1 0.999 8.9
34 5-ft Type R (R5), Horizontal Safety Bar0 1 0.501 7.3 35 9-ft Type R (R9) 0 1 0.333 2.5 36 9-ft Type R (R9) 0 1 0.501 8.7 37 9-ft Type R (R9) 0 1 0.999 24.2 38 12-ft Type R (R12) 0 1 0.333 2.8 39 12-ft Type R (R12) 0 1 0.501 10.0 40 12-ft Type R (R12) 0 1 0.999 32.9 41 15-ft Type R (R15) 0 1 0.333 2.8 42 15-ft Type R (R15) 0 1 0.501 10.1 43 15-ft Type R (R15) 0 1 0.999 42.1

62
For the additional sump tests only the Type 13 and 16 were tested at two additional flow depths (0.75 and 1.5 ft).
Table C-2 Additional Sump Test Data
Test ID Number
Configuration
Longitudinal Slope (%)
Cross Slope (%)
Flow Depth (ft)
Prototype Flow (cfs)
AT1 Triple No. 16 0 1 0.75 21.8 AT2 Triple No. 16 0 1 1.5 52.7 AT3 Double No. 16 0 1 0.75 17.9 AT4 Double No. 16 0 1 1.5 33.8 AT5 Single No. 16 0 1 0.75 10.9 AT6 Single No. 16 0 1 1.5 17.6 AT7 Single No. 13 0 1 0.75 11.5 AT8 Single No. 13 0 1 1.5 19.2 AT9 Double No. 13 0 1 0.75 16.7 AT10 Double No. 13 0 1 1.5 40.1 AT11 Triple No. 13 0 1 0.75 20.3 AT12 Triple No. 13 0 1 1.5 59.4

63
APPENDIX D: INLET CONSTRUCTION DRAWINGS

64
Inlet Drawings
(a) (b)
Figure D-1 Type 13 Inlet Specifications

65
(a)
(b)
Figure D-2 Type 16 Inlet Specifications

66
(a)
(b)
(c)
(d)
Figure D-3 Type R Inlet Specifications (plan view)

67
(a)
(b)
(c)
Figure D-4 Type R Inlet Specifications (profile view)

68
APPENDIX E: ADDITIONAL PARAMETERS

69
Additional Parameters Used in Regressions and UDFCD Methods From the collected test data, several parameters such as top width (Tw), cross sectional flow area (A), wetted perimeter (Wp), critical depth (depth), Froude number (Fr), Manning’s roughness coefficient (n), and flow velocity (velocity) were determined at the prototype scale and are given here for use by the UDFCD in data analysis. These are organized by the inlet type used and are given for all the on-grade tests.
Table E-1 Additional Parameters for the Type 13 Inlet Tests
Test
depth (ft)
Tw (ft)
A (ft2)
Wp (ft)
Fr
n
velocity (ft/s)
62 0.111 16 1.92 16.23 1.28 0.0124 2.517 63 0.167 18.15 5.18 18.65 1.67 0.0109 5.056 64 0.333 20.165 15.48 21.675 1.64 0.0126 8.167 91 0.111 12 1.42 12.22 1.07 0.0172 2.086 92 0.167 18.15 3.92 18.5 0.98 0.0207 2.585 93 0.333 20.165 14.2 21.525 1.41 0.0170 6.696 94 0.111 12 1.42 12.22 1.35 0.0136 2.635 95 0.167 18.15 3.92 18.5 1.15 0.0177 3.022 96 0.111 12 1.42 12.22 1.24 0.0148 2.415 97 0.167 18.15 3.92 18.5 1.16 0.0175 3.062 98 0.167 18.15 3.92 18.5 1.01 0.0201 2.664 99 0.333 20.165 14.2 21.525 1.38 0.0174 6.565 100 0.167 18.15 3.92 18.5 1.09 0.0187 2.863 101 0.333 20.165 14.2 21.525 1.39 0.0172 6.641 102 0.167 18.15 3.92 18.5 1.09 0.0187 2.863 103 0.333 20.165 14.2 21.525 1.39 0.0172 6.641 146 0.111 18.15 2.14 18.39 3.81 0.0071 7.430 147 0.167 18.15 5.18 18.65 2.14 0.0145 6.500 148 0.333 20.165 15.48 21.675 2.17 0.0164 10.765 161 0.111 16 1.79 16.22 2.29 0.0124 4.354 162 0.167 18.15 3.92 18.5 2.40 0.0132 6.323 163 0.333 20.165 14.2 21.525 2.31 0.0162 10.977 164 0.111 16 1.79 16.22 2.16 0.0132 4.093 165 0.167 18.15 3.92 18.5 2.32 0.0136 6.124 166 0.111 16 1.79 16.22 2.11 0.0134 4.006 167 0.167 18.15 3.92 18.5 2.32 0.0136 6.124 168 0.167 18.15 3.92 18.5 2.25 0.0140 5.925 169 0.333 20.165 14.2 21.525 2.28 0.0163 10.868 170 0.167 18.15 3.92 18.5 2.16 0.0146 5.686 171 0.333 20.165 14.2 21.525 2.43 0.0153 11.559 172 0.167 18.15 3.92 18.5 2.34 0.0135 6.164 173 0.333 20.165 14.2 21.525 2.31 0.0162 10.977 227 0.111 18.15 2.14 18.39 3.10 0.0119 6.046 228 0.167 18.15 5.18 18.65 2.40 0.0177 7.282 229 0.333 20.165 15.48 21.675 1.85 0.0262 9.214 242 0.111 15.5 1.79 16.72 2.62 0.0139 5.051 243 0.167 18.15 3.92 18.5 2.64 0.0159 6.959 244 0.333 20.165 14.2 21.525 1.92 0.0259 9.133 245 0.111 15.5 1.79 16.72 2.48 0.0147 4.790

70
Test
depth (ft)
Tw (ft)
A (ft2)
Wp (ft)
Fr
n
velocity (ft/s)
246 0.167 18.15 3.92 18.5 2.56 0.0164 6.760 247 0.111 15.5 1.79 16.72 2.44 0.0150 4.703 248 0.167 18.15 3.92 18.5 2.62 0.0160 6.919 249 0.167 18.15 3.92 18.5 2.56 0.0164 6.760 250 0.333 20.165 14.2 21.525 1.76 0.0282 8.398 251 0.167 18.15 3.92 18.5 2.11 0.0199 5.567 252 0.333 20.165 14.2 21.525 1.74 0.0286 8.288 253 0.167 18.15 3.92 18.5 2.37 0.0178 6.243 254 0.333 20.165 14.2 21.525 1.68 0.0296 7.981 59 0.111 16 1.92 16.23 1.24 0.0128 2.436 60 0.167 18.15 5.18 18.65 1.44 0.0126 4.363 61 0.333 20.165 15.48 21.675 1.66 0.0125 8.257 104 0.111 12 1.42 12.22 1.18 0.0156 2.305 105 0.167 18.15 3.92 18.5 1.09 0.0187 2.863 106 0.333 20.165 14.2 21.525 1.45 0.0165 6.916 149 0.111 18.15 2.14 18.39 3.44 0.0079 6.701 150 0.167 18.15 5.18 18.65 2.14 0.0145 6.500 151 0.333 20.165 15.48 21.675 2.29 0.0155 11.409 158 0.111 16 1.79 16.22 2.39 0.0119 4.528 159 0.167 18.15 3.92 18.5 2.26 0.0139 5.965 160 0.333 20.165 14.2 21.525 2.39 0.0156 11.362 230 0.111 18.15 2.14 18.39 3.18 0.0116 6.191 231 0.167 18.15 5.18 18.65 2.33 0.0182 7.072 232 0.333 20.165 15.48 21.675 1.80 0.0270 8.962 239 0.111 15.5 1.79 16.72 2.39 0.0153 4.615 240 0.167 18.15 3.92 18.5 2.52 0.0167 6.641 241 0.333 20.165 14.2 21.525 1.89 0.0263 9.002 56 0.111 16 1.92 16.23 1.16 0.0137 2.273 57 0.167 18.15 5.18 18.65 1.31 0.0138 3.972 58 0.333 20.165 15.48 21.675 1.64 0.0126 8.177 107 0.111 12 1.42 12.22 1.29 0.0142 2.525 108 0.167 18.15 3.92 18.5 1.30 0.0157 3.420 109 0.333 20.165 14.2 21.525 1.60 0.0150 7.629 152 0.111 18.15 2.14 18.39 3.14 0.0086 6.119 153 0.167 18.15 5.18 18.65 1.98 0.0157 5.988 154 0.333 20.165 15.48 21.675 2.31 0.0154 11.480 155 0.111 16 1.79 16.22 2.29 0.0124 4.354 156 0.167 18.15 3.92 18.5 2.14 0.0147 5.647 157 0.333 20.165 14.2 21.525 2.41 0.0154 11.493 233 0.111 18.15 2.14 18.39 3.03 0.0122 5.900 234 0.167 18.15 5.18 18.65 2.43 0.0175 7.373 235 0.333 20.165 15.48 21.675 1.91 0.0255 9.486 236 0.111 15.5 1.79 16.72 2.44 0.0150 4.703 237 0.167 18.15 3.92 18.5 2.49 0.0169 6.561 238 0.333 20.165 14.2 21.525 1.90 0.0261 9.056 AT287 0.111 18.15 2.14 18.39 3.48 0.0106 6.774

71
Test
depth (ft)
Tw (ft)
A (ft2)
Wp (ft)
Fr
n
velocity (ft/s)
AT288 0.167 18.15 5.18 18.65 2.42 0.0175 7.343 AT291 0.111 18.15 2.14 18.39 3.51 0.0105 6.847 AT293 0.167 18.15 5.18 18.65 2.47 0.0172 7.493 AT303 0.111 18.15 2.14 18.39 3.44 0.0108 6.701 AT306 0.167 18.15 5.18 18.65 2.39 0.0178 7.252 AT295 0.111 18.15 2.14 18.39 3.48 0.0106 6.774 AT297 0.167 18.15 5.18 18.65 2.44 0.0174 7.403 AT300 0.111 18.15 2.14 18.39 3.51 0.0105 6.847 AT301 0.167 18.15 5.18 18.65 2.42 0.0175 7.343

72
Table E-2 Additional Parameters for the Type 16 Inlet Tests
Test
depth (ft)
Tw (ft)
A (ft2)
Wp (ft)
Fr
n
velocity (ft/s)
65 0.111 17 1.88 17.22 1.45 0.0108 2.736 66 0.167 18.15 5.18 18.65 1.36 0.0133 4.123 67 0.333 20.165 15.48 21.675 1.65 0.0126 8.197 80 0.111 12 1.42 12.22 1.35 0.0136 2.635 81 0.167 18.15 3.92 18.5 1.12 0.0182 2.943 82 0.333 20.165 14.2 21.525 1.41 0.0170 6.729 83 0.167 18.15 3.92 18.5 1.10 0.0184 2.903 84 0.333 20.165 14.2 21.525 1.39 0.0172 6.641 85 0.167 18.15 3.92 18.5 1.09 0.0187 2.863 86 0.333 20.165 14.2 21.525 1.41 0.0170 6.718 87 0.111 12 1.42 12.22 1.24 0.0148 2.415 88 0.167 18.15 3.92 18.5 1.06 0.0192 2.784 89 0.111 12 1.42 12.22 1.18 0.0156 2.305 90 0.167 18.15 3.92 18.5 1.06 0.0192 2.784 143 0.111 18.15 2.14 18.39 3.66 0.0074 7.138 144 0.167 18.15 5.18 18.65 2.16 0.0143 6.560 145 0.333 20.165 15.48 21.675 2.29 0.0155 11.409 174 0.111 14 1.6 14.22 2.59 0.0110 4.969 175 0.167 18.15 3.92 18.5 2.16 0.0146 5.686 176 0.333 20.165 14.2 21.525 2.41 0.0155 11.471 177 0.167 18.15 3.92 18.5 2.22 0.0142 5.846 178 0.333 20.165 14.2 21.525 2.41 0.0155 11.471 179 0.167 18.15 3.92 18.5 2.16 0.0146 5.686 180 0.333 20.165 14.2 21.525 2.43 0.0153 11.559 181 0.111 14 1.6 14.22 2.64 0.0108 5.066 182 0.167 18.15 3.92 18.5 2.32 0.0136 6.124 183 0.111 14 1.6 14.22 2.74 0.0104 5.261 184 0.167 18.15 3.92 18.5 2.41 0.0131 6.362 224 0.111 18.15 2.14 18.39 3.14 0.0118 6.119 225 0.167 18.15 5.18 18.65 2.41 0.0176 7.313 226 0.333 20.165 15.48 21.675 1.83 0.0265 9.123 255 0.167 18.15 3.92 18.5 2.73 0.0149 7.198 256 0.333 20.165 14.2 21.525 1.82 0.0264 8.672 257 0.167 18.15 3.92 18.5 2.94 0.0139 7.754 258 0.333 20.165 14.2 21.525 1.97 0.0244 9.397 259 0.111 14.6 1.66 14.82 2.55 0.0144 4.883 260 0.167 18.15 3.92 18.5 2.56 0.0159 6.760 261 0.111 14.6 1.66 14.82 2.55 0.0144 4.883 262 0.167 18.15 3.92 18.5 2.59 0.0157 6.840 263 0.111 14.6 1.66 14.82 2.36 0.0161 4.507 264 0.167 18.15 3.92 18.5 2.71 0.0155 7.158 265 0.333 20.165 14.2 21.525 1.91 0.0260 9.111 68 0.111 17 1.88 17.22 1.49 0.0105 2.819 69 0.167 18.15 5.18 18.65 1.48 0.0123 4.484

73
Test
depth (ft)
Tw (ft)
A (ft2)
Wp (ft)
Fr
n
velocity (ft/s)
70 0.333 20.165 15.48 21.675 1.62 0.0128 8.056 77 0.111 12 1.42 12.22 1.18 0.0156 2.305 78 0.167 18.15 3.92 18.5 1.09 0.0187 2.863 79 0.333 20.165 14.2 21.525 1.40 0.0172 6.652 140 0.111 18.15 2.14 18.39 3.51 0.0077 6.847 141 0.167 18.15 5.18 18.65 2.08 0.0149 6.319 142 0.333 20.165 15.48 21.675 2.30 0.0154 11.439 185 0.111 14 1.6 14.22 2.59 0.0110 4.969 186 0.167 18.15 3.92 18.5 2.29 0.0138 6.044 187 0.333 20.165 14.2 21.525 2.42 0.0154 11.526 221 0.111 18.15 2.14 18.39 3.18 0.0116 6.191 222 0.167 18.15 5.18 18.65 2.33 0.0182 7.072 223 0.333 20.165 15.48 21.675 1.88 0.0258 9.365 266 0.111 14.6 1.66 14.82 2.75 0.0138 5.259 267 0.167 18.15 3.92 18.5 2.56 0.0164 6.760 268 0.333 20.165 14.2 21.525 1.94 0.0257 9.221 71 0.111 17 1.88 17.22 1.27 0.0123 2.405 72 0.167 18.15 5.18 18.65 1.51 0.0120 4.574 73 0.333 20.165 15.48 21.675 1.63 0.0127 8.126 74 0.111 12 1.42 12.22 1.24 0.0148 2.415 75 0.167 18.15 3.92 18.5 1.09 0.0187 2.863 76 0.333 20.165 14.2 21.525 1.39 0.0173 6.608 137 0.111 18.15 2.14 18.39 3.18 0.0085 6.191 138 0.167 18.15 5.18 18.65 2.54 0.0122 7.704 139 0.333 20.165 15.48 21.675 2.02 0.0176 10.019 188 0.111 14 1.6 14.22 2.74 0.0104 5.261 189 0.167 18.15 3.92 18.5 2.19 0.0144 5.766 190 0.333 20.165 14.2 21.525 2.41 0.0155 11.471 218 0.111 18.15 2.14 18.39 3.03 0.0122 5.900 219 0.167 18.15 5.18 18.65 2.43 0.0175 7.373 220 0.333 20.165 15.48 21.675 1.89 0.0257 9.415 269 0.111 14.6 1.66 14.82 2.65 0.0143 5.071 270 0.167 18.15 3.92 18.5 2.49 0.0169 6.561 271 0.333 20.165 14.2 21.525 1.89 0.0263 9.002 AT296 0.111 18.15 2.14 18.39 3.44 0.0108 6.701 AT298 0.167 18.15 5.18 18.65 2.42 0.0175 7.343 AT299 0.111 18.15 2.14 18.39 3.51 0.0105 6.847 AT302 0.167 18.15 5.18 18.65 2.41 0.0176 7.313 AT289 0.111 18.15 2.14 18.39 3.40 0.0109 6.629 AT290 0.167 18.15 5.18 18.65 2.42 0.0175 7.343 AT292 0.111 18.15 2.14 18.39 3.51 0.0105 6.847 AT294 0.167 18.15 5.18 18.65 2.45 0.0173 7.433 AT304 0.111 18.15 2.14 18.39 3.44 0.0108 6.701 AT305 0.167 18.15 5.18 18.65 2.40 0.0177 7.282 AT303 0.111 18.15 2.14 18.39 3.44 0.0108 6.701 AT306 0.167 18.15 5.18 18.65 2.39 0.0178 7.252

74
Test
depth (ft)
Tw (ft)
A (ft2)
Wp (ft)
Fr
n
velocity (ft/s)
AT295 0.111 18.15 2.14 18.39 3.48 0.0106 6.774 AT297 0.167 18.15 5.18 18.65 2.44 0.0174 7.403 AT300 0.111 18.15 2.14 18.39 3.51 0.0105 6.847 AT301 0.167 18.15 5.18 18.65 2.42 0.0175 7.343

75
Table E-3 Additional Parameters for the Type R Inlet Tests
Test
depth (ft)
Tw (ft)
A (ft2)
Wp (ft)
Fr
n
velocity (ft/s)
44 0.111 16.000 1.92 1.809 1.16 0.0137 2.273 45 0.167 17.500 4.96 4.793 1.35 0.0139 4.086 46 0.333 20.165 15.48 15.147 1.67 0.0124 8.318 47 0.111 16.000 1.92 1.809 1.03 0.0153 2.030 48 0.167 18.150 5.18 5.013 1.39 0.0131 4.213 49 0.333 20.165 15.48 15.147 1.64 0.0127 8.157 50 0.111 16.000 1.92 1.809 1.12 0.0142 2.192 51 0.167 18.150 5.18 5.013 1.37 0.0132 4.153 52 0.333 20.165 15.48 15.147 1.66 0.0125 8.257 53 0.111 16.000 1.92 1.809 1.16 0.0137 2.273 54 0.167 18.150 5.18 5.013 1.42 0.0128 4.303 55 0.333 20.165 15.48 15.147 1.63 0.0127 8.106 122 0.111 14.000 1.6 1.489 1.07 0.0172 2.046 123 0.167 18.150 3.92 3.753 1.06 0.0192 2.784 124 0.333 20.165 14.2 13.867 1.39 0.0172 6.641 119 0.111 14.000 1.6 1.489 0.91 0.0200 1.754 120 0.167 18.150 3.92 3.753 1.06 0.0192 2.784 121 0.333 20.165 14.2 13.867 1.39 0.0173 6.608 116 0.111 14.000 1.6 1.489 1.02 0.0180 1.949 117 0.167 18.150 3.92 3.753 1.09 0.0187 2.863 118 0.333 20.165 14.2 13.867 1.39 0.0173 6.608 110 0.111 14.000 1.6 1.489 0.96 0.0190 1.851 111 0.167 18.150 3.92 3.753 1.07 0.0190 2.823 112 0.333 20.165 14.2 13.867 1.38 0.0174 6.565 113 0.167 18.150 3.92 3.753 1.09 0.0187 2.863 114 0.333 20.165 14.2 13.867 1.39 0.0172 6.641 115 0.167 18.150 3.92 3.753 1.07 0.0190 2.823 125 0.111 18.150 2.14 2.029 3.55 0.0076 6.920 126 0.167 18.150 5.18 5.013 2.13 0.0145 6.470 127 0.333 20.165 15.48 15.147 2.32 0.0153 11.530 128 0.111 18.150 2.14 2.029 3.21 0.0084 6.264 129 0.167 18.150 5.18 5.013 2.09 0.0148 6.350 130 0.333 20.165 15.48 15.147 2.29 0.0155 11.379 131 0.111 18.150 2.14 2.029 3.21 0.0084 6.264 132 0.167 18.150 5.18 5.013 1.89 0.0164 5.718 133 0.333 20.165 15.48 15.147 2.25 0.0158 11.177 134 0.111 18.150 2.14 2.029 3.14 0.0086 6.119 135 0.167 18.150 5.18 5.013 1.81 0.0172 5.477 136 0.333 20.165 15.48 15.147 2.33 0.0153 11.560 203 0.111 14.000 1.6 1.489 2.29 0.0124 4.384 204 0.167 18.150 3.92 3.753 2.08 0.0152 5.488 205 0.333 20.165 14.2 13.867 2.47 0.0151 11.746 200 0.111 14.000 1.6 1.489 2.44 0.0117 4.676 201 0.167 18.150 3.92 3.753 2.10 0.0150 5.527

76
Test
depth (ft)
Tw (ft)
A (ft2)
Wp (ft)
Fr
n
velocity (ft/s)
202 0.333 20.165 14.2 13.867 2.47 0.0151 11.746 197 0.111 11.000 1.34 1.229 2.35 0.0122 4.653 198 0.167 18.150 3.92 3.753 2.11 0.0149 5.567 199 0.333 20.165 14.2 13.867 2.46 0.0152 11.691 191 0.111 17.800 1.95 1.839 2.00 0.0141 3.757 192 0.167 18.150 3.92 3.753 2.22 0.0142 5.846 193 0.333 20.165 14.2 13.867 2.46 0.0152 11.691 194 0.333 20.165 14.2 13.867 2.47 0.0151 11.746 195 0.167 18.150 3.92 3.753 2.20 0.0143 5.806 196 0.167 18.150 3.92 3.753 2.23 0.0141 5.885 206 0.111 18.150 2.14 2.029 3.14 0.0118 6.119 207 0.167 18.150 5.18 5.013 2.44 0.0174 7.403 208 0.333 20.165 15.48 15.147 1.86 0.0261 9.264 209 0.111 18.150 2.14 2.029 3.03 0.0122 5.900 210 0.167 18.150 5.18 5.013 2.44 0.0174 7.403 211 0.333 20.165 15.48 15.147 1.99 0.0245 9.878 212 0.111 18.150 2.14 2.029 3.33 0.0111 6.483 213 0.167 18.150 5.18 5.013 2.43 0.0175 7.373 214 0.333 20.165 15.48 15.147 1.84 0.0264 9.143 215 0.111 18.150 2.14 2.029 3.29 0.0112 6.410 216 0.167 18.150 5.18 5.013 2.43 0.0175 7.373 217 0.333 20.165 15.48 15.147 1.82 0.0267 9.063 284 0.111 16.000 1.79 1.679 2.29 0.0165 4.354 285 0.167 18.150 3.92 3.753 2.26 0.0186 5.965 286 0.333 20.165 14.2 13.867 1.82 0.0273 8.672 281 0.111 16.000 1.79 1.679 2.57 0.0147 4.877 282 0.167 18.150 3.92 3.753 2.44 0.0172 6.442 283 0.333 20.165 14.2 13.867 1.68 0.0295 8.014 278 0.111 16.000 1.79 1.679 2.34 0.0162 4.441 279 0.167 18.150 3.92 3.753 2.50 0.0168 6.601 280 0.333 20.165 14.2 13.867 1.74 0.0286 8.288 272 0.111 16.000 1.79 1.679 2.39 0.0159 4.528 273 0.167 18.150 3.92 3.753 2.58 0.0163 6.800 274 0.333 20.165 14.2 13.867 1.76 0.0283 8.376 275 0.167 18.15 3.92 3.753 2.65 0.0159 6.999 276 0.333 20.165 14.2 13.867 1.90 0.0261 9.056 277 0.167 18.15 3.92 3.753 2.58 0.0163 6.800 AT302 0.167 18.15 5.18 18.65 2.41 0.0176 7.313 AT289 0.111 18.15 2.14 18.39 3.40 0.0109 6.629 AT290 0.167 18.15 5.18 18.65 2.42 0.0175 7.343 AT292 0.111 18.15 2.14 18.39 3.51 0.0105 6.847 AT294 0.167 18.15 5.18 18.65 2.45 0.0173 7.433 AT304 0.111 18.15 2.14 18.39 3.44 0.0108 6.701 AT305 0.167 18.15 5.18 18.65 2.40 0.0177 7.282 AT303 0.111 18.15 2.14 18.39 3.44 0.0108 6.701 AT306 0.167 18.15 5.18 18.65 2.39 0.0178 7.252

77
Test
depth (ft)
Tw (ft)
A (ft2)
Wp (ft)
Fr
n
velocity (ft/s)
AT295 0.111 18.15 2.14 18.39 3.48 0.0106 6.774 AT297 0.167 18.15 5.18 18.65 2.44 0.0174 7.403 AT300 0.111 18.15 2.14 18.39 3.51 0.0105 6.847 AT301 0.167 18.15 5.18 18.65 2.42 0.0175 7.343

78
APPENDIX F: CALCULATED EFFICIENCY

79
Efficiency Determined From Regression Equations and Improved UDFCD Methods
Table F-1 Type 13 Combination Inlet Calculated Efficiency
Test
Depth (ft)
Grates
Flow (cfs)
Efficiency
Observed Regression UDFCD New
62 0.333 1 4.83 0.61 0.51 0.50 63 0.501 1 26.19 0.24 0.21 0.30 64 0.999 1 126.42 0.10 0.11 0.17 91 0.333 1 2.96 0.63 0.58 0.64 92 0.501 1 10.13 0.38 0.40 0.48 93 0.999 1 95.09 0.13 0.13 0.22 146 0.333 1 15.90 0.27 0.27 0.20 147 0.501 1 33.67 0.20 0.18 0.24 148 0.999 1 166.64 0.09 0.09 0.08 161 0.333 1 7.79 0.50 0.39 0.36 162 0.501 1 24.78 0.24 0.23 0.23 163 0.999 1 155.88 0.09 0.10 0.07 227 0.333 1 12.94 0.25 0.30 0.26 228 0.501 1 37.72 0.13 0.17 0.21 229 0.999 1 142.63 0.08 0.10 0.13 242 0.333 1 9.04 0.43 0.34 0.32 243 0.501 1 27.28 0.21 0.22 0.21 244 0.999 1 129.69 0.09 0.11 0.13 59 0.333 2 4.68 0.73 0.72 0.73 60 0.501 2 22.60 0.36 0.32 0.49 61 0.999 2 127.82 0.16 0.15 0.25 104 0.333 2 3.27 0.62 0.75 0.84 105 0.501 2 11.22 0.44 0.53 0.72 106 0.999 2 98.20 0.20 0.18 0.36 149 0.333 2 14.34 0.34 0.40 0.33 150 0.501 2 33.67 0.24 0.25 0.34 151 0.999 2 176.61 0.13 0.12 0.12 158 0.333 2 8.11 0.63 0.53 0.56 159 0.501 2 23.38 0.35 0.34 0.42 160 0.999 2 161.34 0.14 0.13 0.14 230 0.333 2 13.25 0.38 0.42 0.36 231 0.501 2 36.63 0.21 0.24 0.31 232 0.999 2 138.73 0.13 0.14 0.22 239 0.333 2 8.26 0.66 0.51 0.55 240 0.501 2 26.03 0.33 0.32 0.38 241 0.999 2 127.82 0.16 0.15 0.25 56 0.333 3 4.36 0.82 0.91 0.86 57 0.501 3 20.58 0.43 0.41 0.67 58 0.999 3 126.57 0.23 0.18 0.35 107 0.333 3 3.59 0.74 0.87 0.91 108 0.501 3 13.41 0.50 0.57 0.81 109 0.999 3 108.34 0.43 0.21 0.46

80
Test
Depth (ft)
Grates
Flow (cfs)
Efficiency
Observed Regression UDFCD New
152 0.333 3 13.09 0.43 0.51 0.48 153 0.501 3 31.02 0.29 0.32 0.49 154 0.999 3 177.70 0.18 0.15 0.17 155 0.333 3 7.79 0.74 0.65 0.73 156 0.501 3 22.13 0.44 0.42 0.61 157 0.999 3 163.21 0.19 0.16 0.24 233 0.333 3 12.63 0.41 0.52 0.50 234 0.501 3 38.19 0.25 0.28 0.39 235 0.999 3 146.84 0.18 0.17 0.27 236 0.333 3 8.42 0.74 0.61 0.70 237 0.501 3 25.72 0.42 0.38 0.53 238 0.999 3 128.60 0.20 0.19 0.37

81
Table F-2 Type 16 Combination Inlet Calculated Efficiency
Test
Depth (ft)
Grates
Flow (cfs)
Efficiency
Observed Regression UDFCD New
65 0.333 1 5.14 0.61 0.51 0.56 66 0.501 1 21.36 0.28 0.28 0.39 67 0.999 1 126.89 0.14 0.16 0.25 80 0.333 1 3.74 0.50 0.49 0.63 81 0.501 1 11.54 0.35 0.38 0.40 82 0.999 1 95.55 0.17 0.18 0.20 143 0.333 1 15.28 0.29 0.36 0.40 144 0.501 1 33.98 0.21 0.24 0.27 145 0.999 1 176.61 0.12 0.14 0.07 174 0.333 1 7.95 0.55 0.41 0.46 175 0.501 1 22.29 0.31 0.31 0.29 176 0.999 1 162.89 0.13 0.15 0.06 224 0.333 1 13.09 0.33 0.38 0.33 225 0.501 1 37.88 0.20 0.23 0.18 226 0.999 1 141.23 0.14 0.15 -0.08 263 0.333 1 7.48 0.65 0.43 0.37 264 0.501 1 28.06 0.32 0.29 0.21 265 0.999 1 129.38 0.16 0.16 -0.05 68 0.333 2 5.30 0.71 0.65 0.78 69 0.501 2 23.23 0.34 0.34 0.58 70 0.999 2 124.70 0.21 0.20 0.34 77 0.333 2 3.27 0.57 0.66 0.84 78 0.501 2 11.22 0.40 0.49 0.73 79 0.999 2 94.46 0.20 0.23 0.37 140 0.333 2 14.65 0.36 0.46 0.59 141 0.501 2 32.73 0.27 0.31 0.38 142 0.999 2 177.08 0.19 0.18 0.13 185 0.333 2 7.95 0.65 0.52 0.69 186 0.501 2 23.69 0.37 0.38 0.47 187 0.999 2 163.67 0.20 0.19 0.15 221 0.333 2 13.25 0.38 0.48 0.48 222 0.501 2 36.63 0.25 0.29 0.26 223 0.999 2 144.97 0.20 0.19 -0.04 266 0.333 2 8.73 0.68 0.52 0.57 267 0.501 2 26.50 0.38 0.37 0.35 268 0.999 2 130.94 0.25 0.20 0.01 71 0.333 3 4.52 0.83 0.78 0.89 72 0.501 3 23.69 0.40 0.39 0.73 73 0.999 3 125.80 0.27 0.23 0.45 74 0.333 3 3.43 0.64 0.74 0.92 75 0.501 3 11.22 0.47 0.56 0.86 76 0.999 3 93.84 0.28 0.26 0.53 137 0.333 3 13.25 0.45 0.55 0.74 138 0.501 3 39.91 0.31 0.33 0.49

82
Test
Depth (ft)
Grates
Flow (cfs)
Efficiency
Observed Regression UDFCD New
139 0.999 3 155.10 0.24 0.21 0.19 188 0.333 3 8.42 0.72 0.59 0.83 189 0.501 3 22.60 0.46 0.45 0.64 190 0.999 3 162.89 0.26 0.22 0.25 218 0.333 3 12.63 0.42 0.56 0.61 219 0.501 3 38.19 0.29 0.33 0.35 220 0.999 3 145.75 0.25 0.22 0.01 269 0.333 3 8.42 0.74 0.60 0.72 270 0.501 3 25.72 0.44 0.43 0.50 271 0.999 3 127.82 0.29 0.24 0.08

83
Table F-3: Type R Inlet Calculated Efficiency
Test
Depth (ft)
Length (ft)
Flow (cfs)
Efficiency
Observed Regression UDFCD New 44 0.333 15 4.36 0.89 0.95 0.95 45 0.501 15 20.26 0.51 0.51 0.55 46 0.999 15 128.76 0.24 0.22 0.22 47 0.333 12 3.90 0.84 0.84 0.87 48 0.501 12 21.82 0.38 0.41 0.43 49 0.999 12 126.26 0.20 0.18 0.18 50 0.333 9 4.21 0.70 0.62 0.70 51 0.501 9 21.51 0.35 0.32 0.34 52 0.999 9 127.82 0.15 0.14 0.14 53 0.333 5 4.36 0.50 0.36 0.43 54 0.501 5 22.29 0.24 0.19 0.19 55 0.999 5 125.48 0.08 0.08 0.08 122 0.333 15 3.27 0.90 1.00 1.00 123 0.501 15 10.91 0.60 0.78 0.71 124 0.999 15 94.31 0.31 0.30 0.27 119 0.333 12 2.81 0.83 1.00 0.96 120 0.501 12 10.91 0.53 0.64 0.60 121 0.999 12 93.84 0.25 0.25 0.22 116 0.333 9 3.12 0.65 0.79 0.81 117 0.501 9 11.22 0.47 0.49 0.46 118 0.999 9 93.84 0.19 0.19 0.17 110 0.333 5 2.96 0.58 0.49 0.53 111 0.501 5 11.07 0.39 0.29 0.28 112 0.999 5 93.22 0.12 0.11 0.09 125 0.333 15 14.81 0.44 0.45 0.58 126 0.501 15 33.51 0.30 0.38 0.40 127 0.999 15 178.48 0.18 0.18 0.18 128 0.333 12 13.41 0.43 0.40 0.50 129 0.501 12 32.89 0.27 0.31 0.33 130 0.999 12 176.14 0.15 0.15 0.14 131 0.333 9 13.41 0.36 0.31 0.39 132 0.501 9 29.62 0.23 0.26 0.27 133 0.999 9 173.03 0.11 0.11 0.11 134 0.333 5 13.09 0.25 0.19 0.23 135 0.501 5 28.37 0.16 0.16 0.16 136 0.999 5 178.95 0.08 0.07 0.06 203 0.333 15 7.01 0.84 0.72 0.82 204 0.501 15 21.51 0.49 0.50 0.50 205 0.999 15 166.79 0.19 0.20 0.19 200 0.333 12 7.48 0.71 0.57 0.68 201 0.501 12 21.67 0.42 0.40 0.42 202 0.999 12 166.79 0.15 0.17 0.15 197 0.333 9 6.24 0.65 0.44 0.61 198 0.501 9 21.82 0.34 0.31 0.32

84
Test
Depth (ft)
Length (ft)
Flow (cfs)
Efficiency
Observed Regression UDFCD New 199 0.999 9 166.01 0.12 0.13 0.12 191 0.333 5 7.33 0.38 0.30 0.31 192 0.501 5 22.91 0.18 0.18 0.18 193 0.999 5 166.01 0.07 0.08 0.07 206 0.333 15 13.09 0.44 0.49 0.59 207 0.501 15 38.35 0.27 0.35 0.37 208 0.999 15 143.41 0.19 0.20 0.19 209 0.333 12 12.63 0.42 0.41 0.50 210 0.501 12 38.35 0.24 0.28 0.30 211 0.999 12 152.92 0.15 0.16 0.15 212 0.333 9 13.87 0.35 0.30 0.37 213 0.501 9 38.19 0.19 0.22 0.23 214 0.999 9 141.54 0.12 0.13 0.12 215 0.333 5 13.72 0.22 0.18 0.22 216 0.501 5 38.19 0.11 0.13 0.13 217 0.999 5 140.29 0.07 0.08 0.07 284 0.333 15 7.79 0.80 0.72 0.75 285 0.501 15 23.38 0.46 0.47 0.47 286 0.999 15 123.15 0.21 0.25 0.21 281 0.333 12 8.73 0.70 0.55 0.61 282 0.501 12 25.25 0.38 0.37 0.37 283 0.999 12 113.79 0.18 0.22 0.18 278 0.333 9 7.95 0.63 0.45 0.50 279 0.501 9 25.88 0.30 0.28 0.28 280 0.999 9 117.69 0.13 0.16 0.13 272 0.333 5 8.11 0.35 0.27 0.29 273 0.501 5 26.66 0.17 0.16 0.16 274 0.999 5 118.94 0.08 0.10 0.07