hydraulic and sediment transport studies in relation to
TRANSCRIPT

University of KentuckyUKnowledge
KWRRI Research Reports Kentucky Water Resources Research Institute
7-1972
Hydraulic and Sediment Transport Studies inRelation to River Sediment Control and SolidWaste Pollution and Economic Use of the By-ProductsDigital Object Identifier: https://doi.org/10.13023/kwrri.rr.59
Bruce R. MooreUniversity of Kentucky
Michael R. ShortUniversity of Kentucky
Right click to open a feedback form in a new tab to let us know how this document benefits you.
Follow this and additional works at: https://uknowledge.uky.edu/kwrri_reports
Part of the Hydrology Commons, Sedimentology Commons, and the Water ResourceManagement Commons
This Report is brought to you for free and open access by the Kentucky Water Resources Research Institute at UKnowledge. It has been accepted forinclusion in KWRRI Research Reports by an authorized administrator of UKnowledge. For more information, please [email protected].
Repository CitationMoore, Bruce R. and Short, Michael R., "Hydraulic and Sediment Transport Studies in Relation to River Sediment Control and SolidWaste Pollution and Economic Use of the By-Products" (1972). KWRRI Research Reports. 136.https://uknowledge.uky.edu/kwrri_reports/136

'·
Research Report No. 59
HYDRAULIC AND SEDIMENT TRANSPORT STUDIES IN RELATION TO RIVER SEDIMENT CONTROL AND SOLID WASTE POLLUTION
AND ECONOMIC USE OF THE BY-PRODUCTS
Dr. Bruce R. Moore Principal Investigator
Graduate Student Assistant: Michael R. Short
Project Number A-034-KY (Completion Report) Agreement No. 14-31-0001-3217 Period of Project - January 1970 - June 1972
University of Kentucky Water Resources Institute Lexington, Kentucky
The work on which this report is based was supported by funds provided by the Office of Water Resources Research, United States Department of the Interior, as authorized under the Water Resources Research Act of 1964
July 1972

TABLE OF CONTENTS
CHAPTER
I. Introduction
Objectives
Background
II. Research Procedures
River sampling - General
Kentucky River sampling.
Ohio River sampling •••
Big Sandy River sampling
Flume studies ••••••
Threshold of particle transport.
Hydraulic theory of sediment movement in dredge holes.
Experiments with model dredge hole parameters.
Analysis of flow conditions in the river ••
Existing coal and sand extraction operations
III. Data and Results
River sampling results - sediment associations •
Kentucky River sample results •• . . . . . . . Big Sandy River sample results
Ohio River sample results •••
Source of the coal in the Kentucky River
Flume Results:
Estimation of threshold velocity of transport •••
Evaluation of size, shape, flow conditions and trap efficiency in model holes
Analysis of flow records ••
..
•
. . . .
1
1
6
6
8
12
12
12
14
17
18
26
28
34
35
35
36
41
43
43

TABLE OF CONTENTS, continued
IV. Conclusions . . . . . . . . . . . . . . . ,,
Page
45

LIST OF TABLES
Table
1 Sediment Distribution in Kentucky and Ohio Rivers
2 Number of Days the Coal is in Transport , • , , ,
LIST OF FIGURES
Figure
1
2
3
4
5
6
7
8
9
10-15
16
. 17
18
Location Map of Cincinnati Arch •••• , ,
Location Map of Gaging Stations, Coalfields and Study areas
Sample of Navigation Charts and Sample Stations
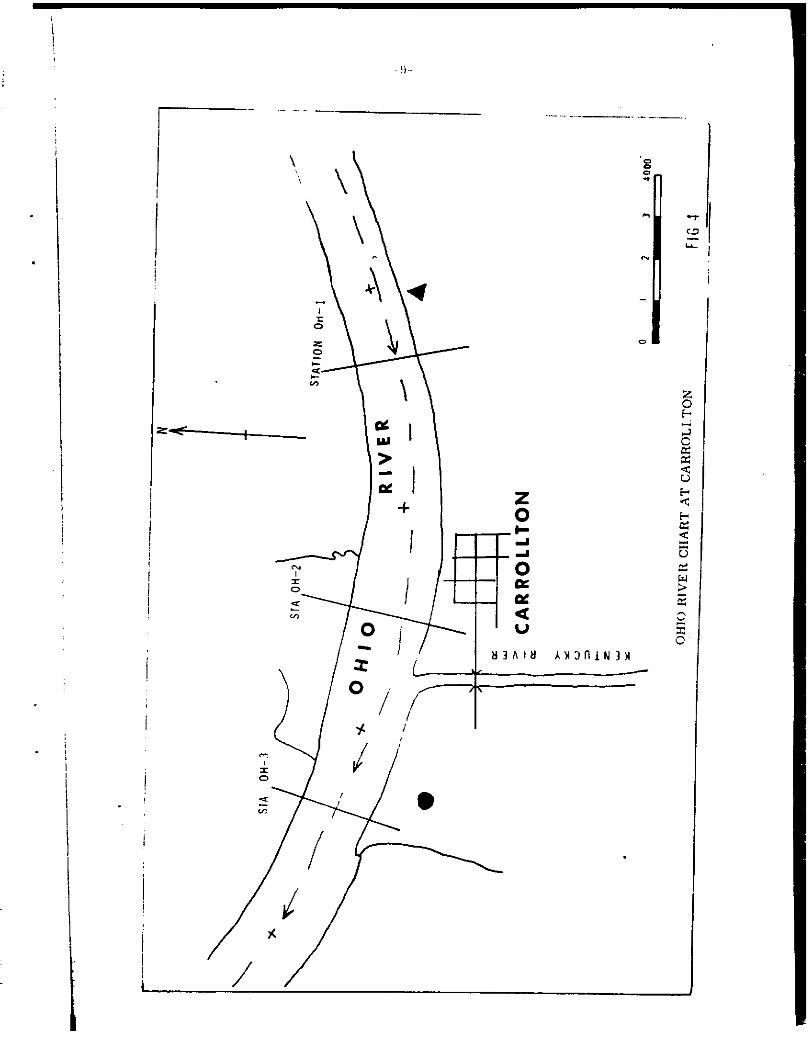
Ohio River Chart at Carrollton.
Big Sandy River Sample Locations at Louisa.
Big Sandy River Locations at Prestonsburg
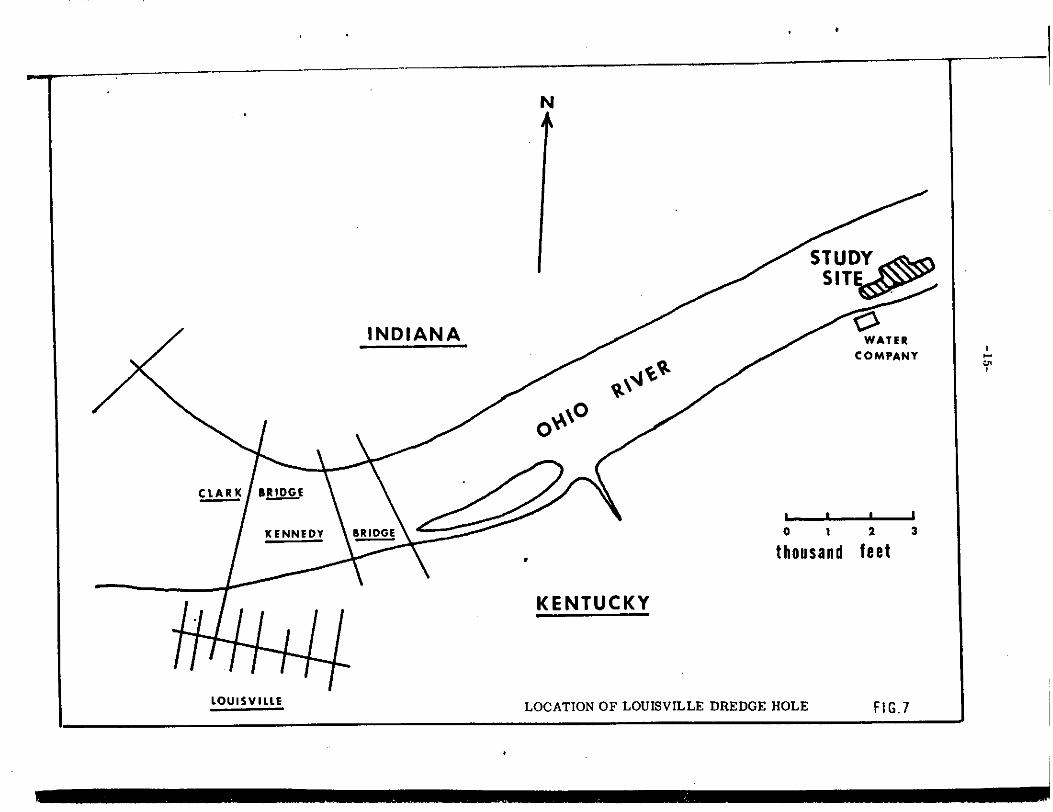
Location of Louisville Dredge Hole.
Sequences in the Model Dredge Hole.
Model Hole Configuration in the Flume
Flow Plots of Gaging Stations •
Graph of Threshold Transport Results for Flume.
Graph of df/d and Vf. , , , , , , • , •
Flow Conditions for Sediment Transport.
29
38
Page
2
4
7
9
10
11
15
16
19
20
37
42
44

ABSTRACT
The distribution of sediments and conditions of transport were
studied in the Kentucky, Big Sandy and Ohio Rivers. The sand and coal
were in transport at different flow velocities for the rivers and the
deposition of these sediments was a direct function of the flow conditions
at a particular locality.
The flow conditions of transport of the sediments were studied
in flumes as were the hydraulic conditions in model dredge holes to
determine the feasibility of trapping sediment. The conditions of scour
and fill were also established and compared with known conditions in a
dredge hole in the Ohio River. Flow records from gaging stations were
analyzed to determine the periods of sediment transport.
The results indicate that solid waste pollutants can be trapped
in dredge holes in certain conditions of flow. The principal source of
the coal appears to be natural erosion.
Key Words
Sediment Transport, Scour, Dredging

ACKNOWLEDGMENTS
The author wishes to acknowledge the help of Michael R, Short
in field and laboratory work and the assistance of Dr, Billy Barfield
of the University of Kentucky in the design and execution of flume
experiments, Mrs. Judy Cutler assisted in data analysis and manuscript
preparation. Dr, John Thrailkill freely gave advice and time in
discussion.

CHAPTER I
INTRODUCTION
Objectives
(a) To establish that a dredge hole in a river can act as a sedi
ment trap to collect coal and sand using the vortex action of the river.
(b) To delineate the parameters of flow and the dimensions of such
a hole to trap particular sized particles at given conditions of flow.
(c) To examine the feasibility of controlling sedimentation by
use of a dredge hole and of extracting sediment and solid waste from
streams using such a sediment trap.
(d) To establish the pattern of distribution of sediments in the
study area.
Background
The streams draining Eastern Kentucky were chosen for the study
since they traverse a wide variety of geologic strata in deriving their
sediment load. The study was principally concentrated on the Kentucky
River but included the Big Sandy River and the Ohio River. This gave a
range of stream discharge from a small to a very large river. All the
rivers are important for water supply and removal of sewage effluent and
the Ohio and Kentucky Rivers have a system of connnercially navigable
locks.
The study area lies on the eastern flank of the geologic structure
known as the Cincinnati Arch, with strata dipping outward to the east,
south and west from Lexington. This broad structure has dips of

--
STUDY ARF.AS
•
' Louisville
I I \
\ ~~~
.-~"'~ \.• \
\ "-
'-
KENTUCKY
1~inci•1nati
_,, --
LOCATION MAP OF CINCINNATI ARCH
•
N
FIG. I
' "' I

-3-
approximately 20 ft, per mile. The sediment load of the streams is
derived from sandstones, siltstones, shale, coal beds and limestones.
There are no igneous rocks of any significance in the catchment areas of
the streams and any metamorphic or igneous rock fragments are derived
from the Pleistocene age glacial deposits, themselves originating to
the north in Canada.
The Eastern coalfield of Kentucky is located within the catchment
areas of the Kentucky and Big Sandy Rivers and contributes sediment and
coal material to these two rivers. In the Eastern coalfield the
Pennsylvanian age coal is interbedded with terrigenous elastic sediments
such as sandstone, siltstone and shale. Towards the center of the
Cincinnati Arch the sediments are principally carbonates, such as lime
stone and dolomites with some shale. The sediments on the Arch are
Ordovician age in the Lexington area and become successively younger to
the east, south and west, being Pennsylvanian age in the coalfields.
Coal is mined in the Eastern coalfield by underground and strip
mining methods. Coal distribution had previously been studied in flood
plain sediments, Moore (1971), at Louisville. This present study was
directed to the source, transport and possible removal methods for coal
and other sediment from the actual river channels rather than the banks.
The origins of the coal prior to the study were thought to be:
(1) natural erosion of coal seams;
(2) coal washing and loading operations and spillage during
transport;
(3) run-off from strip mining operations;
the latter two having received the bulk of the publicity.

:~~~~~::::::::::::::::~::::::::::::::_ ___ ~Br''.....-~~~~~~~ 8'' A_ ~ CinLinnal1
j I
38'
Jl4'
'
"' \>
.,_<>'\>
L[;[ND
A 3·2840 Gaging .:,t,on
D Coal producrnb Jrea
SCALE w 0 ro ~· ~ L++++! I : f
"" ~ .• ES
L ________________ _
•
e lexrngton
II"'' ·-, -
O H IO
Londo,i •
,,-
_ _____ / ------
8_1'l
I ..... ". -...::,
a~
WE ST
VIRGINIA
~ l.a ri11.:f1··~
/
_,/ (
...... """ J'"t.' ' ' /
_.,,..--_,/
<'/J \>
' ' ' / ____ .,, .
.,-' '
"' ' :·
39··
38'
37'
~

-5-
The concept of a dredge hole trap for sediment to assist in sedi
ment dispersal was developed by the author from previous studies of
dredging operations in the Ohio River, Moore (1970). These studies were
extended in the present project to more clearly explain the hydraulics
of trap efficiency and dispersal of sediments in dredge holes. The
dredge hole originally studied at Louisville has remained in the river
since 1966 and is still largely unaltered up to the latest measurements
during this project work in 1972. A vortex action over the hole scours
it free of sand during periods of high water and contributes to the
deposition of sand between the hole and the bank (see details later).
In the present study the flow conditions to fill and scour the hole were
determined in models and compared to the known flow conditions .of the
river.

General
CHAPTER II
RESEARCH PROCEDURES
(a) River Sampling
The samples were taken from the river bottom using a Petterson
Dredge from an 18 foot boat. The stations were marked on the bank and
the samples taken across the width of the stream. The numbers of samples
taken at each station varied from one to five depending on the width of
the stream. The depth at each station, the gage reading for the pool
and the width of the stream were recorded. Most material to coarse
gravel could be recovered using the dredge but cobble sized material
was more conveniently recovered using scuba equipment. Coarse-sized
coal up to 18" was collected from sand bars after high water had receded.
The position of the thalweg and maximum flow velocity was usually
indicated at a station by the coarsest sediment. Flow velocity was
recorded using a propeller type flowmeter with a direct readout.
The Ohio and Kentucky Rivers are controlled by a series of navigation
locks and darns and at low flow conditions become almost stationary pools.
At high water the flow continues almost uninterrupted over the top of the
dam and in the Kentucky River even the locks are submerged.
The influence of the dams on sediment distribution was also con
sidered.
Kentucky River Sampling
The river is controlled by 14 locks and dams over 258 miles from its
junction with the Ohio River at Carrollton to the junction of the North

------- --·---- - ..
N
--
KENTUCKY RIVER O I 2 . 3 40001
---.. \ I
C J A/ Sta 9 -2
SAMPLE OF NAVIGATION CHARTS AND SAMPLE STATIONS FIG.3
I ..:, I

•
I i
I '
I I I l
-8-
and Middle Forks above Beattyville. The South Fork also joins the river
at Beattyville. The pools above Locks 2, 9, 10 and 14 were chosen for
the study and also the river below Lock 1 to the Ohio River. Lock 2 is
located at Lockport, Ky., Lock 9 at Valley View, Lock 10 at Boonesboro,
and Lock 14 at Beattyville, (see map, fig. 2). The choice of pools was
made to study the contributions of the Red River in Pool 10 and the
Middle, North and South Forks in Pool 14. Pool 2 was chosen to compare
coal samples which must have originated above Lock 10. Commercial barge
traffic at present only goes upstream to Lock 4 at Frankfort and sand is
the principal cargo. No coal has been barged on the Kentucky River
during the past 15 years.
Sample stations were located at mile points indicated on U.S. Army
Engineers Navigation Charts (1972). Three samples across the river were
taken at each station.
The river gradients in the various pools are different and appear to
influence sediment transport. The gradients were calculated from levels
given in the Navigation Charts.
Sediments were dried, wet sieved, dried, weighed and examined for
shape and roundness, relationships possibly indicating the transport
history, particularly in the case of the coal. A typical chart of sample
locations is given, fig. 3.
Ohio River Samples
The Ohio River was sampled at Louisville, Carrollton and Ashland.
At the confluence of the Kentucky and Ohio Rivers at Carrollton, the Ohio
was sampled above and below the junction and in the mouth of the Kentucky
I I i
I I
I
...., I
:r 0
., "'
I
!i··
-- - - --------
\ \ \ '
z: ~ .... « .... "'
"' I :r 0
"" "'
\
~ ~ \
" .... > -" +
I
I
I I i-
I •
z 0 ,_.. __ ... ....
+-1--11- .... 0 /CIC a: ct u
--··--~·.
0
~1 ..... ' I

I
I \;
Sth LOUISA
LOCALITIES
scale I in to 200 ft
river width x 2
-10-
BIG
2
SANDY
3
RIVER
4
.'cu
5
6
7
8
House Trailer
\ Ky.23
2m
ROBERTS FARM
\ \ ..._ ________ _,B;..IG_s_A'-. N_n_Y,..R_IV'-' E_R_SA~M_P_L_E_._Lo_c_A_T_1_0N_s_AT_L_o_u_1s_A __ r1_G_. s_-' ;
l

i I
\ I I ' I ' I I i
I I
I ' I ! '
I I ' I i
approx scale
I inch to 350 ft river width x 3
r -. , -I
' -I -I
-I -I -
of
-11-
N
15
I
t 14
13 12
II 10
9 8
a,
,:;)
7 6
<n > :z 0
4 -< 5
~
3 < 2 ...., ~
I
\
D PRESTONSBURG
High Schoo I
PRESTONSBURG
LOCAL I TIES
\' Ky Hwy 1 i4
BIG SANDY RIVER LOCATIONS AT PRESTONSBURG FIG.6

-12-
River. At Ashland, where the Big Sandy River joins the Ohio, a similar
sample pattern was adopted to determine the sediment contribution of the
Big Sandy River. The samples taken at Louisville were to compare the
coal shape after transport some 50 miles below the mouth of the Kentucky
River and for further data on the coal distribution pattern.
Big Sandy River Samples
Two locations on the Levisa Fork of the Big Sandy River were selected
since the river is closed to general navigation and accessibility is a
problem. The Big Sandy River originally had four navigation locks but
all are now inoperable and the dams destroyed so that the river is running
in open flow. A 12 ft. boat and outboard motor were used for the work.
One location was at Prestonsburg and the other adjacent to the farm of
Mr. Roberts approximately 7 1/2 miles south of Levisa on Hwy. 23 reached
by a track to the east one mile. See figure 5. The mouth of the Big
Sandy was sampled at one mile intervals for a distance of ten miles from
the Ohio River.
(b) Flume Studies
Threshold of Particular Transport
When the flow of a fluid over a flat surface of loose grains is
gradually increased a condition is reached where a few grains here and
there begin to move with the fluid owing to the forces enacted by the
fluid flow. The critical shear stress to produce this conditfon is a
complex function of fluid density, particle density, velocity of flow,
bottom roughness and many other factors. For more than two centuries

-13-
workers in the field have attempted to formulate the conditions of incip-
ient motion and the results are still not well understood,
A commonly used approach is that of Shields (1936) modified by Vanoni
(1964) in which experimental results in terms of an entrainment function
r c plotted against the Reynolds number, Where r is the critical c (S -l)d
s
shear stress, S is the specific gravity of the solids, s the specific
weight of water and dis the particle diameter. Experimental results in
flumes with materials of different density such as sand, coal, amber and
barite yielded results closely approximating the Shields curve.
Critical velocity and shear values vary considerably from the
Shields curve for the wide variety of coal particle shapes found in the
river, hence these values were determined for this project in the flume.
In the present study it was necessary to know the range of critical
conditions for transport of coal and sand in order to estimate the flow
conditions for differential transport of these two solids in the river.
The range of velocities when transport begins is very much a function of
particle size, shape, bottom composition,slope and roughness, etc.
Experimental c·onditions were set up in the flume to establish the
critical velocity for transport of different sized coal particles on
rock and sand material of different sizes, These results of necessity
·must be only an approximation to the conditions in a river and results
provide a range of critical velocities.
The tests were conducted in an 8 ft, x 8" flume and the runs were
made on coal of different screen sizes and shapes. The sizes varied
from 40 mesh up to 3" and the bottom material varied from sand to
gravel.
-14-
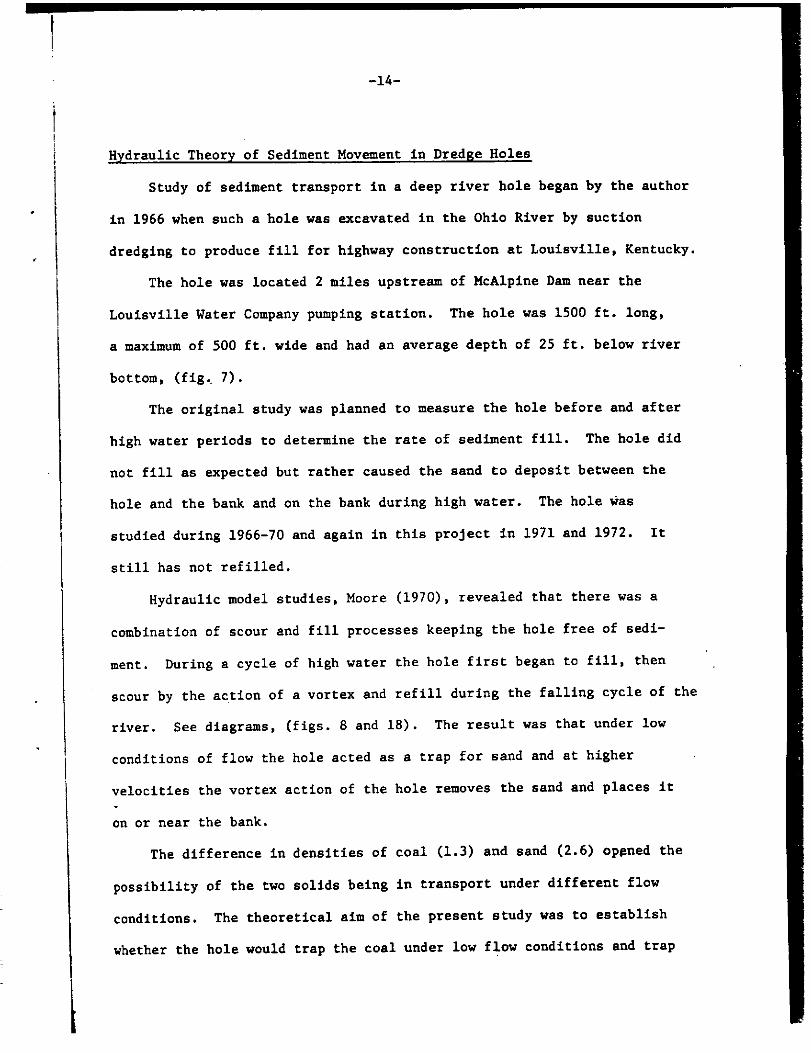
Hydraulic Theory of Sediment Movement in Dredge Holes
Study of sediment transport in a deep river hole began by the author
in 1966 when such a hole was excavated in the Ohio River by suction
dredging to produce fill for highway construction at Louisville, Kentucky.
The hole was located 2 miles upstream of McAlpine Dam near the
Louisville Water Company pumping station. The hole was 1500 ft. long,
a maximum of 500 ft. wide and had an average depth of 25 ft. below river
bottom, (fig •. 7).
The original study was planned to measure the hole before and after
high water periods to determine the rate of sediment fill. The hole did
not fill as expected but rather caused the sand to deposit between the
hole and the bank and on the bank during high water. The hole was
studied during 1966-70 and again in this project in 1971 and 1972. It
still has not refilled.
Hydraulic model studies, Moore (1970), revealed that there was a
combination of scour and fill processes keeping the hole free of sedi
ment. During a cycle of high water the hole first began to fill, then
scour by the action of a vortex and refill during the falling cycle of the
river. See diagrams, (figs. 8 and 18). The result was that under low
conditions of flow the hole acted as a trap for sand and at higher
velocities the vortex action of the hole removes the sand and places it
on or near the bank.
The difference in densities of coal (1.3) and sand (2,6) op~ned the
possibility of the two solids being in transport under different flow
conditions. The theoretical aim of the present study was to establish
whether the hole would trap the coal under low flow conditions and trap
INDIANA
LOUISVILLE
N
~,"'~~ o¥-'o
•
KENTUCKY
WATER COMPANY
O I 2 3
thousand feet
LOCATION OF LOUISVILLE DREDGE HOLE Fl G.7
I ,... "' I

VORTEX
FLUME >
MODEL
DREDGE HOLE
SEQUENCES IN THE MODEL DREDGE HOLE
·-·-··---~-··---
FIG.8
I .... 'r'
and vortex the sand under higher flow conditions preserving the hole.
To this end a series of experiments were set up using mixtures of coal
and sand of different sizes in a model of plexiglass hole in the 8 ft.
flume under differing flow conditions. The experiments were designed
to test whether the coal and sand may be differentially sorted within
the dredge hole.
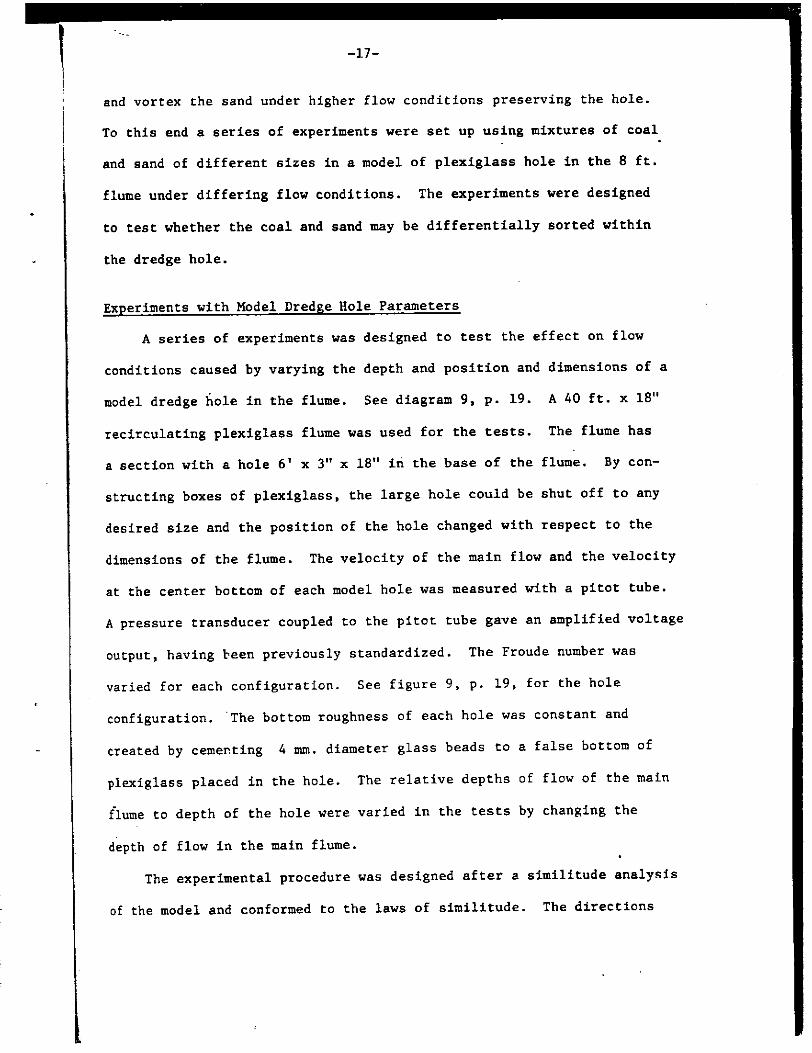
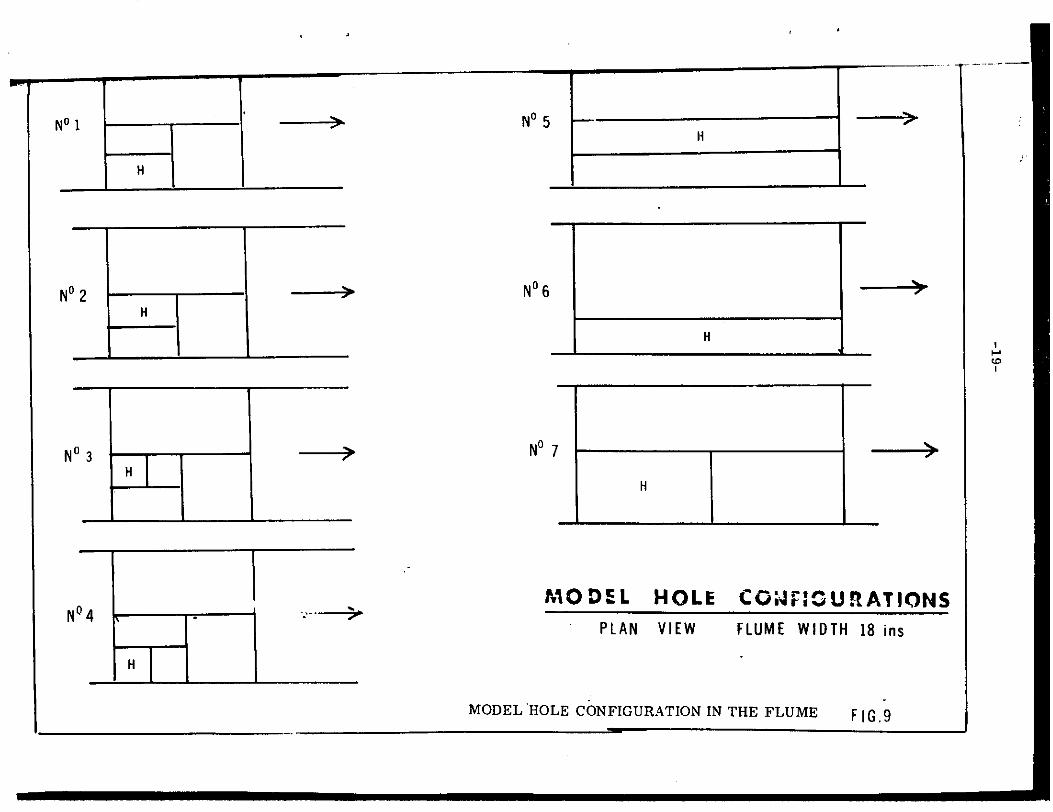
Experiments with Model Dredge Hole Parameters
A series of experiments was designed to test the effect on flow
conditions caused by varying the depth and position and dimensions of a
model dredge hole in the flume. See diagram 9, p. 19. A 40 ft. x 18"
recirculating plexiglass flume was used for the tests. The flume has
a section with a hole 6' x 3" x 18" iri the base of the flume. By con
structing boxes of plexiglass, the large hole could be shut off to any
desired size and the position of the hole changed with respect to the
dimensions of the flume. The velocity of the main flow and the velocity
at the center bottom of each model hole was measured with a pitot tube.
A pressure transducer coupled to the pitot tube gave an amplified voltage
output, having ~een previously standardized. The Froude number was
varied for each configuration. See figure 9, p. 19, for the hole
configuration. ·The bottom roughness of each hole was constant and
created by cementing 4 mm. diameter glass beads to a false bottom of
plexiglass placed in the hole. The relative depths of flow of the main
flume to depth of the hole were varied in the tests by changing the
depth of flow in the main flume.
The experimental procedure was designed after a similitude analysi.s
of the model and conformed to the laws of similitude. The directions

-18-
of flow in each test were observed by introducing potassium permanganate
into the hole for each test. The general pattern of flow of the water
was thus observed in each hole.
Graphical plot of the ratio of depth of hole to depth of flow
against velocity of flow in the bottom of the model hole is given in
fig. 17, p. 42. The dimensions of the hole, position of hole in the
flow, relative depths of flume and the hole were varied furing runs of
different flume velocity to establish the most efficient trap condi
tions.
Analysis of Flow Conditions in the River
To achieve the main aim of relating coal and sand transport condi
tions measured in flumes to similar conditions in the rivers, the analysis
of flow conditions in the rivers became vital. Actual flow velocities
can only be measured with a current meter for low flow conditions. As
the rivers rise the physical problems of measuring velocity such as
floating debris, dangerous boating conditions, etc., make it necessary
to extrapolate these values from existing gaging stations.
During low flow conditions the velocity profile and mean velocity
of the river could be measured from an anchored boat at the station using
a propeller type flow meter mounted on a metal rod. The rod and meter
wece lowered from the boat and the velocity given by a direct readout on
the boat. For very low flow conditions the digital counter built into
the meter was used and had been standardized for number of revolutions
against velocity and gave consistent readings.
For high flow conditions, and to obtain a continuous record of flow,
the readings from U.S.G.S. gaging stations for the years 1963 to 1970,
N° 1 >
H
N° 2 > H
N° 3 H I >
N°4 I' . . ...
.>
H I
N° 5 > Ii
N° 6 ')
H
N° 7 ~
H
t.,o O~ L HOLE co:.1r:cunAr10 NS PLAN VIEW FLUME WIDTH 18 ins
-MODEL HOLE CONFIGURATION IN THE FLUME F IG.9
I .... "' I

0 • (
: u • ,
10,000+--------
i,l'l ll ·+-----------t- -"-- -+- ·- ---+----+----+ . . ·I . ·•·---+
1,i'(X\000'>,--------
IOPOO+-----------··
1,,~ ·•' +----+---·-+---- ----+----· -·+------+----+- ·--+-----+-- - ·---+--··---·, --
1,000,000
100,000
1,C.,'JO,OC.(·+
I
11906 _,.,
10,00Q+---- ·
1,,,._.,.,+--· ... ·-+--JAN FEB
+--------· ......
MAR APR
Station
I --- -I· ·-·--+·
----·-t- -----1 -,---MAY JUN JUL AUG SEP O(T NOV
3-2380 Ohio River at Maysville. Ky_ FIG,10
1¥\IJ!. ::> ', \f'!r
~~·
- ----- ---t
-----+
" I \ I \ I \ ' r t--f-
.... .,, \ ' \, •
-· DEC

•
Kl0,000 --------
~
I I I I
1,000+----
100-+--- ..-+·---- - 1
ll'( ·,L"00-+---
1,000 +-----·-
100+---+- -- -- t------ -
~----- ------t---
• . , ,, ,, --!+--·
I I I I
N ' I \ I I
-+----!----+-- ------+--------+ ------+----~--- +
+
--·-+
I,) 11 r"J'W.r: +-----·-- - ·----- --------- --------- ... ---- ---- - -;
• (
!
\ I \ l I
I ~ 11966
I OQQ-t-~...ul. +---' 11
100+--- --
1CO,OOO+----
:c,ooo
,oo.---~ JAN FEB
,1 I I ' I ~ I I I I
f\i°I r --- r,------<--'--1-, f--\ -tc r~ ~ I \ /.J \ I
I I I \ I \ I I I f1 I \..... \J
~,1 __ k_ ·----+-----+- -----+--··------·--- t - ------------- - - . -·---- t - --- - --t-
+----t~---+-----+------+----+-MAR APR MAY JUN JUL AUG
,, i \ r~ I
-+-- --- -+------ --+-- - -- t-
SEP OCT NOV DEC
Station 3·2905 Kentucky River at lock 2. at Lockporl. Ky. FIG. II

h)(l !
i\.',0,000 I
' 'v,• ,K II ' \ I ,.,., I
' J ' ,
:,00(',•
f\ r, I \I. ,, , 1i 'I,, I t 'J '
J\ I ' ' .J 1 'v 1
. ' 1
' \ 11 ··-8 ....... ,....,
::i . ,.. 1 (
: ICJ,000-
,,_.., !------
100,0QQJ-
' 1\ · .\RI ! /~j f, I 1,._,V\,v I 11J. 'V \ I I I I \ I \J I I '{ \ I
\ l\ I I o • I
1.,,, 'f I J
I, ..;I
JAN FEB MAR
r, ,, f 1
I ' \_
APR
', f I I '
' \ \ \
MAY
Station 3-2840
\ \r..r....,
JUN
Kenlucky
I~ f ·~ ~ .; \ 1\ ' I I \.
\ I ,...,
JUL
~ I\ I • ,~
' I I ' ti 11 j\ I \ \II I I I \, ,J \J ,,
,, ,, ,, I \
J
I I I \ I I I I
\
" \./•,.. I
,-+-
r, ,, I\ I I \ I , I
•
,-,_
,' I~ l 11 I I 1 t I I tt-1'\ J \ I
I \.r-..,1 "J \ I ~ ,, I I f \ I t'- l 1 1 I \ I I I I'; 1 \ I ,,,
~:~f \ /1
\~ I\J I-
: " ·, I'- 1\J' .... , 1 '.J J\ I ..,.,.
' -
... AUG DEC
R. al lo, k IO. near 1ver Wi ncheste,. Ky. f IG.12

. "
• 0 • • I v • 0
100,000~
I I I I I
h.J,0uu -,..Ii
KlO+
I00,0\.'\() +-
1,0Ul.1 +
100-t
100,000
I I I
10,oco+-
1965
1967
I I
I I I
" I \ I • ..._ I ', ...... .,) 196-8
a
IOOf---~---~---+-----t---~---~----+----+-
100,000 +-----
10,000
I I I I s I 1,000 +-j
,1
JAN FEB MAR APR · MAY JUN JUL AUG
------·----------------
+
,-
·+
OCT NOV DEC
Station 3-2150 Big Sandy River_ al Louisa. Ky. FIG. 13

100,000+-
' \ 1969
Lt),Ol>i.)4, ,, I I I I I
1,000-t I
·~-
1,000,
100----~---·-+----+---- - -1
r,1,1 ll.1l,,, ,..:- ...
0 • (
I v \3(>5
~ :0,( .... ··~,+---0
IOOOJ ' ' ,., ,,, , ' \ I ' I I
I I
IOOt
10,000+
I ,,ooo, i I I I
v
IOOt JAN
,, ~ , , ,1 , ,
' \> ~\l\1964
\ I ' 'J
1963
' -FEB MAR APR
Station
MAY
-------
-t -·-· - t ----- - -t ...
\ ,,
.~
,' ' I ,.~ :\ -r
rl :IJ'i I\ I \ I ;r, \. t'1 ~ ,•\I \ f\ ,, ivJ \ I 11
11 1"J I fl I \ (\ I ,., ' I \ I •
1 1 11 l I I I \ I ', 11 1 tl I ll1i I 1, ~,,, , "r , \~-' '"' "" .... ,111 \ I Y \ I v r
,I \ I \ I ~ \ I \,
\ ' '"\ I
..
' l I, ' , • 11 I• I\ ,, II I , 1, ,, I\ I \
I I " I Jl \, \ I I l 1\ t t iV -... . l" . ,, 1 \ : 1 a J. 11 ·-I \ ! ,-~w, I I I \ I\ 11 ~I .......... ~ ~ i\ I, \ ~ I I \I ! '-, ";'ij I ~ \. I I V
1\...,) I \\~ I J I 'n l I
JUN JUL AUG " '.,SEP I OCT NOV) DEC ~J
3-2125 Levisa fork at Painlsville. Ky. FIG. 1,

IJ..X.)(},()O()+-- --
ILl,lk..lll+----· ---
l,\)Jl.),<'lf'I(_)-,...--.
1,V('CI +---
.000,000+--- ---- -
1C,;:-C-O+----
,,000-+-- - -t---- -
.. W.000-t----·
.. , ,' (_/.
I .., .,._r ,!J+--.
- --·f- -----
\ \ \ I I
'J \111 ~--
+-- ·--- -- -f ------· ·-t
. --l
~, , \ \ I' \ ""\ f \ 1964 \ \ I 'J \ .. . .. ~
1963
. +
\ ~
1,000+---- t .. --·· - +- --- -----+-- -- · · - ---+-------+--- · + · t-
JAN FEB MAR APR MAY JUN JUL AUG SEP
Station 3·2550 Ohio Rivei al C1ncinnali. Ohio
t·
-·---;N ·-+
,, IY\.M. .... \'I/" ~J
·- --·- -----t-
-- --- -t-
('
I ' I \ I r ·f.'·· , . .,..
•1 ' I v I I I l., I "'J
J l.J
-·-. ·- ....
··+
·----+-
-+--· ·--- ....- -·· ,-OCT NOV DEC
FIG. 15
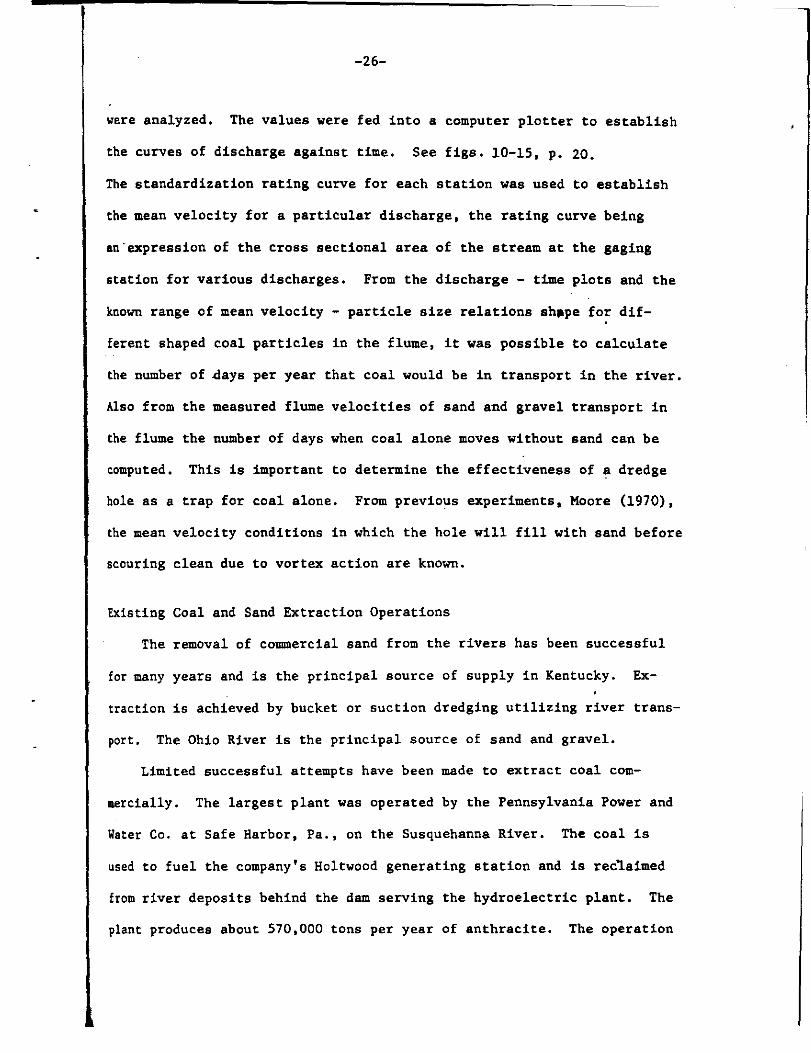
-26-
were analyzed. The values were fed into a computer plotter to establish
the curves of discharge against time. See figs. 10-15, p. 20.
The standardization rating curve for each station was used to establish
the mean velocity for a particular discharge, the rating curve being
an·expression of the cross sectional area of the stream at the gaging
station for various discharges. From the discharge - time plots and the
known range of mean velocity - particle size relations shJpe for dif
ferent shaped coal particles in the flume, it was possible to calculate
the number of 4ays per year that coal would be in transport in the river.
Also from the measured flume velocities of sand and gravel transport in
the flume the number of days when coal alone moves without sand can be
computed, This is important to determine the effectiveness of a dredge
hole as a trap for coal alone. From previous experiments, Moore (1970),
the mean velocity conditions in which the hole will fill with sand before
scouring clean due to vortex action are known.
Existing Coal and Sand Extraction Operations
The removal of c011DDercial sand from the rivers has been successful
for many years and is the principal source of supply in Kentucky. Ex
traction is achieved by bucket or suction dredging utilizing river trans
port. The Ohio River is the principal source of sand and gravel.
Limited successful attempts have been made to extract coal com
mercially. The largest plant was operated by the Pennsylvania Power and
Water Co. at Safe Harbor, Pa., on the Susquehanna River. The coal is
used to fuel the company's Holtwood generating station and is rec~aimed
from river deposits behind the dam serving the hydroelectric plant. The
plant produces about 570,000 tons per year of anthracite. The operation

extracts both coal and sand from the river and the coal is subsequently
separated in a sophisticated plant.
Smaller operations have functioned on some of the minor tributaries
of the Ohio River and an example is that of the Guyan River Co. on the
Guyandotte River at Midkiff, West Va •. The output of approximately 20,000
tons per year of coal is a by-product of the company's principal business
of supplying sand for local consumption. A six inch sand pump _conveys
the coal, sand and water mixture by pipeline to a simple separation plant
on the bank. Similar small scale operations were inspected at Allen, Ky.,
on the Levisa Fork of the Big Sandy River and at Beattyville, Ky., on
the Kentucky River. All plants only utilize one pumping location.

CHAPTER III
DATA AND RESULTS
RIVER SAMPLING
The river sampling showed a number of associations of different sized
sediment and a very variable distribution of coal particles with other
sediment, As expected, the sediment distribution patterns in ~entucky,
Ohio and Big Sandy Rivers showed major differences. Sediment size in
elastic rock and rock derived particles varied from clay to silt, fine
sand, sand, gravel and cobble sizes. Very little coal finer than #20
mesh was collected but all coarser sizes up to cobble size were repre
sented. Isolated examples of boulder size coal up to 2 cu. ft •. in volume
were collected on river bars after high water in the Kentucky River.
Several sediment regimes or associations could be identified:
(A) Cobble sized rock particles with some gravel. This associa
tion was restricted to the line of maximum current flow in the rivers,
following the thalweg.
(B) Gravel and coal. The coal particles are from fine to coarse
gravel size and minor amounts of sand are associated.
(C) Sand with minor amounts of silt but no coal.
(D) Sand with coal. This was the most common association in
which the coal occurred. Coal particles varied from #20 mesh to 1-2
inch sizes.
(E) Clay with minor amounts of silt and usually containing abundant
organic matter such as sticks, leaves, etc. This association was almost
always a capping to coarser sediment beneath and is apparently the deposit
of very low wster conditions when the river returns to pool level.

-
Kentucky River Pool 112
Station 11 Mile Point
2-1
2-2
2-3
2-4
2-5
2-6
2-7
2-8
2-9
2-10
2-11
42
41
40
39
38
37
36
36
35
34
33
-29-
TABLE 1
Position in Channel Facing Downstream
Right Side
A
Coal Sand
Clay Sand Cobbles
Sand
No Sample
Sand & Some Clay
Clay
Centre
B
Sand
Sand
Coral Sand Gravel
Cobb lee Gravel sand
Coal, Gravel Sand
Gravel Cobbles
Clay Sand & Cobbles
Coal Sand
Left Side
c
Coal Gravel Sand
Clay Fine Sand
No Rock Sample
Clay & Fine Send
Sand
Sand
No Sample (Rock) Coal Sand Gravel Clay
Clay Sand San
Clay & Fine Sand Coal, Gravel Clay Sand
Clay & Fine Sand Little Coal No Sand Sample (Rock)

-30-
Kentucky River Pool #9
Sample II Mile Post Position in Channel Looking Downstream
Right Side Center Left Side
A B c
9-1 176 No Sample Coal, Sand Coal, Sand
9-2 175 Clay & Sand Coal Cobble Sand Gravel
9-3 174 No Sample (Rock) Sand, Gravel Sand
9-4 173 Rock Coal, Sand •Clay & Sand Gravel
9-5 172 Clay Cobble Sand, Fine Some Sand Sand
9-6 171 Clay Coal Sand Clay Gravel
9-7 170 Clay Coal, Sand Cobble
9-8 169 Sand Cobble Sand & Clay
9-9 168 Sand Cobble Sand
9-10 167 Cobble Coal, Sand Sand
9-11 166 Clay Sand No Sample (Rock)
9-12 165 Sand & Clay Coal, Sand Sand
9-13 164 Sand Cobble Clay
9-14 163 Clay & Sand Coal Sand Sand & Clay Gravel
9-15 162 Sand Coal Sand Clay Gravel
9-16 161 Sand Coal, Sand Clay
9-17 160 Clay No Sample Clay
9-18 159 Clay Clay Clay
9-19 158 Clay Clay Clay
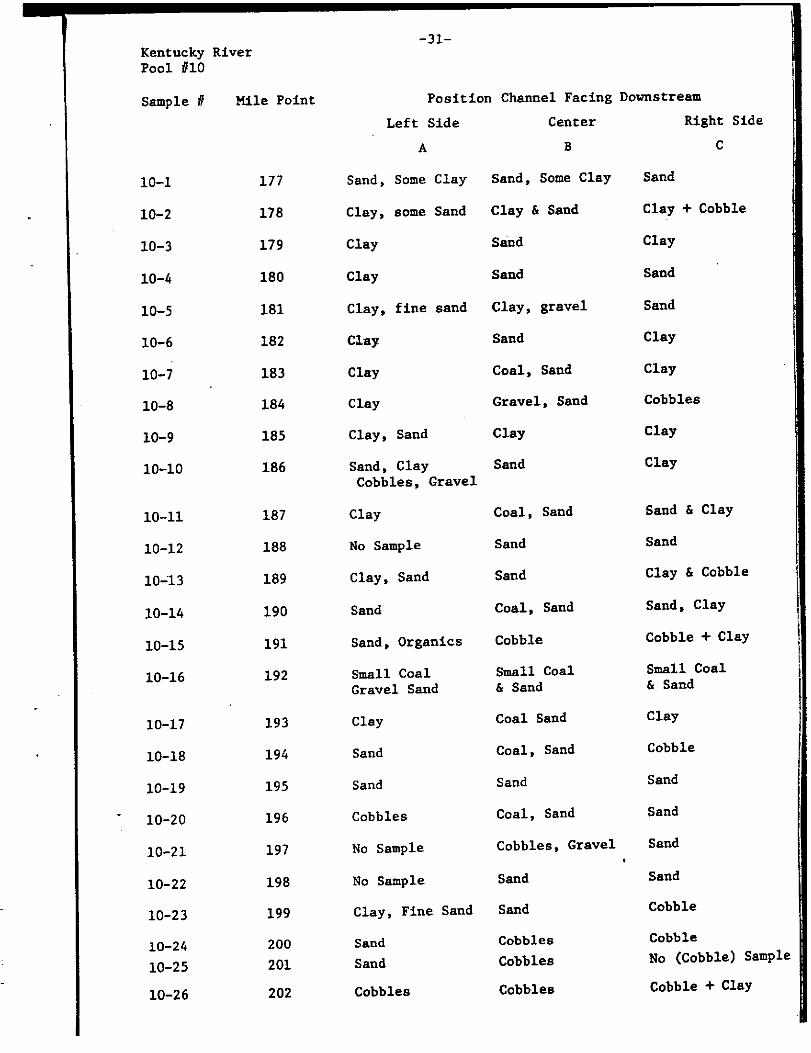
Kentucky River Pool 1110
Sample fl Mile Point
10-1
10-2
10-3
10-4
10-5
10-6
10-7
10-8
10-9
10-10
10-11
10-12
10-'13
10-14
10-15
10-16
10-17
10-18
10-19
10-20
10-21
10-22
10-23
10-24
10-25
10-26
177
178
179
180
181
182
183
184
185
186
187
188
189
190
191
192
193
194
195
196
197
198
199
200 201
202
-31-
Position Channel Facing Downstream
Left Side
A
Sand, Some Clay
Clay, some Sand
Clay
Clay
Clay, fine sand
Clay
Clay
Clay
Clay, Sand
Sand, Clay Cobbles, Gravel
Clay
No Sample
Clay, Sand
Sand
Sand, Organics
Small Coal Gravel Sand
Clay
Sand
Sand
Cobbles
No Sample
No Sample
Clay, Fine Sand
Sand Sand
Cobbles
Center
B
Sand, Some Clay
Clay & Sand
Sand
Sand
Clay, gravel
Sand
Coal, Sand
Gravel, Sand
Clay
Sand
Coal, Sand
Sand
Sand
Coal, Sand
Cobble
Small Coal & Sand
Coal Sand
Coal, Sand
Sand
Coal, Sand
Cobbles, Gravel
Sand
Sand
Cobbles Cobbles
Cobbles
Sand
Right Side
c
Clay+ Cobble
Clay
Sand
Sand
Clay
Clay
Cobbles
Clay
Clay
Sand & Clay
Sand
Clay & Cobble
Sand, Clay
Cobble+ Clay
Small Coal & Sand
Clay
Cobble
Sand
Sand
Sand
Sand
Cobble
Cobble No (Cobble) Sample
Cobble+ Clay
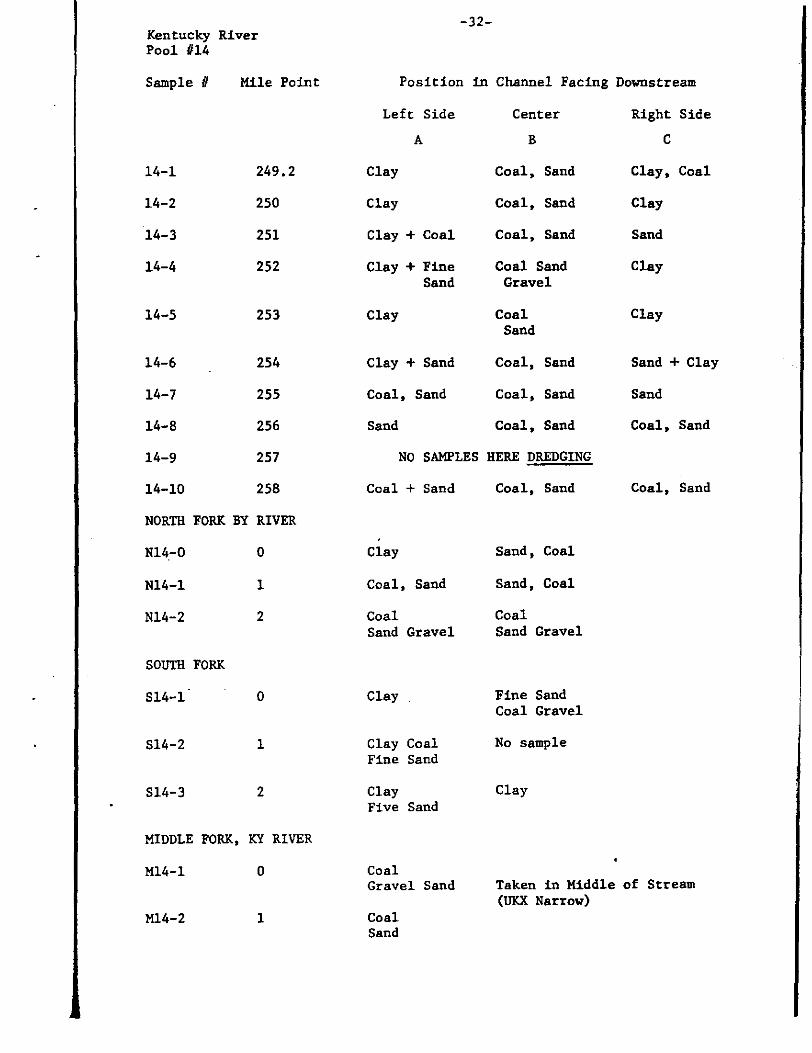
Kentucky River Pool 1114
Sample# Mile Point
14-1 249.2
14-2 250
14-3 251
14-4 252
14-5 253
14-6 254
14-7 255
14-8 256
14-9 257
14-10 258
NORTH FORK BY RIVER
Nl4-0 0
Nl4-l 1
Nl4-2 2
SOUTH FORK
514-1 0
514-2 1
814-3 2
MIDDLE FORK, KY RIVER
Ml4-l 0
Ml4-2 1
-32-
Position in Channel Facing Downstream
Left Side
A
Clay
Clay
Clay+ Coal
Clay+ Fine Sand
Clay
Clay+ Sand
Coal, Sand
Sand
Center
B
Coal, Sand
Coal, Sand
Coal, Sand
Coal Sand Gravel
Coal Sand
Coal, Sand
Coal, Sand
Coal, Sand
Right Side
c
Clay, Coal
Clay
Sand
Clay
Clay
Sand+ Clay
Sand
Coal, Sand
NO SAMPLES HERE DREDGING
Coal + Sand
Clay
Coal, Sand
Coal Sand Gravel
Clay
Clay Coal Fine Sand
Clay Five Sand
Coal Gravel Sand
Coal Sand
Coal, Sand
Sand, Coal
Sand, Coal
Coal Sand Gravel
Fine Sand Coal Gravel
No sample
Clay
Coal, Sand
Taken in Middle of Stream (UKX Narrow)
-33-
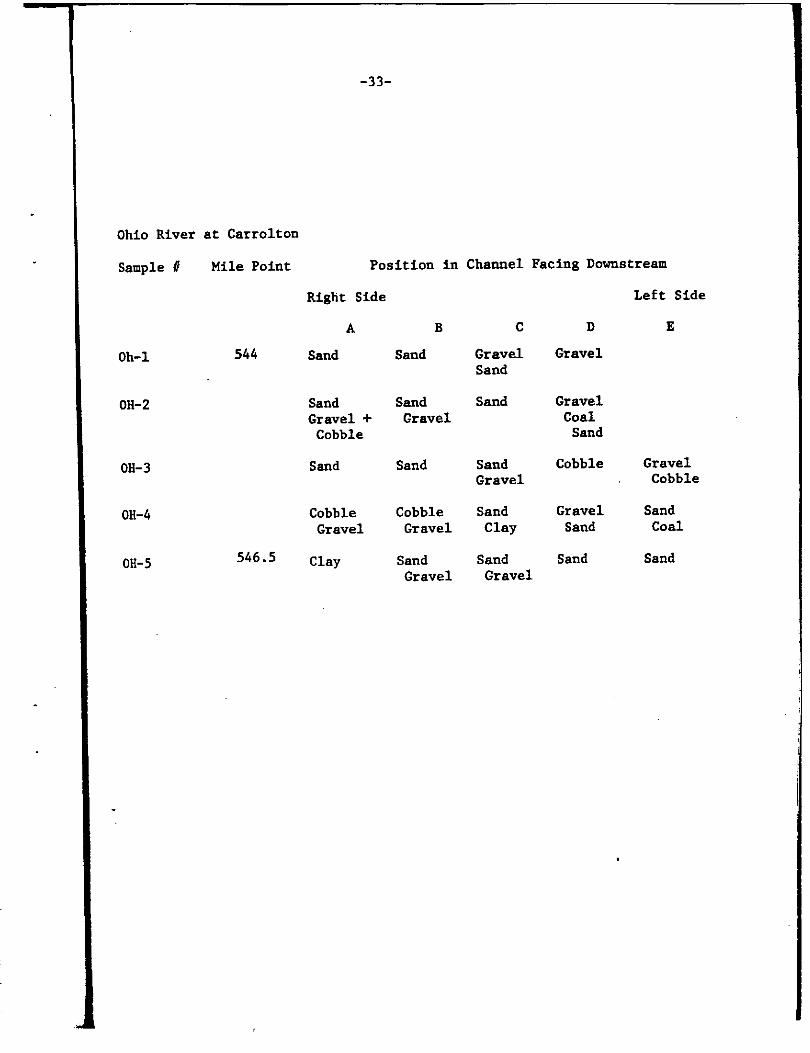
Ohio River at Carrolton
Sample fl Mile Point Position in Channel Facing Downstream
Right Side Left Side
A B c D E
Oh-1 544 Sand Sand Gravel Gravel Sand
OH-2 Sand Sand Sand Gravel Gravel+ Gravel Coal
Cobble Sand
OH-3 Sand Sand Sand Cobble Gravel Gravel Cobble
OH-4 Cobble Cobble Sand Gravel Sand Gravel Gravel Clay Sand Coal
OH-5 546.5 Clay Sand Sand Sand Sand Gravel Gravel

-34-
Kentucky River
The distribution of t:he various sediment: associations A, C, D, E
in t:he Kentucky River appear t:o be closely related to t:he meandering
of t:he t:halweg or line of maximum flow. Association B of gravel and
coal was not: found on any sample locations in t:he river. The position
of t:he t:halweg in Pools 9 and 10 was always marked by Association A of
cobble sized rock particles wit:h some gravel. The maximum coal occurs
in Association D of sand and coal and Association C of almost pure sand
is widely distributed. The occurrence of coal and sand at locations
close to those with pure sand seems due to a subtle gradation of flow
conditions laterally in the flow. The clay and organic matter Associa
tion E does not accumulate along t:he thalweg but: usually caps t:he under
lying coarser sediment: to each side of t:he thalweg during low flow
conditions. See sample details (Table 1 , p. 29). Most: of the Ken
tucky River coal appears to be carried by the Nort:h Fork rather t:han the
South and Middle Forks. The Red River makes a significant: coal contribu
tion even though it drains an area of very little coal mining activity.
The quantities of coal in t:he river vary longitudinally down the
course. The.maximum coal occurs in Pool 14 above Beattyville wit:h values
from 30%-75% by weight. Pools 9 and 10 have the least: coal from 5%-30%
and Pool 2 had considerable quantities from 15%-45%. The scarcity of
coal in the middle portion of the river course at Pools 9 and 10 is
attributed to the rockbound nature of the channel in this region giving a
smaller cross sectional area and faster flow conditions which ~o not
allow the coal t:o deposit:. The positions of locks and dams do not: appear
to influence the sediment: distribution pattern and coal and other sedi
ment: freely flows over these structures when the river is above pool stage.

-35-
A study of the roundness of coal indicated little difference in
roundness between coal in Pool 14 and that in Pools 9, 10 or 2. All the
coal in the river was much more rounded than any left at coal tipples or
mining dumps along the river. The indication is that maximum rounding
occurs between erosion from the source to the point where the coal enters
the main river for transport. The significance of this will be further
discussed under the source and origin of the river coal.
At the confluence of both the Big Sandy and Kentucky Rivers with
the Ohio River there was a noticeable build-up of clay and silt deposits
in the tributaries, presumably due to the damming effect on them by the
Ohio River.
Big Sandy River
The river is generally shallow with depths ranging from 1-10 feet.
No clay of sediment Association E was encountered and bottom is generally
sand of Association C or D with coal and sand. Cobble and gravel sized
particles of Association A are present at the broad shallow stretches.
Abundant coal occurs at the sample localities at Prestonsburg and Louisa
with values of 30%-65% by weight. Samples with 25%-30% coal were taken
within six miles of the confluence of the Big Sandy and the Ohio with a
thin capping of clay. Lateral distribution of coal is variable and
appears to be a function of the meandering of the thalweg. Flow data
analysis shows that coal is in transport at some locations in the Big
Sandy River as many as 260 days per year. See table 2 , p. 38:
Ohio River
The sediments are coarser in the Ohio River than the other streams

-36-
and the coal most commonly occurs in Association B of coal and gravel in
the form of gravel bars. The pure sand Association C is common but the
clay Association E was not encountered. Coal was sampled in sediment up
stream of the Big Sandy confluence with the Ohio indicating a source of
supply other than the Big Sandy River. Sediment with 30%-35% coal was
sampled as far downstream as Louisville. Generally no coal was obtained
in the thalweg of the river. The existing commercial sand operations are
located in sediment of Association C and those of Association B have been
rejected for commercial sand.
Source of the Coal in the Kentucky River
The project took into account the three possible sources:
(a) coal mining and washing operations
(b) spillage from barge and rail loading
(c) natural erosion
No coal has been barged on the Kentucky River in the last twelve
years and this tends to rule out this source. Coal from mining and
washing operations is angular on refuse piles even to the water's edge
and no appreciable quantity of angular coal was found even in the upper
reaches of the river. Also the coal released from coal washing opera
tions is less than #40 mesh and this size constitutes only a minute
fraction of the coal found in the river, hence natural erosion was
investigated.
Several geological quadrangles in the catchment area of the.Kentucky
River were investigated to determine the tonnage of coal eroded from the
number of line miles of outcrop using published rates of erosion for the
area. The calculation yielded a conservative annual contribution from

• PEBBLE BOT TOM
Q SAND BOTTOM
~ () SAND-PEBBLE BOTTOM 0:: 1.0 -0 c.. Cl)
z <(
0:: ~
0:: 0.75
0 ..... I () I
"' "' I ------ ·~ ,.... I i' 0. -- --------.,..,_
>- 0.5, 0 -g ~ - ,..,.
c., 0 _, ..., >
0.25 z <( ..., :::;;
0 20 10 5 I 2
mesh mesh m~sh inch inch
COAL SIZE
GRAPH OF THRESHOLD TRANSPORT RESULTS FOR FLUME FIG .16

-38-TABLE 2
TOTAL DAYS DATA DAYS NO DAYS ALL SIZES TO YEAR STATION NO. AVAILABLE COAL MOVED 2" COAL MOVED
68 365 33 238
69 365 84 196
70 273 29 181
62 32550 Ohio River
63 At Cincinnati 180 0 174
64 181 0 173
65 144 0 144
66 211 0 211 ·
67 181 0 181
68 215 0 215
69 217 0 216
70 150 0 150
63 32840 Kentucky 365 lll 117
64 River at Lock 10 365 83 158
65 Near Winchester 365 123 128
66 365 62 134
67 365 66 198
68 365 72 149
69 365 139 114
70 273 64 119
63 32905 Kentucky 365 68 169
64 River at Lock 2 365 64 184
65 At Lockport 365 69 156
66 365 33 210
67 365 23 229
68 365 20 186
69 365 89 170
70 273 27 169
.i

-39-
TOTAL DAYS DATA DAYS NO DAYS ALL SIZES TO YEAR STATION NO. AVAILABLE COAL MOVED 2" COAL TRANSPORT
63 32125 Levisa Fork 365 0 286
64 At Paintsville 365 0 314
65 365 0 287
66 365 0 331
67 365 0 347
68 365 0 357
69 365 0 354
70 273 0 273
63 32150 Big Sandy 365 21 184
64 At Louisa 365 6 220
65 365 0 180
66 365 0 266
67 365 0 292
68 365 0 265
69 365 0 180
70 273 0 172
63 32160 Ohio River 164 0 160
64 At Ashland 159 0 151
65 119 0 119
67 181 0 181
68 192 0 176
69 195 0 191
70 150 0 149

-40-
TOTAL DAYS DATA DAYS NO COAL DAYS ALL COAL SIZES YEAR STATION NO. AVAILABLE TRANSPORTED TO 2" TRANSPORTED
63 32380 Ohio River 365 133 103
64 At Maysville 152 0 107
65 119 0 114
66 158 0 139
67 181 0 156
68 188 0 131
69 181 0 113
70 150 0 133

-41-
erosion of the order of 500,000 tons which would far exceed the con
tribution from other sources. Also most of the coal recovered is in the
13,000 BTU range, low on ash and sulphur, and therefore not waste material.
A study of localities in the Red River, a tributary of the Kentucky
River in Pool 10, indicates more coal being transported per volume of
sediment than the Kentucky River above their junction. This further
supports natural erosion as the principal source of the coal since little
or no coal mining activity exists on the Red River.
FLUME RESULTS
(a) Estimation of Threshold Velocity of Transport
Experiments used coal of sizes 10-20 mesh, 10-5 mesh and l" size
all of varying shapes on differing bottom mixtures. The bottom composi
tions were river sand, pebbles of 1/2" average size and a river sand
and pebble mixture. Results are shown in figure 16, p. 37 , and are the
averages of several runs. The velocities were recorded when a particular
coal size showed general movement.
On a sand bottom, the shape of the 1" sizes gave a considerabl!!
spread of velocity values due to the position of a particularly shaped
particle in the boundary layer and velocity profile. On a pebble bottom
the smaller sizes penetrated the spaces between the pebbles and only the
1" size moved.
In general, the transport of the fine coal begins at approximately
0.3 fps and most shapes to 2" size are in transport at 0.7 fpe. At this
velocity pure coal will be trapped in a dredge hole.
When the velocity of the flume reaches approximately 1.0 fps sand
and coal accumulate in the hole and above 1.2 fps vortex action removes

-42-
•
O.f FROUOE N° 0.05
HOLE CONFIGURATION NO IIIARKEO
0.5
0.4
"' 0.3 Q. -.&>
>
0.2 •
0.1
7
0.5 1.0 2.0 4.0
GRAPH OF df/d AND Vf FIG .17

t
'
-43-
the coal leaving mainly sand. When the mean velocity exceeds 1.8 fps
the vortex action in all the model holes was sufficient to remove all
the sand from the hole. Hence the models indicate a period of flow when
pure coal collects, then ssnd and coal, then pure sand before the hole
scours clean.
These velocities should approximate those corresponding for the
river.
(b) Evaluation of Shape, Size, Flow Conditions and Trap Efficiency of Model·Holes
The ratio of depth of flume flow to the depth of the hole was made
4.0, 2.0, 1.0 and 0.5 in flume runs using a Froude N° of 0.05. The
dimensions of the model holes and their position in the flow were varied
according to the configuration diagram, figure 9, p. 19. The velocity
at the center bottom of the hole was compared to flume velocity. The
bottom velocity is plotted against the depth ratio df/d in figure 17,
p. 42, where df is the depth of flow in the flume and dis the depth
of ·the hole. Maximum trap efficiency occurs when the depth of the flume
is twice that of the hole and maximum scour conditions occurs when hole
and flume depths are approximately equal. Hole configurations #2
through #6 all appear to be efficient traps with the smaller sizes more
economical to construct and maintain.
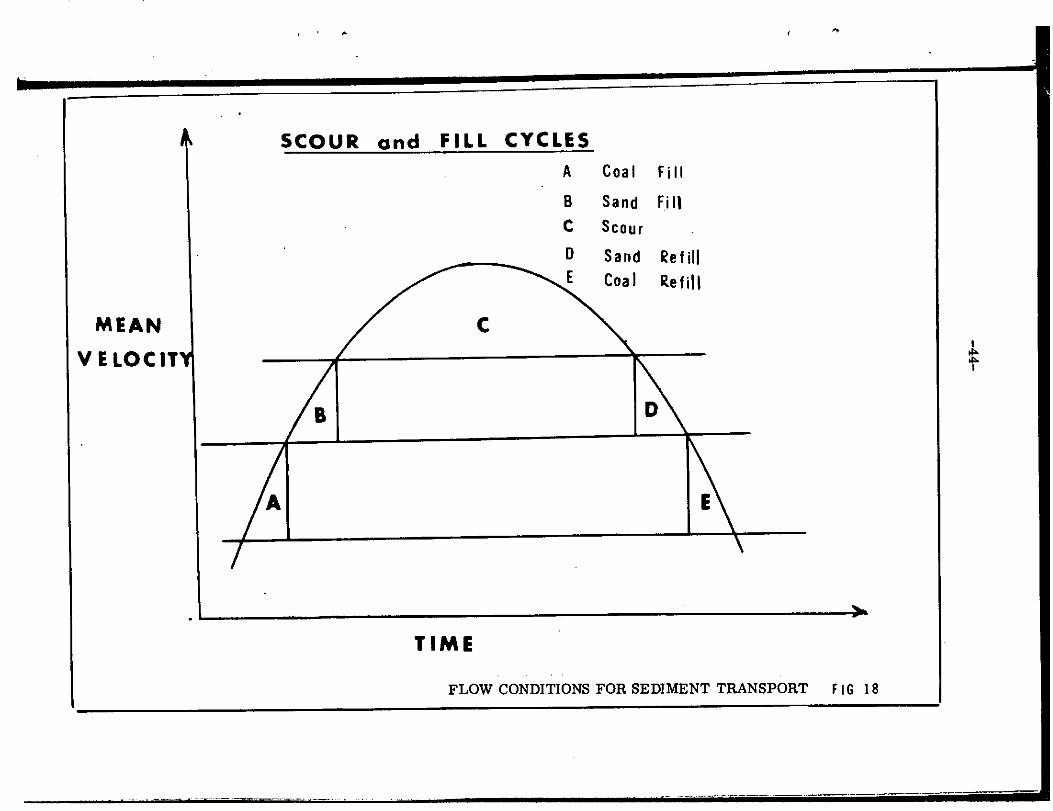
Analysis of Flow Records
Previous observations on the movement of river sand in flume •
experiments, Moore (1970), indicated that 0.175 mm river sand began
movement at 0.8 fps. The small coal sizes in the flume began movement at
0.3 fps in the flume. These values are both considerably lower than the
calculated values for the Ohio River of 1.38 fps for sand and 0.56 fps
• ~
SCOUR and FILL CYCLES
A Coal Fi II
B Sand Fi II c Scour
Sand li?e fill Coal Ref ii I
MEAN J / c ~ VELOCIT I I
" "" }\ "" I
TIME
FLOW CONDITIONS FOR SEDIMENT TRANSPORT FIG 18
·---- ·---·--- --

c
•
-45-
for coal.
Both the flume and calculated river values indicate a period of flow
with mean velocity between 0.3 fps and 0.8 fps for coal in the flume for
which coal alone will be moving. If the coal can be trapped during this
period of flow then coal alone will fill the hole. Above 0.8 fps in the
flume the hole fills with a coal and sand mixture and then scour clean of
sand and coal above 1.8 fps due to vortex action, Moore (1970). The
operation of this vortex action in the river has been observed in the
Ohio River at 2.0 fps, the indication being that mean velocity values
will be higher in the river than in the flume.
An analysis of flow conditions above 0.7 fps at the gaging stations
to estimate the number of days a year coal sizes up to 2" would be moving.
The results are shown in table 2, p. 38.
Technical difficulties of bottom load measurement in the rivers will
have to be overcome before these results can be confirmed in the rivers.
CONCLUSIONS
1. Significant quantities of coal occur in the rivers studied but
their distribution is irregular and is a function of the flow conditions
in the river.
2. The coal is in transport at much lower velocities than the sand
and other material.
3. Coal and sand mixtures are already being extracted on an economic
scale and separated into the two components.
4. A dredge hole trap designed for the particular flow conditions
of a location can improve the efficiency of extraction of both coal and

sand. Due to differential sorting and transport pure coal, coal and sand
mixtures, and pure sand can be extracted from the trap during different
conditions of flow.
5. The dredge hole can be designed to scour clean during condi
tions of high water as the original study hole at Louisville has done.
6. Five major sediment associations with coal, sand and mud were
encountered and described. These associations are the result of hydraulic
conditions at a particular location.
7. The efficiency of a dredge hole trap is a function of the ratio
of depth of flow in the channel to the length and depth of the hole.
The most efficient trap should have a ratio of 2 for flow depth to hole
depth.
8. The origin of the coal is primarily from natural erosion and
secondarily due to mining and transport activities.

BIBLIOGRAPHY
Moore, Bruce R., 1970, Scour and Fill Process in a Deep River Hole, Ohio River, Louisville, Kentucky. Jour. Sed. Pet., vol. 40, p. 449-456.
~~· 1971, The Distribution of Pennsylvanian Age Coal Particles in Recent River Sediments, Ohio River, Kentucky as Age and Sediment Rate Indicators. Sedimentology, vol. 17, p. 135-139.
U.S. Army Corps of Engineers, 1972a, Navigation Charts for Ohio River,
U.S. Army. Corps of Engineers, 1972b, Navigation Charts for Kentucky River.
Vanoni, V. A,, 1964, Measurements of Critical Shear Stress for Entraining Fine Sediments in a Boundary Layer. Cal. Tech. Rep, N°KH-R-7. 47 p.