hybrid-layered manufacturing using tungsten inert gas cladding
TRANSCRIPT

FULL RESEARCH ARTICLE
Hybrid-layered manufacturing using tungsten inert gas cladding
Sajan Kapil1 • Fisseha Legesse1 • Pravin Kulkarni1 • Prathamesh Joshi1 •
Ankit Desai1 • K. P. Karunakaran1
Received: 11 February 2016 / Accepted: 17 February 2016 / Published online: 22 March 2016
� Springer International Publishing Switzerland 2016
Abstract Among the different additive manufacturing
(AM) processes, hybrid-layered manufacturing (HLM) is
the AM process of metals which combines the best features
of additive and subtractive manufacturing techniques. In
HLM process, the metal is deposited by a cladding process
and after the deposition of near-net shape, a machining
operation is used for achieving dimensional accuracy. In
this work, TIG cladding-based HLM process has been
studied and stabilized by retrofitting a TIG cladding unit on
an existing CNC machine. The behavior of TIG-HLM
process has been studied for a mild steel cladding wire
ER70S-6 of 1.2 mm diameter by performing the three
types of experiments: single-bead, multi-bead and multi-
layer experiments. The single-bead experiments are per-
formed along with Taguchi and ANOVA to find out the
contribution of process parameters such as cladding cur-
rent, torch speed, wire feed rate and standoff distance on
the bead width, height and penetration. The multi-bead
experiments are performed to find out the optimal height of
a layer where bead width is the input parameter. The multi-
layer experiments are required for the characterization of
the process and consist of hardness test by nano-indentation
testing, microstructure analysis by electron backscattered
diffraction, and interlayer fusion test by X-ray analysis. A
case study has been done by manufacturing a cylindrical
object of 50 mm height using this process.
Keywords Additive manufacturing (AM) � Hybrid-layered manufacturing (HLM) � Tungsten inert gas (TIG) �Taguchi � ANOVA � Electron backscattered diffraction
(EBSD)
1 Introduction
Direct metal deposition (DMD) developed at Southern
Methodist University, USA is a 3D Welding process which
uses tungsten inert gas (TIG) cladding process for depo-
sition [1–4]. Although they used an MIG cladding in the
beginning, they subsequently shifted to a TIG cladding as
they found it to be a much more controllable process for
deposition with fewer problems of sputtering, intensive
heating, smoke, etc. One of the difficulties with TIG is the
need for orienting the automatic wire feeder nozzle to
match with the torch direction, which adds a rotary axis in
addition to X and Y during the deposition. A novel free-
form fabrication method named 3D microwelding
(3DMW) has been developed using an idea to combine
free-form fabrication method with TIG by researchers of
Osaka University, Japan [5, 6]. When pulsed micro-arcs are
emitted, the tip of a thin metal wire with a diameter of
0.1–0.3 mm is fused and a micrometal bead is formed
instantaneously. The fused bead is welded to a metal
substrate or previously formed layers. By continuing this
& Pravin Kulkarni
Sajan Kapil
Fisseha Legesse
Prathamesh Joshi
Ankit Desai
K. P. Karunakaran
1 Mechanical Engineering Department, Indian Institute of
Technology Bombay, Mumbai 400076, India
123
Prog Addit Manuf (2016) 1:79–91
DOI 10.1007/s40964-016-0005-8
process and building up hot beads layer by layer under the
control of CAD/CAM system, 3D metal objects can be
produced. This process can be applied not only to titanium,
but also to other refractory metals such as tantalum,
tungsten due to the high-density energy beam of the micro
arc. When thin wires of two different metals such as Ti and
Ni, or Ni and Al are fed alternately from the opposed
spools, it is possible to build complex 3D structures and
components composed of their alloys or inter-metallic
compounds. Shape deposition manufacturing (SDM) is
another arc-based deposition process which makes use of
deposition and milling [7–9]. It uses a pair of materials, one
for model and the other for support. Copper is used as the
support material for steel models. Unlike the uniform
slicing used in 3D welding, it uses very thick segments.
These segments are obtained by splitting the object wher-
ever its normal just becomes horizontal. In any slice, all
regions of the slice where the normal points downward,
support is required. This near-net shape is then finished for
the deposition of the model material. Thus, each slice is
built by deposition and machining of support and model
materials alternately until the entire slab of the slice is
complete. Owing to its five-axis kinematics and path
planning involved, SDM is not a fully automatic process.
Wire ? Arc Additive Manufacturing (WAAM), at Cran-
field University, UK, uses TIG and plasma welding com-
bined with a wire feeding system [10, 11]. For Ti–6Al–4V
they can produce a wall of width 17.5 mm and claim that
the deposition rate can be achieved up to 1.8 kg per hour.
Using this process Ti spar, steel turbine blade, etc., are
manufactured. Plasma arc process is an extension of the
TIG cladding process. Hybrid plasma deposition and mil-
ling (HPDM) is the process which uses plasma as a power
source. This process is developed at Wuhan University,
China [12, 13]. It employs the combination of plasma
deposition as an additive and milling as a subtractive
process. The machine has two working procedures: depo-
sition by plasma and surface finishing by NC milling head.
In the HPDM process, plasma deposition is used to deposit
single beads side by side. When a layer is deposited, its top
surface is machined using planar milling to obtain a smooth
surface. After all the layers are deposited, the near-net
shape is finish machined on the same platform. In next
section, the hybrid-layered manufacturing (HLM) process
has been described in detail.
1.1 Hybrid-layered manufacturing
Hybrid-layered manufacturing (HLM) process combines
the better features of additive and subtractive techniques.
In this process, first the near-net shape of the object is
manufactured by layered deposition (Addition) using metal
inert gas (MIG) cladding or tungsten inert gas (TIG)
cladding process. The near-net shape is then finish
machined using CNC machining (Subtraction).
HLM was started in IIT Bombay as an RM technology
that uses a pulsed synergic MIG deposition unit. The HLM
systems allow the production of large and low-volume
workpiece with high or optimal deposition rates. Deposi-
tion rates that can be achieved with MIG-HLM vary from a
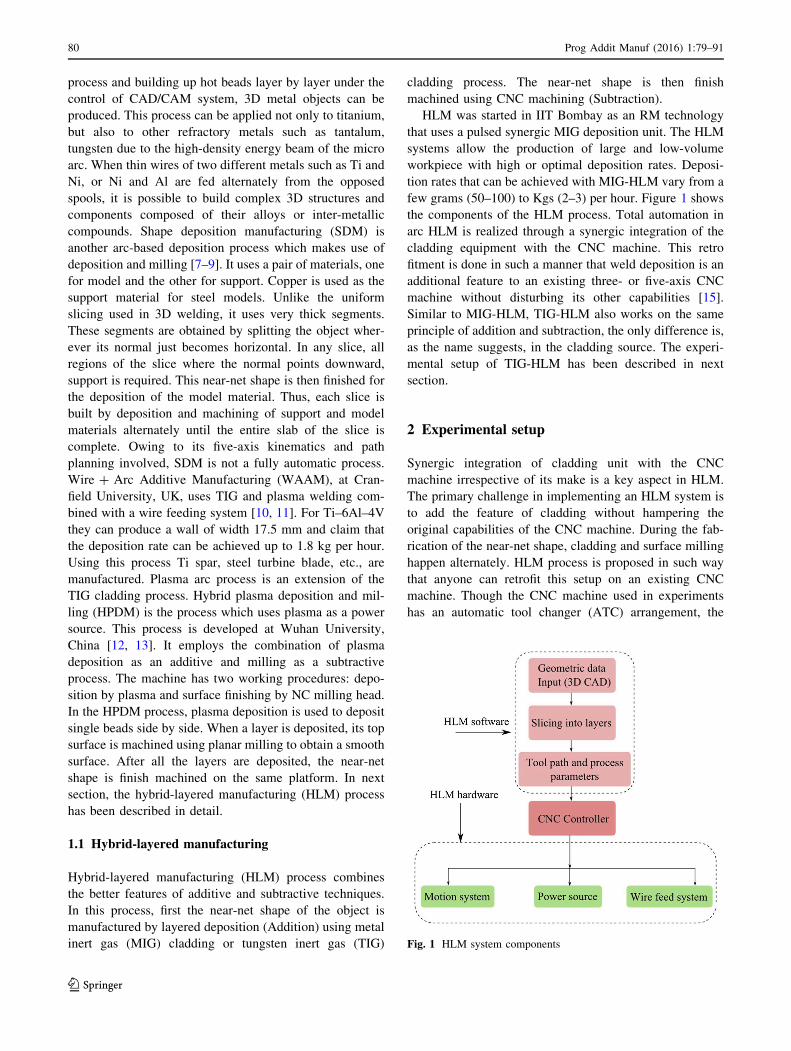
few grams (50–100) to Kgs (2–3) per hour. Figure 1 shows
the components of the HLM process. Total automation in
arc HLM is realized through a synergic integration of the
cladding equipment with the CNC machine. This retro
fitment is done in such a manner that weld deposition is an
additional feature to an existing three- or five-axis CNC
machine without disturbing its other capabilities [15].
Similar to MIG-HLM, TIG-HLM also works on the same
principle of addition and subtraction, the only difference is,
as the name suggests, in the cladding source. The experi-
mental setup of TIG-HLM has been described in next
section.
2 Experimental setup
Synergic integration of cladding unit with the CNC
machine irrespective of its make is a key aspect in HLM.
The primary challenge in implementing an HLM system is
to add the feature of cladding without hampering the
original capabilities of the CNC machine. During the fab-
rication of the near-net shape, cladding and surface milling
happen alternately. HLM process is proposed in such way
that anyone can retrofit this setup on an existing CNC
machine. Though the CNC machine used in experiments
has an automatic tool changer (ATC) arrangement, the
Fig. 1 HLM system components
80 Prog Addit Manuf (2016) 1:79–91
123

torch cannot be accommodated in one of the pockets as it
has a long hose. This problem is overcome by mounting the
torch on a side of the spindle head as shown in Fig. 2.
In case of TIG cladding process on a three-axis machine,
after material deposition, it is required to do face milling.
But the cladding torch datum is lower than the milling
cutter datum, so it is not possible to do milling without
removal or retraction of torch. But to save this manual
effort and to avoid misalignment of gun (which can be
caused during removal) a retractable design is introduced.
It is a customized pneumatic arrangement for automatic
retraction of cladding torch. This pneumatic arrangement
will retract gun to a desired position at a height well above
the milling datum during milling; and after milling it will
again be extended to the initial position for deposition, see
Fig. 3.
In the CNC machine, there are additional relays which
can be assigned to programmatically switch the TIG
machine ON and OFF. But in case of this experiment there
is no requirement of any additional relay. In this case, non-
essential relay during the HLM process is used and can be
addressed by a pair of M codes. The coolant ON/OFF
operation is not required during deposition process; there-
fore, this same relay is used for HLM implementation.
Thus, M08/M09 will control deposition in HLM mode and
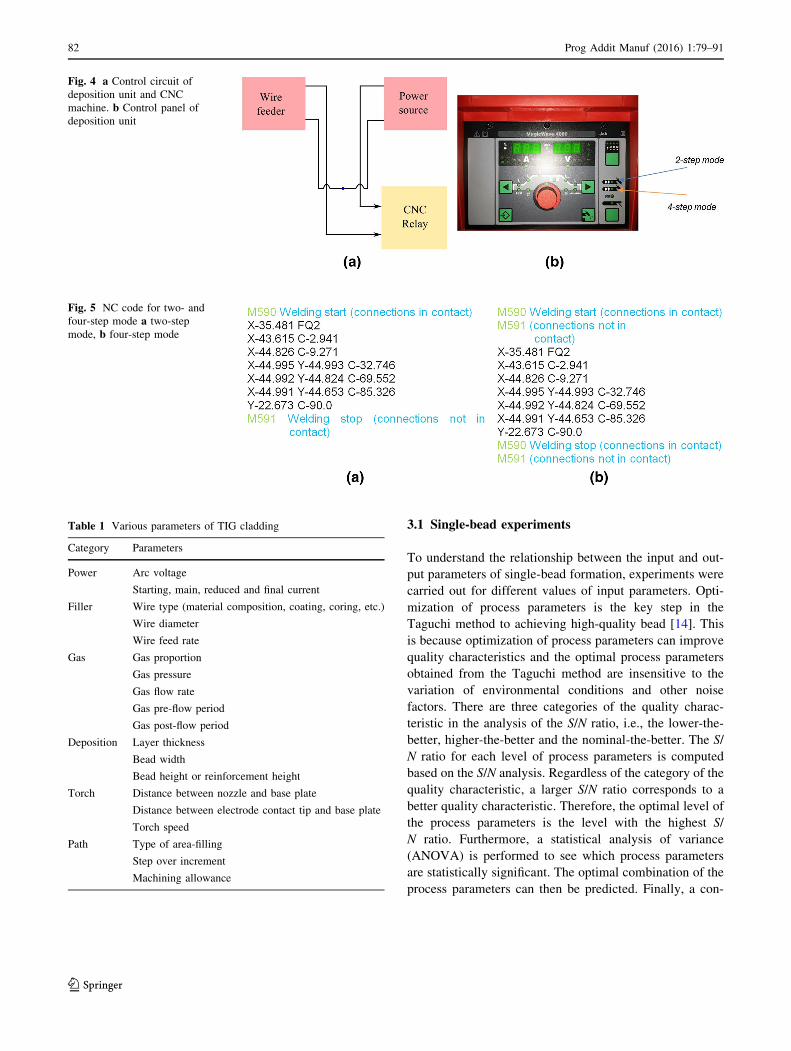
coolant flow in regular CNC mode. Figure 4a shows the
control circuit of deposition unit and CNC machine. One
wire from the power source is kept connected to the feeder
and the other end is connected to the CNC relay which
makes or breaks the power to the wire feeder. In TIG
deposition unit, there are two modes: One is called two-
step mode and the other is four-step mode shown in
Fig. 4b. In the two-step mode, a continuous high trigger
has to be given during cladding. When the trigger is
released, the cladding stops. On the other hand, in the four-
step mode, cladding starts the moment the trigger is pres-
sed; it continues even after the trigger is released. In this
mode, the same trigger should be pressed once more to stop
the cladding. Figure 5 shows the NC code used for two-
step mode and four-step mode. In our experiments, we use
the four-step mode always.
3 Process parameters
The process parameters of HLM have to be optimally
chosen so as to minimize material wastage and heat input
in addition to ensuring that the heat distribution happens
over a wider area. This requires a better understanding of
the influential process parameters and their inter-depen-
dencies. Three types of flows occur during deposition.
These are current flow, heat flow, and mass transfer. The
TIG cladding parameters can be categorized as listed in
Table 1.
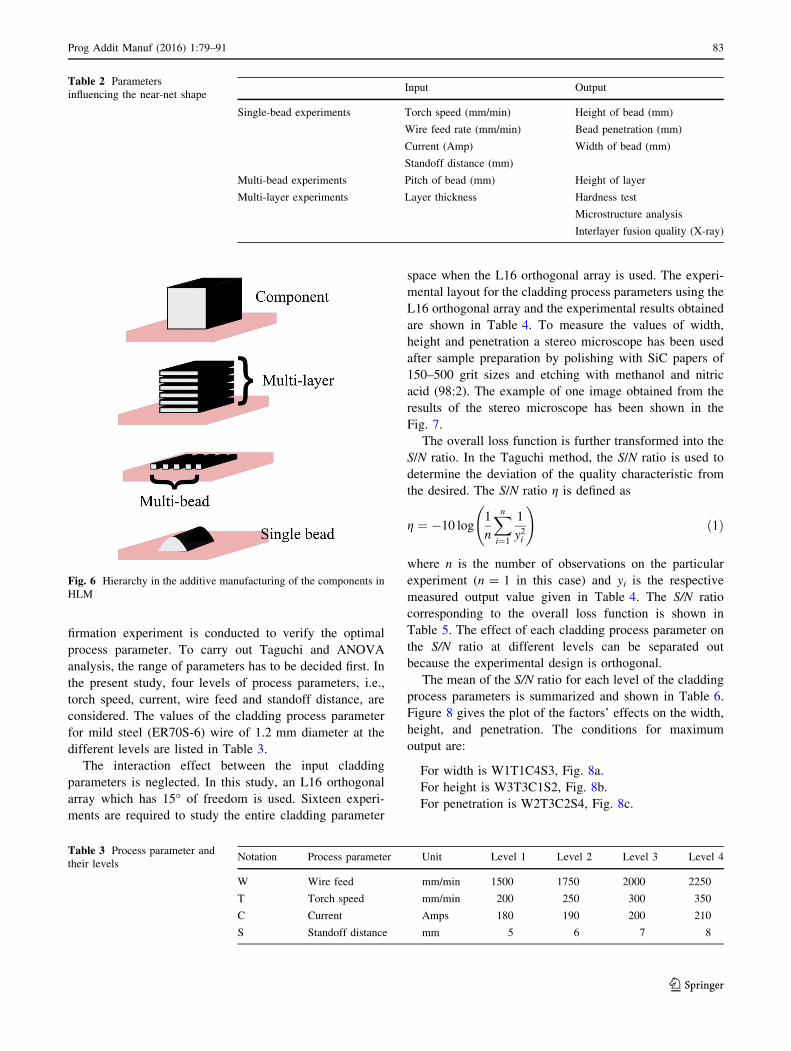
The TIG cladding parameters influencing the near-net
shape of the component are further categorized in Table 2.
Depending on the experiment mode which they influence,
the parameters are further divided into three categories
(single-bead experiments, multi-bead experiments and
multi-layer experiments) based on the hierarchy explained
in Fig. 6.
Fig. 2 TIG gun mounted on CNC machine
Fig. 3 CAD model of pneumatic arrangement in a retracted, b ex-
tended positions
Prog Addit Manuf (2016) 1:79–91 81
123
3.1 Single-bead experiments
To understand the relationship between the input and out-
put parameters of single-bead formation, experiments were
carried out for different values of input parameters. Opti-
mization of process parameters is the key step in the
Taguchi method to achieving high-quality bead [14]. This
is because optimization of process parameters can improve
quality characteristics and the optimal process parameters
obtained from the Taguchi method are insensitive to the
variation of environmental conditions and other noise
factors. There are three categories of the quality charac-
teristic in the analysis of the S/N ratio, i.e., the lower-the-
better, higher-the-better and the nominal-the-better. The S/
N ratio for each level of process parameters is computed
based on the S/N analysis. Regardless of the category of the
quality characteristic, a larger S/N ratio corresponds to a
better quality characteristic. Therefore, the optimal level of
the process parameters is the level with the highest S/
N ratio. Furthermore, a statistical analysis of variance
(ANOVA) is performed to see which process parameters
are statistically significant. The optimal combination of the
process parameters can then be predicted. Finally, a con-
Fig. 4 a Control circuit of
deposition unit and CNC
machine. b Control panel of
deposition unit
Fig. 5 NC code for two- and
four-step mode a two-step
mode, b four-step mode
Table 1 Various parameters of TIG cladding
Category Parameters
Power Arc voltage
Starting, main, reduced and final current
Filler Wire type (material composition, coating, coring, etc.)
Wire diameter
Wire feed rate
Gas Gas proportion
Gas pressure
Gas flow rate
Gas pre-flow period
Gas post-flow period
Deposition Layer thickness
Bead width
Bead height or reinforcement height
Torch Distance between nozzle and base plate
Distance between electrode contact tip and base plate
Torch speed
Path Type of area-filling
Step over increment
Machining allowance
82 Prog Addit Manuf (2016) 1:79–91
123
firmation experiment is conducted to verify the optimal
process parameter. To carry out Taguchi and ANOVA
analysis, the range of parameters has to be decided first. In
the present study, four levels of process parameters, i.e.,
torch speed, current, wire feed and standoff distance, are
considered. The values of the cladding process parameter
for mild steel (ER70S-6) wire of 1.2 mm diameter at the
different levels are listed in Table 3.
The interaction effect between the input cladding
parameters is neglected. In this study, an L16 orthogonal
array which has 15� of freedom is used. Sixteen experi-
ments are required to study the entire cladding parameter
space when the L16 orthogonal array is used. The experi-
mental layout for the cladding process parameters using the
L16 orthogonal array and the experimental results obtained
are shown in Table 4. To measure the values of width,
height and penetration a stereo microscope has been used
after sample preparation by polishing with SiC papers of
150–500 grit sizes and etching with methanol and nitric
acid (98:2). The example of one image obtained from the
results of the stereo microscope has been shown in the
Fig. 7.
The overall loss function is further transformed into the
S/N ratio. In the Taguchi method, the S/N ratio is used to
determine the deviation of the quality characteristic from
the desired. The S/N ratio g is defined as
g ¼ �10 log1
n
Xn
i¼1
1
y2i
!ð1Þ
where n is the number of observations on the particular
experiment (n = 1 in this case) and yi is the respective
measured output value given in Table 4. The S/N ratio
corresponding to the overall loss function is shown in
Table 5. The effect of each cladding process parameter on
the S/N ratio at different levels can be separated out
because the experimental design is orthogonal.
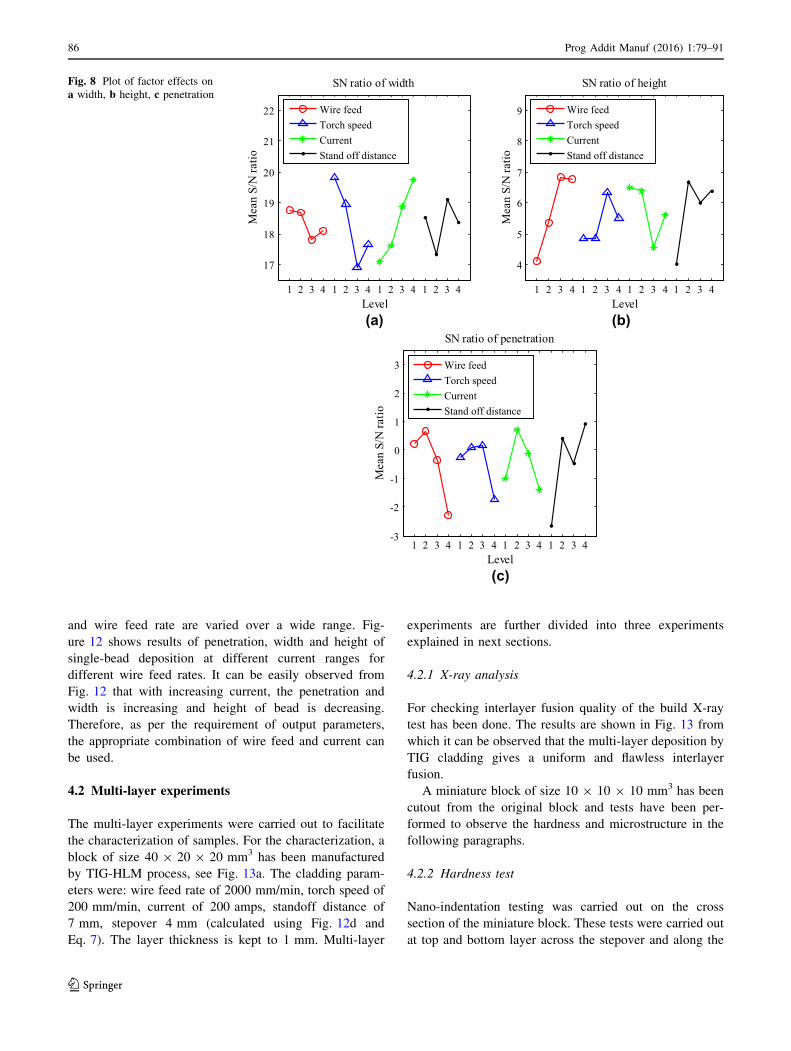
The mean of the S/N ratio for each level of the cladding
process parameters is summarized and shown in Table 6.
Figure 8 gives the plot of the factors’ effects on the width,
height, and penetration. The conditions for maximum
output are:
For width is W1T1C4S3, Fig. 8a.
For height is W3T3C1S2, Fig. 8b.
For penetration is W2T3C2S4, Fig. 8c.
Table 2 Parameters
influencing the near-net shapeInput Output
Single-bead experiments Torch speed (mm/min) Height of bead (mm)
Wire feed rate (mm/min) Bead penetration (mm)
Current (Amp) Width of bead (mm)
Standoff distance (mm)
Multi-bead experiments Pitch of bead (mm) Height of layer
Multi-layer experiments Layer thickness Hardness test
Microstructure analysis
Interlayer fusion quality (X-ray)
Fig. 6 Hierarchy in the additive manufacturing of the components in
HLM
Table 3 Process parameter and
their levelsNotation Process parameter Unit Level 1 Level 2 Level 3 Level 4
W Wire feed mm/min 1500 1750 2000 2250
T Torch speed mm/min 200 250 300 350
C Current Amps 180 190 200 210
S Standoff distance mm 5 6 7 8
Prog Addit Manuf (2016) 1:79–91 83
123

4 Analysis of variance (ANOVA)
The purpose of the analysis of variance (ANOVA) is to
investigate which parameters significantly affect the per-
formance characteristic. Detailed descriptions of results
obtained by analysis of variance are given in Table 7. DOF
stands for degree of freedom, SS for sum of squares, MS
for mean square and F is F ratio. The degree of freedom
can be defined as
DOF ¼ nl � 1 ð2Þ
where nl is the number of levels for the parameter. The sum
of squares can be calculated using following equation.
SS ¼ 1
nl
Xnl
i¼1
Xi � X� �2 ð3Þ
where Xi is the mean S/N ratio for ith level and X is the
average of S/N ratio for the particular output (calculated
from Table 5). The mean square can be computed as the
ratio of corresponding SS and DOF.
MS ¼ SS
DOFð4Þ
Similarly, the F ratio can be obtained as:
F ¼ MS
MSEð5Þ
Table 4 Experimental results for single bead
Exp. no Level of W Level of T Level of C Level of S Width (mm) Height (mm) Penetration (mm)
1 1 1 1 1 8.80 1.6 0.89
2 1 2 2 2 7.89 1.71 1.43
3 1 3 3 3 8.76 1.51 0.91
4 1 4 4 4 9.30 1.60 0.96
5 2 1 2 3 10.08 2.13 1.29
6 2 2 1 4 8.21 1.92 1.01
7 2 3 4 1 9.01 1.58 0.84
8 2 4 3 2 7.32 1.82 1.25
9 3 1 3 4 10.12 2.19 1.24
10 3 2 4 3 10.38 2.09 1.06
11 3 3 1 2 5.00 2.77 1.09
12 3 4 2 1 6.93 1.85 0.59
13 4 1 4 2 10.19 2.51 0.62
14 4 2 3 1 9.23 1.36 0.67
15 4 3 2 4 6.12 2.81 1.28
16 4 4 1 3 7.22 2.35 0.65
Fig. 7 a Deposited single beads
for designed orthogonal array
L16. b Nomenclature of bead
output parameters. c Example of
an image obtained from the
stereo microscope of the single-
bead cut section
84 Prog Addit Manuf (2016) 1:79–91
123

where MSE is the mean square value of error. The per-
centage contribution of each parameter is
% contribution ¼ FPF� 100 ð6Þ
Further the results shown in Table 7 are summarized for
the percentage contribution of each factor on performance
characteristics in Fig. 9. One can conclude from this
analysis that the percentage contribution of torch speed,
wire feed and stand off distance is highest on bead width,
height and penetration, respectively.
4.1 Multi-bead experiments
In HLM, a layer is built by depositing a series of over-
lapping beads followed by face milling to remove the
scallops. Layer thickness is the thickness of the deposited
layer after face milling. In multi-bead experiments the
stepover or the pitch between two beads plays a very
important role in converting the beads into layer. When the
pitch is less than the bead width, two beads overlap and
thus by several such overlapping beads one layer is formed.
The thickness of the layer also depends on the stepover
increment of the consecutive beads. From Fig. 10, it is
clearly seen that the stepover increment decides the initial
thickness of the layer. To minimize material wastage in
face milling, the optimal stepover (P) can be computed
from the width (w) by the Eq. 7, [16].
P ¼ 2
3w ð7Þ
To predict the layer thickness the bead height is an
important parameter and also the width of the deposited
bead is an input for estimating the pitch between two
consecutive beads. Hence, it is desirable to record the
width and height of the beads for different value of
process parameters. Figure 11 shows the nozzle and wire
position of automatic wire feeder. This position was
selected on the basis of continuous arc glow, complete
wire melting and continuity of the bead without any
waviness. The torch speed and standoff distance are fixed
to 200 mm/min and 7 mm, respectively, while the current
Table 5 S/N ratio for bead
characteristicsExp. no Width (mm) S/N ratio Height (mm) S/N ratio Penetration S/N ratio
1 8.8 18.88 1.6 4.08 0.89 -1.01
2 7.89 17.94 1.71 4.68 1.42 3.10
3 8.76 18.85 1.51 3.60 0.91 -0.82
4 9.30 19.37 1.60 4.09 0.95 -0.39
5 10.08 20.07 2.13 6.57 1.29 2.21
6 8.21 18.29 1.91 5.66 1.01 0.07
7 9.01 19.09 1.58 3.97 0.84 -1.51
8 7.32 17.29 1.82 5.20 1.25 1.92
9 10.12 20.10 2.18 6.80 1.24 1.88
10 10.38 20.32 2.08 6.39 1.06 0.54
11 5.00 13.99 2.76 8.84 1.09 0.74
12 6.93 16.81 1.85 5.34 0.58 -4.65
13 10.19 20.16 2.51 8.00 0.62 -4.12
14 9.23 19.30 1.36 2.67 0.67 -3.41
15 6.12 15.73 2.81 8.98 1.28 2.17
16 7.22 17.18 2.34 7.41 0.65 -3.75
Table 6 Mean S/N ratio for bead characteristics
Mean S/N ratio
Width Height Penetration
Level 1 Level 2 Level 3 Level 4 Level 1 Level 2 Level 3 Level 4 Level 1 Level 2 Level 3 Level 4
Wire feed 18.76 18.68 17.81 18.09 4.11 5.35 6.84 6.76 0.21 0.67 -0.37 -2.28
Torch speed 19.81 18.96 16.92 17.66 4.85 4.85 6.35 5.51 0.67 0.07 0.70 0.41
Current 17.09 17.64 18.89 19.73 6.49 6.39 4.57 5.61 -0.36 0.14 -0.10 -0.45
Standoff distance 18.52 17.35 19.10 18.37 4.01 6.68 5.99 6.38 6.66 -2.27 -1.71 -1.37
Prog Addit Manuf (2016) 1:79–91 85
123
and wire feed rate are varied over a wide range. Fig-
ure 12 shows results of penetration, width and height of
single-bead deposition at different current ranges for
different wire feed rates. It can be easily observed from
Fig. 12 that with increasing current, the penetration and
width is increasing and height of bead is decreasing.
Therefore, as per the requirement of output parameters,
the appropriate combination of wire feed and current can
be used.
4.2 Multi-layer experiments
The multi-layer experiments were carried out to facilitate
the characterization of samples. For the characterization, a
block of size 40 9 20 9 20 mm3 has been manufactured
by TIG-HLM process, see Fig. 13a. The cladding param-
eters were: wire feed rate of 2000 mm/min, torch speed of
200 mm/min, current of 200 amps, standoff distance of
7 mm, stepover 4 mm (calculated using Fig. 12d and
Eq. 7). The layer thickness is kept to 1 mm. Multi-layer
experiments are further divided into three experiments
explained in next sections.
4.2.1 X-ray analysis
For checking interlayer fusion quality of the build X-ray
test has been done. The results are shown in Fig. 13 from
which it can be observed that the multi-layer deposition by
TIG cladding gives a uniform and flawless interlayer
fusion.
A miniature block of size 10 9 10 9 10 mm3 has been
cutout from the original block and tests have been per-
formed to observe the hardness and microstructure in the
following paragraphs.
4.2.2 Hardness test
Nano-indentation testing was carried out on the cross
section of the miniature block. These tests were carried out
at top and bottom layer across the stepover and along the
(a) (b)
(c)
1 2 3 4 1 2 3 4 1 2 3 4 1 2 3 4
17
18
19
20
21
22
Level
Mea
n S/
N ra
tio
SN ratio of width
Wire feedTorch speedCurrentStand off distance
1 2 3 4 1 2 3 4 1 2 3 4 1 2 3 4
4
5
6
7
8
9
Level
Mea
n S/
N ra
tio
SN ratio of height
Wire feedTorch speedCurrentStand off distance
1 2 3 4 1 2 3 4 1 2 3 4 1 2 3 4-3
-2
-1
0
1
2
3
Level
Mea
n S/
N ra
tio
SN ratio of penetration
Wire feedTorch speedCurrentStand off distance
Fig. 8 Plot of factor effects on
a width, b height, c penetration
86 Prog Addit Manuf (2016) 1:79–91
123

sidewall (build direction). Figure 14 shows the location of
the points on the miniature block. The results of the
hardness test are shown in Table 8. The variation in
hardness can be attributed to the number of thermal cycles
a given layer undergoes. One can conclude from it that the
hardness of the top layer is more than that of the bottom
layer. This change in the microstructure is caused by the
recrystallization of layers due to re-melting of previously
deposited layers.
4.2.3 Microstructure analysis
Electron backscattered diffraction (EBSD) has been per-
formed to understand the effect of thermal cycles on the
microstructure of different layers. A single block of ten
layers was built using optimal deposition parameters.
EBSD mapping used a 300 9 600 point grid at 0.4-lmsteps. The grain size measurements were carried out on
different layers (along the build structure) to gain a better
understanding of the effect of process parameters on the
microstructure gradient. The course and fine regions of the
optical microscopy image of the microstructure were cap-
tured and average grain sizes were considered for top,
bottom and intermediate layers. Figure 14 shows the
Table 7 Detailed results of ANOVA calculation
Process parameter DOF SS MS F % contribution
(a) For bead width
Wire feed 3 2.57 0.85 3.25 5.46
Torch speed 3 20.09 6.69 25.38 42.63
Current 3 17.24 5.74 21.77 36.57
Stand of distance 3 6.42 2.14 8.12 13.64
Error 3 0.79 0.26 1 1.68
Total 15 47.13
(b) For bead height
Wire feed 3 20.23 6.74 22.70 37.20
Torch Speed 3 6.41 2.13 7.20 11.80
Current 3 9.53 3.17 10.69 17.52
Stand of distance 3 17.30 5.76 19.41 31.82
Error 3 0.89 0.29 1 1.63
Total 15 54.37
(c) For bead penetration
Wire feed 3 66.92 22.30 3.02 55.14
Torch speed 3 9.50 3.16 0.42 7.83
Current 3 19.38 6.46 0.87 15.97
Stand of distance 3 3.39 1.13 0.15 2.79
Error 3 22.15 7.38 1 18.25
Total 15 121.37
Width Height Penetration0
5
10
15
20
25
30
35
40
45
50
% C
ontri
butio
n of
par
amet
er
Wire feedTorch speedCurrentStand off distanceError
Fig. 9 Effect of factors on weld bead properties
Fig. 10 Layer thickness with
stepover increment
Fig. 11 Optimal position of nozzle and wire
Prog Addit Manuf (2016) 1:79–91 87
123

(a) (b)
(c) (d)
(e) (f)
(g) (h)
120 140 160 180 200 2200
2
4
6
8
10
Current (Amp)O
utpu
t (m
m)
Wire feed=1250 mm/min
PenetrationHeightWidth
120 140 160 180 200 2200
2
4
6
8
10
Current (Amp)
Out
put (
mm
)
Wire feed=1500 mm/min
PenetrationHeightWidth
140 160 180 200 220 2400
2
4
6
8
10
Current (Amp)
Out
put (
mm
)
Wire feed=1750 mm/min
PenetrationHeightWidth
160 170 180 190 200 210 2200
2
4
6
8
10
Current (Amp)
Out
put (
mm
)
Wire feed=2000 mm/min
PenetrationHeightWidth
170 180 190 200 210 2200
2
4
6
8
10
Current (Amp)
Out
put (
mm
)
Wire feed=2250 mm/min
PenetrationHeightWidth
170 180 190 200 210 2200
2
4
6
8
10
Current (Amp)
Out
put (
mm
)
Wire feed=2500 mm/min
PenetrationHeightWidth
170 180 190 200 210 2200
2
4
6
8
10
Current (Amp)
Out
put (
mm
)
Wire feed=2750 mm/min
PenetrationHeightWidth
190 200 210 220 2300
2
4
6
8
10
Current (Amp)
Out
put (
mm
)
Wire feed=3000 mm/min
PenetrationHeightWidth
Fig. 12 Results of penetration,
width and height for single bead
for different wire feeds
(200 mm/min torch speed and
7 mm stand off distance)
a 1250 mm/min, b 1500 mm/
min, c 1750 mm/min,
d 2000 mm/min, e 2250 mm/
min, f 2500 mm/min,
g 2750 mm/min, h 3000 mm/
min
88 Prog Addit Manuf (2016) 1:79–91
123
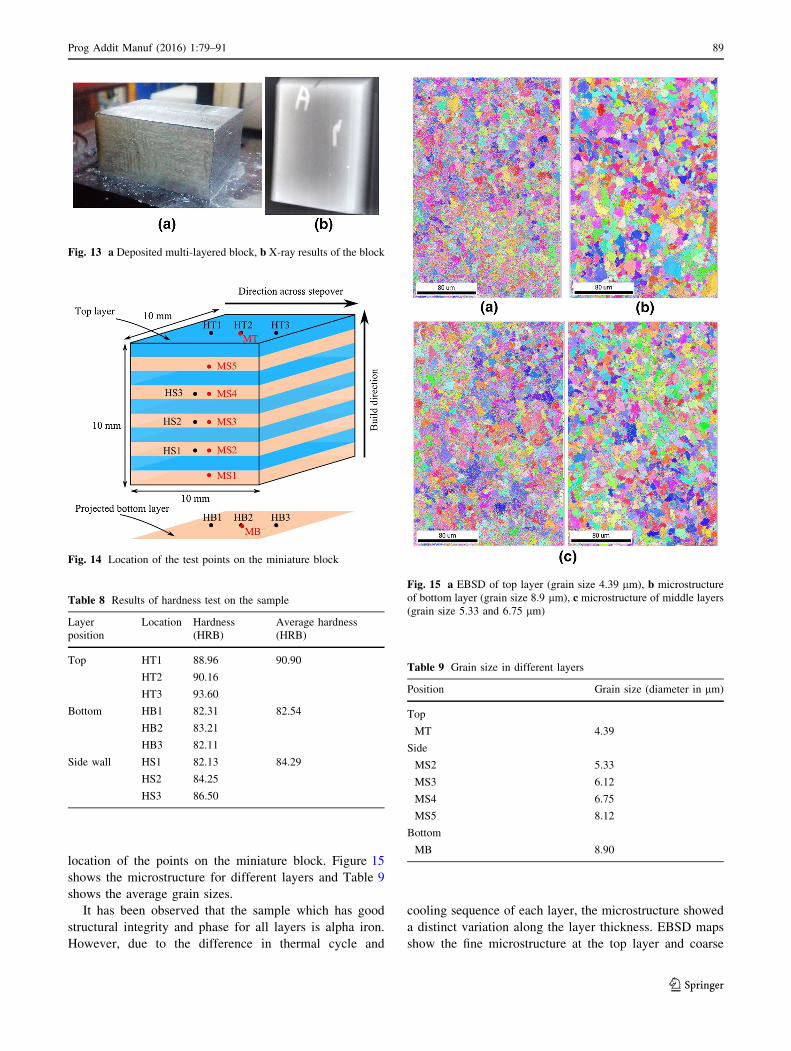
location of the points on the miniature block. Figure 15
shows the microstructure for different layers and Table 9
shows the average grain sizes.
It has been observed that the sample which has good
structural integrity and phase for all layers is alpha iron.
However, due to the difference in thermal cycle and
cooling sequence of each layer, the microstructure showed
a distinct variation along the layer thickness. EBSD maps
show the fine microstructure at the top layer and coarse
Fig. 13 a Deposited multi-layered block, b X-ray results of the block
Fig. 14 Location of the test points on the miniature block
Table 8 Results of hardness test on the sample
Layer
position
Location Hardness
(HRB)
Average hardness
(HRB)
Top HT1 88.96 90.90
HT2 90.16
HT3 93.60
Bottom HB1 82.31 82.54
HB2 83.21
HB3 82.11
Side wall HS1 82.13 84.29
HS2 84.25
HS3 86.50
Fig. 15 a EBSD of top layer (grain size 4.39 lm), b microstructure
of bottom layer (grain size 8.9 lm), c microstructure of middle layers
(grain size 5.33 and 6.75 lm)
Table 9 Grain size in different layers
Position Grain size (diameter in lm)
Top
MT 4.39
Side
MS2 5.33
MS3 6.12
MS4 6.75
MS5 8.12
Bottom
MB 8.90
Prog Addit Manuf (2016) 1:79–91 89
123

microstructure at bottom layers. But the variation is as
small as it can be removed by in situ hammering process.
5 Case study
A cylindrical object of outer diameter 73 mm, inner
diameter 67 mm and height 50 mm has been manufactured
using TIG-HLM. Figure 16a shows the CAD model of the
component along with the other geometric parameters
(layer thickness = 1 mm and machining allo-
wance = 1 mm). Figure 16b shows the slicing of the
object with 1 mm layer thickness. The wall thickness of the
near-net shape of the object should be 5 mm (including
2 mm machining allowance). Hence, cladding toolpath is a
circle of radius 35 mm, see Fig. 17a. The cladding
parameters are: wire feed rate = 2000 mm/min, torch
speed = 200 mm/min, current = 180 Amps, and standoff
distance = 7 mm. The output parameters of single bead
are (observed from Fig. 12d): bead width &5.5 mm and
bead height &2 mm. Figure 17b shows the deposited first
layer of the component. To maintain the constant layer
thickness of 1 mm the deposited layer is face milled at a
height of 1 mm, see Fig. 17c. The deposition and face
Fig. 16 a CAD model of the part to be manufactured, b slicing of the component
Fig. 17 a Toolpath of the first
layer, b deposited bead in first
layer, c first layer after face
milling at 1 mm
90 Prog Addit Manuf (2016) 1:79–91
123
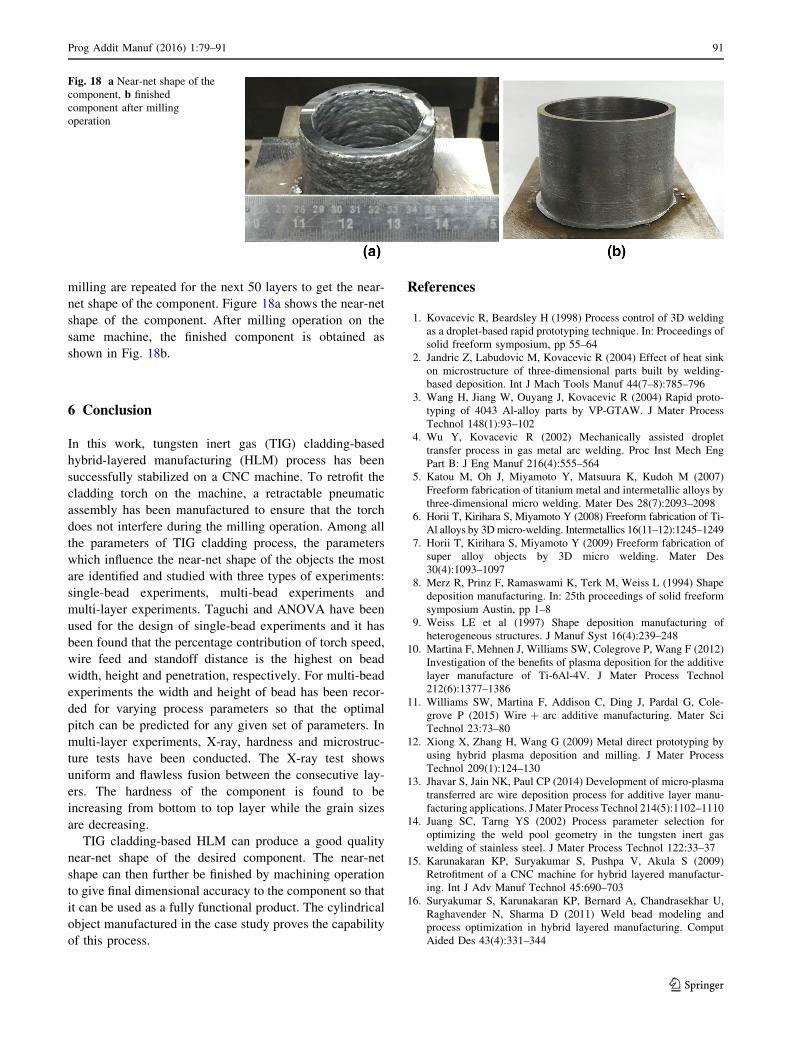
milling are repeated for the next 50 layers to get the near-
net shape of the component. Figure 18a shows the near-net
shape of the component. After milling operation on the
same machine, the finished component is obtained as
shown in Fig. 18b.
6 Conclusion
In this work, tungsten inert gas (TIG) cladding-based
hybrid-layered manufacturing (HLM) process has been
successfully stabilized on a CNC machine. To retrofit the
cladding torch on the machine, a retractable pneumatic
assembly has been manufactured to ensure that the torch
does not interfere during the milling operation. Among all
the parameters of TIG cladding process, the parameters
which influence the near-net shape of the objects the most
are identified and studied with three types of experiments:
single-bead experiments, multi-bead experiments and
multi-layer experiments. Taguchi and ANOVA have been
used for the design of single-bead experiments and it has
been found that the percentage contribution of torch speed,
wire feed and standoff distance is the highest on bead
width, height and penetration, respectively. For multi-bead
experiments the width and height of bead has been recor-
ded for varying process parameters so that the optimal
pitch can be predicted for any given set of parameters. In
multi-layer experiments, X-ray, hardness and microstruc-
ture tests have been conducted. The X-ray test shows
uniform and flawless fusion between the consecutive lay-
ers. The hardness of the component is found to be
increasing from bottom to top layer while the grain sizes
are decreasing.
TIG cladding-based HLM can produce a good quality
near-net shape of the desired component. The near-net
shape can then further be finished by machining operation
to give final dimensional accuracy to the component so that
it can be used as a fully functional product. The cylindrical
object manufactured in the case study proves the capability
of this process.
References
1. Kovacevic R, Beardsley H (1998) Process control of 3D welding
as a droplet-based rapid prototyping technique. In: Proceedings of
solid freeform symposium, pp 55–64
2. Jandric Z, Labudovic M, Kovacevic R (2004) Effect of heat sink
on microstructure of three-dimensional parts built by welding-
based deposition. Int J Mach Tools Manuf 44(7–8):785–796
3. Wang H, Jiang W, Ouyang J, Kovacevic R (2004) Rapid proto-
typing of 4043 Al-alloy parts by VP-GTAW. J Mater Process
Technol 148(1):93–102
4. Wu Y, Kovacevic R (2002) Mechanically assisted droplet
transfer process in gas metal arc welding. Proc Inst Mech Eng
Part B: J Eng Manuf 216(4):555–564
5. Katou M, Oh J, Miyamoto Y, Matsuura K, Kudoh M (2007)
Freeform fabrication of titanium metal and intermetallic alloys by
three-dimensional micro welding. Mater Des 28(7):2093–2098
6. Horii T, Kirihara S, Miyamoto Y (2008) Freeform fabrication of Ti-
Al alloys by 3Dmicro-welding. Intermetallics 16(11–12):1245–1249
7. Horii T, Kirihara S, Miyamoto Y (2009) Freeform fabrication of
super alloy objects by 3D micro welding. Mater Des
30(4):1093–1097
8. Merz R, Prinz F, Ramaswami K, Terk M, Weiss L (1994) Shape
deposition manufacturing. In: 25th proceedings of solid freeform
symposium Austin, pp 1–8
9. Weiss LE et al (1997) Shape deposition manufacturing of
heterogeneous structures. J Manuf Syst 16(4):239–248
10. Martina F, Mehnen J, Williams SW, Colegrove P, Wang F (2012)
Investigation of the benefits of plasma deposition for the additive
layer manufacture of Ti-6Al-4V. J Mater Process Technol
212(6):1377–1386
11. Williams SW, Martina F, Addison C, Ding J, Pardal G, Cole-
grove P (2015) Wire ? arc additive manufacturing. Mater Sci
Technol 23:73–80
12. Xiong X, Zhang H, Wang G (2009) Metal direct prototyping by
using hybrid plasma deposition and milling. J Mater Process
Technol 209(1):124–130
13. Jhavar S, Jain NK, Paul CP (2014) Development of micro-plasma
transferred arc wire deposition process for additive layer manu-
facturing applications. JMater Process Technol 214(5):1102–1110
14. Juang SC, Tarng YS (2002) Process parameter selection for
optimizing the weld pool geometry in the tungsten inert gas
welding of stainless steel. J Mater Process Technol 122:33–37
15. Karunakaran KP, Suryakumar S, Pushpa V, Akula S (2009)
Retrofitment of a CNC machine for hybrid layered manufactur-
ing. Int J Adv Manuf Technol 45:690–703
16. Suryakumar S, Karunakaran KP, Bernard A, Chandrasekhar U,
Raghavender N, Sharma D (2011) Weld bead modeling and
process optimization in hybrid layered manufacturing. Comput
Aided Des 43(4):331–344
Fig. 18 a Near-net shape of the
component, b finished
component after milling
operation
Prog Addit Manuf (2016) 1:79–91 91
123