hybrid investigation of air transport pro cesses ... - flow-3d
TRANSCRIPT

E-proceedings of the 36th IAHR World Congress 28 June – 3 July, 2015, The Hague, the Netherlands
1
HYBRID INVESTIGATION OF AIR TRANSPORT PROCESSES IN MODERATELY SLOPED STEPPED SPILLWAY FLOWS
DANIEL VALERO(1) & DANIEL B. BUNG(2) (1) Research Assistant, FH Aachen University of Applied Sciences, Aachen, Germany,
[email protected] (2) Professor, FH Aachen University of Applied Sciences, Aachen, Germany,
ABSTRACT
In stepped spillway flows, a self-aerated flow region is often found where large quantities of air may be entrained into the water body. This air is then mixed with the water phase leading to an air-water mixture flow with different characteristics than the clear water flow. Thus, air entrainment is an important flow feature which needs to be considered for safe design of these hydraulic structures. Advances in the development of new air-water measurement techniques and numerical modeling capabilities allow addressing these complex problems. Computational Fluid Dynamics (CFD) modeling can be a powerful supplement for physical model tests.
In the presented study, the self-aeration process and the subsequent air transport in the aerated flow region of a stepped spillway model is investigated by means of both, new experimental and numerical methods. The slope of the spillway model is 1:2 and different flow rates are considered involving a skimming flow regime. For the physical model tests, a double-tip conductivity probe and ultrasonic sensors are used to evaluate air-water flow properties and flow depths, respectively. Additionally, high-speed camera recordings help to qualitatively analyze the air-water transport.
In the numerical model, the same stepped spillway is simulated with identical flow conditions. A RANS approach coupled with RNG k-ε turbulence modeling and a VOF technique for free surface tracking is used. The determination of the inception point and the entrained air quantities are estimated employing a subscale model. To verify the numerical model, results are compared to the laboratory air-water measurements. The comparison of results from both techniques helps to identify their capabilities and limitations.
Keywords: CFD, physical modeling, air entrainment, self-aeration, multiphase flows
1. INTRODUCTION
Step-induced macro-roughness which is found on cascades and stepped spillways is known to enhance flow resistance and turbulence when compared to smooth invert chutes. By consequence, energy dissipation potential is increased and self-aeration is found to set in earlier. Due to fast development in RCC construction techniques, numerous fundamental studies on stepped spillway flows were conducted in the recent past (e.g., Boes & Hager 2003, Chanson 1993, Matos 2000).
Self-aeration on steep chutes occurs when the turbulent boundary layer, which develops from the crest, reaches the water surface. This turbulence causes the ejection of droplets and entrapment of air pocket into the water body. However, self-aeration is a continuous process. A strong roughening of the water surface may already be noticed upstream of the cross-section where air starts to be transported along the whole water column (Ehrenberger 1926, Straub & Lamb 1953). According to Pfister & Hager (2011), the inception point of surface self-aeration is to be distinguished from the inception point of bottom aeration.
Downstream of the inception point of self-aeration, a clear definition of the free surface becomes difficult. The two-phase air-water flow is thus often described as a continuum with an idealized surface at h90 (i.e. the elevation with a time-averaged void fraction C of 90 %) as only small parts of the total discharge is taking place in higher elevation. However, Killen (1968) showed on a smooth invert chute that a continuous surface can also be found in air-water mixtures, but he observed a significant distortion referred to as “air-water surface roughness". Similar findings were described by Pegram et al. (1999) on stepped spillways. According to Rao and Kobus (1975), this surface distortion leads to a local inception of air bubbles; air was found to be drawn into the flow, broken into bubbles and then released. Wilhelms & Gulliver (2005) distinguish between entrapped air (air content between surface waves) and entrained air (air bubbles inside the water body). André (2004) states that the level h90 is located somewhere between the surface wave troughs and crests for a chute angle of = 30°. Bung (2013) finds out that the surface waves are higher for lower discharges and that they may significantly exceed h90.
Air-water flows as occurring in the aerated region of the spillway, present different characteristics than clear water flows. Flow aeration may induce some turbulence modulation according to Chanson (2013) and Chanson & Toombes (2002). This turbulence modulation can yield a drag reduction as described by Madavan et al. (1984), Chanson (1994a) and Wood (1991); or turbulent kinetic energy enhancement (Chanson, 2013). Other authors, e.g. Balachandar & Eaton (2010), Chen

E-proceedings of the 36th IAHR World Congress, 28 June – 3 July, 2015, The Hague, the Netherlands
2
et al. (2000), Crowe (2000) and Gore & Crowe (1989), suggest that this turbulence modulation could be explained by the relation between the bubble (or particle) diameter and the turbulent length scale of the flow.
Nevertheless, expensive instrumentation with significant drawbacks as noticed by Borges et al. (2010) and Leandro et al. (2014) is necessary for experimental studies. Hence, Computational Fluid Dynamics (CFD) approaches arise as a powerful supplement to the experimental laboratory studies. Last decades, with increasing computational resources, some numerical studies on hydraulic structures have been conducted by Jha & Bombardelli (2010), Carvalho & Amador (2008), Carvalho et al. (2008), Bombardelli et al. (2000), Caisley et al. (1999). The study of Bombardelli et al. (2011) addresses a physical-numerical comparison of the main flow properties in the non-aerated region. Meireles et al. (2014) found a good agreement in the location of the inception point between the model employed in this study and experimental data. The studies of Ma et al. (2011a, 2011b) are also of special interest due to the use of a subscale model to predict the air quantities trapped within the cells. An exhaustive reference on numerical modelling of multiphase flows can be found in Prosperetti & Tryggvason (2007). However, lack of validation and verification is still an issue pointed out by several authors as Chanson (2013), Chanson & Lubin (2010).
In this research the self-aeration process, the flow properties immediately upstream and the downstream of the inception point of self-aeration and in developing flow region are investigated by means of a hybrid physical-numerical approach. In the physical model, the self-aeration process close to the inception point is analyzed by means of high speed camera recordings. Some air concentrations and velocity measurements have been conducted using a double tip conductivity probe and flow depth data has been completed by means of ultrasonic sensors. For the numerical modelling, a 3D RANS approach coupled with a turbulence model and a VOF method for the free surface was applied. 3D modelling allows representing transversal free surface roughness and bending which has been analyzed not only for instantaneous steps but for the steady averaged solution. The air entrainment is predicted by means of a subscale model which makes a balance of perturbing and stabilizing forces at every free surface cell. When an air volume is successfully trapped, then it bulks the flow and is transported downstream with the carrier phase.
2. EXPERIMENTAL SETUP
Experimental investigations are carried out on two different laboratory installations with a fixed slope of 1V:2H and a step height of 6 cm. The first stepped spillway model with a width of 30 cm and a total drop height of 2.34 m was installed at Bergische University Wuppertal (Bung, 2011) while the second model was installed at FH Aachen University of Applied Sciences with a width of 50 cm and a total drop height of 1.74 m. In both installations, water was pumped from a lower basin into an open head tank from before being conveyed into the stepped spillway model via an approaching channel of 1 m length. At the spillway toe, water was recirculated into the lower basin. Three specific discharges (q = 0.07, 0.09, 0.11 m²/s) were observed and controlled by a flap valve and an inductive flow meter. These discharges involve the so-called skimming flow regime where water flow as a coherent stream over the pseudo-bottom formed by the step edges.
Figure 1. Sketch of flow regions on a stepped spillway (left), photo of the model with 30 cm width in operation (center) and double-tip conductivity probe (CP) and ultrasonic sensor (USS) in aerated flows (right).
Detailed data of air-water flow properties were gathered on the 30 cm flume by means of an intrusive double-tip conductivity probe (CP) with a sample rate of 25 kHz and a sample time of 25 s, respectively. This instrumentation allows for determination of important flow parameters, e.g. void fraction and flow velocity (Chanson, 2002). Raw data was digitalized on the basis of a combined double threshold and gradient method (Bung, 2012). Measurements were taken at step edges (E) and above the step niches (M), i.e. in the middle of the connection line between two adjacent steps (see Fig. 1 and 2).
Ultrasonic sensors (USS) were used for measurements of flow depths. In the aerated flow region, a sensor with a small measuring range of 60 to 350 mm was chosen (type: General Acoustics USS60350, resolution: 0.18 mm) while the non-aerated flow depths were recorded by a sensor with a larger measuring range of 200 to 1300 mm (type: Microsonic mic+130/IU/TC, resolution 0.18 mm). Data was recorded for 60 s with a sample rate of 30 Hz in aerated flow and 50 Hz in non-aerated flow (maximum sample rates were limited by the probes).
Exact positioning of all probes was achieved by a two-dimensional linear computerized numerical control (CNC) system.
Qualitative investigations on the self-aeration process were carried out on the 50 cm wide flume with Phantom Miro M120 high-speed camera (resolution: 1920 × 1200 px, sample rate 732 Hz). In order to enhance the contrast, the backside of the flume was equipped with a black PVC wall. Flow illumination was achieved by white light from halogen spots.

E-proceedings of the 36th IAHR World Congress
28 June – 3 July, 2015, The Hague, the Netherlands
3
3. NUMERICAL MODEL DESCRIPTION
Reynolds Averaged Navier-Stokes equations (RANS) as described by (Pope, 2000) have been numerically solved by means of the Finite Volume Method (Versteeg & Malalasekera, 2007) in a only 1 fluid approach (Prosperetti & Tryggvason, 2007); coupled with a RNG k- turbulence model, being k the turbulent kinetic energy and the turbulent dissipation rate, both modeled by their respective transport equations (Yakhot et al., 1986). The Volume of Fluid (VOF) method (Hirt & Nichols, 1981), as included in the commercial code FLOW-3D®, has been used for free surface representation. Hence, it is simulated with one fluid approach neglecting the effect of the air above the water surface. The one fluid approach allows computing the solution for the water without solving any equation at the void domain. The free surface acts as a moving boundary condition for air entrainment.
It was shown in the past that 2D numerical modelling is accurate enough to reproduce the main features of hydrodynamic quantities (Meireles et al., 2014; Oertel & Bung, 2012; Bombardeli et al., 2011). However, as it is intended to study also the free surface roughness, a full 3D model has been set up allowing a more exhaustive analysis. To the knowledge of the authors, this is the first full 3D numerical modelling of a stepped spillway focusing on both, solving the non-aerated and the aerated region of the flow. As both flow regions have essentially different flow behaviors, different theoretical and numerical models should be used (Ma et al., 2010; Meireles et al., 2014). Thus, a subscale (or subgrid) model for the prediction of air entrainment has been used. This model was first described by Hirt (2003) and was previously employed for the prediction of the location of the inception point in steep stepped spillways (Meireles et al., 2014) and the mean air concentration in smooth invert chutes (Valero & García-Bartual, 2015).
For the turbulent air entrainment model, a characteristic turbulent length scale LT can be defined as:
2/3
23 kCLT [1]
with C = 0.085 for the RNG k- turbulence model. This length scale should be taken as an approximation to a length scale of perturbations.
The energy density associated with a disturbed fluid element raised over the free surface to a height LT can be expressed considering two components (gravity and surface tension):
TTnd L
LgP [2]
where is the macroscopic fluid density, gn is the gravity component normal to the free surface and is the liquid-gas surface tension. Pd represents a surface stabilizing force, while Pt (turbulent kinetic energy per unit volume) represents the perturbing component that makes the flow unstable:
kPt [3]
The model assesses a balance between the perturbing and the stabilizing forces. When Pt > Pd, a volume of air is allowed to break through the free surface and is then advected with the water flow. This volume of air per unit time can be calculated as:
dts
PPACV 2air [4]
where Cair is a calibration parameter and As is the free surface area at each cell. For the calibration parameter Cair, 0.5 is commonly accepted as a first guess (Bombardelli et al., 2011; Hirt, 2003). Additionally, Valero & García-Bartual (2015) suggested 0.525 as a calibrated value for smooth invert chute valid for a range of slopes between 30° and 53°.
For the macroscopic density computing, the air volume V is taken into account affecting the air concentration C. Thus, density can be computed as:
aw CC )1( [5]
being w the water density and a the air density. It is also assumed that air is entrained in form of bubbles of a characteristic diameter. Thus, bubbles produce a drag force upon the carrier phase which opposes to the water movement. A relative velocity between both phases is computed and a so called drift-flux model is introduced. The characteristic bubble diameter has been selected as 1 mm, based on bubble size histograms obtained in the laboratory. More details about the drift-flux model can be found in Brethour & Hirt (2009).
The simulated geometry consists of the 30 cm width laboratory stepped spillway with 23 steps and 1:2 slope. For the numerical approximation of advection terms, an explicit second order scheme with gradient preserving has been employed. For viscous terms, also an explicit scheme has been used. Mesh is composed by two Cartesian blocks (see Fig. 7 later): the first one is a coarse buffer mesh yielding a correct inlet boundary condition for the second mesh block, which contains finer cells for the domain of interest. All cells are cubic without any size distortion. The cell size ratio between block 1 and 2 is 2:1 avoiding interpolation errors as much as possible. Additionally, the transition is placed between the vertex and the step 0 (i.e. the inlet crest), where no significant flow gradients are expected. Mesh independence tests have been conducted for the lower discharge (q = 0.07 m2/s) without the air entrainment model activated. In order to ensure correct mesh independence, not only depths and velocities have been tracked over the

E-proceedings of the 36th IAHR World Congress, 28 June – 3 July, 2015, The Hague, the Netherlands
4
different meshes but also turbulent kinetic energy, which is the main input of the previously described air entrainment model. Figure 2 illustrates the flow depth, depth-averaged velocity and depth-averaged turbulence values at the edge (E21) and the niche (M21) of the step 21. The chosen mesh for the air-water simulations is corresponding to 7.5 million cells (x = 0.0126 m for block 1, x = 0.0063 m for block 2).
Figure 2. Flow depth (left), depth averaged velocity (center) and depth averaged turbulent kinetic energy (right) values at the edge (E21)
and the niche (M21) of the step 21 for q = 0.07 m²/s as mesh independence test.
In order to avoid transient oscillations in the presented results, the final solution for every case has been averaged over 1 second, which has been proved to be above the periods involved in the processes taking place in the spillway (according to turbulent kinetic energy and volume of fluid oscillations). The averaging time step is 0.01 seconds yielding an average of 100 temporal frames for the analyzed solution of every discharge case.
4. RESULTS AND DISCUSSION
The self-aeration process is described in the following for the lowest discharge of q = 0.07 m²/s (resulting to self-aeration on step 5). However, the qualitative mechanisms were found to be identical for the higher discharges. Self-aeration is known to be a continuous process. A visual determination of a fixed location, which is needed for hydraulic design purposes, thus depends on individual criteria of the observer. In order to overcome this problem, a mean air concentration of 20 % is assumed to specify the inception point of self-aeration as proposed by Bung (2011). With this criterion, inception points were located at step 5 (q = 0.07 m²/s, E), step 7 (q = 0.09 m²/s, M) and step 8 (q = 0.11 m²/s, M) in the physical model. Figure 3 illustrates a sequence which was captured with the high-speed camera on step 3 where the water body is completely glassy and no air bubbles are yet entrained. Two different mechanisms leading to downstream air entrainment can be distinguished.
1. As the white region at the water surface becomes thicker in flow direction, it may be assumed that some air is continuously entrained along the air-water interface without being transported to the bottom (it must be noted that wall effects are likely which may increase this effect at the walls).
2. Occasionally, the water surface is roughened by small surface waves being generated on step 3. These surface waves are steepened along this step and transported to step 4.
Figure 4 shows the air entrainment process on step 4. In the beginning, air entrainment is caused by the continuous thickening of the white, aerated air-water interface (Fig. 4a). The step niche is still unaerated; only single bubbles are found. A sudden increase of aeration is caused by an approaching surface wave trough and a following surface wave crest collapsing near the downstream end of step 4. The entrapped air pockets are transported to step 5 and air transport is again limited to the white surface.
a) t = 0 ms b) t = 10 ms
c) t = 20 ms
d) t = 30 ms
Figure 3. Extracted frames from high-speed movies taken on step 3 for q = 0.07 m²/s.

E-proceedings of the 36th IAHR World Congress
28 June – 3 July, 2015, The Hague, the Netherlands
5
a) t = 0 ms b) t = 30 ms c) t = 60 ms
d) t = 90 ms e) t = 120 ms f) t = 150 ms Figure 4. Extracted frames from high-speed movies taken on step 4 for q = 0.07 m²/s.
The transport of an entrapped air pocket to step 5 is illustrated in Fig. 5. The air pocket is conveyed above the pseudo-bottom while it is enlarged as more air is entrained at the surface. The air pocket’s extension increases until it reaches the step niche below the pseudo-bottom. Due to the large shear stress along the pseudo-bottom the air pocket is spread up into numerous small air bubbles. Most of these air bubbles are trapped within the large step vortex, while some other bubbles are transported to the downstream step. Furthermore, the aerated air-water surface seems to be of a constant thickness and additional air entrainment is mostly caused by collapsing surface waves and entrapped air pockets. The described mechanism is maintained further downstream and leads to a continuous entrainment and detrainment of air until a quasi-uniform flow sets in (Fig. 6).
a) t = 0 ms a) t = 10 ms c) t = 20 ms
d) t = 30 ms e) t = 40 ms f) t = 50 ms Figure 5. Extracted frames from high-speed movies taken on step 5 for q = 0.07 m²/s (i.e. the inception point of self-aeration with a depth-
averaged air content of 20 %).
a) Step 6 b) Step 7
c) Step 8
Figure 6. Increasing aeration downstream of the inception point of self-aeration for q = 0.07 m²/s.
The described process supports the bubbles and waves concept by Wilhelms & Gulliver (2005) for self-aerated flows. Pfister & Hager (2011) describe similar processes on a steeper stepped spillway with a chute angle of 50°. The authors observe a comparable wave/trough generation which leads to self-aeration. However, the air pockets were found to impinge on the horizontal step surface. The extension is thus smaller on moderately sloped stepped spillways than on steep structures. This finding is consistent to conclusions by Bung (2013) for uniform, fully aerated flow conditions. It is assumed that the reason may be found in the higher buoyancy effect and lower transport capacity of the flow on flat chutes (Kobus, 1991).
Figure 7 presents the air entrainment and flow bulking process in the numerical solution for the same discharge. The three-dimensional nature of the flow, particularly around the inception point itself, can be noticed. Moreover, it is again observed that the specification of the inception point’s location is difficult.

E-proceedings of the 36th IAHR World Congress, 28 June – 3 July, 2015, The Hague, the Netherlands
6
Figure 7. Air entrainment and flow bulking in the numerical model for q = 0.07 m²/s (note the two mesh blocks).
In the numerical model, the bending of the free surface upstream of the inception point is also observed. Figure 8 shows the averaged 3D free-surface profile, thus the bending corresponds to stationary waves, which are more evident in the niches (M) than in the edges (E). It has also been observed that oscillations from the mean value are of the same order of magnitude as recorded with the USS. For lower discharges, these oscillations and the bending are stronger as previously observed in the physical model (Bung, 2011). Please note that this result could not have been observed in a 2D simulation since no lateral oscillation of the free surface is allowed. It is also found that the first point where the aeration triggers is not homogeneously spread over the transversal section but only in some sparse points. Roughly one or two steps downstream the inception point air entrainment is better distributed along the whole section, not only in isolated points, and the air-water flow becomes more uniformly mixed as can be seen in Fig. 7 and 9. This is also a feature of the flow which can be observed in the physical model. It is also illustrated in Fig. 9 how the air entrainment is gradually increasing, as described before.
Figure 8. Lateral view of the mean 3D free surface profile on the non-aerated region obtained in the numerical models for q = 0.07 m²/s
(top), q = 0.09 m²/s (mid) and q = 0.11 m²/s (bottom).

E-proceedings of the 36th IAHR World Congress
28 June – 3 July, 2015, The Hague, the Netherlands
7
Figure 9. Mean air concentration obtained in the 3D simulations for the longitudinal centre-plane and laboratory data for q = 0.07 m²/s
(top), q = 0.09 m²/s (mid), q = 0.11 m²/s (bottom).
Figure 10 presents a comparison of aerated and non-aerated flow depth in both regions: the non-aerated and the aerated. It is observed how the free surface is well reproduced in the non-aerated region and the location of the inception point is in good agreement with the physical data, which was also noticed by Meireles et al. (2014) for a steeper stepped spillway. However, too much flow bulking is predicted due to overestimation of air entrainment.
Figure 10. Mean free surface profiles obtained in the 3D simulations for the longitudinal centre-plane and laboratory data for q = 0.07 m²/s
(top), q = 0.09 m²/s (mid), q = 0.11 m²/s (bottom).
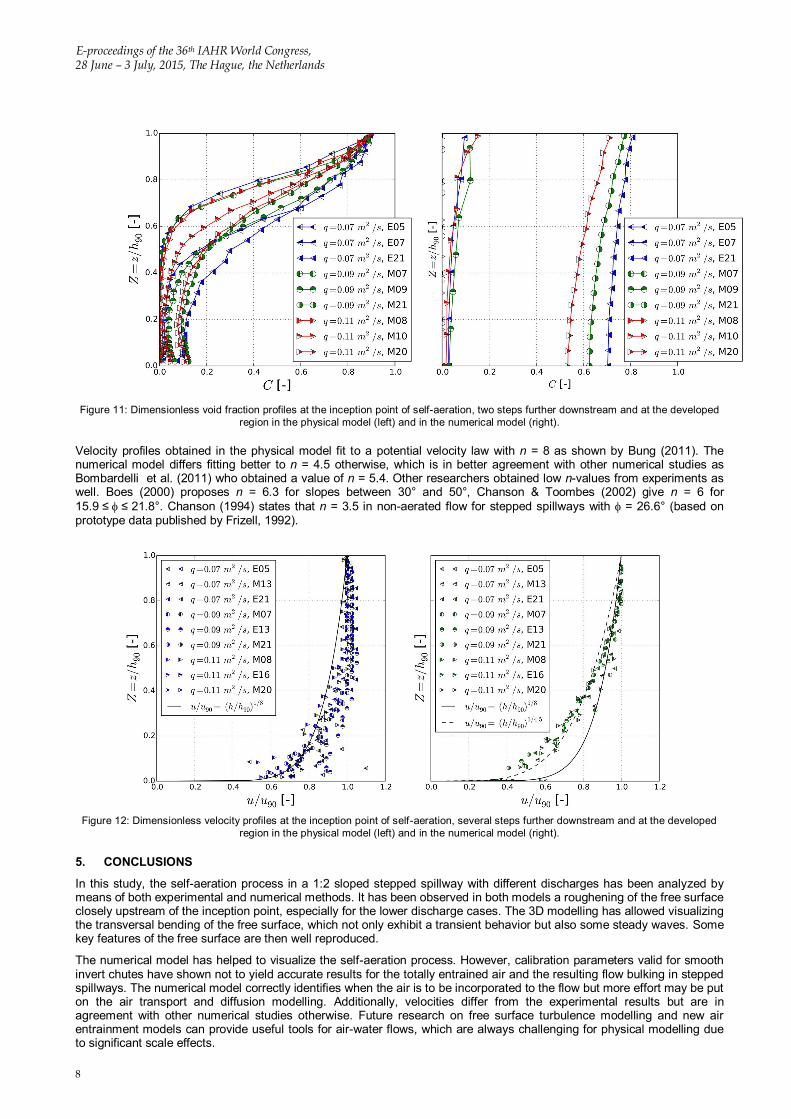
Some void fraction profiles are presented in Fig. 11. The data is plotted in dimensionless form C(Z = z/h90), where z is the perpendicular elevation above the pseudo-bottom. The distribution of time-averaged void fraction at the step edge is exemplarily given for the inception point of self-aeration, two steps further downstream and for the fully developed flow region.
At the inception point in the physical model, most air content is found between 0.6 ≤ Z ≤ 1, while the lower region is nearly free of air. Two steps further downstream, the lower extension of the aerated layer is now Z = 0.4, although some higher aeration is also found below. It may thus be assumed that the qualitative aeration process, as described above, is independent of the discharge for a given structure in skimming flow regime.
Remarkable differences are found for the void fraction profiles from the numerical model which were also observed in (Valero & García-Bartual, 2015). The numerical void fraction profiles in the fully developed flow region are typical for highly aerated flows with Cmean > 60 % being found on steeper structures with > 50°. The simulated distribution is thus reasonable for the high, overestimated mean air concentration. However, close to the inception point the lower mean air concentration should result in comparable profiles as were found in the laboratory. The turbulent diffusion seems to be too high and needs further investigations. Additionally, the differences are likely to be enhanced by a general overestimation of air entrainment by the applied subscale model. A calibration of Cair in Eq. (4) could improve the results for the mean air concentration.
The reader may note that the numerical air concentration in h90 is smaller than 90 %. This error is involved as the entrained air is regarded as an advected scalar where the boundary condition of C = 100 % at the free-surface does not necessarily apply. A more complex model would be necessary to better reproduce the shape of the void fraction profile close to the free surface and the pseudo-bottom.
E-proceedings of the 36th IAHR World Congress, 28 June – 3 July, 2015, The Hague, the Netherlands
8
Figure 11: Dimensionless void fraction profiles at the inception point of self-aeration, two steps further downstream and at the developed region in the physical model (left) and in the numerical model (right).
Velocity profiles obtained in the physical model fit to a potential velocity law with n = 8 as shown by Bung (2011). The numerical model differs fitting better to n = 4.5 otherwise, which is in better agreement with other numerical studies as Bombardelli et al. (2011) who obtained a value of n = 5.4. Other researchers obtained low n-values from experiments as well. Boes (2000) proposes n = 6.3 for slopes between 30° and 50°, Chanson & Toombes (2002) give n = 6 for 15.9 ≤ ≤ 21.8°. Chanson (1994) states that n = 3.5 in non-aerated flow for stepped spillways with = 26.6° (based on prototype data published by Frizell, 1992).
Figure 12: Dimensionless velocity profiles at the inception point of self-aeration, several steps further downstream and at the developed
region in the physical model (left) and in the numerical model (right).
5. CONCLUSIONS
In this study, the self-aeration process in a 1:2 sloped stepped spillway with different discharges has been analyzed by means of both experimental and numerical methods. It has been observed in both models a roughening of the free surface closely upstream of the inception point, especially for the lower discharge cases. The 3D modelling has allowed visualizing the transversal bending of the free surface, which not only exhibit a transient behavior but also some steady waves. Some key features of the free surface are then well reproduced.
The numerical model has helped to visualize the self-aeration process. However, calibration parameters valid for smooth invert chutes have shown not to yield accurate results for the totally entrained air and the resulting flow bulking in stepped spillways. The numerical model correctly identifies when the air is to be incorporated to the flow but more effort may be put on the air transport and diffusion modelling. Additionally, velocities differ from the experimental results but are in agreement with other numerical studies otherwise. Future research on free surface turbulence modelling and new air entrainment models can provide useful tools for air-water flows, which are always challenging for physical modelling due to significant scale effects.

E-proceedings of the 36th IAHR World Congress
28 June – 3 July, 2015, The Hague, the Netherlands
9
REFERENCES
André S. (2004). High velocity aerated flows on stepped chutes with macro-roughness elements. PhD Thesis, EPF Lausanne, Switzerland.
Balachandar S. and Eaton JK. (2010). Turbulent Dispersed Multiphase Flow. Annu. Rev. Fluid Mech, 2010, 42, 111-33.
Boes, RM. (2000): Zweiphasenströmung und Energieumsetzung an Großkaskaden. PhD thesis, ETH Zurich, Switzerland.
Boes RM. and Hager WH. (2003). Hydraulic design of stepped spillways. J. Hydraulic Eng. 129(9), 671–679.
Bombardelli FA., García MH. and Caisley ME. (2000). 2-D and 3-D numerical simulation of abrupt transitions in open-channel flows. Application to the design of canoe chutes. In: Proceedings of the 4th international conference on hydroinformatics IAHR, Iowa City, IA, USA (in CD).
Bombardelli FA., Meireles I., and Matos J. (2011). Laboratory measurements and multi-block numerical simulations of the mean flow and turbulence in the non-aerated skimming flow region of steep stepped spillways. Environmental Fluid Mechanics, 11(3), 263-288.
Borges JE., Pereira NH., Matos J. and Frizell KH. (2010). Performance of a combined three-hole conductivity probe for void fraction and velocity measurement in air–water flows. Experiments in fluids, 48(1), 17-31.
Brethour JM. and Hirt CW. (2009). Drift Model for Two-Component Flows. FSI-09-TN83Rev. Flow Science, Inc.
Bung DB. (2011). Developing flow in skimming flow regime on embankment stepped spillways. Journal of Hydraulic Research, 49(5), 639–648.
Bung DB. (2012). Sensitivity of phase detection techniques in aerated chute flows to hydraulic design parameters. Proc. 2nd European IAHR Congress Munich.
Bung DB. (2013). Non-intrusive detection of air-water surface roughness in self-aerated chute flows. Journal of Hydraulic Research, 51(3), 322-329.
Caisley ME., Bombardelli FA. and García MH. (1999). Hydraulic model study of a canoe chute for low-head dams in Illinois. Civil Engineering Studies, Hydraulic Engineering Series No-63, University of Illinois at Urbana-Champaign.
Carvalho R. and Amador A. (2008). Physical and numerical investigation of the skimming flow over a stepped spillway. In: Proceedings of the 3rd IAHR international symposium on hydraulic structures, Nanjing, China, pp 1767–1772.
Carvalho RF., Lemos CM. and Ramos CM. (2008). Numerical computation of the flow in hydraulic jump stilling basins. Journal of Hydraulic Research, 46(6), 739-752.
Chanson H. (1993). Stepped spillway flows and air entrainment. Canadian Journal of Civil Engineering, 20(3), 422–435.
Chanson H. (1994a). Drag reduction in open channel flow by aeration and suspended load. Journal of Hydraulic Research, 32(1), 87-101.
Chanson H. (1994b). Hydraulics of Skimming Flows over Stepped Channels and Spillways. Journal of Hydraulic Research, 32(3), 445-460.
Chanson, H. (2002). Air-water flow measurements with intrusive, phase-detection probes: Can we improve their interpretation?. Journal of Hydraulic Engineering, 128(3), 252-255.
Chanson H. (2013). Hydraulics of aerated flows: qui pro quo?. Journal of Hydraulic Research, 51(3), 223-243.
Chanson H., Toombes L. (2002). Air–water flows down stepped chutes: turbulence and flow structure observations. International Journal of Multiphase Flow, 28(11), 1737-1761.
Chanson H., Lubin P. (2010). Discussion of “Verification and validation of a computational fluid dynamics (CFD) model for air entrainment at spillway aerators” Appears in the Canadian Journal of Civil Engineering 36 (5): 826-838. Canadian Journal of Civil Engineering, 37(1), 135-138.
Chen JH., Wu JS. and Faeth GM. (2000). Turbulence Generation in Homogeneous Particle-Laden Flows. AIAA Journal, Vol. 38, No. 4, 636-642.
Crowe CT. (2000). On models for turbulence modulation in fluid–particle flows. International Journal of Multiphase Flow, 26(5), 719-727.
Ehrenberger R. (1926). Wasserbewegung in steilen Rinnen (Schusstennen) mit besonderer Berücksichtigung der Selbstbelüftung (Flow of Water in Steep Chutes with Special Reference to Self-Aeration). In: Zeitschrift des Österreichischen Ingenieur und Architektenvereins 15/16, 17/18 (1926). – translated by Eduard F.Wilsey (U.S. Bureau of Reclamation).
Frizell KH. (1992): Hydraulics of Stepped Spillways for RCC Dams and Dam Rehabilitations. In: Hansen KD., McLean FG. (eds.), ASCE conference: Roller Compacted Concrete III, San Diego, USA, 423-439.
Gore RA. and Crowe CT. (1989). Effect of particle size on modulating turbulent intensity. International Journal of Multiphase Flow, 15(2), 279-285.
Hirt CW. (2003). Modeling Turbulent Entrainment of Air at a Free Surface. FSI-03-TN61-R. Flow Science, Inc.

E-proceedings of the 36th IAHR World Congress, 28 June – 3 July, 2015, The Hague, the Netherlands
10
Hirt CW. and Nichols BD. (1981). Volume of fluid (VOF) method for the dynamics of free boundaries. Journal of computational physics, 39(1), 201-225.
Jha, SK. and Bombardelli, FA. (2010). Toward two-phase flow modeling of nondilute sediment transport in open channels. Journal of Geophysical Research: Earth Surface (2003–2012), 115(F3).
Killen JM. (1968). The surface characteristics of self-aerated flow in steep channels. PhD Thesis, University of Minnesota, USA.
Kobus H. (1991). Introduction to Air-Water Flows. In: Wood, I. R.: Air Entrainment in Free-Surface Flows. A. A. Balkema, Rotterdam, 1–28.
Leandro J., Bung DB. and Carvalho R. (2014). Measuring void fraction and velocity fields of a stepped spillway for skimming flow using non-intrusive methods. Experiments in Fluids, 55(5), 1-17.
Ma J., Oberai AA., Drew DA., Lahey RT. and Hyman MC. (2011a). A comprehensive sub-grid air entrainment model for RaNS modeling of free-surface bubbly flows. The Journal of Computational Multiphase Flows, 3(1), 41-56.
Ma J., Oberai AA., Lahey Jr, RT. and Drew, DA. (2011b). Modeling air entrainment and transport in a hydraulic jump using two-fluid RANS and DES turbulence models. Heat and mass transfer, 47(8), 911-919.
Madavan NK., Deutsch S. and Merkle CL. (1984). Reduction of turbulent skin friction by microbubbles. Phys. Fluids 27(2), 356-363.
Matos, J. (2000). Hydraulic design of stepped spillways over RCC dams. Proc. Int. Workshop Hydraulics of Stepped Spillways, Zurich, 187–194, H.E. Minor, W.H. Hager, eds., Balkema, Rotterdam.
Meireles IC., Bombardelli FA. and Matos, J. (2014). Air entrainment onset in skimming flows on stepped spillways: an analysis, Journal of Hydraulic Research, 52(3), 375-385.
Oertel M. and Bung, DB. (2012). Initial stage of two-dimensional dam-break waves: Laboratory versus VOF. Journal of Hydraulic Research, 50(1), 89-97.
Pegram G., Officer A. and Mottram S. (1999). Hydraulics of skimming flow on modeled stepped spillways. Journal of Hydraulic Engineering, 125(4), 361–368.
Pfister M. and Hager WH. (2011). Self-entrainment of air on stepped spillways. International Journal of Multiphase Flow, 37(2), 99-107.
Pope SB. (2000). Turbulent flows. Cambridge University Press.
Prosperetti A. and Tryggvason G. (2007). Computational methods for multiphase flow. Cambridge Press, Cambridge.
Rao NSL. and Kobus HE. (1975). Characteristics of self-aerated free-surface flows (Water and Waste Water/Current Research and Practice) 10. Erich Schmidt Verlag, Berlin.
Straub LC. and Lamb OP. (1953). Experimental Studies of Air Entrainment in Open Channel Flows / St.Anthony Falls Hydraulic Laboratory. Minneapolis, USA, 1953 (4).
Valero D. and García-Bartual R. (2015). Calibration of an air entrainment model for CFD spillway applications. Advances in hydroinformatics 2014. (Submitted - under revision)
Versteeg, HK. and Malalasekera W. (2007). An introduction to computational fluid dynamics: the finite volume method. Pearson Education.
Wilhelms SC. and Gulliver JS. (2005). Bubbles and waves description of self-aerated spillway flow. Journal of Hydraulic Research, 43(5), 522-531.
Wood IR. (1991). Air entrainment in free-surface flows. IAHR Hydraulic Design Manual No.4, Hydraulic Design Considerations, Balkema Publications, Rotterdam, The Netherlands.
Yakhot V. and Orszag SA. (1986). Renormalization group analysis of turbulence. I. Basic theory. Journal of Scientific Computing 1(1), 3-51.