hybrid electric vehicle regenerative-braking using
TRANSCRIPT
UNLV Retrospective Theses & Dissertations
1-1-2000
Hybrid electric vehicle regenerative-braking using ultracapacitors Hybrid electric vehicle regenerative-braking using ultracapacitors
Steven L Pay University of Nevada, Las Vegas
Follow this and additional works at: https://digitalscholarship.unlv.edu/rtds
Repository Citation Repository Citation Pay, Steven L, "Hybrid electric vehicle regenerative-braking using ultracapacitors" (2000). UNLV Retrospective Theses & Dissertations. 1220. http://dx.doi.org/10.25669/sz18-jfz8
This Thesis is protected by copyright and/or related rights. It has been brought to you by Digital Scholarship@UNLV with permission from the rights-holder(s). You are free to use this Thesis in any way that is permitted by the copyright and related rights legislation that applies to your use. For other uses you need to obtain permission from the rights-holder(s) directly, unless additional rights are indicated by a Creative Commons license in the record and/or on the work itself. This Thesis has been accepted for inclusion in UNLV Retrospective Theses & Dissertations by an authorized administrator of Digital Scholarship@UNLV. For more information, please contact [email protected].

INFORMATION TO USERS
This manuscript has been reproduced from the microfilm master. UMI films the text directly from the original or copy submitted. Thus, some thesis and dissertation copies are in typewriter face, while others may be from any type of computer printer.
The quality of this reproduction is dependent upon the quality of the copy submitted. Broken or indistinct print, colored or poor quality illustrations and photographs, print bleedthrough, substandard margins, and improper alignment can adversely affect reproduction.
In the unlikely event that the author did not send UMI a complete manuscript and there are missing pages, these will be noted. Also, if unauthorized copyright material had to t>e removed, a note will indicate the deletion.
Oversize materials (e.g., maps, drawings, charts) are reproduced by sectioning the original, beginning at the upper left-hand comer and continuing from left to right in equal sections with small overlaps.
Photographs included in the original manuscript have been reproduced xerographically in this copy. Higher quality 6" x 9" black and white photographic prints are available for any photographs or illustrations appearing in this copy for an additional charge. Contact UMI directly to order.
Bell & Howell Information and Learning 300 North Zeeb Road, Ann Arbor, Ml 48106-1346 USA
800-521-0600
UMIReproduced with permission of the copyright owner. Further reproduction prohibited without permission.

Reproduced with permission of the copyright owner. Further reproduction prohibited without permission.

HYBRID ELECTRIC VEHICLE REGENERATIVE-BRAKING
USING ULTRACAPACITORS
by
Steven L. Pay
Associate of Arts Montgomery Community College
December 1993
Bachelor of Science University of Nevada, Las Vegas
May 1994
A thesis submitted In partial fulfillment of the requirements for the
Master of Science Degree Department of Electrical Engineering
Howard R. Hughes College of Engineering
Graduate College University of Nevada, Las Vegas
December 2000
Reproduced with permission of the copyright owner. Further reproduction prohibited without permission.

UMI Number: 1403093
UMIUMI Microform 1403093
Copyright 2001 by Bell & Howell Information and Learning Company. All rights reserved. This microform edition is protected against
unauthorized copying under Title 17, United States Code.
Bell & Howell Information and Learning Company 300 North Zeeb Road
P.O. Box 1346 Ann Arbor, Ml 48106-1346
Reproduced with permission of the copyright owner. Further reproduction prohibited without permission.
UNIV Thesis ApprovalThe G raduate College U niversity o f Nevada, Las Vegas
November 17 ^20 00
The Thesis prepared by
Steven L. Pay
Entitled
Hybrid Electric Vehicle Regenerative-Braking usingUltracapacitors
is approved in partia l fu lfillm ent o f the requirem ents for the degree o f
M a s te r o f S c ie n c e in E le c t r ic a l E n g in e e rin g _______
Examlmtion Committee Memo
Examination Committee Memoer
Examination Committee Chair
Dean o f the Graduate College
GradiMe College F/Kulty Representative
PR/1017-53/1.00 11
Reproduced with permission of the copyright owner. Further reproduction prohibited without permission.

ABSTRACT
Hybrid Electric Vehicle Regenerative- Braking Using Ultracapacitors
by
Steven L. Pay
Dr. Yahia Baghzouz, Examination Committee Chair Professor o f Electrical Engineering University o f Nevada, Las Vegas
The concept and application of ultra capacitors for electric load leveling and
regenerative braking is presented. Proposed sizing of an ultracapacitor system
Is presented and discussed based on the available energy and the nominal
operating voltage from a hybrid electric vehicle transit bus.
A control scheme Is required to effectively control the charge and discharge of
the ultracapacitor system. This system Is required to provide for electric load
leveling, effective control and maximization of the regeneratlve-braking system.
In order to optimally control the ultracapacitor system a DC/DC converter Is
required. Alternatively, direct connection of the ultracapacitor system across the
battery bank does not allow for control of energy flow but does assist the battery
system by altering the charge and discharge rate thereby reducing the stress on
the battery system. Both connections of the ultracapacitor system were
Investigated. System Integration using optimal power dispatch from the battery
III
Reproduced with permission of the copyright owner. Further reproduction prohibited without permission.

packs and generator was Investigated with the aid of PSPICE and the Advanced
Vehicle Simulator (ADVISOR) developed by the National Renewable Energy
Laboratory (NREL).
IV
Reproduced with permission of the copyright owner. Further reproduction prohibited without permission.
TABLE OF CONTENTS
ABSTRACT....................................................................................................................lii
LIST OF FIGURES..................................................................................................... vii
ACKNOWLEDGEMENTS........................................................................................... ix
CHAPTER 1 INTRODUCTION..............................................................................1
CHAPTER 2 HYBRID ELECTRIC VEHICLES.................................................... 6Types o f Hybrid Vehicles...................................................................................... 6Hybrid Electric Vehicles Components................................................................. 7Battery Quasi-Static Model..................................................................................11ADVISOR Simulation Results............................................................................. 14
CHAPTER 3 HYBRID ELECTRIC VEHICLES WITH......................................... 23ULTRACAPACITORS AND DC/DC CONVERTER CONTROL
Available Kinetic Energy.....................................................................................23Sizing o f Ultracapacitors.....................................................................................26Ultracapacitor Quasl-Static Model..................................................................... 30DC-DC Converter Control...................................................................................31PSPICE Simulation Results............................................................................... 38ADVISOR Simulation Results............................................................................45
CHAPTER 4 HYBRID ELECTRIC VEHICLES WITH......................................... 50ULTRACAPACITORS AND DIRECT CONNECTION
Pre-ChargIng the Ultracapacitors..................................................................... 50Pre-ChargIng PSPICE Simulation Results......................................................53Direct Connection Control................................................................................. 55Direct Connection PSPICE Simulation Results.............................................. 62Direct Connection ADVISOR Simulation Results...........................................63
CHAPTER 5 ANALYSIS AND CONCLUSIONS................................................. 71Bus Route Drive Cycle.......................................................................................72Central Business District Bus Route Drive Cycle........................................... 87Conclusions...................................................................................................... 101
APPENDIX I MAXWELL TECHNOLOGIES INC PC 2500 DATA SHEET 103
APPENDIX II ADVISOR SOLVE CURRENT FILE............................................105
Reproduced with permission of the copyright owner. Further reproduction prohibited without permission.

REFERENCES......................................................................................................... 107
VITA............................................................................................................................ 110
VI
Reproduced with permission of the copyright owner. Further reproduction prohibited without permission.

LIST OF FIGURES
Figure 2.1 Figure 2.2 Figure 2.3 Figure 2.4 Figure 2.5 Figure 2.6 Figure 2.7 Figure 2.8 Figure 3.1
Figure 3.2 Figure 3.3 (a) Figure 3.3 (b)
Figure 3.3 (c)
Figure 3.4 (a) Figure 3.4 (b)
Figure 3.4 (c)
Figure 3.5 (a)
Figure 3.5 (b)
Figure 3.6 (a) Figure 3.6 (b) Figure 3.7 (a) Figure 3.7 (b) Figure 3.8 Figure 4.1 Figure 4.2 Figure 4.3 Figure 4.4 Figure 4.5 Figure 4.6 Figure 4.7 Figure 4.8 Figure 4.9 Figure 4.10
Series Hybrid Electrical Vehicle System...........................................6Parallel Hybrid Electrical Vehicle System.........................................7H2 Fuel Hybrid Bus Vehicle Diagram................................................ 8Quasl-Static Energy Storage Device Model................................... 12Available Kinetic Energy From Braking...........................................16ADVISOR Setup for the H2 Fuel Hybrid B us................................. 17ADVISOR Drive Cycle Simulation Setup........................................18ADVISOR Output Horizon Batteries...........................................19-21Hybrid Electric Vehicle Diagram with DC-DC Converter..............32ControlTypical Buck-Boost Converter.........................................................33Typical Buck-Boost Control Circuit In Boost M ode.......................34Typical Buck-Boost Control Circuit In Boost M ode.......................35Switch ClosedTypical Buck-Boost Control Circuit In Boost M od e .......................36Switch OpenTypical Buck-Boost Control Circuit In Buck M od e ........................36Typical Buck-Boost Control Circuit In Buck M od e ........................37Switch ClosedTypical Buck-Boost Control Circuit In Buck Mode.........................37Switch OpenBuck-Boost Control Circuit for H2 Fuel Hybrid Bus In.................. 39Boost ModeBuck-Boost Control Circuit for H2 Fuel Hybrid Bus In..................40Buck ModeDC-DC Converter Boost Mode Voltage Values...........................41DC-DC Converter Boost Mode Current Va lues...........................42DC-DC Converter Buck Mode Voltage Values............................43DC-DC Converter Buck Mode Current V a lues............................44ADVISOR Output Maxwell Technologies Ultra capacitors 46-48Hybrid Electric Vehicle Diagram with Direct Connection..............52Pre-ChargIng C ircu it......................................................................... 52Pre-ChargIng Circuit Voltage and Current V a lues ........................54Pre-ChargIng Circuit Power Values................................................ 55Parallel Control C ircuit...................................................................... 56Required Power Constant Drive Cycle............................................ 58Ouasl-Static Current Values............................................................ 59Ouasl-Stafic Voltage Values............................................................ 59Ouasl-Static Power Values.............................................................. 60PSPICE Results Constant Load of 3 0 ............................................63
VII
Reproduced with permission of the copyright owner. Further reproduction prohibited without permission.

Figure 4.11 Figure 4.12
Figure 4.13 Figure 4.14
Figure 4.15 Figure 5.1 Figure 5.2 Figure 5.3
Figure 5.4
Figure 5.5
Figure 5.6
ADVISOR Initial Block Diagram of the Overall System................ 64ADVISOR Revised Block Diagram of the Energy.........................65Storage SystemModified ADVISOR Voc, RInt Block Diagram............................... 66ADVISOR Compute Current Block Diagram................................. 67Added for Ultracapacitor SystemADVISOR Output Ultracapacitor Direct Control...................... 68-70ADVISOR Bus Route Drive Cycle Simulation Setup.................... 75ADVISOR Output Battery System Bus Route Drive Cycle.... 76-80ADVISOR Output Battery & Ultracapacitor System................81-86Bus Route Drive CycleADVISOR Central Business District Bus Route............................89Drive Cycle Simulation SetupADVISOR Output Battery System Central...............................90-94Business District Bus Route Drive CycleADVISOR Output Battery & Ultracapacitor System............. 95-100Central Business District Bus Route Drive Cycle
VIII
Reproduced with permission of the copyright owner. Further reproduction prohibited without permission.

ACKNOWLEDGEMENTS
I would like to thank Dr. Baghzouz for all o f his assistance and guidance as
my advisor in completing this thesis. In addition, for his continued support and
encouragement over the year it took to complete this work. Thanks to Linda Shi
PhD student of the Mechanical Engineering Department for her continued
support, assistance and teaching of ADVISOR to make this work possible.
Thanks to other members of the graduate committee; Dr. Latlfl, Dr. McGaugh,
and Dr. Dalpatadu. In addition, thanks to Gerry Martinez for his assistance with
document reproduction.
I would like to thank my wife Shawna, my mother and my father for giving me
the opportunity and encouragement to pursue both graduate and undergraduate
studies and all of their assistance during the ten years of higher education.
IX
Reproduced with permission of the copyright owner. Further reproduction prohibited without permission.

CHAPTER 1
INTRODUCTION
The use of fossil fuels as a source of energy for transportation Is facing
opposition by many environmental agencies. Pollution caused by internal
combustion engines and the limited resources of fossil fuels are driving many
efforts to explore alternative fuel methods. In addition, to the pollution caused by
the current fuels used, there exists a dependency on the United States
government on foreign oil sources. The EPA, Federal and State governments
have mandated certain percentages for the elimination of fossil fuel type vehicles
[14]. In addition, these concerns have caused many government agencies to
mandate alternative fuel sources.
There is a wide range of alternate fuel sources currently being used and
under study for transportation. One of the first alternate fuel sources, researched
for transportation use, was the electric or battery source unit. This source of
energy for transportation has many environmental advantages over traditional
fossil fuel sources. These Include no air or noise pollution released into in the
environment [21]. However, there are limitations on the range of these types of
vehicles.
Reproduced with permission of the copyright owner. Further reproduction prohibited without permission.

2
Another alternate source of power for transportation Is the use of compressed
natural gas. This source has recently been accepted and Is In use by many
public transportation vehicles [5]. These Include utility companies, taxicabs and
transit buses. This Is due In large to the mandates In place and certain quotas
for these agencies to reduce the number of traditional fossil fuel vehicles. This
source provides longer travel time without refueling or re-charging. However,
natural gas vehicles still produce small amounts o f hydrocarbon pollution.
Another type of alternate source Is Hydrogen. This source has a wide
number of advantages over the primitive alternative sources. The main
advantage Is near zero pollution released Into the atmosphere. In addition,
hydrogen provides a longer range based on the same volume of fuel than other
sources [2], One disadvantage Is the safety concerns not present with other
alternate sources. Another disadvantage of the use of Hydrogen as a fuel source
Is the required Infrastructure.
One recent development In alternative source vehicles Is a combination of
alternate sources that complement each other, a hybrid electric vehicle’ (HEV).
This type of vehicle has two on-board energy sources. First, an engine or fuel
cell powered from some type of fuel. Second, an electrical system and energy
storage system composed of batteries and other components used to power the
drive shaft [23]. There Is a trade off that must be considered In the relative sizes
of each source, as space on the vehicle Is limited. In order to make transportation
practical.
Reproduced with permission of the copyright owner. Further reproduction prohibited without permission.

3
However, the major concern in the use of hybrid electric vehicles Is the range
of travel capable without maintenance. The battery system Is the most prominent
cause of reduction In the vehicle’s range. The battery system also has a finite
number of charge and discharge cycles. The relative size of the battery system
typically consumes a large part available space on the vehicle.
Battery systems also have a finite range of allowable power that can be used
to propel the vehicle. This is a major issue in the infancy of hybrid electric
vehicles. The ability to harness the available energy from the vehicle to charge
the battery system is a very complex issue. There are numerous factors or
variables that define this ability, the drive pattern of the vehicle, the particular
characteristics o f the battery, and the speed, acceleration and braking patterns of
the vehicle [13]. The hybrid electric vehicle Is limited both In Its range of
operation and the space required In the vehicle for both propulsion systems.
There has been research In the kinetic energy available from vehicle braking.
In particular, there has been extensive research on hybrid electric vehicles with
regard to the available kinetic energy, the overall efficiency, and the energy
losses present within the vehicle. The amount of kinetic energy available at the
power train of a vehicle can be re-utlllzed to provide electric energy to the
vehicles electric system. An advantage of electric vehicles and hybrid electric
vehicles over the conventional gasoline engine vehicle Is the ability to utilize this
kinetic energy In a regenerative braking system [13]. A regenerative braking
system allows energy that would ordinarily be lost through heat to be harnessed.
Reproduced with permission of the copyright owner. Further reproduction prohibited without permission.

4
captured and reused. This tremendous amount of kinetic energy present In
larger vehicles can now be used to Increase the vehicle’s range.
The University of Nevada, Las Vegas Electrical and Mechanical Engineering
Departments engaged In the renovation and redesign of a hybrid electric vehicle,
the H2 Fuel Hybrid Bus. The vehicle was originally constructed with a hydrogen
engine and an electric battery system. This vehicle was used as an application
and for simulations for this thesis.
Currently, there Is no clear and concise energy storage system to convert the
kinetic energy Into electric energy. The systems employed In today’s hybrid
electric vehicles take the available kinetic energy and dump’ current Into the
battery systems to charge the battery units [2]. This creates severe stress In the
operation of the electric and energy storage systems. The battery systems
cannot handle large currents placed across the terminals for short periods of
time. This reduces the overall life of the battery system and can cause serious
damage to the battery system. This current and voltage used to charge the
electric system Is typically outside the allowable limits the battery system can
safely handle.
For this reason, a major component that must be addressed In the design of
hybrid electric vehicles Is the regenerative braking system. Recent research has
discovered alternative sources to store energy with the hybrid electric vehicle. A
relatively new alternative source of energy storage Is the ultracapacitor or
supercapacitor. Ultracapacitors are similar In operation to conventional
capacitors; however, have much larger capacity and much longer self-
Reproduced with permission of the copyright owner. Further reproduction prohibited without permission.

5
discharging rates. This thesis will discuss In detail the operation and application
of ultracapacitors to hybrid electric vehicles.
In addition, this thesis will describe and review the design of the energy
storage systems for hybrid electric vehicles and utilize the H2 Fuel Hybrid bus as
an application. The Ideal and actual energy storage systems proposed both
utilize a combination of batteries and ultracapacitors. This will Include computer
simulations In the PSPICE and ADVISOR software packages. ADVISOR Is a
simulation tool used to model and perform detailed research on several types of
hybrid source vehicles. The National Renewable Energy Laboratory (NREL)
produces ADVISOR.
The research shows the direct connection of the ultracapacitor system across
the battery system provides a more robust electrical system than without
ultracapacitors, but the ideal system for a hybrid electric vehicle utilizes a DC-DC
converter to operate the ultracapacitor energy flow independent of the battery
system.
Reproduced with permission of the copyright owner. Further reproduction prohibited without permission.

CHAPTER 2
HYBRID ELECTRIC VEHICLES WITH BATTERIES
This chapter will discuss the different types of hybrid electric vehicles, series
and parallel. Further, this chapter will describe and review the hybrid electric
vehicle components, electric drive system, auxiliary power unit, and battery
system. Finally the quasi-static model of the battery system is introduced and
the ADVISOR simulation results are presented.
2.1 Tvpes of Hybrid Electric Vehicles
There are two basic types of hybrid electric vehicles, series and parallel.
These two systems are as simple as they sound on the surface. The series
system provides an engine, a mechanical/electrical converter, a DC battery
source, and an electrical/mechanical converter to power a drive shaft. Figure 2.1
shows a typical configuration of a series hybrid electric vehicle. This is the type
of system that is utilized for the research within this thesis.
EngineFuel Source Battery
SourceConverter
MectVBec
Transmission
Drive Shaft/
Converter
Elec/Mech
Figure 2.1: Series Hybrid Electrical Vehicle System
Reproduced with permission of the copyright owner. Further reproduction prohibited without permission.

Alternatively, the parallel hybrid electric vehicle system provides a
combination of propulsion systems connected in parallel to a common drive
shaft. This type of system requires a more elaborate drive train and converter
system to couple the different sources together. See Figure 2.2 shows a typical
parallel type hybrid vehicle system. This type of hybrid electric vehicle will not be
discussed further in this thesis.
Drive Shaft/ Transmission
i i\ j : 1
i !1
Engine DC Motor
ii1
ii
Fuel SourceBattery
Source
Figure 2.2: Parallel Hybrid Electrical Vehicle System
2.2 Hybrid Electric Vehicle Svstem Components
The overall hybrid electric vehicle system consists of three major
components. These components include: electric drive system, auxiliary power
Reproduced with permission of the copyright owner. Further reproduction prohibited without permission.

8
unit, and battery banks. Figure 2.3 shows the diagram of the electrical system
for the initial configuration of the energy storage system of the series type H2
Fuel Hybrid Bus.
DC Bus
PukLcbûAODCCanverter
InductionMotorBattery SoLtœ
/SC Generator
Figure 2.3; H2 Fuel Hybrid Bus Vehicle Diagram
2.2.1 Electric Drive Svstem
The electric drive system is composed of an Insulated Gate Bipolar Transistor
(IGBT) type inverter that converts the DC voltage to a pulse width modulated
three phase AC voltage. This AC voltage is used to power an induction motor.
This electric drive system is the output to the drive shaft and transmission. The
system is provided with DC voltage by the auxiliary power unit and the battery
source. Any combination of the DC sources provides electric energy to the
electric drive system that converts this energy to power the vehicle.
Reproduced with permission of the copyright owner. Further reproduction prohibited without permission.

9
2.2.2 Auxiliary Power Unit
The auxiliary power unit consists o f an engine that drives a synchronous
generator. The generator AC voltage is converted using an AC-DC converter
diode rectifier. This system powers the engine by a fuel source, in the H2 Fuel
Hybrid Bus the fuel source is hydrogen. The generator has 4-poles and its rated
voltage, frequency and kVA are 277V, 80 Hz, 70 kVA respectively.
2.2.3 Battery Svstem
The battery system provides a DC voltage directly to the DC bus of the
electrical system. A battery’s present charge rate is described by its state of
charge (SOC), this is a value assigned based on how much energy and the
output voltage of the battery and the number of available battery charge and
discharge cycles is based on the time of discharge and the change in the SOC of
the battery. In the H2 Fuel Hybrid Bus the battery system consists of two parallel
sets of deep-cycle value regulated lead acid (VRLA) batteries. Each string
consists o f 28 units. Each unit is rated 12V, 85 Ah @ C/3. The total battery
system operates at a nominal 336V with a capacity of 170Ah @ C/3. The
equivalent maximum energy storage is 57 kWh, which corresponds to a useable
energy amount of 46kWh, based on the fact the batteries cannot be allowed to
discharge below 20% SOC.
The capacity o f the battery unit varies with the type and time of discharge.
The capacity relationship of the battery with relation to time is described by
Peukert’s equation shown below in equation (2-1) where I is the discharge
Reproduced with permission of the copyright owner. Further reproduction prohibited without permission.

10
current and t is the time of the discharge for the Horizon battery units in the H2
Fuel Hybrid Bus [10], where «=1.33 and
(2- 1)
The available capacity also varies with the temperature of the battery.
The following relationship in equation (2-2) describes the capacity with regard to
temperature where C^-is the capacity at temperature T , Tis the temperature in
°F, Cj. is the capacity available at To - 85 Ah at C/3 for the Horizon battery units
in the H2 Fuel Hybrid Bus [10], where «=0.004.
Cr=C^,]i + a (T -T„)] (2-2)
The next relationship is the battery voltage as a function of time. The
following equations (2-3) and (2-4) describe this relationship where T is the
temperature in °F and t is the time of discharge, where OCV is the open
circuit voltage where Æ/=13.05, A3=0.785, P/=6, f 2=0.845, 7*5=1.1 and
P^=0.22 [10].
F(f) = Æ ,-T - t + K.
(2-3)
s o c ^ X % ) =
^o cv
[ 100 (2-4)
In the following chapters, a description of the energy storage system
design used to effectively charge these units will be presented. The design of
Reproduced with permission of the copyright owner. Further reproduction prohibited without permission.

11
this system requires a clear understanding of the relationships above. The
proposed system design will eliminate the original careless charging or ‘dumping’
of energy to the battery system. The proposed system provides for a controlled
and ideal charging and discharging pattern of the battery system.
2.3 Batterv Quasi-Static Model
In order to understand the simulation and control techniques implemented in
hybrid electric vehicle design, there must first be a basic understanding of the
quasi-static model. This model is used in the design, operation, and simulation
of hybrid electric vehicles. This type of modeling is greatly apparent in computer
simulation tools used to design hybrid electric vehicles. In particular, this type of
modeling is used with the National Renewable Energy Laboratory (NREL)
ADVISOR simulation tool.
The purpose of the quasi-static approach to modeling in the hybrid electric
vehicle is to simplify and increase the speed of the simulation. In quasi-static
modeling, n-dimensional vectors are defined over constant time intervals. The
time interval for this modeling technique is expanded as a function of k, where
k=0,...n-1 specific discrete data points. The general quasi-static approach
utilizes ‘a priori’ modeling techniques regarding the velocity o f the vehicle, v, and
the elevation of the vehicle, h as function of time. The general declarations of
these variables are v(A:)and h(k) where k = Q,...n-\.
From this general information, the acceleration, the velocity, and distance can
be expressed in quasi-static form as:
Reproduced with permission of the copyright owner. Further reproduction prohibited without permission.

12
a(k) = — -(ÿ(k + \)-v{k)), k = Q,...n-2, « (» - !) = 0, (2-5)T
v (J c ) = ~ ( y { k + l ) - > r v { k ) ) , k = 0 , . . . n - 2 ,
(v(A: + l ) + v(A:)).*=0
(2-6)
(2-7)
Because of the discrete calculation method, the formulas of the quasi
static approach do introduce a small error into the results as with any numerical
solution technique. This error is inherent in this type of modeling and must be
considered in the results [16].
In particular, the general quasi-static approach of storage device elements
can be described below in Figure 2.4. This is a general quasi-static model
where the variables F, S, Q, and E take on the variable values for the particular
device being modeled.
FQ
E
Figure 2.4: Quasi-Static Energy Storage Device Model
There are several types of energy storage devices capable of being modeled
with the quasi-static approach. The model for these devices adhere to the same
basic model shown.
Reproduced with permission of the copyright owner. Further reproduction prohibited without permission.

13
First, is the fuel tank model where F is the mass flow of fuel, in the case of the
H2 Fuel Hybrid Bus, Hydrogen, Q is the fuel tank’s capacity (which is constant)
and E is the output effort of the energy storage system.
The next energy storage device modeled using this approach is the battery
system. In this case, variable F is the input or charge current into the battery
system, hat, and the output voltage of the battery system is In this approach,
the batteries are modeled using the basic electrical properties of Kirchoff Current
Law (KCL) and Ohm’s Law. The internal battery resistance is defined as Rmt(q)
and the internal voltage source is defined as VimCq). Both variables are functions
of the battery system’s current state of charge (SOC), q. Finally, the value Qmax is
defined as the battery’s nominal capacity or maximum charge. The model of this
system is described below in equation (2-8).
+ /w , (2-8)^max
Equation (2-8) is valid for both the charging and discharging cycles provided
the constraints of the SOC of the battery system hold true. This model is
accurate for SOC ranges of 0.2 < q < 0.8. Equations (2-9) and (2-10) show the
model for and respectively, where c and d represent the respective
values for charge and discharge.
^m(^) = v,^-^ + Vo7 (2-9)
= (2- 10)
The battery voltage is determined by the known open circuit voltage of the
battery system as a function of the state of charge (SOC) of the system. Further,
Reproduced with permission of the copyright owner. Further reproduction prohibited without permission.

14
the internal resistance of the battery system is not constant in practice. The
value has a static value and a dynamic value as the system changes. This
change in the internal battery resistance as a function of the SOC of the system
increases the complexity of the calculations. The charge of the battery at the
current SOC is obtained by integrating /f,a,over the time interval [16].
2.4 Advisor Simulation Results
The National Renewable Energy Laboratory (NREL) created a MatLab
application for the research, modeling and simulation of hybrid electric vehicles
called ADvanced Vehicle SimulatOR (ADVISOR). ADVISOR was designed to
assist the U.S. Department of Energy (DOE) in their desire to further the design
of hybrid electric vehicles in November 1994. It is a graphical user interface
created on the MatLab and Simulink engine. It provides a very accurate
empirical model o f HEV operation including fuel economy, emissions, storage
system usage and several other operating parameters. ADVISOR was designed
to meet the following criteria: accurate, fast, flexible, publicly available, capable of
modeling vehicles of any type, and easy to use. The main stumbling block of
simulators prior to the design of ADVISOR was the lack of flexibility. For this
reason ADVISOR was designed utilizing a bi-directional quasi-static approach
[28].
Based on the graphical user interface concept, NREL created Simulink block
diagrams for the various types of vehicles: series, parallel, fuel cell, etc. For the
Reproduced with permission of the copyright owner. Further reproduction prohibited without permission.

15
purpose of this project only the series type hybrid vehicle model was considered.
Since this is the type of vehicle being used in the H2 Fuel Hybrid Bus.
Initially, in using ADVISOR, the vehicle block diagram must be selected for
the vehicle to be simulated. Next, the type of vehicle must be determined,
series, parallel, etc. Once this information has been determined then the
individual types of devices can be selected for simulation.
The individual vehicle component information is loaded by the selection of a
*.m file. The allowable component selections for the series type vehicle include:
fuel converter, generator, motor/controller, exhaust after treat, transmission,
wheel/axle, vehicle, energy storage, power train control and accessory. The *.m
file of concern for this project is the energy storage file.
The next step is to determine the simulation setup. This information is stored
in a drive cycle file in MatLab. The key element of this file is a definition of the
speed as a function of time. This defines the interval and time period of
acceleration and deceleration for the simulation and the drive cycle.
Initially, simulations were run in ADVISOR to verify the amount of available
kinetic energy available for use by the energy storage system. Figure 2.5 shows
the ADVISOR results for the available kinetic energy (KJ) for use by the energy
storage system. This shows approximately 1750 KJ of available energy at the
output of the braking system.
Simulations were made for the hybrid bus using only the Horizon Batteries.
The purpose of these simulations was to verify the system operation with only the
Reproduced with permission of the copyright owner. Further reproduction prohibited without permission.

16
batteries present. Figure 2.6 shows the ADVISOR setup screen for this
simulation.
Torque Coupling
Hyd. Torque Converter
Clutch
FC braking
Braking
Motor/Controller
Wheel/Axle
Gearbox
Final Drive
Energy Usage(Regen Mode) (kJ)“I--------1--------1--------1-------- 1-------- r
» : _J________ « -1_________L_0 200 400 600 000 1000 1200 1400 1600 1000
Figure 2.5: Available Kinetic Energy From Braking
As stated before, there are two series battery strings on the H2 Fuel Hybrid
Bus with an overall voltage of 336V and a total Amp Hour (Ah) capacity of 170 at
C/3. The simulations using the Horizon Batteries depict how the vehicle operates
in the all-electric mode prior to any modifications to the energy storage system.
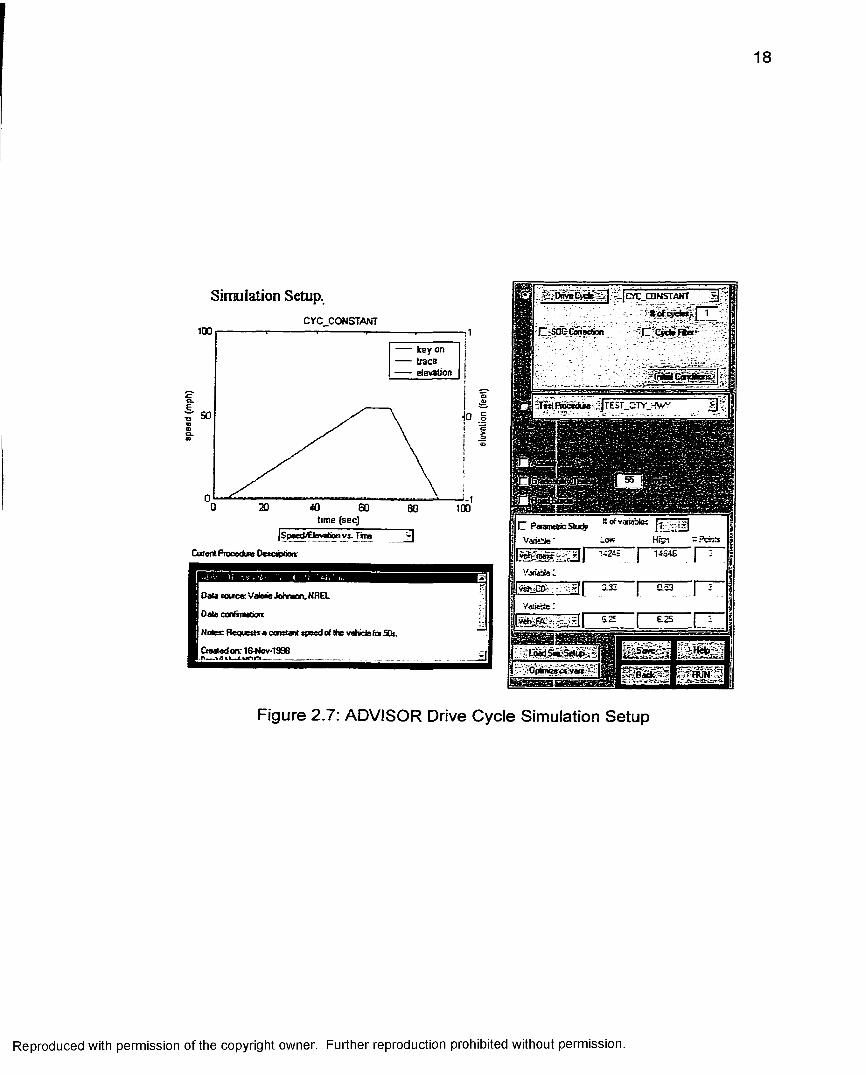
Figure 2.7 shows the ADVISOR drive cycle simulation setup for the Horizon
Batteries. The simulation setup used is at a constant elevation and the vehicle
starts from rest to accelerate at t=5 sec and continues to accelerate to 55 mph.
The vehicle speed then remains constant at 55 mph until t=70 sec. The
vehicle then decelerates to 0 mph at t=90 sec. Figure 2.8 (a), (b) and (c) shows
the ADVISOR simulation results for only the Horizon Batteries in the energy
Reproduced with permission of the copyright owner. Further reproduction prohibited without permission.

17
storage system. These results are consistent with the expected results. This
confirms the input information into ADVISOR is correct for the H2 Fuel Hybrid
Bus. Please note the battery system provided all the power to the bus for the
operation of the bus. The values of power results are shown in watts (W), the
current results are shown in amps (A), the distance is shown in meters (m) and
the x-axis is time shown in (sec). Table 2.1 shows the energy usage for the
Horizon Battery simulation. Again this information is consistent with the expected
results for the H2 Fuel Hybrid Bus based on the two parallel Horizon battery
strings.
Vducle Input
ImWRCGE
aTfanMTmmonWHllWDBOGENSgâSS
VEHiHYDROGENK%!Fuel Converter Operation - Hydrogen (218kW) 7.5L SI Engine |fEnergTSlo.ag»>
lerÆurPROGENAeçLbCtpHpeEBLij
I'iSnVanabteJSlw «= 100
jOBcjcrtm acc_meeh_e(l acc_mech_pwi acc_mech_lrq acc_piopiiel«iy »cc_vaidalioo scc_v«ftion
-0:25
1000 1500 2000 2500 3000Speed (rpm)
Figure 2.6: ADVISOR Setup fo r the H2 Fuel Hybrid Bus
Reproduced with permission of the copyright owner. Further reproduction prohibited without permission.
18
Simulation Setup.CYC CONSTANT
100 key on— trace elevation
I
100time (sec)
|Sp»edÆlevationvv. Tkiie
CuronI Prcoedue Oetciipdaa
Date coucarValene Johnicn,NREL
Date cociTviaaooa
Notex Requestxa constant tpeedof the vehidefa SQl
Daated on: l&NovlSSB
E K l CrC_CONSTANT # :
IT;ŒOCaiection IT CÿdeRÙt
Paramedic Stucti
!| Varisile ' Low
I '/Jriàte:
Hipi ïPch»14S4G
:-g|[ Ï33 I ÔS |~TVanàk:
a2s
LoadS««Se|it4>
OpBÎûsoCyârs IsfHÜMS
Figure 2.7: ADVISOR Drive Cycle Simulation Setup
Reproduced with permission of the copyright owner. Further reproduction prohibited without permission.

19
cyc_mph r
ess soc hist
Ck 10 10
esspw r out a
0( 10 10
pb pwr_out_aA10 20 30 40 50 60 70 BO 90
Figure 2.8 (a): ADVISOR Output Horizon Batteries
Reproduced with permission of the copyright owner. Further reproduction prohibited without permission.

20
GOcyc_mph_rmpha40
20
10 3020 40 50 BO 70 00 90
ess current2 500
CDO)
-500 30 00
ess_pwr_out_rO
0 10 3020 40 0050 BO 70 90400
m 30003(D
^ 360
3200 10 20 30 40 0050 BO 70 90
Figure 2.8 (b): ADVISOR Output Horizon Batteries
Reproduced with permission of the copyright owner. Further reproduction prohibited without permission.

21
eye mph r
ess currentID 5Qu
distance% 1000
5 500
0(10 10
ess_pwr_lDss_a
Figure 2.8 (c): ADVISOR Output Horizon Batteries
Reproduced with permission of the copyright owner. Further reproduction prohibited without permission.

22
Enetgr Usage Table p j )POWER MODE REGEN MODE
In Out Litss EfL In Out Loss EM.Fuel 0
Fuel Convertes dutch
HjnL: TnrqueCbnvetter Genesalar
TotqueÊfMHgr Slorage 1795 Enetgv Stored -G294
0
7241 848 0.79
Motar/Conbelef 7191 6240 951 IL87 2095 1808 287 0.86Gearbos G240 6045 195 0.97 2100 2095 5 1
Final Drive 6045 6045 0 1 2100 2100 0 1W heei/Aaie
Braking Aur Loads
Aero RoMerg
6045 5903 143
635251467
0.38 3899 3879 201780
0 J 9
■QveM Siatetn Effciw icy
0.31 E*Oveial enagy efliaency is ca lctlatsd é [aero * ioinal/(FueI in - ess stotagej
Table 2.1: ADVISOR Energy Usage Table Output Horizon Batteries
Reproduced with permission of the copyright owner. Further reproduction prohibited without permission.

CHAPTER 3
HYBRID ELECTRIC VEHICLES WITH ULTRACAPACITORS AND
DC/DC CONVERTER CONTROL
This chapter will discuss the available kinetic energy available from a vehicle
for use with the regenerative braking system. In addition, sizing calculations of
ultracapacitors and the quasi-static model for the ultracapacitor is presented.
The DC-DC buck boost converter is presented and its application to the H2 Fuel
Hybrid Bus is shown. A buck boost control circuit is designed for use with the H2
Fuel Hybrid Bus and simulation results are presented with the use of PSPICE
and ADVISOR to validate these results.
3.1 Available Kinetic Enerqv
When a vehicle is operating in traffic the majority of energy is dissipated in
heat and friction in the braking system. The efficiency of the energy storage
system to utilize this energy can be improved in three major areas; operate each
component at its maximum efficiency; reduce the friction; aerodynamic and
transmission losses; and recover the kinetic and potential energies that are lost
in heat through the braking system [13]. The latter is the premise for a
regenerative-braking system.
23
Reproduced with permission of the copyright owner. Further reproduction prohibited without permission.

24
The available kinetic energy available for a mass in motion not considering
any losses is described in equation (3-1), the definition of kinetic energy, where m
is the mass and v is the velocity.
(3-1)
This recovery of available kinetic energy is the most effective means to
increase the range and overall efficiency of a hybrid vehicle. This energy
available from the friction losses in the braking system can sometimes exceed
the amount o f energy capable of being recovered by the energy storage system.
Therefore, a more realistic approximation of the available energy must be
considered, taking into account the losses within the vehicle. For utilization by
the energy storage system, we must consider the amount o f usable energy in a
storable capacity. For this reason, we must consider the amount o f power that
can be stored in watts (W) or kilowatts (kW). On level ground, the brake power
of the hybrid vehicle during deceleration can be described by equation (3-2) [13].
/?* = V ■ {m5 ■ (^) - mgf, - ^ ( p ^ C ^ A )) (JV) (3-2)
where: m = the vehicle mass (kg)V = the vehicle speed (m/s)
— = the deceleration o f the vehicle (m/s^) dtf^= the rolling resistance coefficient p„= the air density Cg= aerodynamic drag coefficient ^y= front area of the vehicle
Reproduced with permission of the copyright owner. Further reproduction prohibited without permission.

25
This relationship provides an accurate approximation of power available for
use by the energy storage system. Consideration must be given in larger
vehicles to determine if all or only some the available kinetic energy can be
harnessed into re-useable energy. This consideration is based on the physical
size within the vehicle for energy storage devices, the availability o f energy
storage devices capable of handling the energy, and the overall system cost [13].
In the regenerative braking process, the kinetic energy is converted into
storable or potential energy by the use of an electric motor or generator. The
speed of this motor is important in the amount of available energy. If the speed
of this motor is less than the rated speed, then the amount o f recoverable energy
is less than optimal. If the speed of this motor is at rated speed or above then
the amount o f energy capable of being recovered will be optimal. Another
important concept to be considered in the amount of recoverable energy is to
ensure the energy is distributed on the front and rear axles so that the maximum
allowable energy is recoverable [13]. The kinetic energy has been calculated for
the H2 Fuel Hybrid Bus system. This initial information was required to begin the
energy storage system design.
The first step in the design of the regenerative braking system was to first
determine the amount available kinetic energy available from the subject vehicle.
Calculations were made to estimate the available kinetic energy that would be
available during the H2 Fuel Hybrid Bus operation cycle.
The weight of the bus accounting for all of the modifications was determined
to be 33,000 lbs or 14,968kg. Estimates were made to determine the amount of
Reproduced with permission of the copyright owner. Further reproduction prohibited without permission.
26
kinetic energy produced by the bus not including any resistances or losses. An
initial estimate was made that 30% of the kinetic energy produced would be
usable by the energy storage system. This estimate was based on the urban
drive cycle for a large vehicle. The drive cycle must consider the maximum
acceleration and deceleration values for the vehicle. The results show an
estimated amount of 1.0 MJ of available kinetic energy at 50 mph based on an
estimate o f 30% useable kinetic energy. The bus has a governor that will not
allow the speed to exceed 55 mph. More detailed estimates and computer
simulations validated this value of 1.0 MJ.
Based on the fact, 1MJ of kinetic energy is available after all losses, friction,
heat, etc. the design of the energy storage system was completed. This energy
amount is the maximum available energy when the bus is at 55 mph and is
stopped over period not less than ten (10) seconds. Solving equation (3-1) for
the H2 Fuel Hybrid Bus yields approximately 1 .G9KJ of available kinetic energy.
Applying the relationship in equation (3-2) estimates approximately 25KW/sec for
the bus.
3.2 Sizing of the Ultracapacitors
The H2 Fuel Hybrid Bus came equipped with a regenerative braking system,
which converted the vehicle kinetic energy to electrical energy during braking.
This type o f feature installed was known to increase driving range by up to 20%.
However, since VRLA batteries are not designed to accept large, short bursts of
power, especially when near full charge, conventional regenerative braking
Reproduced with permission of the copyright owner. Further reproduction prohibited without permission.

27
causes them to overcharge and results in battery damage. Thfs original system
was disabled on the H2 Fuel Hybrid Bus until design was completed to replace
this system.
In a hybrid electric vehicle, energy is constantly being stored and utilized.
This constant charging and discharging puts the battery system under a
tremendous strain. This constant fluctuation in the SOC of the batteries reduces
the overall life expectancy [15]. Most batteries in production today are designed
to be charged and discharged over a long period of time while not fully being
discharged. Rather, limiting the SOC of the battery system to a minimum of
20% .
An ultracapacitor provides the same basic energy storage parameters as a
conventional capacitor. However, the amount of energy and the discharge rate
or time constant of the device greatly differs from the conventional capacitor.
Ultracapacitors utilize an electrolyte rather than a common dielectric. When a
voltage is applied across the electrodes charge is accumulated at the electrode
terminals and across the electrolyte material. This electrolyte material has far
greater surface area than that of a common dielectric capacitor. This results in a
much greater capacitance per area than a common capacitor. A conventional
capacitor has a capacitance per area on the order of 1 nF/cm^, while the
ultracapacitor has a capacitance per area on the order of 50 pF/c m^ [6] [12].
Conventional capacitors increase the energy storage properties by increasing
the applied voltage across the electrodes. The limit o f the voltage applied to the
electrodes of a conventional capacitor is limited to the breakdown voltage of the
Reproduced with permission of the copyright owner. Further reproduction prohibited without permission.

28
dielectric material. In the case of the ultracapacitor, the solvent or the organic
electrolyte decomposition properties limit the energy storage capacity. This
voltage is usually in the range of 1V to 5V [12].
Ultracapacitors are ideal for storage of energy in hybrid electric vehicles
because of the slow discharge rate and the reduced physical size to obtain the
same energy storage characteristics of conventional capacitors. The energy
storage system of the hybrid electric vehicle is critical to increase the overall
driving range and reducing the cycling on the state o f charge (SOC) of the
batteries.
The ultracapacitors used in early hybrid electric vehicles had extremely high
volumetric capacitances because of large electrode surface areas and extremely
small electrode separations. The expected life of an ultracapacitor is much
greater than that of the battery system. It is now probable the energy storage
system of the hybrid electric vehicle to out last the life of the vehicle. This means
an energy storage system utilizing ultracapacitors is now more reliable than that
of an all-electric vehicle only utilizing batteries. In addition, the ultracapacitors
operate at higher power densities than batteries [15].
Once the available kinetic energy was estimated, the required size for the
ultracapacitors was determined. In order to calculate the energy storage system
sizes the following information was required. Vmax - maximum voltage, Vmin -
minimum voltage, Vw - allowable voltage change during pulse. Power - power of
applied current, time - duration of pulse. The following is the calculation
Reproduced with permission of the copyright owner. Further reproduction prohibited without permission.

29
procedure used to determine the ultracapacitor system and the individual unit
size [22].
KE = (3-3)
Solving equation (3-3) for the available kinetic energy of 1.0 MJ and a voltage
of 360 V across the capacitor system at the DC bus of the energy storage system
yields a capacitance of approximately 16F.
The charging and discharging of the ultracapacitors is a very complex issue.
The ultracapacitor selected for use with the H2 Fuel Hybrid Bus project, Maxwell
Technologies, PC 2500 has limited voltage and current characteristics.
Each ultracapacitor unit has a nominal voltage of 2.5V for each 2500F unit.
The overall voltage required for the ultracapacitor system of the H2 Fuel Hybrid
Bus is approximately 360V as stated above. Therefore, a minimum of 144
ultracapacitor units was required for the system. A total of 150 ultracapacitor
units were selected to compensate for the internal resistance within the units.
This provides the system with an overall capacitance of 16.67F and a nominal
voltage 375V and a maximum voltage of 405V.
Table 3.1 shows the electrical characteristics for a single Maxwell
Technologies, Inc. PC 2500 unit and the overall electrical characteristics for the
150-unit string.
Reproduced with permission of the copyright owner. Further reproduction prohibited without permission.

30
MAXWELL TECHNOLOGIES, INC. PC2500 ULTRACAPACITOR
Single PC2500 Unit 150 PC2500 UnitsCapacitance (F) 2500 16.67Series Resistance (mO), DC 1 150Series Resistance (mQ), 100 Hz 0.6 90Voltage Continuous (V) 2.5 375Voltage Peak (V) 2.7 405Rated Current (A) 400 400Leakage Current (mA) 6 6
Table 3.1: Maxwell Technologies, Inc PC2500 Data
3.3 Ultracapacitor Quasi-Static Model
The ultracapacitor must be modeled using the quasi-static approach to
complete the required simulations. In the quasi-static approach, ultracapacitors
are very similar in nature to the operation of batteries. For that reason, the same
type of modeling scheme was used by NREL to provide a reasonable quasi-static
model. In figure 2-4, the input F to the model is defined as , the ultracapacitor
current and the effort of the output E is defined as , the ultracapacitor voltage.
Therefore, the model applied to the ultracapacitor is shown in equations (3-4)
and (3-5).
+ (3-4)
(3-5)
Reproduced with permission of the copyright owner. Further reproduction prohibited without permission.

31
The capacitance C and the internal resistance Ri„, can be defined as
constants or as functions for the purpose of modeling. Similarly to the battery
model, the charge q for the ultracapacitor is obtained by integrating luc using
equation (2-8). However, this type of modeling can introduce issues within the
simulation tools. Because the ultracapacitor operates in a similar fashion to the
battery, it would be intuitive to simulate both devices with the same model.
However, the ultracapacitor does not have an amp hour (Ah) rating and a voltage
referenced by the SOC. Conversely, the ultracapacitor has an initial voltage
across its terminals and a charging and discharging function with respect to time.
In the simulation section of this chapter, the consequences of this modeling are
discussed in further detail.
3.4 DC-DC Converter Control
A control scheme must be determined that can effectively control the storage
of energy within the electrical system. The DC-DC buck-boost converter is most
logical selection for this type of control. Figure 3.1 shows the ideal configuration
for the energy storage system utilizing a DC-DC control scheme for the
ultracapacitor system.
3.4.1 The DC-DC Buck Boost Converter
The buck-boost converter incorporates both the buck and boost converters
into one converter being able to operate both when the output voltage is higher
or lower than the source voltage. Figure 3.2 (a) shows the typical DC-DC buck-
Reproduced with permission of the copyright owner. Further reproduction prohibited without permission.

32
DC Bus
DC/DC OofTwerter
ACVDCCon\«1er
InductionMotor
/>C Generator
Lltracapadtors
Figure 3.1: Hybrid Electric Vehicle Diagram with DC-DC Converter Control
booster converter. Figure 3.2 (b) shows the typical DC-DC buck-booster
converter with the switch closed and figure 3.2 (c) shows the typical DC-DC
buck-boost converter with the switch open [17].
3.4.2 H2 Fuel Hvbrid Bus DC-DC Converter Control
For the H2 Fuel Hybrid Bus the buck-booster converter would operate in the
boost mode during acceleration and would operate in the buck mode during
regenerative-braking. The control of the buck-boost converter is accomplished
by altering the pulse width of the modulated waveform.
Reproduced with permission of the copyright owner. Further reproduction prohibited without permission.

33
+ iD <
Figure 3.2 (a): Typical Buck-Boost DC-DC Converter
O Vi vL=VsVo
Figure 3.2 (b): Typical Buck-Boost DC-DC Converter Switch Closed
O VI vL=VoVo
J .
Figure 3.2 (c): Typical Buck-Boost DC-DC Converter Switch Open
Once the size of the ultracapacitor system was determined a buck-boost
circuit was determined to effectively operate the system. The boost mode circuit
is shown in figure 3.3 (a), this circuit is used during the acceleration mode of the
vehicle. The buck mode circuit is shown in figure 3.4 (a), this circuit is used
during deceleration or regenerative braking. The buck-boost control circuit must
limit the current of the system below 300A. This is the rated amount of current
Reproduced with permission of the copyright owner. Further reproduction prohibited without permission.

34
that the system can effectively handle. In addition, the control circuit must limit
the overall voltage to less than 405V, which the maximum voltage the
ultracapacitor string can handle.
Vo
Figure 3.3 (a): Typical Buck-Boost Control Circuit in Boost Mode
Figure 3.3 (b) shows the buck-boost control circuit in boost mode with the
switch closed. When the switch is closed there are two circuits resulting. The
first is an RLC circuit with only a natural response and the second circuit is a
simple resistive circuit. The first equation has roots that can be over-damped,
critically damped or under-damped based on the values of the resistors,
capacitor and inductor. The resultant equations for the buck-boost control circuit
in the boost mode with the switch closed are shown in equations (3-6) and (3-7).
In addition, the initial conditions of the energy storage elements must be
considered.
C(3-6)
Reproduced with permission of the copyright owner. Further reproduction prohibited without permission.

35
(3-7)
RbRcRo
Vb
+
Vo
Figure 3.3 (b): Typical Buck-Boost Control Circuit in Boost Mode Switch Closed
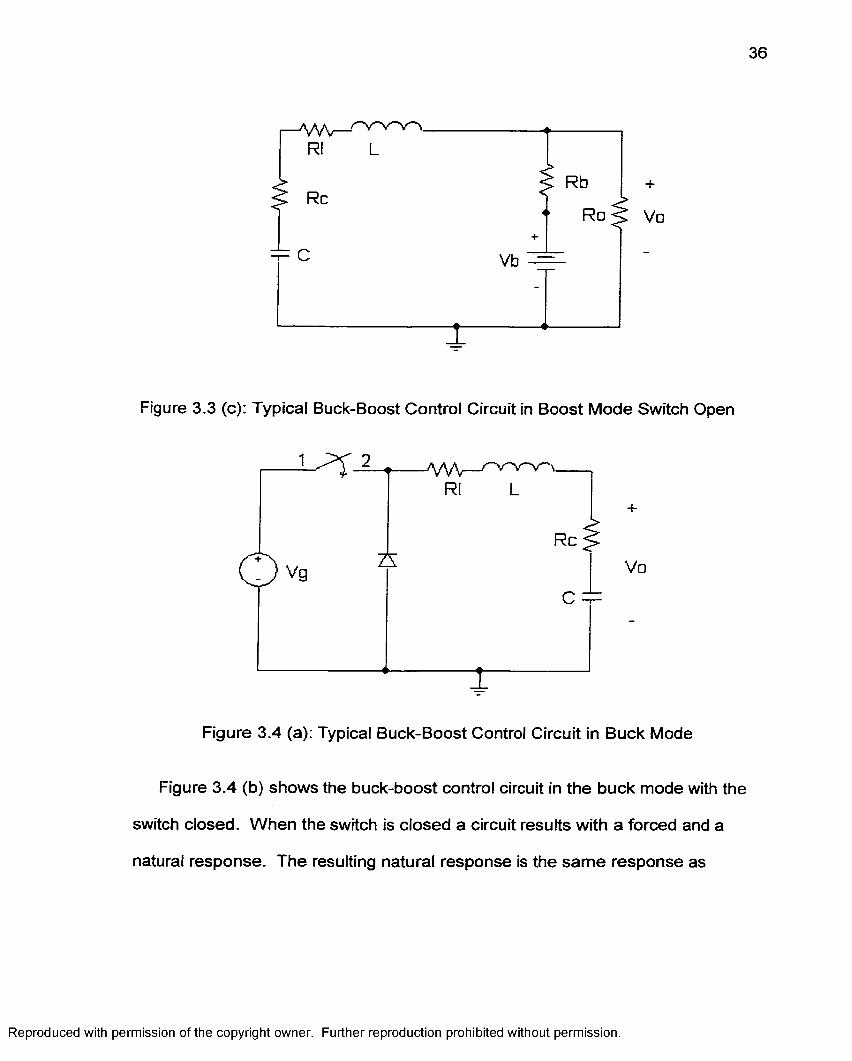
Figure 3.3 (c) shows the buck-boost control circuit in the boost mode with the
switch open. When the switch is open the circuit results which is a second order
result with a natural and forced response. Again, the response of the circuit is
dependent upon the circuit component values. Equation (3-8) shows the
relationship of the natural response of the circuit where / is the current through
the capacitor. The forced response is described by -Vo. Equation (3-9) shows
the relationship of the output voltage Vo. In addition, the initial conditions for the
energy storage elements must be considered.
(3-8)
(3-9)
Reproduced with permission of the copyright owner. Further reproduction prohibited without permission.
36
RbRc
Ro
Vb
Figure 3.3 (c): Typical Buck-Boost Control Circuit in Boost Mode Switch Open
AAA—
Rc
C —
Vo
Figure 3.4 (a): Typical Buck-Boost Control Circuit in Buck Mode
Figure 3.4 (b) shows the buck-boost control circuit in the buck mode with the
switch closed. When the switch is closed a circuit results with a forced and a
natural response. The resulting natural response is the same response as
Reproduced with permission of the copyright owner. Further reproduction prohibited without permission.

37
shown previously in equation in equation (3-8) with the exception of the forced
response is described by Vg instead of -Vo.
RcVo
Figure 3.4 (b): Typical Buck-Boost Control Circuit in Buck Mode SwitchClosed
RcVo
Figure 3.4 (c): Typical Buck-Boost Control Circuit in Buck Mode Switch Open
Figure 3.4 (c) shows the buck-boost control circuit in the buck mode when
the switch is open. When the switch is open a circuit results with only a natural
Reproduced with permission of the copyright owner. Further reproduction prohibited without permission.

38
response. The resulting natural response is the same as shown previously in
equation (3-6).
Again depending upon the circuit component values the natural response of
the circuits can be in various damping modes. In addition, the duty ratio of the
switch within the circuit, both for the boost mode and the buck mode, play an
important role in the circuit operation. This will determine what conduction mode
the buck-boost circuit operates within.
This type of control system is the ideal option to fully utilize the range of the
ultracapacitor system. This allows the ultracapacitor system to operate from OV
to 375V through its full voltage range and completely charge and discharge. This
operation is independent from the battery system and provides complete control
of the ultracapacitor system.
Due to the extensive cost of the buck-boost DC-DC converter, a decision was
made based on available funding not utilize a DC-DC converter to control the
ultracapacitor system. Therefore, further validation was not sought to pursue the
design shown in Chapter 4.
3.5 PSPICE Simulation Results
Computer simulations were completed using the DC-DC converter designed
above. This is the optimal operation of the ultracapacitor system and the most
available energy can be provided for the full range of the ultracapacitor system
operation.
Reproduced with permission of the copyright owner. Further reproduction prohibited without permission.

39
Simulations were conducted using the values o f the elements as shown in figure
3.5 (a) and (b), fo r both the boost and buck mode operation. These elements
were selected based on the design parameters for the buck-boost converter and
confirming the best results with simulations verify the optimal operating
parameters.
PSPICE simulations were completed to confirm the expected results of the
DC-DC converter. Figures 3.6 (a) and 3.7 (a) show the voltage values at the
ultracapacitor system and the battery system during the boost and buck mode
respectively. Figures 3.6 (b) and 3.7 (b) show the battery current, the
ultracapacitor current and the output current at the load during the boost and
buck mode respectively. These results are consistent with the expected results
for the DC-DC control circuit. The voltage across the ultracapacitor system does
1H
.150Vs Vo290
=F 16.67F 360
Figure 3.5 (a): Buck-Boost Control Circuit for H2 Fuel Hybrid Bus in Boost Mode
Reproduced with permission of the copyright owner. Further reproduction prohibited without permission.

40
1H
.150290
16.67F 4=
Figure 3.5 (b): Buck-Boost Control Circuit for H2 Fuel Hybrid Bus in Buck Mode
across the ultracapacitor system does not exceed the allowable amount of 405V
for the system. The current through the ultracapacitor system does not exceed
the allowable amount of 300A. In addition, the parameters o f the battery system
are with the allowable constraints discussed in the previous chapter. For these
simulations a constant load resistance of 1.5Q was used. In practice the load
resistance varies with the operation and cannot be assumed to be constant.
Reproduced with permission of the copyright owner. Further reproduction prohibited without permission.

41
V b a t
iaau-f■s 10s
: U(C1:1) T U (V 2:*)T in
Figure 3.6 (a); DC-DC Converter Boost Mode Converter Voltage Values
Reproduced with permission of the copyright owner. Further reproduction prohibited without permission.

42
le a p
■ « + -es
IL o o d
; I ( L 1 ) « - ICR*»)20s a es
T in e
Figure 3.6 (b): DC-DC Converter Boost Mode Current Values
Reproduced with permission of the copyright owner. Further reproduction prohibited without permission.

43
%e#v-
2#eu
Os 18s- U (D 1 * :2 )- U (R 2:2) U(C2:1)
T ine
Figure 3.7 (a): DC-DC Converter Buck Mode Voltage Values
Reproduced with permission of the copyright owner. Further reproduction prohibited without permission.

44
I gen
-400A +Os 10s
r I(R 5 ) o I(R 2)20s 30s
Tine
Figure 3.7 (b): DC-DC Converter Buck Mode Current Values
Reproduced with permission of the copyright owner. Further reproduction prohibited without permission.

45
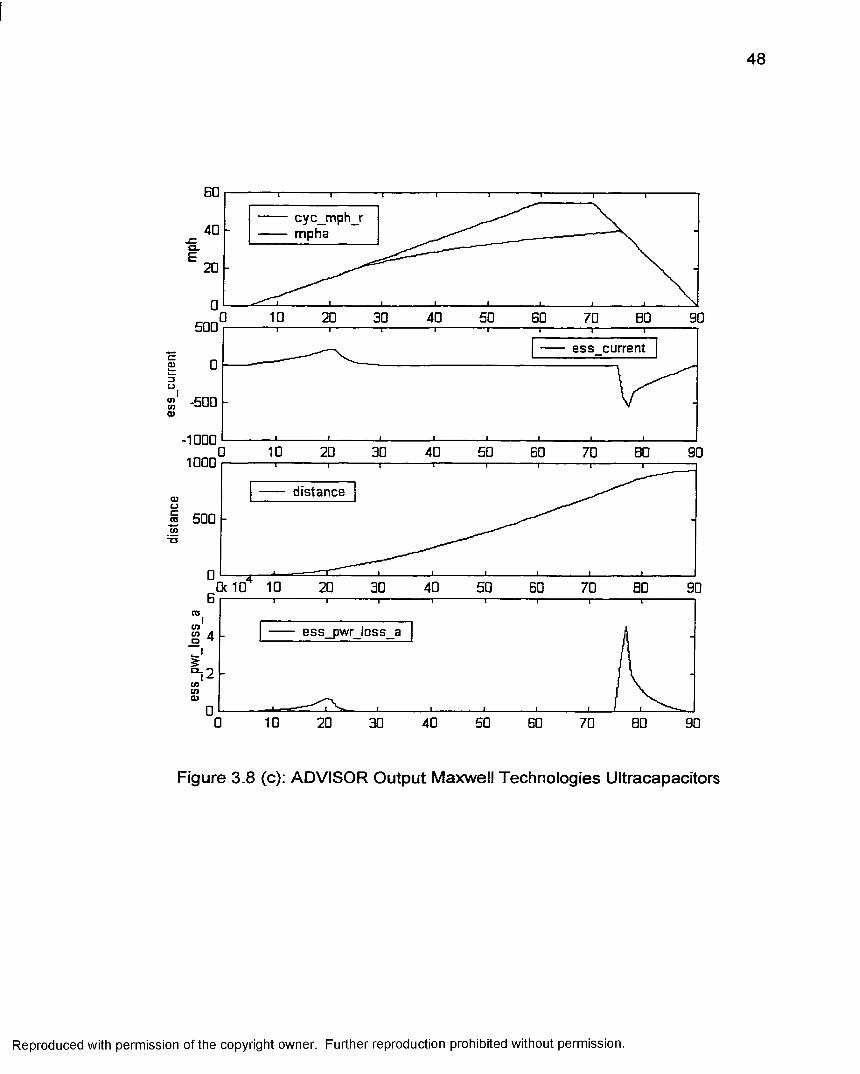
3.6 ADVISOR Simulation Results
ADVISOR Simulations were completed using only the ultracapacitor system
without the battery system. NREL had created a modified energy storage file for
ADVISOR created to simulate the ultracapacitor system using the same quasi
static model as the batteries. The energy storage file in ADVISOR was modified
to simulate the parameters of the ultracapacitors. In order to simulate the
ultracapacitor system an Ah value need to be calculated. Although
ultracapacitors are not measured with Ah values, a value of .868 was calculated
based on the conversion from Ah to the available energy of the ultracapacitor.
Once this conversion was completed the simulations were straight forward as
shown in the previous chapter for the battery system only. However, in this
simulation cycle the ultracapacitor does not have nearly enough power to propel
the vehicle by itself. For this reason with this simulation the hydrogen engine
was necessary as shown in the simulation results. The drive cycle shown in
figure 2.7 was again used for the simulation. Figure 3.8 (a), (b) and (c) show the
results for the simulations utilizing only the Maxwell Technologies PC 2500
ultracapacitor system. Table 3.2 shows the energy usage for the Maxwell
Technologies ultracapacitors simulation. The results show kinetic energy of 1.1
MJ at the energy storage system regenerative braking mode. This is consistent
with the expected results for the ultracapacitor system alone. This simulation
depicts an unrealistic situation because the vehicle would never be operated with
Reproduced with permission of the copyright owner. Further reproduction prohibited without permission.

46
only the ultracapacitor system. However, it was valid to verify the operating
parameters of the system during acceleration and regenerative braking.
cyc_mph_r
20 30 40 50 60 70 00 90
ess soc hist“ 0.9
S 0.7
0( 10 10
ess_pwr out a
OcIO 10 20 30 40 50 60 70 00 90
pb pwr out a
10 20 30 40 50 60 70 00 90
Figure 3.8 (a): ADVISOR Output Maxwell Technologies Ultracapacitors
Reproduced with permission of the copyright owner. Further reproduction prohibited without permission.

47
cyc_mph_r
ess current
Dc 10 10
BSS_pwr_out_r
pb_valtage™ 350
Figure 3.8 (b): ADVISOR Output Maxwell Technologies Ultracapacitors
Reproduced with permission of the copyright owner. Further reproduction prohibited without permission.
48
BOcyc_mph_rmpha
20
40500
ess currentC033U
-500(DcnO)
-10001000
40
distance0)L)ra 500 2
COOJ
cncnCD
0 10 20 40 5030 GO 8070 90
Figure 3.8 (c): ADVISOR Output Maxwell Technologies Ultracapacitors
Reproduced with permission of the copyright owner. Further reproduction prohibited without permission.

49
Enatgf Usage TobiePclJPOWER MODE REBEN MODE
In Out Loss E lf. In Out Loss EH
Fuel 0 178E8Fuel Convetter 178M 3767 14101 0.21 392
dutchHjrd. Torque Cbnveilat
Gcoeretor 3375 3563 188 1.06To n^C ou pfingEnergp Storage 1098 639 191 0.81Energy Stored 2S9
Motor/Contralar 4019 4137 118 1.03 1137 978 159 0.86Gearfaos 4137 4014 123 0.97 1140 1137 3 1
Final Drive 4014 4014 0 1 1140 1140 0 1WheeUArde 4014 3683 331 0.92 1972 1961 11 0.99
BraUng 821AusLoarh 63
Aetb 326RoBng 1247
"Overs# SyKem Effnency
0.083"OvnaD ene tg j/ e flnenq i tt ra ta ia led « Isem * lo ingV lh iri in - ess storage)
MooNB#:
Table 3.2: ADVISOR Energy Usage Table Output Maxwell TechnologiesUltracapacitors
Reproduced with permission of the copyright owner. Further reproduction prohibited without permission.

CHAPTER 4
HYBRID ELECTRIC VEHICLES WITH
ULTRACAPACITORS AND DIRECT CONNECTION
This chapter will discuss the direct connection control o f the ultracapacitor
system. This will include pre-charging the ultracapacitor system with PSPICE
simulation results. Finally, the direct connection of the ultracapacitor system is
presented both with the quasi-static solution and exact solution. PSPICE and
ADVISOR simulation results are presented to confirm these results.
4.1 Pre-Charging the Ultracapacitors
Based on the funding o f the H2 Fuel Hybrid Project and the cost of the DC-
DC converter control system, a decision was made to pre-charge the
ultracapacitor system and place it directly across the battery system. Therefore,
instead of the buck-boost converter or DC-DC converter circuit being used to
control the ultracapacitor system, the system will be pre-charged and
permanently connected across the battery system.
Although this is not the optimal approach to incorporate the ultracapacitor
system into the energy storage of the hybrid electric vehicle, this method should
provide a ‘smoothing’ of the current characteristics across the battery system.
50
Reproduced with permission of the copyright owner. Further reproduction prohibited without permission.

51
This will elevate some stress on the battery system. However, this
configuration will not eliminate the ‘dumping’ of energy across the battery system
from the regenerative-braking system. Figure 4-1 shows the block diagram of
the direct connection configuration for the energy storage system.
In order to place the ultracapacitor system directly across the battery
terminals, it must be pre-charged to the open circuit voltage o f the battery
system. In order to accomplish this a series of pre-charging switches within a
circuit was used to establish an initial voltage of 360V. Three switches within the
circuit were required to pre-charge the system while keeping it within the
allowable parameters.
Figure 4.2 shows the series of pre-charging switches required to charge the
ultracapacitor system to the required initial voltage. This circuit charges the
ultracapacitor system to 360V at which time the system is placed directly across
the battery terminals.
The values for the pre-charging circuit, in particular the values across the
switches were based on running the charging process several times determining
where the cycle exceeds the allowable limits of the ultracapacitor system. The
simulation was run to determine the point at which the current or voltage
exceeded the allowable parameters of the ultracapacitor system. That is the
reason for three separate switches closing at t=0, t=t1 and t=t2 respectively. The
Reproduced with permission of the copyright owner. Further reproduction prohibited without permission.

52
DC Bus
UKracapacitcts
DOACConverter
AODC ConverterACGeneratcr
Battery SoiToe
Figure 4.1: Hybrid Electric Vehicle Diagram with Direct Connection
tClose=0 R1" vA/V
R2
Rb ^ tClose=t1 tClose=t2
RcVb
Figure 4.2: Pre-Charging Circuit
pre-charging designed for the case of the H2 Fuel Hybrid Bus using component
values of R1=4 ohms, R2=2 ohms and the switches closing at t1 =90 seconds
and t2=180 seconds. Once the system reaches the desired initial voltage the
Reproduced with permission of the copyright owner. Further reproduction prohibited without permission.

53
pre-charging circuit Is disabled or disconnected from the system. As this should
be in theory, the only time the system is required to be pre-charged. However,
this circuitry will need to be utilized anytime the battery or ultracapacitor system
has to be replaced. In addition, this circuitry enables the system to be charged
at a faster rate than if the ultracapacitor system was directly connected across
one switch.
Once the system Is pre-charged, circuits were initially designed to review the
operation of the system based on a constant request of power.
4.2 Pre-Charqinq Ultracaoacitors PSPICE Simulation Results
Computer simulations were completed using the pre-chargIng circuit and the
acceleration and regenerative-braking circuits above. Again, this operation of the
ultracapacitor system Is not the optimal way to control the system. PSPICE
simulations were completed to confirm the expected results of the pre-charging
circuit. Figure 4.3 shows the battery voltage, the ultracapacitor voltage and the
current across the ultracapacitor. Figure 4.4 shows the power across the battery
and the power at the load. These results are consistent with the expected
results for the pre-charging circuit. The voltage across the ultracapacitor system
does not exceed the allowable amount of 405V for the system. The current
through the ultracapacitor system does not exceed the allowable amount of
300A. In addition, the parameters of the battery system are within the allowable
constraints discussed In the previous chapter.
Reproduced with permission of the copyright owner. Further reproduction prohibited without permission.

54
P b s t
lOKW-i
Pcap
os ses: I (C 1 )- U (R4:1) c I (C D * W(U1:*)
100s
T in e
1SQs
Figure 4.3: Pre-Charging Circuit Voltage and Current Values
Reproduced with permission of the copyright owner. Further reproduction prohibited without permission.

55
3tflU
2##U
190U
9U
2
Vbat
Vcap
leap
as ##sQ ] - U(RH:1) v> u (u i:* ) (2] ■ i ( c i )
80s 128s
Tine
Figure 4.4: Pre-Charging Circuit Power Values
4.3 Direct Connection Control
Once the ultracapacitor system is pre-charged to the required initial voltage, it
is permanently connected across the battery system. Figure 4.5 shows the
circuit used for the energy storage system for the H2 Fuel Hybrid Bus project.
This circuit is not the optimal approach to control the ultracapacitor system.
However, this type of connection does allow for increased life of the battery
system and additional energy available during acceleration not present in the
standard system with only batteries. The circuit shown in Figure 4.5 shows that
the battery system is connected in parallel with the ultracapacitor system. This
connection forces the voltage at the output terminals of the ultracapacitor system
Reproduced with permission of the copyright owner. Further reproduction prohibited without permission.

56
to equal the voltage across the battery system. This system operation differs
from the buck-boost circuit control, as it does not allow the ultracapacitor system
to be fully discharged to OV across the system.
Rb.19
350V-
Tib
4-Vb
Rc .15
16.67F -L
t i c
Vo
+
VII
i
Load
Figure 4.5: Parallel Control Circuit
Initially, the required power is determined for the present situation of the
vehicle, then this power is provided by the energy storage system and the
hydrogen engine. Once the amount of power required to be provided by the
energy storage system the actual amount of power that the energy storage
system could provide could be determined. Equation (4-1) shows the power
relationship of the control circuit in Figure 4.11.
= (4-1)
The required power, the internal resistance of the battery at a given SOC, the
internal resistance of the ultracapacitor system, the voltage across the battery
system and the initial voltage of the ultracapacitor system are all known values.
Reproduced with permission of the copyright owner. Further reproduction prohibited without permission.
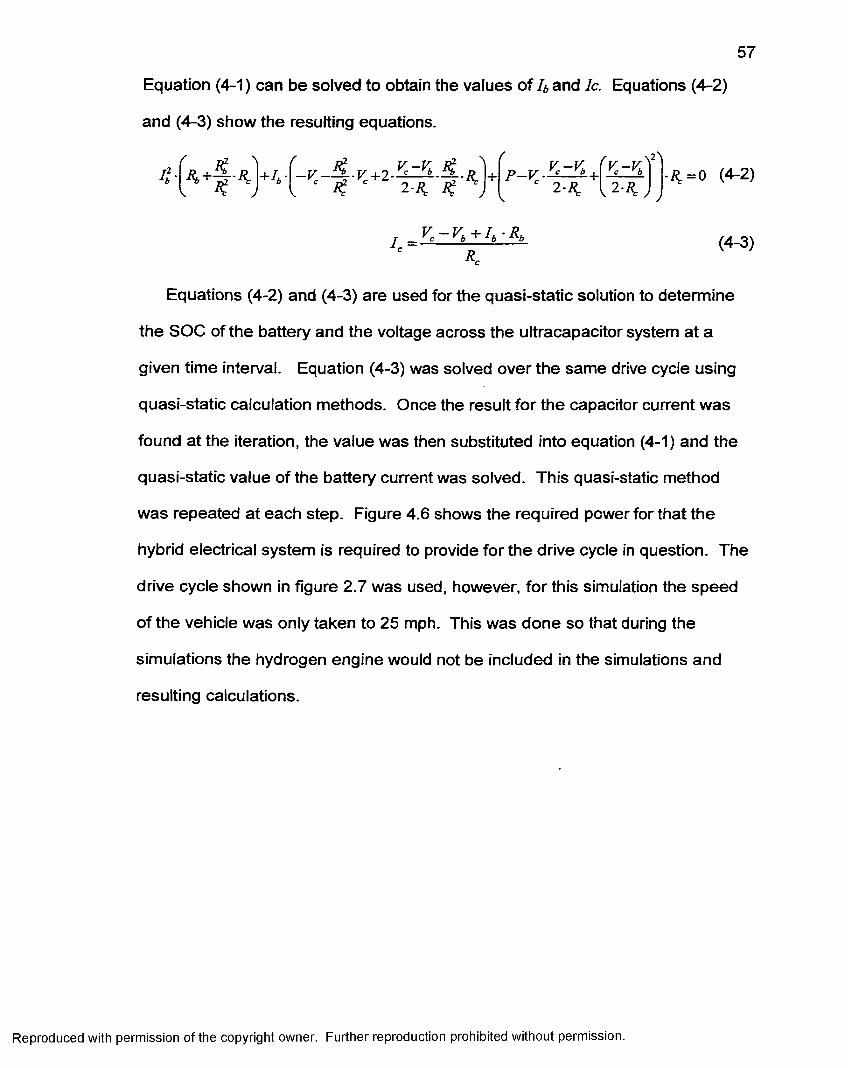
57
Equation (4-1) can be solved to obtain the values o f/* and Ic. Equations (4-2)
and (4-3) show the resulting equations.
I I- +h- K -K\2\
i^= 0 (4-2)
(4-3)
Equations (4-2) and (4-3) are used for the quasi-static solution to determine
the SOC of the battery and the voltage across the ultracapacitor system at a
given time interval. Equation (4-3) was solved over the same drive cycle using
quasi-static calculation methods. Once the result for the capacitor current was
found at the iteration, the value was then substituted into equation (4-1) and the
quasi-static value of the battery current was solved. This quasi-static method
was repeated at each step. Figure 4.6 shows the required power for that the
hybrid electrical system is required to provide for the drive cycle in question. The
drive cycle shown in figure 2.7 was used, however, for this simulation the speed
of the vehicle was only taken to 25 mph. This was done so that during the
simulations the hydrogen engine would not be included in the simulations and
resulting calculations.
Reproduced with permission of the copyright owner. Further reproduction prohibited without permission.

58
Required Power Constant Drive Cycle
80,000
60,000
40,000
K? 20,000
10 • rrrrrTTTTTT
- 20,000
CO ^ CO t — CO ^ CM CN CO CO
CO V — CO CO T— CO cOTf If) to CD CO b- CO GO o)
-40,000 -L--------- ------ — ------- ---------------- ----------- ---- --------------
Time (sec) : —. - 'Power Required
Figure 4.6: Required Power Constant Drive Cycle
The quasi-static solution for solving for the ultracapacitor, battery and load
current and voltage values yields the results shown in figure 4.7 and figure 4.8.
Figure 4.9 shows the power values for the quasi-static solution.
After a solution was reached for the quasi-static results based on the
calculated value of the battery current first and then the ultracapacitor current,
the set of equations were solved again. This time the solution of the
ultracapacitor current
Reproduced with permission of the copyright owner. Further reproduction prohibited without permission.

59
Quasi Static Current Values
250.00
200.00
150.00
100.00
50.00
0.00CO 05 m T— fv*T— T— CN CO CO
03CO 03 "in^ TT m CO CO O '
-50 .00 -
- 100.00Current Bat Current Cap Current Load
-150.00
Time (sec)
Figure 4.7: Quasi-Static Current Values
Quasi Static Voltage Values
390.00
380.00
370.00
360.00 -
350.00
340.00
u 330.00
320.00
310.00
300.00■ m — Voltage Bat
- — Voltage Cap
♦ — Voltage Load
290.00 CO 0505CO sCO CO CO CD
T im e (« e c )
Figure 4.8: Quasi-Static Voltage Values
Reproduced with permission of the copyright owner. Further reproduction prohibited without permission.

60
Power Quasi Static Values
100,000
80,000
60,000
5 40,000
Ig 20,000
CO 0 3lO COCO CO
- 20,000
j—• — Power Bat j —■ — Power Cap i - - - Power Load
-40,000
Time (sec)
Figure 4.9: Quasi-Static Power Values
was sought first and then the value of the battery current was calculated at each
discrete data point. Equations (4-4), (4-5), (4-6), (4-7) and (4-8) show the
alternate solution.
(4-4)
(4-5)
V, - I , R , -V , R.
(4-6)
Reproduced with permission of the copyright owner. Further reproduction prohibited without permission.

31
P-Y^Yè---R.
K - K + IçRç \ n
V R
. {VtRc)^VÀR, ■^2R,)±^VlRl ^2V,R,V,R^+R,{R,(y^-AR,P)-AR]P
Equation 4-9 shows the solution for the ultracapacitor current. Once this
value was calculated at each data point the result was used to calculate the
battery current as shown in equation 4-5. The solutions obtained with the
second calculation method yielded the same results as the initial solution shown
in figure 4.7, figure 4.8 and figure 4.9.
Once the quasi-static solution was obtained, the exact solution for the set of
equations was sought. Mesh analysis was applied to the circuit shown in figure
4.5. Noting that the load power is a function of time. The following set of
equations 4-9 and 4-10 describe the mesh system. Equation 4-11 shows the
resulting relationship for the ultracapacitor current.
- V, + i , . R, + (/, - 0 -R ^ + C — (/, - 0 = 0 (4-9)at
P Pi = — = ------ (4-10)V ^b~h'Rb
(4-11)at
Solving this set of equations for a function of Vc yields the solution in equation
(4-12).
Reproduced with permission of the copyright owner. Further reproduction prohibited without permission.

62
p = v:\Rb J
+ V ,dv^ - C - 2 C ^
Rdv
b J dtVbRçC
V Rb . dt R.
(4-12)
C -2 C
(4-13)
This solution shown in equation (4-13) yields a non-linear first order
differential equation. The non-linear first order differential equation was solved
using the quadratic relationship and the Runge-Kutta method to obtain the
solution for Vc. Fortran code was written to obtain this solution. The exact
solution yields the same results as shown for the quasi-static solutions above [3].
This is further validated with computer simulations.
4.4 Direct Connection PSPICE Simulation Results
PSPICE was used to simulate the circuit shown in figure 4.5 with a constant
load resistance. Attempts were made to validate the results obtained from the
quasi-static solutions of the equations for this circuit. PSPICE simulations were
limited because the load could not be modeled with a constant power, only with a
constant resistance, current or voltage. Simulation results for the direct
connection control circuit are shown in figure 4.10 below.
Reproduced with permission ot the copyright owner. Further reproduction prohibited without permission.

63
The PSPICE results for a constant load situation were useful to verify the
results of the quasi-static equations. However, this simulation was not useful to
confirm the calculations during normal operating conditions of the vehicle.
PSPICE was not as an effectively tool as ADVISOR for the validation of the direct
connection control circuit.
8M
[load
' I b o t
\
\
leap
0 A + -------------------------------r-------------------------------------- 1------Os Ss 10sz I(R b ) O I(RC) V - I(R 3 )
2 8 s
Time
2 5 s 38s 35s
Figure 4.10 — PSPICE Results Constant Load of 30
4.5 Direct Connection ADVISOR Simulation Results
In order to simulate the direct connection control circuit in ADVISOR the
ADVISOR code had to be rnodified from its original form. In normal simulations
with ADVISOR, only one energy storage file could be used to input data for the
energy storage system. This file is the energy storage file or the ess file.
Because it was necessary to simulate both the battery system and the
Reproduced with permission of the copyright owner. Further reproduction prohibited without permission.

64
ultracapacitor system as one system, the block diagram control scheme in
MatLab and Simulink had to be modified.
Extensive research and investigation was completed to determine the input
and output variables of the block diagram of the ADVISOR simulation process in
Simulink. Figure 4.11 shows the overall block diagram for ADVISOR, figure 4.12
shows the ADVISOR block diagram for the energy storage system.
There are several sub-block diagrams that were investigated within the
overall energy storage system block diagram. They include the sub block
diagram for the Voc and Rint, the sub block diagram for computing the current,
the sub block diagram to limit the power and the sub block diagram for the SOC.
After extensive research of the block diagrams for the ADVISOR energy
storage system, the necessary revisions were made to the energy storage block
diagram. Modifications were made to overall diagram and a sub block diagram
was added to compute the current and voltage.
vehicle controls
0 —4 3Clock To VUoriGpace
generator/«n rttm tfi» r< g r>
drive cyde <cyo
vehicle <veh> wheel andgytP <wh>
Rnal drive <fd: geaitw <gb> motoi/m n fm lfe r < m g
QSum
series hybrid control aategy
iltSgal
total fuel used@al)
JiisL
powerbus<pb>
converterforaeries
ez_c3Jc I
Htc_emi5|
HC.CO.
eneigy aoiage <ea
exiiaua sys NOx. PM M <ax>
Figure 4.11 : ADVISOR Block Diagram of the Overall System
Reproduced with permission of the copyright owner. Further reproduction prohibited without permission.

65
o -power req’d into bus (W)
SOC
Goto <sdo>.
ess_pwr_out_f
To Workspaces
pack Voc, Rint
t .= r
'CS>
max pack pwr(W)
computecurrent
>»
>limit power
^ess_max_pwi
Goto <cs>l
M
SOCalgorithm
t
ess_pwr_out_a
To Workspaces
* ©
»<^bus_voltage
power available to bus (W)
3oto <mc>, <go, <sdpss_^_calc
SOC
stop Sim
jx > f(u)
J1 Tess
Qess_gen T ar
Q ar
I ess_pwr_loss_a[
n ess_mod_&TÏ
^ ess_air_tmp
-W' ess_air_th_pw •
coul eft
Figure 4.12: ADVISOR Revised Block Diagram of the Energy Storage System
These values were calculated in the new sub block diagram and then the
calculated values returned to the original block diagram for the voltage, current
and power. These modifications were made with the assistance of the
Mechanical Engineering Department at UNLV. The modified block diagrams for
the energy storage system are shown in figure 4.13 and figure 4.14. The overall
energy storage system now had a control system that allows the vehicle to utilize
both the batteries and ultracapacitors during acceleration and deceleration.
Reproduced with permission of the copyright owner. Further reproduction prohibited without permission.

66
rttZ]--Product open a re u it
voitaoe o f batteiy
V 0C 8(V)
SOC(pr V)
mod tm p
Rb
Œ>To Wbrtopace
M em oryl
f{u)
Dot Prodt a
Pc
Figure 4.13; Modified ADVISOR Voc, Rint Block Diagram
The modified file was simulated using the same simulation setup as used in
the previous ADVISOR simulations and the constant drive cycle shown in figure
2.9. Figure 4.17 (a), (b) and (c) shows the results of the ADVISOR simulations
performed with the modifications discussed. The ADVISOR results after the
modifications are consistent with the results o f calculating the values quasi-
statically as well as the exact solutions obtained.
Reproduced with permission of the copyright owner. Further reproduction prohibited without permission.

67
mcmyomn
S
Figure 4.14: ADVISOR Compute Current Block Diagram Added forUltracapacitor System
Reproduced with permission of the copyright owner. Further reproduction prohibited without permission.

68
30
eye mph r mpFfa20
0 10 20 30 60 9040 50 70 BO400
load200
-200400
20
200
10 20 30 50 60 9040 70 80
0
-100
-2000 10 20 30 6040 50 70 80 90
Figure 4.15 (a): ADVISOR Output Ultracapacitor Direct Control
Reproduced with permission of the copyright owner. Further reproduction prohibited without permission.

69
2D
eye mph r mpha
0 10 20 30 50 GO 70 8040400
300
3B3.B10 20 9ID0 30 50 GO 70 8040
VDCb
“ 3G3.G
3G3.410 20 30 50 GO 70 80 9 0
voce
10 20 30 40 50 GO 70 80
Figure 4.15 (b): ADVISOR Output Ultracapacitor Direct Control
Reproduced with permission of the copyright owner. Further reproduction prohibited without permission.

70
eye mph r mpha
pb_pwr_out_aCD
40 60 7030
Pb
(X
70 90
Pc
oQ .
10 20 800 40 50 60 70 9030
Figure 4.15 (c): ADVISOR Output Ultracapacitor Direct Control
Reproduced with permission of the copyright owner. Further reproduction prohibited without permission.

CHAPTER 5
ANALYSIS AND CONCLUSIONS
The results produced for the Horizon 12N85 lead-acid battery strings were
consistent with the anticipated results. The ADVISOR file provided accurate
input for two parallel battery strings with 28 individual units with an overall parallel
string voltage of 336V. The results were compared to the calculated results, for
H2 Fuel Hybrid Bus as an all-electric vehicle and produced the same results.
The results produced for the Maxwell Technologies PC 2500 Ultracapacitors
were also consistent with the anticipated results. ADVISOR provided accurate
input for an ultracapacitor energy storage system with 150 individual units with
and overall nominal string voltage of 375V. The results were compared to the
theoretical results expected for the ultracapacitor system and are consistent with
those expectations.
Initially, three solution methods were reached for the same direct connection
system, the first, was calculating the results using the quasi-static method. The
second solution was to calculate the results using the exact solution or time
domain solution of the system. The third solution was to modify the ADVISOR
block diagrams and files to account for the installation o f the ultracapacitor
system with the direct connection control scheme. As shown previously, all three
71
Reproduced with permission of the copyright owner. Further reproduction prohibited without permission.

72
solutions produced similar results. The cycles used in the previous chapters
were used only to verify the calculation methods for the simulators. The drive
cycles were not typical for simulating the operation of the vehicle.
Once the ADVISOR calculation method was verified it was sought to
simulation the H2 Fuel Hybrid Bus using drive cycles that were representative of
the vehicle operation. In order to show this operation several drive cycles were
simulated for the H2 Fuel Hybrid Vehicle. The constant drive cycle was ran in
greater detail and the Federal Urban Driving Schedule (FUDS). These result
produced results that were expected for the vehicle but were not representative
of the drive cycle pattern that would be seen by the H2 Fuel Hybrid Vehicle. For
this reason, two drive cycles were studied in great detail to further verify and
quantify the benefits of the installation of the ultracapacitor system. These drive
cycles are the Bus Route Drive Cycle and the Central Business District Bus
Route Drive Cycle. These two drive cycles are discussed in detail in this chapter.
5.1 Bus Route Drive Cycle
The next drive cycle used to perform simulations with ADIVSOR was the Bus
Route Cycle. This cycle is shown in figure 5.1 and performs a series of starts
and stops between 0 mph and 20 mph. There are a total of 28 stops in all for the
cycle. This is the most representative drive cycle for the H2 Fuel Hybrid Vehicle.
This drive cycle utilizes the hydrogen engine to power the vehicle. Figure 5.2 (a)
and figure 5.3 (a) show the hydrogen usage for the respective energy storage
system. The vehicle utilizes the hydrogen engine for situations where the
Reproduced with permission of the copyright owner. Further reproduction prohibited without permission.

73
maximum power îthe energy storage system can apply is not sufficient for the
energy required fo r the power bus. This situation is shown in figure 5.3 (a) at
approximately 4 0 0 seconds. These figures also show the battery SOC values
slightly higher for the direct connection system. This is expected for this
configuration.
Figure 5.2 (b) shows the current supplied by the energy storage system
when only the battery system is present (ess_current). Figure 5.3 (b) shows the
current supplied b#y the energy storage system when both the battery system and
the ultracapacitor system are present (I load). These values are the same
through out the drive cycle. Figure 5.3 (b) shows the corresponding battery
current (lb) and uMracapacitor current (Ic). Comparing the graphs for the battery
current between th e two systems shows that the battery system does not need to
provide as much current at each acceleration and deceleration pulse for the
system with ultracapacitor system. This is result is desired and is what is
expected for the system. Figure 5.3 (c) shows the voltages at the power bus,
battery system and the ultracapacitor system. Again, these results are consistent
with the expected results. Finally, figure 5.3 (d) shows the simulation results for
the power at each element in the system. The resulting power at the load
(pb_pwr_out_a) is the sum of the power provided by the battery (Pb) and the
power provided b y the ultracapacitor system (Pc). This shows a smaller amount
of energy required by the battery system than required by the battery system by
itself, shown in figu re 5.2 (c) and figure 5.3 (d). This smoothing of the waveform
at the battery system and at the load is consistent with the expected results for
Reproduced with permission of the copyright owner. Further reproduction prohibited without permission.

74
the direction connection with the bus route cycle. Comparing figures 5.2 (e) and
5.3 (f) show the benefit of the ultracapacitor system. These figures show
approximately 25% less power required by the battery system with the
ultracapacitor system than with only the batteries. In addition, the overall fuel
required by the hydrogen engine is less with the ultracapacitor system as
expected, because the required power at the power bus does not exceed the
maximum value of the power that can be provided by the energy storage system
for as long o f duration. The simulation with the ultracapacitor system utilizes
approximately 30% of the hydrogen required by the system with only the
batteries. All of these results confirm the expected results for the respective
systems.
Again, this drive cycle is the most representative of the operation of the H2
Fuel Hybrid Bus. It shows a tremendous advantage for the cycle with
ultracapacitor system installed. It provides the desired results for the system and
validates the installation of the ultracapacitor system reducing the stress placed
on the battery system and increasing the overall vehicle ranges.
Reproduced with permission of the copyright owner. Further reproduction prohibited without permission.

75
40
Simiilatioa Setup
CYCBUSRTE
#20
key onirsceelevation
0 500 1000 ome (sec)__________(SpBcd/EfavaliDnva.'nme
QnamProcadtne Detciîpïoa
0 i
1500
jRclaipn-e C'tr fiJSRTE mI Oaia source:Maastrad by KsiSi V/ipka. NREL. on a 16ii Suvot Msil bus n Oanvai CO. Oola conTnnafon:
Notes:This is a 1.65-mile round trip: with the bus stopping oi every biocfc end
LBUSRTE
' " “ ' s s i s a s - '
%
:jTeitP>o6Bdl«aa:jTEST_Crrr'_HWi-
55
O ParametiicSIudy Variable T
#ot'variablesLow Hign SPontï
BMBHigal-IS-'j j 1S3-I2 j 3 1Variable 2mmiiMPi C33 1 G.53 1 3 ;|
Variable 2m m m m 6.25 1 £.25 1 3 1
Figure 5.1: ADVISOR Bus Route Drive Cycle Simulation Setup
Reproduced with permission of the copyright owner. Further reproduction prohibited without permission.

76
Q .E
30
20
10
0
cyc_mph_rmpha
200 400 600 800 1000 14001200
ess soc hist.2 0.98
ë 0.96
S 0.94
0.92 I0.2
0 200 400 600 800 1000 14001200
0.15
0.05
&10 200 400 600 800 1000 14001200
pbjDwr_out_r
o .
0 200 400 600 800 1000 14001200
Figure 5.2 (a): ADVISOR Output Battery System Bus Route Drive Cycle
Reproduced with permission of the copyright owner. Further reproduction prohibited without permission.

77
30
cyc_mph_rmpha
Cl.
1400800 1200200 400 600 1000400
2 200 3S 0
ess current-200
1400800 1000 12009c 10 200 400 600
essjDwr_out_r
cncnCD
1400800 1200200 400 1000600450
pb_voltageœ 400CJiroÔ 350
c l 300
2501400200 800 1200400 600 1000
Figure 5.2 (b): ADVISOR Output Battery System Bus Route Drive Cycle
Reproduced with permission of the copyright owner. Further reproduction prohibited without permission.

78
30
20
10
0QtlO 200
cyc_mph_rmpha
lUi400 600 800 1000 1200 1400
ess_pwr_out_a
a .cncn
& 10 200 400 600 800 1000 1200 1400
cncn
Q .cncn
200 600400 800 1000 1200 14003000
distance2000<D
c_>c rB=5 1000
0 200 600400 800 1000 1200 1400
Figure 5.2 (c): ADVISOR Output Battery System Bus Route Drive Cycle
Reproduced with permission of the copyright owner. Further reproduction prohibited without permission.

79
x1012
— - Pb- - - Ph
4 r
1000 1200 14000 200 400 600 800
Figure 5.2 (d); ADVISOR Output Battery System Bus Route Drive Cycle
Reproduced with permission of the copyright owner. Further reproduction prohibited without permission.

80
x10
. I
200 220 240 260 280 300
Figure 5.2 (e): ADVISOR Output Battery System Bus Route Drive Cycle
Reproduced with permission of the copyright owner. Further reproduction prohibited without permission.

81
cyc_mph r
200 400 600 BOD 1000 1200 140
ess SOC histCO
0.90.04
200 400 BOO 800 1000 1200 140
0(10' 200 400 BOO BOO 1000 1200 140
pb pwr out r ess max pwr apply
0 200 400 BOO BOO 1000 1200 140
Figure 5.3 (a): ADVISOR Output Battery & Ultracapacitor Systems Bus RouteDrive Cycle
Reproduced with permission of the copyright owner. Further reproduction prohibited without permission.

82
eye mph_r mpha
600200 400 1000 14C800 1200500
less-500400
400 600200 1000 14C800 1200
200JO
-200200 400 600200 1000 1200800
u-200
-4004000 600 1000 14C200 800 1200
Figure 5.3 (b): ADVISOR Output Battery & Ultracapacitor Systems Bus RouteDrive Cycle
Reproduced with permission of the copyright owner. Further reproduction prohibited without permission.

83
eye mph_r
1000 1200pb_voltage
■5 350
300200 800400 BOO 1000 1200 14C
3B4vocb
5 3B3
200 BOO BOO 1200400 1000 14C
voce
300200 400 BOO BOO 1000 1200 14C
Figure 5.3 (c): ADVISOR Output Battery & Ultracapacitor Systems Bus RouteDrive Cycle
Reproduced with permission of the copyright owner. Further reproduction prohibited without permission.

84
K 10”CO
o
DC 10 200 400 BOO 800 1000 1200 1400Pb
CL
0( 10 400 600200 800 1000 14001200
CL
400 600200 800 1000 1200 1400
500
200 400 600 800 1000 1200 1400
Figure 5.3 (d): ADVISOR Output Battery & Ultracapacitor Systems Bus RouteDrive Cycle
Reproduced with permission of the copyright owner. Further reproduction prohibited without permission.

85
X 101.5
PbPcPh
0.5
-0.5
-1.5 1200 14001000800600200 400
Figure 5.3 (e); ADVISOR Output Battery & Ultracapacitor Systems Bus RouteDrive Cycle
Reproduced with permission of the copyright owner. Further reproduction prohibited without permission.

86
X 10
0.8 PbPcPh0.6
0.4
0.2
-0.2
-0.4
-0.6
-0.8
200 210 220 230 240 250 260 270 280 290 300
Figure 5.3 (f): ADVISOR Output Battery & Ultracapacitor Systems Bus RouteDrive Cycle
Reproduced with permission of the copyright owner. Further reproduction prohibited without permission.

87
5.2 Central Business District Bus Route Drive Cycle
The next drive cycle used to perform simulations with ADIVSOR was the
Central Business District Bus Route Drive Cycle. This cycle is shown in figure
5.4 and performs a series of starts and stops between 0 mph and 20 mph. There
are a total of 14 stops in all for the cycle. This is an extremely valuable
representative drive cycle for the H2 Fuel Hybrid Vehicle. This drive cycle
utilizes the hydrogen engine to power the vehicle. Figure 5.5 (a) and figure 5.6
(a) show the hydrogen usage for the respective energy storage system. Again,
the vehicle utilizes the hydrogen engine for situations where the maximum power
the energy storage system can apply is not sufficient for the energy required for
the power bus. This situation is shown repeatedly in figure 5.6 (a). These
figures also show the battery SOC values slightly lower for the direct connection
system. This result was expected based on the sharp acceleration and
deceleration rate required by the vehicle. This result is different from the
previous Bus Route Drive Cycle.
Figure 5.8 (b) shows the current supplied by the energy storage system
when only the battery system is present (ess_current). Figure 5.6 (b) shows the
current supplied by the energy storage system when both the battery system and
the ultracapacitor system are present (I load). These values are the same
through out the drive cycle. Figure 5.6(b) shows the corresponding battery
current (lb) and ultracapacitor current (Ic). Comparing the graphs for the battery
current between the two systems shows that the battery system does not need to
provide as much current at each acceleration and deceleration pulse for the
Reproduced with permission of the copyright owner. Further reproduction prohibited without permission.

88
system with ultracapacitor system. This is result is desired and is what is
expected for the system. Figure 5.6 (c) shows the voltages at the power bus,
battery system and the ultracapacitor system. Again, these results are consistent
with the expected results. Figure 5.6 (d) shows the simulation results fo r the
power at each element in the system. The resulting power at the load
(pb_pwr_out_a) is the sum o f the power provided by the battery (Pb) and the
power provided by the ultracapacitor system (Pc). This shows a smaller amount
of energy required by the battery system than required by the battery system by
Itself, shown in figure 5.5 (c) and figure 5.6 (d). Comparing figures 5.5 (e) and
5.6 (f) clearly show the advantage of the ultracapacitor system. Less fuel is
required by hydrogen engine with the installation o f the ultracapacitor system.
The charge and discharge cycles of the battery system is less dramatic with the
ultracapacitor system by approximately 20%. This smoothing of the waveform at
the battery system and at the load is consistent with the expected results for the
direction connection with the bus route cycle. In addition, the overall fuel
required by the hydrogen engine is approximately 2% less with the ultracapacitor
system as expected, because the required power at the power bus does not
exceed the maximum value of the power that can be provided by the energy
storage system for as long of duration as the previous drive cycle. All o f these
results confirm the expected results for the respective systems.
Again, this drive cycle is an extremely valuable representative of the
operation of the H2 Fuel Hybrid Bus. This drive cycle shows an advantage for
the cycle with ultracapacitor system installed. It provides the desired results for
Reproduced with permission of the copyright owner. Further reproduction prohibited without permission.

89
the system and validates the installation of the ultracapacitor system reducing the
stress placed on the battery system and increasing the overall vehicle ranges.
Simulation. SetupCYC CBDBUS
20
15
10key ontraceelevation
Current Procedure Oetcriptlon:
Data source: Nigel Ouk. West Virginia Universiv
I Data confirmation:
I NtJtes: Central Business District test cyde tor buses.
T
0.5
-.0 .5
100 200 300 400 500 600time (sec)
|Spced/BevBÜon vs Time ^
fofvonablesU Parametric Study
Variable 1 H igh # Points
14543
Venable 2I C - !| IP 3
varebie j
Figure 5.4: ADVISOR Central Business District Bus Route Drive CycleSimulation Setup
Reproduced with permission of the copyright owner. Further reproduction prohibited without permission.

90
20cyc_mph_rmpha
a-10
100 300200 400 5001.01
ess soc histcn
cn' 0.99cn
0.98100 300200 400 500
S. 0.5
&10 100 300200 400 500
pb_pwr_out_r
I3000 100 200 400 500 60
Figure 5.5 (a): ADVISOR Output Battery System Central Business District BusRoute Drive Cycle
Reproduced with permission of the copyright owner. Further reproduction prohibited without permission.

91
20cyc_mph_rmpha
15
a-10
100 200 500300 400400
ess current200
S -200
-400100 200 300 500400
ess_pwr_out_ro
Q -0 30 3
0 100 200 500300 60400450
pb_voltage® 400C71
sp 350
CL 300
250100 200 300 500400
Figure 5.5 (b): ADVISOR Output Battery System Central Business District BusRoute Drive Cycle
Reproduced with permission of the copyright owner. Further reproduction prohibited without permission.

92
cyc_mph_rmpha
g-10
400100 200 300 500 60
ess_pwr_oiit_aO
Q.cncn
100 200 400300 500 60
cncn
100 200 400300 500 604000
3000ss 2000cn
1000 distance
0 100 200 400300 500 60
Figure 5.5 (c): ADVISOR Output Battery System Central Business District BusRoute Drive Cycle
Reproduced with permission of the copyright owner. Further reproduction prohibited without permission.

93
5x10
1.5
PbPh
1
0.5
0
-0.5
1100 200 300 400 500 600
Figure 5.5 (d): ADVISOR Output Battery System Central Business District BusRoute Drive Cycle
Reproduced with permission of the copyright owner. Further reproduction prohibited without permission.

94
x101.5
Pb— - — Ph
0.5
1 L200 220 240 260 280 300
Figure 5.5 (e): ADVISOR Output Battery System Central Business District BusRoute Drive Cycle
Reproduced with permission of the copyright owner. Further reproduction prohibited without permission.

95
20
10
eye mph r mpFa -
200100 300 500 BOO400
ess soc histCD
g 0.98CDCDCD
0.96100 200 300 500 600400
Oc 10' 100 200 300 500 600400
pb pwr out r ess max pwr apply
0 100 200 500300 400 600
Figure 5.6 (a): ADVISOR Output Battery and Ultracapacitor Systems Central Business District Bus Route Drive Cycle
Reproduced with permission of the copyright owner. Further reproduction prohibited without permission.

96
2D
g-10
n rITTT
eye mph r mpfTa “
100 200 300 500 600500ess
0
100 200 400 500300 BOO
200
100 200 300 400 500 600
CJ-200
-4000 200100 300 400 500 600
Figure 5.6 (b): ADVISOR Output Battery and Ultracapacitor Systems Central Business District Bus Route Drive Cycle
Reproduced with permission of the copyright owner. Further reproduction prohibited without permission.

97
2D
| - 10
500
eye mph r mpfia "
300 400 500 GOO
200
LbA/YVW\fYvWvW ]100 200 BOO300 400 500
3B4voeb
g 3B3.5
100 200 300 400 BOO500
voec
I 400
3002001000 300 400 BOO500
Figure 5.6 (c): ADVISOR Output Battery and Ultracapacitor Systems Central Business District Bus Route Drive Cycle
Reproduced with permission of the copyright owner. Further reproduction prohibited without permission.

98
K ID”
CO pb_pwr_out_a
Q_
a 10 100 400 BOO200 300 500
Pb
CL
0( 10 100 400200 BOO300 500
Pc
uCL
0( 10 100 400200 BOO300 500
C73
(JO)
0 100 400 BOO200 300 500
Figure 5.6 (d): ADVISOR Output Battery and Ultracapacitor Systems Central Business District Bus Route Drive Cycle
Reproduced with permission of the copyright owner. Further reproduction prohibited without permission.

99
,5X 101-5
PbPcPhPL
0.5
-0.5
600500400300100 200
Figure 5.6 (e): ADVISOR Output Battery and Ultracapacitor Systems Central Business District Bus Route Drive Cycle
Reproduced with permission of the copyright owner. Further reproduction prohibited without permission.

100
X 101
0.8 PbPcPh0.6
0.4
0.2
0
- 0.2
-0.4
- 0.6
- 0.8
1 --------------- 1----------------1----------------1_________1_________I_________ I_________ I---------------1_________ I_________200 210 220 230 240 250 260 270 280 290 300
Figure 5.6 (f): ADVISOR Output Battery and Ultracapacitor Systems Central Business District Bus Route Drive Cycle
Reproduced with permission of the copyright owner. Further reproduction prohibited without permission.

101
5.3 Conclusions
The results o f the desired energy storage system with the ultracapacitors and
the batteries produced reasonable results based on the data. The results
produced were consistent with what was expected for the DC/DC control system.
The modifications to ADVISOR required to fully verify the calculations for this
was not completed as a part of the scope of this research, in lieu of focusing on
the actual system to be installed in the H2 Fuel Hybrid Bus as a result of
available funding.
The results fo r the directly connected control system yielded the expected
outcome. The ADVISOR simulations after modifications to the block diagrams
yield the expected results for the system accounting for the operational
constraints. ADVISOR has been proven to be an effect tool in modeling and
simulating the performance of hybrid electric vehicles. The overall use of the
program is relatively straight forward along with the required modifications to the
energy storage system. The use of ultracapacitors in the energy storage system
modeling is new to the ADVISOR program. However, ultracapacitors can be
effectively modeled in the energy storage system o f ADVISOR.
Actual field simulations are recommended to further validate the models used
in this research, the combination of batteries and ultracapacitors with DC-DC
converter control is the preferred method for development of hybrid electric
vehicles. The DOE funding for the H2 Fuel Hybrid Bus was not available to
install the optimal DC-DC converter control. However, installing the
Reproduced with permission of the copyright owner. Further reproduction prohibited without permission.

102
ultracapacitor system in the direct connection method produces favorable results
for the system. This connection shows the ultracapacitor system eliminates the
stress on the battery system, increases the vehicle range and reduces fuel usage
with the hydrogen engine system. There are limitations with this connection
method that are not present with the DC-DC converter control. This is a viable
solution for hybrid electric vehicles. Actual road testing of the H2 Fuel Hybrid
Bus was not conducted based on the installation time frame for the energy
storage system but will be conducted in the future.
Reproduced with permission of the copyright owner. Further reproduction prohibited without permission.

APPENDIX
MAXWELL TECHNOLOGIES INC PC 2500 DATA SHEET
103
Reproduced with permission of the copyright owner. Further reproduction prohibited without permission.

104
PC2500 Ultracapacitor Data Sheet
Capacitance F .IO%/»25* 2500Series Resislance (2S*C); OC mohms -20%r*20% 1.0
'00 Hz inohms 0.6Voltage; continuous opetaling V 2.5
peak V 2.7Rated Current" A ' 400DgnenskMGUkeüyeixxionhü ; mm l61it8tSs61SVVaight _____________ _______9 _______ 725
Temperature' Operating •c -20 to 60Storage *c -40 to 65
Leakage Current (altar 72 hrs) milliamps 6Notes:' cacod w r e n ) s l^ .^ ^ c fc w ra n tM p c a k irw a n ta n a o u s p o iw e r ' Dovioo can wAhsand short drcut current if kepc wiMn opoia ling tenipflfalus ’ Suady su» casa lempMattite
PC2S00 Power vs Ouralion; Discharge Bo 112 wAage Lite vs. Average Tetnpetahire-Vdlage1600 j 1201400 25*<
100I 890 £ 600 !
400200
o40 35*C
40i 45*CPafcimunca VS. Température
ESB CapKMwioe6.0 - 3000
205.0 - 2500
65-C- 2000
3.0 2.3 2.4 Z 5 2 .6Average Cpetaling Voltage
2.7
- - 1000 &2.0 —
O pe ra t< iim ife o lin u lra fapac4n r isatndKir>oHhe«»«ragel«rTipetatL4a end voRtge.
500
0.0 • tncydHigappiicalona. use Oa* average voeage over OmmSiteoparaBng cytSe to «Mtrrnirw He.• In Otckup «ppeeatorn. wM 0>e conlirtuou» vciugv to detamiina m.
Reproduced with permission of the copyright owner. Further reproduction prohibited without permission.

APPENDIX II
ADVISOR SOLVE CURRENT FILE ADDED FOR ULTRACAPACITOR
SYSTEM DIRECT CONNECTION INSTALLATION
105
Reproduced with permission of the copyright owner. Further reproduction prohibited without permission.

106
function y=soive_current(x)
%soive the current of battery and ultracapacitor Vocb=x(1);Rb=x(2);Vocc=x(3);Rc=x(4);P=x(5);
%equations: (1) P=Vocb*lb+Vocc*lc-ib'^2*Rb-lc'^2*Rc; % (2) V=Vocc-lc*Rc=Vocb-lb*Rb
%finai expression %a1 *lb''2+b1 *!b+c1 =0 x1=(Vocc-Vocb)/Rc; y1=Rb/Rc;
a1=Rb+y1^2*Rc;b1 =-Vocb-y1 *Vocc+2*x1 *y1 *Rc;c1 =P-Vocc*x1 +x1 2*Rc;!b=(-b1 -sqrt(b1 2-4*a1 *c1 ))/(2*a1 );
x1 =(Vocc-Vocb)/Rc; y1 =Rb/Rc;
%a2*lb'^2+b2*ib+c2=0x2=(Vocb-Vocc)/Rc; y2=Rc/Rb;a2=Rc+y2^2*Rb;b2=-Vocc-y2*Vocb+2*x2*y2*Rb;c2=P-Vocb*x2+x2'^2*Rb;Ic=(-b2-sqrt(b2''2-4*a2*c2))/(2*a2);
l=lb+ic; y=[!b, Ic];
Reproduced with permission of the copyright owner. Further reproduction prohibited without permission.

REFERENCES
[1] Akbaba, Mehmet, “Energy Conservation by Using Energy Efficient Electric Motors” Elsevier Science Ltd, Applied Energy 64, 1999, pp. 149-158.
[2] Baghzouz, Y., J. Fiene, J. Van Dam, L. Shi, E. Wilkinson, R. Boehm, “Modifications to a Hydrogen/Electric Hybrid Bus ' American Institute of Aeronautics and Astronautics Inc AAA-2000-2857, 2000, pp 1-8.
[3] Burden, Richard L. and J. Douglas Faires, “Numerical Analysis”,PWS Publishing Company, US, 1993, pp. 259-261.
[4] Bertonlino, Jon D., Ruth E. MasDougall and Kitty L. Rodden, “Charge Management Systems for Electric and Hybrid Electric Vehicle Battery Packs- Lab Testing to Evaluate Cycle Life Improvement” Society of Automotive Engineers, Inc. 1999-01-2911, 1999, pp. 1-11.
[5] Cheiky, Mike C., Len G. Danczyk and Robert L. Scheffler, “Zinc-Air Powered Electric Vehicle Systems Integration Issues” Society of Automotive Engineers, Inc. 910249, 1991, pp. 93-100.
[6] Chen, Zheng, “High Pulse Power System Through Engineering Battery-Capacitor Combination” American Institute of Aeronautics and Astronautics Inc. AAA-2000-2935, 2000, pp. 752-755.
[7] Chicurel, Ricardo, “A Compromise Solution for Energy Recovery in Vehicle Braking” Elsevier Science Ltd, Energy 24, 1999, pp. 1029-1034.
[8] Cuddy, Matthew, “A Comparison of Modeled and Measured Energy Use in Hybrid Electric Vehicles” National Renewable Energy Laboratories NREL/TP-473-7444, Golden CO, 1995, pp. 1-8.
[9] Dickinson, Blake E., D. Swan and T. Lalk, “Comparison of Advanced Battery Technologies for Electric Vehicles” Society of Automotive Engineers, Inc. 1999-01-2908, 1993, pp. 1-11
[10] Electrosource, Inc., “Battery Handbook”, Horizon C2M Batteries, 1999, pp. 1-27
107
Reproduced with permission of the copyright owner. Further reproduction prohibited without permission.

108
[11] Fellini, Ryan and Nestor Michelena, Panos Papalambros and Michael Sasena, “Optimal Design of Automotive Hybrid Powertrain Systems” Department of Mechanical Engineering & Applied Mechanices, University of Michigan, Ann Arbor, Michigan, 1999, pp. 1-6.
[12] Faggioli, Eugenio, P. Rena, V. Danel, X. Andrieu, R. Mallant and H.Kahlen, “Supercapacitors for the Energy Management of Electric Vehicles” Elsevier Science Ltd, Journal of Power Sources, 1999, pp. 261-269.
[13] Gao, Yimin, Liping Chen and Mehrdad Ehsani, "Investigation of the Effectiveness of Regenerative Braking for EV and HEV” Society of Automotive Engineers, Inc. 1999-01-2910, 1999, pp. 1-8.
[14] Gilbert, Alan T. and Richard Gubb, “Natural Gas Hybrid Electric Bus”Society o f Automotive Engineers, Inc. 910248, 1991, pp. 79-91.
[15] Glenn, John H., “Ultracapacitors Store Energy in a Hybrid Electric Vehicle” John H. Glenn Research Center, Cleveland, OH, NASA Tech Briefs, 2000, pp 63-64.
[16] Guzzella, Lino, Alois Amstuz, "CAE Tools for Quasi-Static Modeling and Optimization of Hybrid Powertrains” IEEE Transactions on Vehicular Technology, November 1999, pp. 1762-1769.
[17] Hart, Daniel W., “Introduction to Power Electronics”, Prentice Hall, New York, NY, 1996, pp. 186-195.
[18] Hawker Energy Products, Inc., 1999, Hawker Gensis Specifications.
[19] Johnson, Valerie and Matthew Keyser, “Testing, Analysis and Validation of a Hawker Gensis Lead Acid Battery Model in ADVISOR” Center for Transportation Technologies and Systems National Renewable Energy Laboratory, March 1999, pp. 1-15.
[20] Marr, W. W., R. R. Sekar and M. C. Ahiheim, “Analysis o f a Diesel-Electric Hybrid Urban Bus System” Society of Automotive Engineers, Inc.931796, 1996, pp. 57-61.
[21] Marr, W. W., W. J. Walsh and P. C. Symons, “Modeling Battery Performance in Electric Vehicle Applications” Energy Conversation Management Vol. 33, No. 9, 1992, pp. 843-847
[22] Maxwell Technologies, May 1999, “General Sizing App Note 5-99”Maxwell Technologies website, www.powercache.com
Reproduced with permission of the copyright owner. Further reproduction prohibited without permission.

109
[23] McBroom, Scott T. and Jahan F. Eftekhar, “Analysis For A Four-Wheel Propane-Electric Parallel Hybrid Vehcile” Society of Automotive Engineers 1999-01-2907, 1999, pp. 1-9.
[24] Merkle, Matthew Alan, “Variable Bus Voltage Modeling fo r Series Hybrid Electric Vehicle Simulation” Master’s Thesis, Virgina Tech, 1997.
[25] Rennels, Kenneth, K. Reid and J. Walin, “High Performance Electric Vehicles” Society o f Automotive Engineers, Inc. 199-01-2908, 1999, pp. 1-9.
[26] Senger, Randall Donn, “Validation of ADVISOR as a Simulation Tool for a Series Hybrid Electrical Vehicle Using the Virginia Tech FutureCar Lumina” Master’s Thesis, Virgina Tech, September 1997.
[27] Vermillion, Len, “A Bus with a Conscience” Product Design and Development (PDD), www.pddnet.com. May 1998, pp.1-3.
[28] Wipke, Keith B. and Matthen R. Cuddy, “ADVISOR 2.1: A User-Friendly Advanced Powertrain Simulation Using a Combined Backward/Forward Approach” IEEE Transactions on Vehicular Technology Vol. 48, No. 6, November 1999, pp. 1751-1761.
[29] Wipke, Keith B. and Matthen R. Cuddy, “Using and Advanced Vehicle Simulator (ADVISOR) to Guide Hybrid Vehicle Propulsion System Development” National Renewable Energy Laboratory, Golden, CO, 1997,pp. 1-6.
Reproduced with permission of the copyright owner. Further reproduction prohibited without permission.

VITA
Graduate College University of Nevada, Las Vegas
Steven L. Pay, P.E.
Address:1208 Padre Serra Lane Las Vegas, NV 89134
Degrees:Associate of Arts, Engineering Science, December 1993 Montgomery Community College, Rockville, MD
Bachelor of Science, Electrical Engineering, May 1994 University o f Nevada, Las Vegas, Las Vegas, NV
Thesis Title: Hybrid Electric Vehicle Regenerative-Braking Using Ultracapacitors
Thesis Examination Committee:Chairperson, Dr. Yahia Baghzouz, Ph.D., P.E.Committee Member, Dr. Sharham Latifi, Ph. D., P.E.Committee Member, Dr. Eugene McGaugh, Ph.D.Graduate Faculty Representative, Dr. Rohan Delpatadu, Ph.D.
110
Reproduced with permission of the copyright owner. Further reproduction prohibited without permission.