hwhuplqdwlrqri$ufklh¶v tortuosity factor from stoneley
TRANSCRIPT

International Journal of Science and Engineering Applications
Volume 10-Issue 08, 107 - 110, 2021, ISSN:- 2319 - 7560
www.ijsea.com 107
Determination of Archie’s Tortuosity Factor from
Stoneley Waves in Carbonate Reservoirs
Keyvan Khayer
Shahrood University of
Technology
Shahrood, Iran
Adel Shirazy
Amirkabir University of
Technology
Tehran, Iran
Aref Shirazi
Amirkabir University of
Technology
Tehran, Iran
Abdolhamid Ansari
Yazd University
Yazd, Iran
Hamed Nazerian
University of Catania
Catania, Italy
Ardeshir Hezarkhani
Amirkabir University of
Technology
Tehran, Iran
Abstract: One of the fundamental equations in calculate the saturation of fluid in hydrocarbon reservoirs is the Archie’s equation. In
addition to the parameters measured by well logging such as porosity and resistivity, there are others parameters that called Archie’s
coefficients. Archie provides constant values for this coefficient base on experimental core’s data, accordance with saturation formula
in sandstone. In carbonate reservoirs nevertheless the sandstone reservoirs, high heterogeneity, variety in lithology and texture, shape
and distribution of pores, due to this coefficient is not constant. So, variation of tortuosity as a coefficient that depends on the way
correlation between pores, is high and considering a constant value due to error in calculation of fluid saturation. In this study, with the
stoneley waves measured from DSI tools and required calculation, the value of tortuosity coefficient calculated continuously in well
no.10 Darkhovin field. The regression of calculated values with the core data is 83.16 percent, that showed this method is useable for
calculation the tortuosity.
Keywords: Archie’s equation, tortuosity, DSI tool, Stoneley waves.
1. INTRODUCTION Geological surveys, which include geophysical and
geochemical methods and remote sensing, are widely used [1-
13]. One of these applications is using in carbonate reservoirs.
One of the most important parameters in reservoir, is fluid
saturation [14-17] which can be studied by geophysical
methods and well-logging [18, 19]. Several formulas are
given for saturation calculation. The fundamental equation
provides by Archi. In his formula, addition the parameters that
measured from well logging such as the resistivity and
porosity, there are three parameters called Archie’s coefficient
(equation1)
F=
(1)
where F is formation factor, m is cementation coefficient, is
tortuosity coefficient and is porosity.
Archie provided constant values for this coefficient base on
core analysis and correlating them with saturation formula
defined for sandstone. In carbonate rocks, unlike sandstone
rocks, the high degree of heterogeneity, variety of lithology
and texture, pores shape and their distribution due to have
large variety. So variation of tortuosity coefficient, which
depends on the way of pores connection and form of relevant
conduits, is high and considering a constant value of this
parameter as done in sandstone reservoirs cause large error in
fluid saturation calculation. There are direct and indirect
methods for determining this coefficient. Direct method and
in direct method such as core’s experimental and NMR
logging respectively. Another method is using the DSI
logging. With this method can determining tortuosity and
permeability by less cost and time. An acoustic waveforms
contain valuable information. With used the Stoneley wave
can provide relation for calculating the permeability and
tortuosity.
Quantitative modeling by resonbeaum(1974),Schmitt and
Bouchon(1984) [20], and by Schmitt et al.(1988)[21] supports
the conclusion that attenuation increases with permeability
and with pore fluid mobility; i.e., attenuation decrease as pore
fluid viscosity increase. Resonbaum based his finding on
synthetic acoustic signals covering a wide range of
frequencies. Hornbyetai. (1989), Tang and Cheng (1988) [22],
and Giiler and Toksoz (1987) [23] have studied the
propagation of Stoneley wave across borehole fractures. Beri
and et.al (2000) [24] proposed equation that by using it, can
calculated the Stoneley slowness in nonpermeable zone. Al-
adani and Barati (2003) [25], studied the effect of
permeability on Stoneley slowness. They presented Stoneley
slowness in around the borehole is divided in to stoneley
slowness in nonpermeable and permeable zones. Hadavand
and Moradzadeh (2007) [26] used Al-adany’s method in
sandstone reservoir. They showed this method in carbonate
and sandstone reservoirs is useable. Mosalman Nejad (2008)
compared the permeability that obtained from Stoneley
waves, with permeability from NMR logging and showed that
the result of Stoneley waves is more similarities with cores
analysis. Sun and et al. in 2012 studied the full spectrum of
sonic waves and examining permeability associated with each
type of sonic waves. They found that changed in the speed
and extent of slowness in Stoneley wave is more appropriate
with permeability. Guan and et al. (2013) [27] investigated

International Journal of Science and Engineering Applications
Volume 10-Issue 08, 107 - 110, 2021, ISSN:- 2319 - 7560
www.ijsea.com 108
Stoneley waves in pore water saturated and obtained a
continuous log that showed the permeability changes in
around of the borehole.
In this study by using Stoneley slowness and shear waves
from DSI tools, the tortuosity has calculated as a continuous
log around the borehole [25].
It is worth mentioning that in addition to all studies on
mineral and organic resources, in any study can be discussed
the beauties of the area and the discussion of geotourism [28].
2. METHODOLOGY At low frequency the Stonely mode become the tube wave
and propagates as a piston-like compression of the borehole.
When the borehole crosses permeable zones or permeable
fractures, some fluid movement occurs between the borehole
and the formation. this results in some energy loss, hence
attenuation and a slowing down of the wave, hence increased
Stoneley wave slowness (Brie 2000) [24]. The elastic
slowness of a Stoneley wave at low frequencies in an elastic
formation (non-permeability) is calculated using the
expression in equation 2:
(2)
is the slowness in nonpermeable zone
is the bulk density of the rock
is the borehole fluid(mud)slowness.
is the density mud
is the shear slowness of the rock
The difference between and indicates a fluid
mobility indicator.
By cross plotting versus
across non permeable
zones, the slope of the straight line is and y-intercept is
. There is one condition on such linear fit, that all data
on cross plot should be above or on the fit line. With
determining
, can calculate the around the
borehole, according to the equation 3.
∆tst =∆tst-el+∆tp (3)
The ratio of
represent the way pores media that called
permeability index. Permeability index is not permeability
estimation, but it is an index of fluid movement in porous
media around the borehole. Since fluid movement is a
function of pore throat distribution, pore shape and pore size,
the Stoneley permeability index is a tortuosity index only.
3. DATA ACQUISTION In this study target is determination the tortuosity factor by
Stoneley waves in one of the carbonate reservoirs in Southern
Iran. This reservoir is located at the oil field with limestone
lithology that belongs of construction to the flat plateau
Arabic. Fahlian formation is the reservoir rock of this field
that has about 500 meters carbonate deposit. In this present
study well, Resistivity, SGR, NPHI and Sonic logs were
acquired. That showed in figure 1. Clay type cannot be
identified accurately due to very low concentration of clay in
the zone of study. Illite was assumed as main clay in this
formation.
Figure1. Petrophysical logs in well study
4. RESULTS AND DISCUSSION Using the Stoneley wave that measured by DSI tool for
calculate the tortuosity factor in this well according above
Descriptions.
First with petrophysical logs determined the non-permeable
zone. A cutoff 5% was applied to total porosity. Only those
zones were taken in to consideration to predict a non-
permeable zone that had total porosity less than 5%. The zone
that considers as non-permeable zone, locate at 3330 m to
3360m. In this zone the total porosity is less than 5% and the
main lithology is limestone. Cross plotting versus
in this zone, showed in figure 2. The slope of straight
line is 2.9 that represent the and 39000 is refer to
.
Figure2. Cross plot
versus
Now with obtained can calculating the for
around the borehole. Then with constitute ratio
,
determining the permeability index that can consider as
tortuosity factor. In figure 3 and table 1 showed the log of
variation of tortuosity continuously and the point that shown
on log is tortuosity calculated from core’s experimental.

International Journal of Science and Engineering Applications
Volume 10-Issue 08, 107 - 110, 2021, ISSN:- 2319 - 7560
www.ijsea.com 109
Table1. Comparison between calculated tortuosity and core’s
tortuosity
Figure3. Variation of tortuosity continuously and the point that shown upon the log is tortuosity calculated from core’s analysis
The regression of calculated values with the core data is 83.16
percent (figure 4), that showed this method is useable for
calculation the tortuosity.
Figure4. comparison between calculated tortuosity and
tortuosity from core’s experimental.
5. CONCLUSIONS High heterogeneity, variety in lithology and texture, shape
and distribution of pores, in carbonate reservoirs due to
tortuosity not constant and has variation. The method that
usually used for determined this coefficient is core’s
experimental. This method is very time consuming and not
economically and could not give a continuous log. In this
study using the Stoneley wave that measured by DSI tool to
calculate the tortuosity coefficient as a continuous log. Results
represent to good performance of this method. The regression
of calculated values with the core data is 83.16 percent, so this
method is useable for calculation the tortuosity. With
continuous tortuosity log can calculate water saturation with
higher accuracy when use Archie’s low.
6. REFERENCES [1] Adel, S., Z. Mansour, and H. Ardeshir,
Geochemical behavior investigation based on k-
means and artificial neural network prediction for
titanium and zinc, Kivi region, Iran. Известия
Томского политехнического университета.
Инжиниринг георесурсов, 2021. 332(3): p. 113-
125.
[2] Alahgholi, S., A. Shirazy, and A. Shirazi,
Geostatistical studies and anomalous elements
detection, Bardaskan Area, Iran. Open Journal of
Geology, 2018. 8(7): p. 697-710.
[3] Shirazi, A., et al., Remote sensing studies for
mapping of iron oxide regions, South of Kerman,
Iran. International Journal of Science and
Engineering Applications, 2018. 7(4): p. 45-51.
[4] Shirazi, A., et al., Exploration Geochemistry Data-
Application for Cu Anomaly Separation Based On
Classical and Modern Statistical Methods in South
Khorasan, Iran. International Journal of Science
and Engineering Applications, 2018. 7: p. 39-44.
[5] Shirazi, A., A. Shirazy, and J. Karami, Remote
sensing to identify copper alterations and promising
regions, Sarbishe, South Khorasan, Iran.
International Journal of Geology and Earth
Sciences, 2018. 4(2): p. 36-52.
Core’s tortuosity Calculated tortuosity
0.98879 0.993344 0.97546 0.976247
0.9823 0.985364
0.98011 0.973307
1 1.001924
1 1.005411

International Journal of Science and Engineering Applications
Volume 10-Issue 08, 107 - 110, 2021, ISSN:- 2319 - 7560
www.ijsea.com 110
[6] Shirazi, A., et al., Geostatistics studies and
geochemical modeling based on core data, sheytoor
iron deposit, Iran. Journal of Geological Resource
and Engineering, 2018. 6: p. 124-133.
[7] Shirazy, A., et al., Application of Remote Sensing in
Earth Sciences–A Review.
[8] Shirazy, A., et al., Geochemical and geostatistical
studies for estimating gold grade in tarq prospect
area by k-means clustering method. Open Journal of
Geology, 2019. 9(6): p. 306-326.
[9] Shirazy, A., et al., Exploratory Remote Sensing
Studies to Determine the Mineralization Zones
around the Zarshuran Gold Mine. International
Journal of Science and Engineering Applications,
2018. 7(9): p. 274-279.
[10] Shirazy, A., et al., Geophysical study: Estimation of
deposit depth using gravimetric data and Euler
method (Jalalabad iron mine, kerman province of
IRAN). Open Journal of Geology, 2021.
[11] Shirazy, A., M. Ziaii, and A. Hezarkhani,
Geochemical Behavior Investigation Based on K-
means and Artificial Neural Network Prediction for
Copper, in Kivi region, Ardabil province, IRAN.
Iranian Journal of Mining Engineering, 2020.
14(45): p. 96-112.
[12] Shirazy, A., et al., Geostatistical and remote sensing
studies to identify high metallogenic potential
regions in the Kivi area of Iran. Minerals, 2020.
10(10): p. 869.
[13] Hearst, J.R. and P.H. Nelson, Well logging for
physical properties. 1985.
[14] Doodran, R.J., et al., Minimalization of Ash from
Iranian Gilsonite by Froth Flotation. Journal of
Minerals and Materials Characterization and
Engineering, 2020. 9(1): p. 1-13.
[15] Khakmardan, S., et al., Evaluation of Chromite
Recovery from Shaking Table Tailings by Magnetic
Separation Method. Open Journal of Geology,
2020. 10(12): p. 1153-1163.
[16] Khakmardan, S., et al., Copper oxide ore leaching
ability and cementation behavior, mesgaran deposit
in Iran. Open Journal of Geology, 2018. 8(09): p.
841.
[17] Shirazi, A., et al., Introducing a software for
innovative neuro-fuzzy clustering method named
NFCMR. Global Journal of Computer Sciences:
theory and research, 2018. 8(2): p. 62-69.
[18] Galiuk, H.S., K. Saadat, and E. Kazemzadeh. A case
study of saturation exponent measurement on some
carbonate cores at full reservoir conditions. in
International Symposium of the Society of Core
Analysts held in Austin, Texas, USA. 2011.
[19] Darling, T., Well logging and formation evaluation.
2005: Elsevier.
[20] Schmitt, D. and M. Bouchon, Full wave synthetic
acoustic logs in saturated porous media, in SEG
Technical Program Expanded Abstracts 1984.
1984, Society of Exploration Geophysicists. p. 17-
20.
[21] Schmitt, D.P., M. Bouchon, and G. Bonnet, Full-
wave synthetic acoustic logs in radially semiinfinite
saturated porous media. Geophysics, 1988. 53(6):
p. 807-823.
[22] Tang, X. and C.-H. Cheng, Fast inversion of
formation permeability from Stoneley wave logs
using a simplified Biot-Rosenbaum model.
Geophysics, 1996. 61(3): p. 639-645.
[23] Güler, S., et al., The detection of geological fault
lines in radar images, in Pattern Recognition
Theory and Applications. 1987, Springer. p. 193-
201.
[24] Brie, A., et al., Quantitative formation permeability
evaluation from Stoneley waves. SPE Reservoir
Evaluation & Engineering, 2000. 3(02): p. 109-117.
[25] Al-Adani, N. and A. Barati. New hydraulic unit
permeability approach with DSI. in SPWLA 9th
formation evaluation symposium, Japan. 2003.
[26] Khayyer, K., A. Moradzadeh, and B. Tokhmchi, A
New Approach to Estimate Cementation Exponent
in Carbonate Reservoirs. Journal of Analytical and
Numerical Methods in Mining Engineering, 2020.
9(21): p. 1-7.
[27] Guan, W., H. Hu, and Z. Wang, Permeability
inversion from low‐frequency seismoelectric logs in
fluid‐saturated porous formations. Geophysical
Prospecting, 2013. 61(1): p. 120-133.
[28] Shirazi, A. and A. Shirazy, Introducing Geotourism
Attractions in Toroud Village, Semnan Province,
Iran. International Journal of Science and
Engineering Applications, 2020. 9(6): p. 79-86.

International Journal of Science and Engineering Applications Volume 10-Issue 08, 111 - 113, 2021, ISSN:- 2319 - 7560
www.ijsea.com 111
E-glass Coated Fibers in Novel Composite System for Constructional Applications
Shouresh Safaei Ankara, Turkey
Abstract: Concrete is one of the most applicable materials in construction. But it needs to reinforce with several reinforcement materials especially high performance fibers such as glass fibers to improve its properties. Among glass fibers, E-glass fiber has lower price but degrade in alkaline cementitious matrix. In this investigation for prohibition of E-glass fibers degradation along with better adhesion of E-glass fibers to cementitious matrix a doubled layer composite coating has been used. The first layer is a polysiloxane which it's permeability to water is too low so prevent alkali attack on E-glass fiber. The second layer is polyvinyl acetate (PVAC) having polar groups of acetate, produce calcium acetate in cementitious matrix, which stick firmly to cement. PVAC in alkaline solution can produce polyvinyl alcohol (PVA) which is again sticky to cement. This composite coating applied on E-glass fibers and used to reinforce concrete. The durability of coated fibers was investigated by alkaline stability test and SEM images. Meanwhile for studying adhesion of fibers to concrete pull out characteristics of coated fibers been investigated and compared with bare E-glass reinforced concrete. Keywords: polymer; composites; fibers; E-glass fibers; cement
1. INTRODUCTION Cement-based materials are characterized by very good properties in compression but their brittle manner of failure under tensile or impact load was a limiting factor for their applicability range from the very beginnings [1,2]. Fiber reinforcement is a traditional and effective method how to improve the toughness and durability of cement based products [3,4]. The addition of a relatively small quantity of short random fibers to a cementitious matrix is known to improve the mechanical response of the resulting product, commonly known as a fiber reinforced cementitious composite (FRCC) [5]. The performance of FRCC depends on many factors, such as fiber material properties [6](e.g., fiber strength, stiffness, and Poisson’s ratio), fiber geometry [7] (smooth, end hooked, crimped, twisted), fiber Volume content, matrix properties [8,9] (e.g., matrix strength [10], stiffness, Poisson’s ratio), and interface properties [11](adhesion, frictional, and mechanical bond) [12-13].glass-fiber reinforced cement composites are frequently used as building materials in the world. Their enhanced tensile properties and durability make them suitable for thin constructional materials in both plain and complex shapes. Despite the glass fiber being considered as a reinforcement of cementitious materials for several decades, the limitation of structural applications still remains. Enhanced mainly by a high percentage of zirconia (ZrO2 >15%byweight) content, the alkali resistant glass fiber (ARG) was designed to reinforce cementitious matrices which have been used in construction and civil engineering since the late 1960s. Previously, many attempts have been made to modify either matrix or fiber by adding fillers or by surface coatings of polymer and carbon layers. Both durability in alkali environment and economic considerations have restricted the commercial use of these materials. The multifunctional coating on the glass fiber surface is responsible to enable the manufacture and performance of the fibers, particularly the surface protection, abrasion resistance, retention of strength, and interphase formation of composites. In this study E-glass fiber have been coated by two coating layers that the inner layer was Poly(dimethylsiloxane-co-alkylmethylsiloxane) which it's permeability to water is too low so prevent alkali attack on Eglass fiber and the outer layer was polyvinyl
acetate (PVAC) which having polar groups of acetate, produce calcium acetate in cementitious matrix, which stick firmly to cement. PVAC in alkaline solution can produce polyvinyl alcohol (PVA) which is again sticky to cement. This composite coating applied on E-glass fibers and used to reinforce concrete. The durability of coated fibers was investigated by alkaline stability test and SEM images. Meanwhile for studying adhesion of fibers to concrete pull out characteristics of coated fibers been investigated and compared with bare E-glass reinforced concrete.
2. EXPERIMENTAL
2.1. Materials and Methods
E-glass roving supplied from Diba Co., with 2400 dtex. Poly (dimethylsiloxane-co-alkylmethylsiloxane) that was used as inner layer was purchased from Aldrich Co. polyvinyl acetate (PVAC) was purchased from Aldrich Co and used as outer layer. The cement was Portland cement type II. Sand/cement ratio was 3 and water/cement ratio (W/C) =0.4. To remove any chemicals on the fibers surface, the fibers were dipped in a solution consist of 20 gr sodium dichromate and 35mm water and 1 lit of concentrated sulfuric acid for 24 hours and then washed with aqueous solution of sodium bicarbonate then rinsed with deionized water. After this process the rinsed fibers were dried in vacuum oven for 4 hours. Concentrated solution of Poly (dimethyl siloxane-co-alkyl methyl siloxane) in toluene was prepared and the fibers were dipped in it for 30 minutes .the coated fibers were dried in vacuum oven at 80˚C for1h. The resultant fibers were dipped in a concentrated solution of PVAC in acetone. These fibers that have been coated by Poly (dimethylsiloxane-co-alkylmethylsiloxane) and PVAC, were dried in a vacuum oven at 30˚C for 1h. Then the coated fibers were added to concrete samples and durability and adhesion of them were investigated. For investigation alkaline durability of glass fibers, the alkaline bath was prepared according to ACI 440 (American Concrete Institute) and the durability of fibers was investigated after 28 days [12].
International Journal of Science and Engineering Applications Volume 10-Issue 08, 111 - 113, 2021, ISSN:- 2319 - 7560
3. RESULT AND DISCUSSION
3.1. Durability of fibers
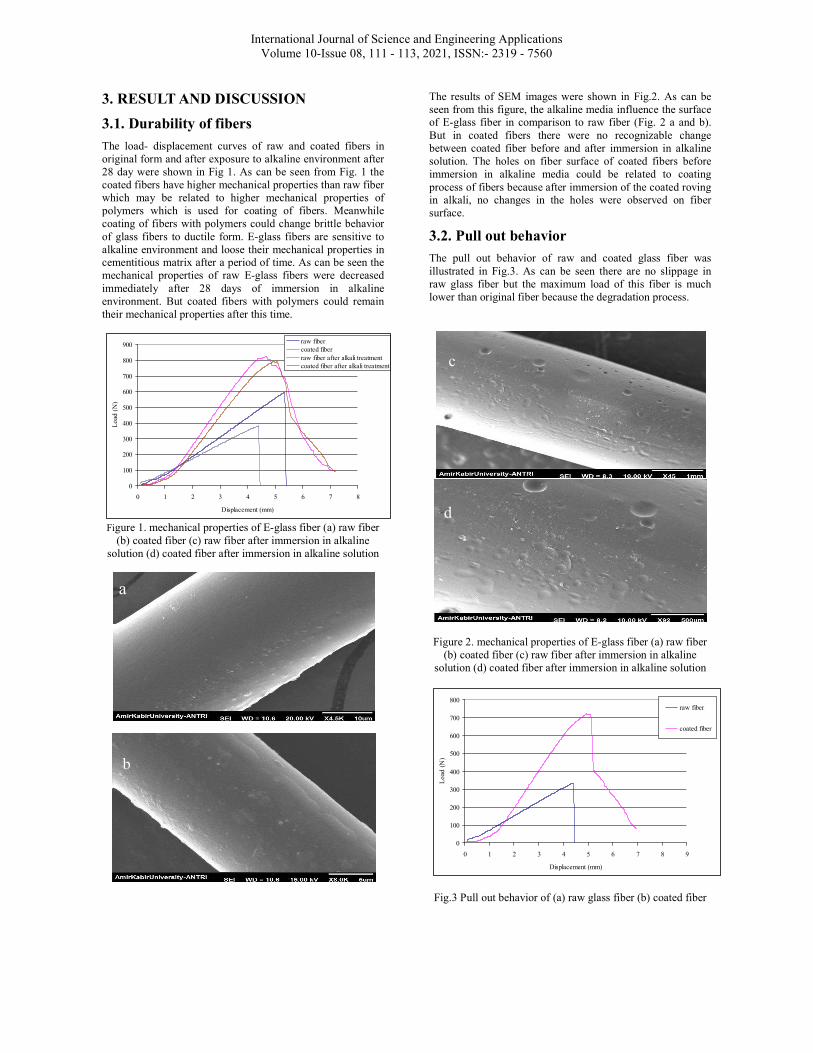
The load- displacement curves of raw and coated fibers in original form and after exposure to alkaline environment after 28 day were shown in Fig 1. As can be seen from Fig. 1 the coated fibers have higher mechanical properties than raw fiber which may be related to higher mechanical properties of polymers which is used for coating of fibers. Meanwhile coating of fibers with polymers could change brittle behavior of glass fibers to ductile form. E-glass fibers are sensitive to alkaline environment and loose their mechanical properties in cementitious matrix after a period of time. As can be seen the mechanical properties of raw E-glass fibers were decreased immediately after 28 days of immersion in alkaline environment. But coated fibers with polymers could remain their mechanical properties after this time.
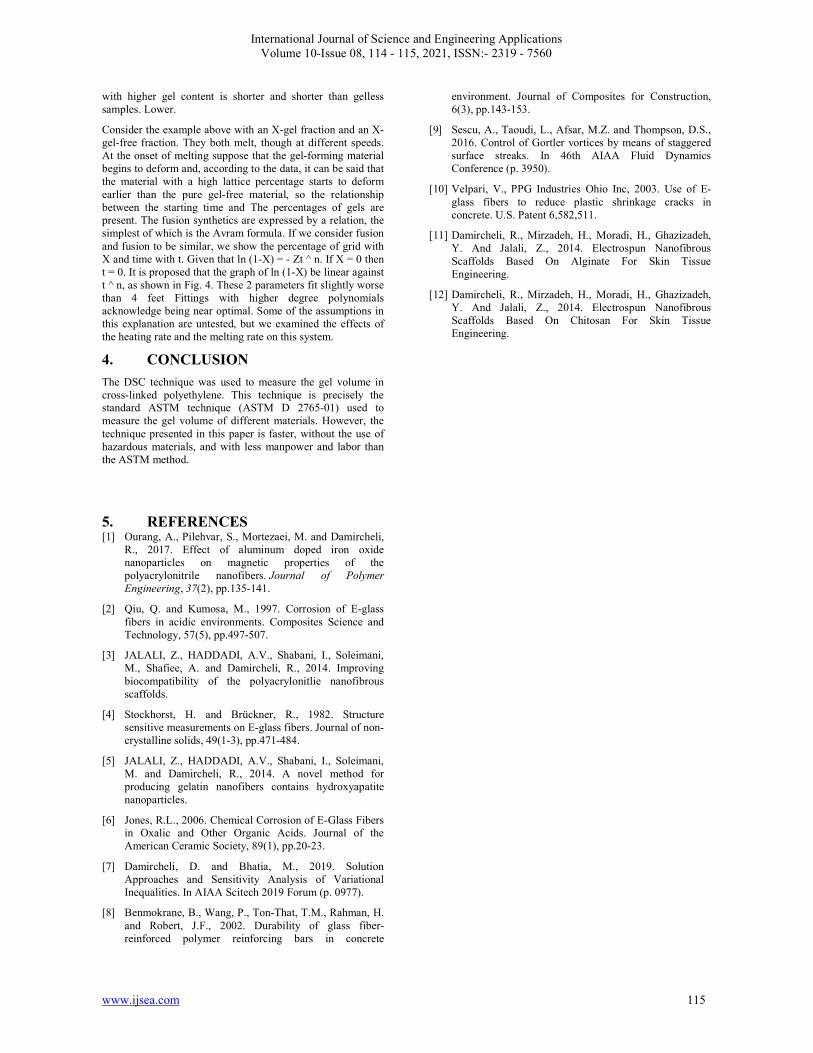
The results of SEM images were shown in Fig.2. As can be seen from this figure, the alkaline media influence the surface of E-glass fiber in comparison to raw fiber (Fig. 2 a and b). But in coated fibers there were no recognizable change between coated fiber before and after immersion in alkaline solution. The holes on fiber surface of coated fibers before immersion in alkaline media could be related to coating process of fibers because after immersion of the coated roving in alkali, no changes in the holes were observed on fiber surface.
3.2. Pull out behavior
The pull out behavior of raw and coated glass fiber was illustrated in Fig.3. As can be seen there are no slippage in raw glass fiber but the maximum load of this fiber is much lower than original fiber because the degradation process.
Figure 1. mechanical properties of E-glass fiber (a) raw fiber (b) coated fiber (c) raw fiber after immersion in alkaline
solution (d) coated fiber after immersion in alkaline solution
Figure 2. mechanical properties of E-glass fiber (a) raw fiber (b) coated fiber (c) raw fiber after immersion in alkaline
solution (d) coated fiber after immersion in alkaline solution
Fig.3 Pull out behavior of (a) raw glass fiber (b) coated fiber
0
100
200
300
400
500
600
700
800
900
0 1 2 3 4 5 6 7 8
Displacement (mm)
Loa
d (N
)
raw fibercoated fiberraw fiber after alkali treatmentcoated fiber after alkali treatment
0
100
200
300
400
500
600
700
800
0 1 2 3 4 5 6 7 8 9
Displacement (mm)
Loa
d (N
)
raw fiber
coated fiber
a
b
c
d

International Journal of Science and Engineering Applications Volume 10-Issue 08, 111 - 113, 2021, ISSN:- 2319 - 7560
www.ijsea.com 113
4. CONCLUSION
In this research E-glass fiber have been coated by two polymeric layers. The inner layer was Poly(dimethylsiloxane-co-alkylmethylsiloxane) with low permeability to water which prevent alkali attack on E-glass fiber and the outer layer was polyvinyl acetate (PVAC) which having polar groups of acetate, produce calcium acetate in cementitious matrix, which stick firmly to cement. PVAC in alkaline solution can produce polyvinyl alcohol (PVA) which is again sticky to cement. These polymeric coatings applied on E-glass fibers and used to reinforce concrete. The durability of coated fibers was investigated by alkaline stability test and SEM images. Meanwhile for studying adhesion of fibers to concrete pull out characteristics of coated fibers been investigated and compared with bare E-glass reinforced concrete. The results show that the mechanical properties of coated fiber and durability of these fibers are much more than raw E-glass fibers. Therefore pull out behavior of coated fibers after 28 days remaining in cementitious matrix is reasonable and proper.
5. REFERENCES [1] Damircheli, D. and Bhatia, M., 2019. Solution
Approaches and Sensitivity Analysis of Variational Inequalities. In AIAA Scitech 2019 Forum (p. 0977).
[2] Qiu, Q. and Kumosa, M., 1997. Corrosion of E-glass fibers in acidic environments. Composites Science and Technology, 57(5), pp.497-507.
[3] Sescu, A., Taoudi, L., Afsar, M.Z. and Thompson, D.S., 2016. Control of Gortler vortices by means of staggered surface streaks. In 46th AIAA Fluid Dynamics Conference (p. 3950).
[4] DAMIRCHELI, R., MIRZADEH, H., MORADI, H., GHAZIZADEH, Y. and JALALI, Z., 2014. ELECTROSPUN NANOFIBROUS SCAFFOLDS BASED ON CHITOSAN FOR SKIN TISSUE ENGINEERING.
[5] Stockhorst, H. and Brückner, R., 1982. Structure sensitive measurements on E-glass fibers. Journal of non-crystalline solids, 49(1-3), pp.471-484.
[6] JALALI, Z., HADDADI, A.V., Shabani, I., Soleimani, M., Shafiee, A. and Damircheli, R., 2014. Improving biocompatibility of the polyacrylonitlie nanofibrous scaffolds.
[7] Jones, R.L., 2006. Chemical Corrosion of E‐Glass Fibers in Oxalic and Other Organic Acids. Journal of the American Ceramic Society, 89(1), pp.20-23.
[8] Ourang, A., Pilehvar, S., Mortezaei, M. and Damircheli, R., 2017. Effect of aluminum doped iron oxide nanoparticles on magnetic properties of the polyacrylonitrile nanofibers. Journal of Polymer Engineering, 37(2), pp.135-141.
[9] DAMIRCHELI, R., MIRZADEH, H., MORADI, H., GHAZIZADEH, Y. and JALALI, Z., 2014. ELECTROSPUN NANOFIBROUS SCAFFOLDS BASED ON ALGINATE FOR SKIN TISSUE ENGINEERING.
[10] Benmokrane, B., Wang, P., Ton-That, T.M., Rahman, H. and Robert, J.F., 2002. Durability of glass fiber-reinforced polymer reinforcing bars in concrete
environment. Journal of Composites for Construction, 6(3), pp.143-153.
[11] Karbhari, V.M., Murphy, K. and Zhang, S., 2002. Effect of concrete based alkali solutions on short-term durability of E-glass/vinylester composites. Journal of Composite materials, 36(17), pp.2101-2121.
[12] JALALI, Z., HADDADI, A.V., Shabani, I., Soleimani, M. and Damircheli, R., 2014. A novel method for producing gelatin nanofibers contains hydroxyapatite nanoparticles.
[13] Velpari, V., PPG Industries Ohio Inc, 2003. Use of E-glass fibers to reduce plastic shrinkage cracks in concrete. U.S. Patent 6,582,511.

International Journal of Science and Engineering Applications Volume 10-Issue 08, 114 - 115, 2021, ISSN:- 2319 - 7560
www.ijsea.com 114
Polyethylene Gel Volume Fraction (Cross-linked Percentage) Measurement Using DSC Technique
Shouresh Safaei Ankara, Turkey
Abstract: In this paper, the measurement of the crosslinking percentage (gel volume fraction) of polyethylene materials by using DSC technique is presented. To obtain the calibration curve, the networked samples of ASTMD 2765-01 corresponding to the curves of pure melt samples at the start of the reaction were used. The resulting calibration curve was used to predict the percentage of polyethylene cross-linked in a continuous process, and these results were compared with those obtained from D 2765-01, which resulted in excellent agreement between the two states. This technique is faster and cheaper and requires less raw material, the product does not release any harmful substances and is ASTM correct. Keywords: PEO; DSC; gel; cross-link; gel-volume
1. INTRODUCTION They usually obtain a volume fraction of polyethylene using ASTM D 2765-01, which involves storing polyethylene powders in Deca Hydro naphthalene for 6 hours or in xylene for 12 hours, which requires a large workforce and industry. It takes a lot of time, besides they require the use of hazardous materials [1,2,3,4]. In this paper, the volume measurement of polyethylene gel has a filler with the proposed method. This method uses the DSC to find peaks of molten polyethylene at the time of use[5,6,7]. he does. The difference between the peaks of the pure melt sample at the onset of the reaction and the peaks of the melt sample can give the percent of crosslinking[8]. The DSC sample is easily prepared by scraping a thin layer of material and punching the sample between the punch papers. There is no need to grind or puncture the specimen so preparation of the specimen is not time-consuming[9,10,11]. The specimen is placed in a DSC-specific aluminum foil and there is no need for another specimen container. And the sample is heated at a constant heating rate, which is the program defined in the DSC. It is time[12].
2. EXPERIMENTAL
The practical part is straightforward and easy to apply to standard DSC practical structures. This section includes sample preparation and partial analysis of results. Samples of industrial pipe-filled polyethylene are made from Mercury Plastic Inc. These samples were irradiated in an RDI accelerator. The Vixan constant acceleration parameters were used for polyethylene samples. The third sample is three times .... Then 7 different irradiated samples corresponding to 7 samples having different percentages of grids were constructed. Then each sample was divided into two parts and one part was used for ASTM and the other part for DSC. Each sample examined with ASTM requires 30 meshes to be fabricated and sampled. The percentage of grid depends on the number of times the sample is irradiated and the higher the sample is under the radiation . The DSC performed 2–4 times for each sample. High-lattice samples yielded 0.06 min start time and the lowest percentage yielded 0.01 min. Table 1 shows the results. Indicates deviations in ASTM with low and high start times. Note that for low deflection samples it is, for example, 0.03 minutes, which is probably due to the use of small specimens. Fall. The above data can show that the deviation from the time of reaction onset for the sample that appears to have a
constant grid percentage has a maximum of 0.036 min and a mean of 0.022 min deviation, indicating a maximum error of 10% and a mean of 6% and the onset time It is low in percentage. In all the relationships mentioned for the above relationship, the non-networked samples have not been investigated. The start time for the thermal transition for zero grid percentages was obtained from three data points for minimum percent grid and extrapolated from this second order polynomial graph. In calibration and number deviation were 0.0007 and 0.00011 min, respectively. They are not operational because they are not zero percent and for percentages below 0.5 percent.
3. RESULT AND DISCUSSION
As long as there is a direct relationship between the percent of mesh and the melting start time, the calibration curve of the mean start time versus the average gel volume is plotted with the available information. The usual results are shown in Figure 2. Several different sentences were used to fit the data, the lowest order being 3 for mathematical citizenship. The full diagram shown in Figure 2 relates to the data in Table 1 and to their fit with the degree 3 equation. Next is the polyethylene filler data, when this data is plotted, the volume of the gel varies with the start time. The upper curve is higher. This effect was corrected by gel and non-gel samples, probably due to additives such as fillers, which is given in Table 2 and Curve 2. Fit with grade 3 citizenship in these samples is also a good approximation for Find the volume of the gel in the samples. This process is reproducible until two batches of gels match. The diagram for combining the two curves is shown in Fig. 3, along with the fit parameters. This graph contains errors related to the measurement of gel volume in ASTM technique and the time associated with it. Description of Experiment Theory: The DSC data show that the heat required for melting to transition from solid to liquid is constant at 4% and does not show a one-to-one citizenship of the gel volume. The temperatures that occur during this transition are usually in the X + Y degree. After decreasing the start time with the gel volume is a traditional effect, which is obtained by comparing the maximum flow temperature with the field start time ratio (Fig. 1). It is lower in gel percentage than in non-gel samples and shows a nonlinear relationship with the starting time. The shape of the heat versus time graph for samples
International Journal of Science and Engineering Applications Volume 10-Issue 08, 114 - 115, 2021, ISSN:- 2319 - 7560
www.ijsea.com 115
with higher gel content is shorter and shorter than gelless samples. Lower. Consider the example above with an X-gel fraction and an X-gel-free fraction. They both melt, though at different speeds. At the onset of melting suppose that the gel-forming material begins to deform and, according to the data, it can be said that the material with a high lattice percentage starts to deform earlier than the pure gel-free material, so the relationship between the starting time and The percentages of gels are present. The fusion synthetics are expressed by a relation, the simplest of which is the Avram formula. If we consider fusion and fusion to be similar, we show the percentage of grid with X and time with t. Given that ln (1-X) = - Zt ^ n. If X = 0 then t = 0. It is proposed that the graph of ln (1-X) be linear against t ^ n, as shown in Fig. 4. These 2 parameters fit slightly worse than 4 feet Fittings with higher degree polynomials acknowledge being near optimal. Some of the assumptions in this explanation are untested, but we examined the effects of the heating rate and the melting rate on this system.
4. CONCLUSION
The DSC technique was used to measure the gel volume in cross-linked polyethylene. This technique is precisely the standard ASTM technique (ASTM D 2765-01) used to measure the gel volume of different materials. However, the technique presented in this paper is faster, without the use of hazardous materials, and with less manpower and labor than the ASTM method.
5. REFERENCES [1] Ourang, A., Pilehvar, S., Mortezaei, M. and Damircheli,
R., 2017. Effect of aluminum doped iron oxide nanoparticles on magnetic properties of the polyacrylonitrile nanofibers. Journal of Polymer Engineering, 37(2), pp.135-141.
[2] Qiu, Q. and Kumosa, M., 1997. Corrosion of E-glass fibers in acidic environments. Composites Science and Technology, 57(5), pp.497-507.
[3] JALALI, Z., HADDADI, A.V., Shabani, I., Soleimani, M., Shafiee, A. and Damircheli, R., 2014. Improving biocompatibility of the polyacrylonitlie nanofibrous scaffolds.
[4] Stockhorst, H. and Brückner, R., 1982. Structure sensitive measurements on E-glass fibers. Journal of non-crystalline solids, 49(1-3), pp.471-484.
[5] JALALI, Z., HADDADI, A.V., Shabani, I., Soleimani, M. and Damircheli, R., 2014. A novel method for producing gelatin nanofibers contains hydroxyapatite nanoparticles.
[6] Jones, R.L., 2006. Chemical Corrosion of E‐Glass Fibers in Oxalic and Other Organic Acids. Journal of the American Ceramic Society, 89(1), pp.20-23.
[7] Damircheli, D. and Bhatia, M., 2019. Solution Approaches and Sensitivity Analysis of Variational Inequalities. In AIAA Scitech 2019 Forum (p. 0977).
[8] Benmokrane, B., Wang, P., Ton-That, T.M., Rahman, H. and Robert, J.F., 2002. Durability of glass fiber-reinforced polymer reinforcing bars in concrete
environment. Journal of Composites for Construction, 6(3), pp.143-153.
[9] Sescu, A., Taoudi, L., Afsar, M.Z. and Thompson, D.S., 2016. Control of Gortler vortices by means of staggered surface streaks. In 46th AIAA Fluid Dynamics Conference (p. 3950).
[10] Velpari, V., PPG Industries Ohio Inc, 2003. Use of E-glass fibers to reduce plastic shrinkage cracks in concrete. U.S. Patent 6,582,511.
[11] Damircheli, R., Mirzadeh, H., Moradi, H., Ghazizadeh, Y. And Jalali, Z., 2014. Electrospun Nanofibrous Scaffolds Based On Alginate For Skin Tissue Engineering.
[12] Damircheli, R., Mirzadeh, H., Moradi, H., Ghazizadeh, Y. And Jalali, Z., 2014. Electrospun Nanofibrous Scaffolds Based On Chitosan For Skin Tissue Engineering.