hvpa project summary
TRANSCRIPT
HVPA Project ‐ Design for Six Sigma/CQI Initiative Project Description The goal of the CQI team was to design a process to monitor care management activities and build into the process manageable goals. The project utilized an EHR to track weekly activities of care managers. The intended outcome was to increase efficiency of care management activities in order to meet goals.
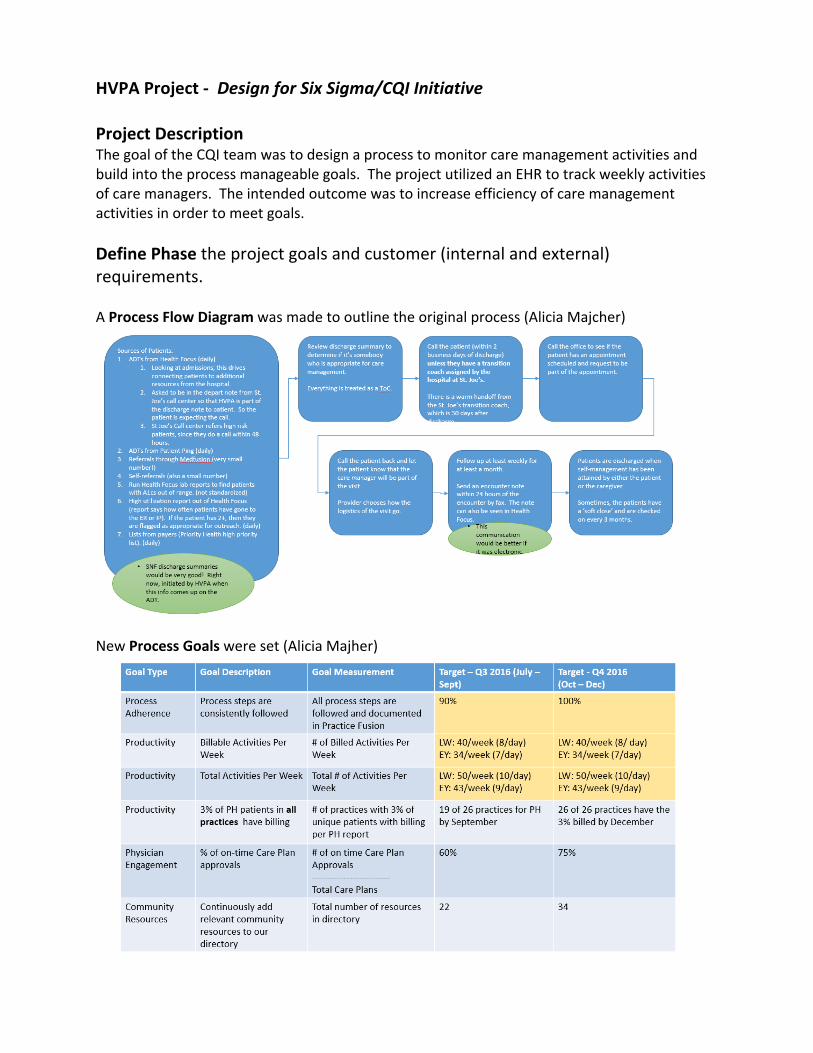
Define Phase the project goals and customer (internal and external) requirements. A Process Flow Diagram was made to outline the original process (Alicia Majcher)
New Process Goals were set (Alicia Majher)

Measure Phase and determine customer needs and specifications; benchmark competitors and industry. Six Sigma Tools ‐ 5 Whys (sample only, 5 Whys document specific to this process not shown). Problem Statement: Customers are unhappy because they are being shipped products that don’t meet their specifications. 1. Why are customers being shipped bad products? – Because manufacturing built the products to a specification that is different from what the customer and the sales person agreed to. 2. Why did manufacturing build the products to a different specification than that of sales? – Because the sales person expedites work on the shop floor by calling the head of manufacturing directly to begin work. An error happened when the specifications were being communicated or written down. 3. Why does the sales person call the head of manufacturing directly to start work instead of following the procedure established in the company? – Because the “start work” form requires the sales director’s approval before work can begin and slows the manufacturing process (or stops it when the director is out of the office). 4. Why does the form contain an approval for the sales director? – Because the sales director needs to be continually updated on sales for discussions with the CEO. In this case only four Whys were required to find out that a non‐value added signature authority is helping to cause a process breakdown.

Pivot Tables and Histograms were used to track weekly case manager activities to determine where most time and energy was spent and identify ways to maximize care manager efficiency.
Over a period of 15 weeks, the weekly activities reported increased from a baseline of 60/week to an average of 120/week (100% improvement!)

Analyze Phase the process options to meet the customer needs. Fishbone Diagram A fishbone diagram was used to identify root causes for care managers not meeting target goals.
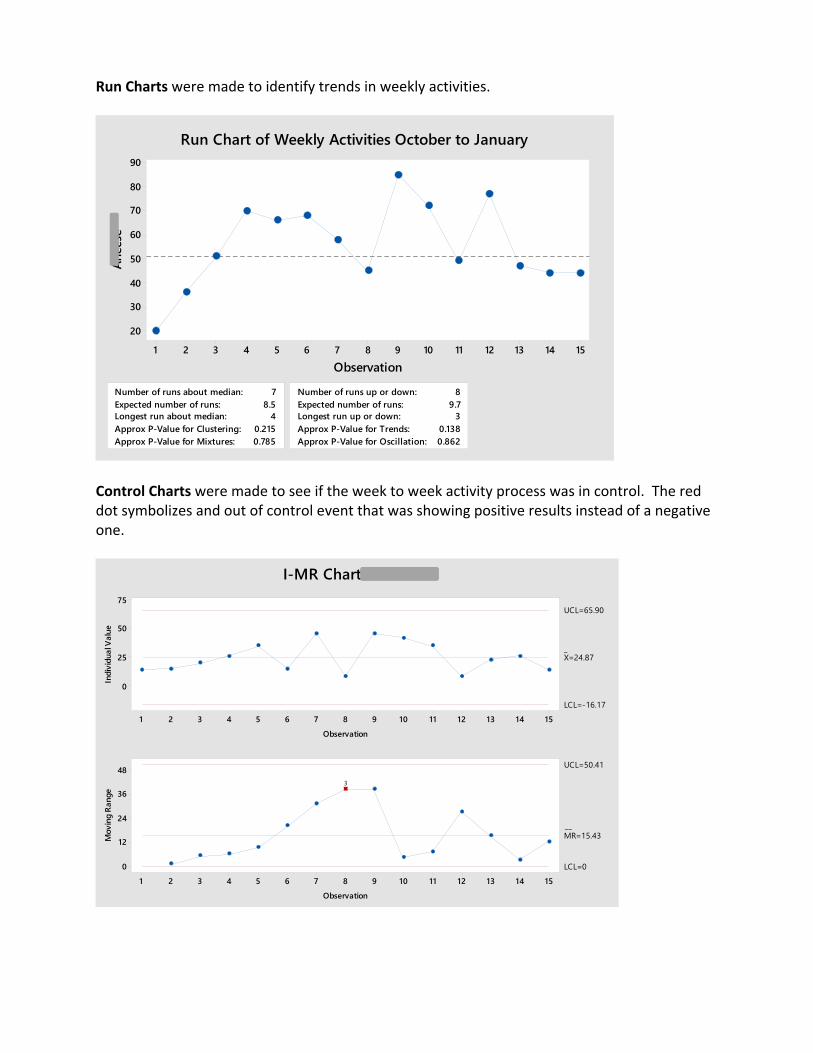
Run Charts were made to identify trends in weekly activities.
Control Charts were made to see if the week to week activity process was in control. The red dot symbolizes and out of control event that was showing positive results instead of a negative one.
151413121110987654321
90
80
70
60
50
40
30
20
Number of runs about median: 7Expected number of runs: 8.5Longest run about median: 4Approx P-Value for Clustering: 0.215Approx P-Value for Mixtures: 0.785
Number of runs up or down: 8Expected number of runs: 9.7Longest run up or down: 3Approx P-Value for Trends: 0.138Approx P-Value for Oscillation: 0.862
Observation
Anee
seRun Chart of Weekly Activities October to January
151413121110987654321
75
50
25
0
Observation
Indiv
idual
Value
_X=24.87
UCL=65.90
LCL=-16.17
151413121110987654321
48
36
24
12
0
Observation
Mov
ing R
ange
__MR=15.43
UCL=50.41
LCL=0
3
I-MR Chart of Warda

The table below highlighted weekly actives for one care manager from October to November. The table clearly showed where most time was spent and where gaps in care existed.
The table below was used to chart patient progression to see if there were gaps in the care management process for individual patients. Ideally each patient receives activities in most columns.
d

Design (detailed) the process to meet the customer needs. An updated Process Flow Diagram was made (Alicia Majcher)
Optimize the process/product is optimized according to CTQs A Pareto Analysis was used to identify critical areas where case manager time was spent in order to focus on areas where the most gain could be made (CTQ’s).

Verify the design performance and ability to meet customer needs. After 15 weeks of activity tracking, recorded activities increased by about 100%! Care managers could see how their time was spent and share best practices in areas of strength‐‐and sought out best practices from others in areas of weakness. Activity output was measured against process goals and gaps were identified to use for future process improvement.