hungary - helio...
TRANSCRIPT
Energy and
a reportgabo
HUNGARY
Sustainable Energy Watch2002 Report
Sustainable Development in Hungary
t by Gábor Taká[email protected]
The Hungarian Parliament decided to ratify the Kyoto Protocol in July 2002. Theelaboration of related legislation, policies and measures will be speeded up by theEuropean Union's requirements and the pressure from business - interested in JointImplementation projects and missions trading.

HELIO – Hungary 2/22
Table of contents
∙ Executive Summary p. 3
∙ Introduction p. 4
∙ General Discussion of the Country p. 5
▶Other Energy-Related Developments
∙ The Eight Indicators p. 7
▶Indicator 1: Per Capita Energy Sector Carbon Dioxide Emissions
▶Indicator 2: Most Significant Energy-Related Local Pollutants: SO2
▶Indicator 3: Households with Access to Electricity
▶Indicator 4: Investment in Clean Energy (a proxy for employment)
▶Indicator 5: Energy Resilience: Energy Trade
▶Indicator 6: Burden of Energy Investments
▶Indicator 7: Energy Productivity (energy consumption/GDP)
▶Indicator 8: Renewable Energy Deployment
∙ Presentation of the Country Star p. 20
∙ Conclusions p. 21
HELIO – Hungary 3/22
Executive Summary
In this first Sustainable Energy Watch (SEW) Report for Hungary, given the limited timeand data available, we calculated seven indicators out of eight.
Generally speaking except the access to electricity indicator Hungary performs quitepoorly based on the calculations. The main reasons can be summarised as follows:After 1989, Hungary went through significant structural changes: from a centrallyplanned economy and a one party system it became a functioning market economy and ademocratic country. But the heritage of the Soviet era, the rapid changes andprivatisation of the energy sector let to survive outdated opinions and kept the energysector’s role players driven by old – unsustainable – practice. Foreign investors, ownersof the privatised part of the Hungarian energy sector, don’t operate necessarily accordingto the priorities of the weak energy policy.
Awareness about climate change negotiations and the Kyoto Protocol (KP) is very low inHungary. Climate change being a complex problem is not on the political agenda at all.The Hungarian Parliament decided to ratify the KP in July 2002. The elaboration ofrelated legislation, policies and measures will likely take place quite slowly. The EuropeanUnion’s requirements and the pressure from business – interested in JointImplementation and Emission trading - can speed up the process a bit. The HungarianEnergy Office also plays an important role in shaping the legislation.
Legislation planned for the near future that might affect the SEW indicators:
• The market liberalisation by January 2003, from many points of view, but especially ifit will result in price increases.
• Elimination of cross subsidies and the elaboration of compensation schemes forvulnerable consumers at least as far as gas is concerned.
• The future of the development plan (Széchényi Plan) that slowly increased theamount of fund available for renewable energy sources (RES) and energy efficiency.
• Legislation of the district heating sector. If it is in favour of energy efficiency in thissector, 25-30 % energy saving could be achieved relatively easily.
• Legislation in favour of RES, and the willingness of foreign RES companies to invest inHungary.
• The MVM (Hungarian Electricity Works) could be privatised.
• The MOL (Hungarian Oil and Gas Co.) might sell its gas industry to the State.
• Exchange rate changes for EUR and USD as energy trade is counted in USD whileGDP is in HUF (Hungarian Forints or EUR).
HELIO – Hungary 4/22
Introduction
This is the first Sustainable Energy Watch Report for Hungary compiled by Gábor Takácsfrom Energy Club Hungary (www.energiaklub.hu). The report was produced in June andJuly of 2002.
As probably in most of the other countries working on SEW Reports, we faced difficultiesto find or calculate relevant and reliable data. We did our best to improve the accuracy ofdata and to clarify misunderstandings. Therefore we hope that instead of providing acollection of figures we provided a writing that can be a basis for further discussion anddebate on how to achieve sustainability in the Hungarian energy sector and of course onhow to do the measurement. Everybody is welcome to comment on this report andcontact the author.
Out of the eight indicators, seven were calculated and for five of them we have the 1990reference data. Unfortunately within the limited time we could not collect data calculatedon the same basis for the same year for the others and this results in the spreading offinal year from 1998 to 2000.Indicator 6 was not calculated, as we could not provide data that would at least roughlyreflect the required parameter.The biggest uncertainty is in the case of indicator 4: clean energy investments. We donot know data collected on private energy efficiency investments, and the investmentsgenerated by national and international funds are not clear.
Data on renewable energy was collected and calculated by Zoltan Vass (Energy Club),while Villő Lelkes (Energy Club) did the editing and language checks. For compiling thisreport the help and understanding of Peter Tulej from CTI and Helene Connor from SEWSecretariat were extremely helpful. The South African report done by Randall Spalding-Fecher helped a lot to understand the calculation and the way of discussing theindicators, providing a practical example in addition to the Manual compiled by the SEWSecretariat.All misleading or unclear discussions and errors are the fault of the author. Comments,suggestions and clarifications are more than welcome.
Contact: Gábor Takács [email protected] tel: 36-30-438-13-81
HELIO – Hungary 5/22
General Discussion of the Country
Hungary is located in the eastern part of Central Europe. It has 10,2 million inhabitantsliving on 93 000 km2. Its surface is rather flat as around half of the country’s territory isa plain, while there are no mountains higher than 1000 m. From a natural resourcespoint of view, Hungary is very poor. The only significant industrial mineral it has isbauxite. From an agricultural point of view, Hungary has excellent natural circumstances.From a regional development point of view, it is important to notice that ¼ of thepopulation is living in the capital (Budapest), which in itself reaches the EU's averagedevelopment level, while the rest of the country is far under it.
From the late 40s till 1988/89, Hungary was part of the Eastern, socialist block both fromeconomic and political point of views and had a centrally planed economy with a one-party political system. Hungary was a member of the Warsaw Pact and of the Council forMutual Economic Aid (COMECOM). After Hungary changed to a functioning marketeconomy and a democratic political system, it became a member of NATO and of theOECD. Hungary applied for EU membership in 1994 and the long accession negotiationswill shortly result in her full membership.
Due to the structural changes and rationalisation of the economy, the artificiallysignificant heavy industry almost disappeared (causing long-lasting regional problems),the role of service sector rapidly increased. A significant proportion of the country’sexport is produced by some multinationals operating within the country.
▶Other Energy–Related Developments
Hungary has decreasing natural reserves from non-renewable energy sources. Theimport dependency for energy is 70%. Within the total energy consumption, solid fuelsaccounts for around 15 %, oil around 30%, nuclear power for 13% and the majority ofthe rest is satisfied by natural gas.
Hungary’s total primary energy supply (TPES) fell back to 1042 PJ/year by 1994 from the1357 PJ/year peak of 1987, and has been stable at around 1050 PJ/year since then. It isimportant to note that despite the sharp decrease of industrial energy consumption, theresidential sector’s total energy consumption has been increasing, just like the totalelectricity consumption since 1995 (34 000 GWH/year)1.
After structural changes, the huge energy efficiency potential of the industry started tobe utilised under market pressure (e.g. between 1992-2000 70% industrial growth wasachieved with 10% additional energy consumption decrease!2 )
Between 1992 and 1997 a great part of the Hungarian energy sector was privatised.Many studies3 argue that the rapid privatisation was not managed and planned well.However there is an official energy policy, this is not updated and the legislation ofenergy sector is not necessarily in accordance with its principles, especially as far as
1 Villamos Energia Statisztikai évkönyv 2000 (Yearbook of Electricity Statistics 2000), MEH, Budapest, 2001
2 EU Enlargement Watch: The Role of Natural Gas in Europe, 2000, www. energiaklub.hu
3 Járosi,M- Pecz,E: EU csatlakozás és privatizáció (EU accession and privatisation), Püski, Budapest 2000,
HELIO – Hungary 6/22
environmental protection, security of supply and priorities issues are concerned. Due tothe level of privatisation and the preparation for market liberalisation, the Hungarianlegislation on gas4 5, electricity6 and district heating7 were in place quite early (we do notanalyse them here). Later these acts were changed89. To regulate the market, anindependent regulatory authority, the Hungarian Energy Office (MEH)10 was created. Thisis the most proactive and most developed regulatory authority in the region. The mainproblem with its operation is that the final pricing authority is the Ministry of EconomicAffairs, which makes political decisions. Quite controversial in the field of climate change, the MEH is the most proactive and wecan say the most environmentally-friendly governmental body.
The main issue of energy sector regulation nowadays is the elaboration of operationalrules for the electricity and natural gas sector in harmony with the EU and Hungarianmarket liberalisation plans. It is also crucial for RES promotion.
The EU accession process is quite controversial for the energy sector as well. It requiresmarket opening, elimination of cross subsidies, free market on one hand, RESpromotion11 on the other hand. The 12% share of RES is not an easy task to achieve forHungary. The mine – power plant integration (power plants have purchasing obligationsfor domestic solid fuel production), and the postponed shutdown of polluting solid fossilfuel combusting power plants hinder the changes in the energy sector towards a moresecure and more sustainable one.
The Paks Nuclear Power Plant (the only one in Hungary producing 40% of the electricity)is heavily lobbying for its lifetime extension and capacity increase. It would of coursedecrease the level of energy security due to very limited diversification and wouldincrease the risk level of nuclear catastrophe. Waste management costs and the cost offinal shutdown would also increase, while hindering the sustainable energy systemdevelopment.
The district heating sector, effecting ¼ of the population of Hungary, is the biggestproblem that no government has touched effectively, yet. It also will happen sometimesbefore the predicted EU accession.
4 1994 XLI Törvény a gázszolgáltatásról (XLI Act on Gas Distribution of 1994)
5 1997 XX Törvény az 1994 XLI Törvény módosításáról (XX Act of 1997 on Changes of the XLI Act of 1994)
6 1994 XLVIII Törvény a villamosenergia termeléséről, szállításáról és szolgáltatásáról (XLVIII Act of 1994 on
Electricity Production, Transportation and Distribution)
7 1990 évi LXXXVII törvény az árak megállapításáról (LXXXVII of 1990 Act on Pricing)
8 2001 évi CX törvény a villamosenergiáról (CX Act of 2001 on Electricity
9 1998 évi XVIII törvény a távhőszolgáltatásról (XVIII Act of 1998 on District Heating)
10 The homepage of the Hungarian Energy Office www.eh.gov.hu
11 2001/77/EC directive of the European Council on Renewables
HELIO – Hungary 7/22
The Eight Indicators
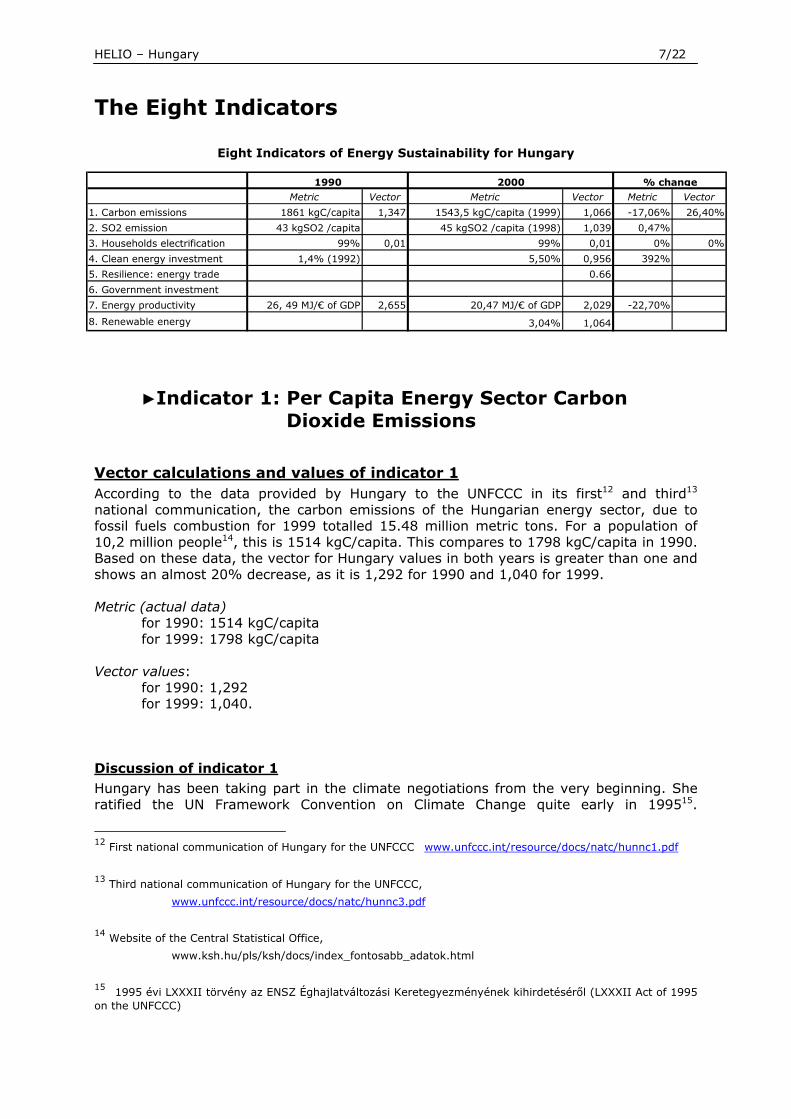
Eight Indicators of Energy Sustainability for Hungary
▶Indicator 1: Per Capita Energy Sector Carbon Dioxide Emissions
Vector calculations and values of indicator 1According to the data provided by Hungary to the UNFCCC in its first12 and third13
national communication, the carbon emissions of the Hungarian energy sector, due tofossil fuels combustion for 1999 totalled 15.48 million metric tons. For a population of10,2 million people14, this is 1514 kgC/capita. This compares to 1798 kgC/capita in 1990.Based on these data, the vector for Hungary values in both years is greater than one andshows an almost 20% decrease, as it is 1,292 for 1990 and 1,040 for 1999.
Metric (actual data) for 1990: 1514 kgC/capita for 1999: 1798 kgC/capita
Vector values: for 1990: 1,292 for 1999: 1,040.
Discussion of indicator 1Hungary has been taking part in the climate negotiations from the very beginning. Sheratified the UN Framework Convention on Climate Change quite early in 199515.
12 First national communication of Hungary for the UNFCCC www.unfccc.int/resource/docs/natc/hunnc1.pdf
13 Third national communication of Hungary for the UNFCCC,
www.unfccc.int/resource/docs/natc/hunnc3.pdf
14 Website of the Central Statistical Office,
www.ksh.hu/pls/ksh/docs/index_fontosabb_adatok.html
15 1995 évi LXXXII törvény az ENSZ Éghajlatváltozási Keretegyezményének kihirdetéséről (LXXXII Act of 1995on the UNFCCC)
Metric Vector Metric Vector Metric Vector
1. Carbon emissions 1861 kgC/capita 1,347 1543,5 kgC/capita (1999) 1,066 -17,06% 26,40%
2. SO2 emission 43 kgSO2 /capita 45 kgSO2 /capita (1998) 1,039 0,47%
3. Households electrification 99% 0,01 99% 0,01 0% 0%
4. Clean energy investment 1,4% (1992) 5,50% 0,956 392%
5. Resilience: energy trade 0.66
6. Government investment
7. Energy productivity 26, 49 MJ/€ of GDP 2,655 20,47 MJ/€ of GDP 2,029 -22,70%
8. Renewable energy 3,04% 1,064
1990 2000 % change

HELIO – Hungary 8/22
Hungary’s activity in the field of climate protection at both international and nationallevels has been fluctuating ever since. She did not sign the Kyoto Protocol, being the onlyin Europe apart from Iceland in this respect, and decided ratifying it on 16 July 2002.Climate change has just recently become a separate item in the official environmentalpolicy in the National Environmental Programs, especially in the second one, currentlyunder construction. The first step towards a complex climate change strategy was takenin 2000, when a Governmental decree on Hungary’s climate change strategy wasadopted16, and the implementation plan is under elaboration. Even though there were some energy efficiency -see below- and waste managementprograms initiated in the 90s, the fallback of the energy sector’s carbon emissions ismainly due to the structural changes in the Hungarian economy after the years oftransition, when the old, energy intensive, Soviet type industry collapsed.
Another important factor of the fallback of carbon emissions is the intensive spreading ofnatural gas both in residential and power sectors, replacing coal and lignite by the muchcleaner natural gas. Almost 70 % of the households are connected to the gas network17 ,satisfying 40% of the residential sector’s total energy demand. In the power sector, gasis used mainly in combined heat power plants, producing 20 % of the electricity. The roleof coal stayed stable at 30% (115 PJ in 2000) in electricity production, due to thelegislation that requires power plants to purchase domestic coal.
The promotion of RES seems to get a bigger emphasis: in the New Electricity Act (2001)the purchasing obligation of electricity produced by RES is well defined and in theoperative legislation the purchasing price is quite high. It is very important because therole of RES in Hungary’s energy supply is around 2,2 % including traditional firewoodcombustion.
It is important to note, that despite of the decreasing contribution of the energy sector toCO2 emissions, Hungary’s total GHG emissions almost went back to the 1990 level in2000 producing around 10% increase compared to the lowest emitting year (1994). Thisundesirable phenomenon is mainly due to other GHGs, the transport and the agriculturalsectors.
16 Kormányhatározat a klímavédelem magyarországi stratégiájáról 39. Határozatok Tára A Kormány
2206/2000/(IX.13) rendelete (Governmental decree No. 2206/2000 (IX.13) on the National Strategy ofClimate Protection)
17 Annual Report 2000, Association of Gas Distribution Companies

HELIO – Hungary 9/22
▶Indicator 2: Most Significant Energy-Related Local Pollutant: SO2
Vector value calculations and values of indicator 2Within the country’s SO2 emissions – that fell back significantly from 101 kg SO2 /capitain 1990 to 59 kg SO2 /capita in 1998 – the energy sector’s sulphur–dioxide emissionsshow some increase because the metric value increased from 43 kg SO2 /capita in 1990to 45 kg SO2 /capita in 1998.
Metric (actual data) for 1990: 43 kg SO2 /capita for 1999: 45 kg SO2 /capita
Vector value for 1998: 1.039
Discussion of energy related SO2 emissionsIt is important to note that the most hazardous, damaging, local pollutant is nuclearwaste that Hungary’s only nuclear power plant produces while satisfying 40% of thecountry’s electricity demand. All types of radioactive wastes are stored at the powerplant, as since 1993 Russia has rejected transporting it to its country and no depositpossibility has been built in Hungary.
From the many pollutants that the energy sector emits we chose sulphur-dioxide. Thereason is its unique place in the legislation. Hungary’s total SO2 emissions decreased in the 90’s by almost 40%, due to the abovementioned collapse of the polluting heavy industry, to the improved quality of vehiclesand to the fact that the households replaced other more polluting fuels with natural gas.Due to the slowly growing electricity demand, the mines-power plants integration (powerplants must buy domestic coal and lignite) and the increased usage of oil (18,6 PJ in1990, 43,1 PJ in 2000) the electricity sector’s SO2 emissions slowly increased. Thisprocess is slowed down by the intensive spreading of CHPs and the replacement of someoil power plants (PP) by gas turbines.
Since 1995, when a governmental decree on clear air was adopted18, the sulphuremissions legislation became stricter. The results are the renovation of power plants tomeet the requirements – it happened in most of the privatised (efficient, attractive forinvestors) PPs on one hand, and because of the growing amount of fines paid by theothers on the other hand. The Matra PP which is the second biggest SO2 emitter (99thousand tons in 2000) has done recently the sulphur retrofit, and has been operatingaccording to the legislation since then. The biggest polluter, Vértes PP (130 thousandtons of SO2 in 2000), was to be shut down in 2004 as it cannot meet environmentalrequirements and produces at high cost. Both PPs are run by the state-owned HungarianElectricity Works (MVM). The Vértes PP got 56 million EURs19 state subsidy and will getaround 1,8 EUR cents for every kWh totalling an additional 172 million EURs of subsidyduring its extended lifetime (10 years). The decision was clearly political, based on
18 Governmental decree No. 97/1995. (VIII.24.) of 1995
19 For all exchange rate calculations we used the Hungarian National Banks yearly average exchange rates.www.mnb.hu

HELIO – Hungary 10/22
unpublicised calculations, and also against the will of the Hungarian Privatisation andState Holding Company (ÁPV Rt) which is a shareholder in the MVM20. The Ministry ofEnvironment granted the power plant a promise for letting off its environmentalpunishments, this would clearly violate the polluter pay principle21, and also violateseconomic sustainability and postpones the transition to a less polluting sustainableenergy system.
Note for future Observer-Reporter:
Data: The latest version of Environmental Statistics contains data on 1990 and 1998 forthe latest. This was the peak SO2 emissions of the electricity sector. According to theYearbook of Electricity Statistics in 2000 the emissions of PPs started to decrease. Wecould not use this data – and chose 1998 – because the methodological differencesbetween the two sources were not clear. Transport sectors emissions are excluded. Follow-up on the state subsidy, and let off of punishments for Vértes PP and the otherhigh polluting power plants. Check and follow if the Hungarian practice on subsidies,liberalisation and competition are in accordance with the EU’s legislation. Follow theMVM’s attempts to extend its polluting power plants lifetime (nuclear PP, lignite and coalfired ones) even if it cause price increases, and of course hinders the spreading of RES.
20 Az MVM leszavazta az ÁPV Rt-t (The MVM voted against the ÁPV Rt) , Népszabadság, 04 May 2002,
21 Environmental Club of MVM, 20 June 2002, see www.vert.hu

HELIO – Hungary 11/22
▶Indicator 3: Households with Access to Electricity
Vector value calculations and valuesAccording to the Central Statistical Office in the last two years national census (in 1990and 2001), the questioners did not deal with access to electricity as in both years theytook it to be practically 100%. Based on this statement22 we took the percentage of thehouseholds that have access to electricity in both years for 99%, which results in 0,0100value for the vector.
Metric (actual data) for 1990: 99% for 2001: 99%
Vector value for 1990: 0,0100 for 2001: 0,0100
Discussion of indicator 3Back in the socialist era (before 1989), a ranch electrification program was initiated andresulted that even the remote and small (two- three houses) settlements got access toelectricity. The price of electricity was the same for everybody, and there was no capacitycharge (which could have been different based on pure cost reflecting pricing).In Hungarian statistics there are no categories for households with electricity. There aredata for dwellings (naturally not equal with the number of households), and data for thenumber of residential consumers of electricity. Both are slightly different from householdswith access to electricity category. This last data is much higher (4,7 million) than thenumber of households (4,05 million)23. The difference is the result of the fact that notonly households fall under the residential electricity tariff category and one householdcan have several electricity meters (in one dwelling, for the garage, for holiday house, fornight tariff). The reason for not taking access to electricity for 99% was data found in theYearbook of Regional Statistics 200024, that 1,6 % of the dwellings owned by localgovernments does not have any kind of comfort level. This 1% “discount” is clearly anassumption which does not effect the final value of the vector significantly.
Note for future Observer-ReporterHowever from a social point of view this level of electrification in Hungary seems verynice, it makes the diversification very hard, as well as the utilisation of local, renewableresources both from technical/financial and public acceptance point of view. In the futureit would be very useful to carry out a public poll on RES awareness and acceptance ofRES technologies. Another field of possible research is to study the Hungarian electricitysystem’s tolerance to RES input (now the base power plant’s proportion is quite high, sotaking that RES – especially solar and wind – technologies may produce altering output),thus the system/system operator might have problems to keep the desired voltage level.
22 Népszámlálás 1990, 2001, Adatfelvétel és feldolgozási összefoglaló ismertetése (Data Collection and Data
Processing Summary of National Census), KSH Budapest, 2002
23 Lakásstatisztika 2000, (Yearbook Statistics of Dwellings), kKSH Budapest 2001,
24 Regionális Statisztikai Évkönyv 2000, (Yearbook of Regional Statistics 2000), KSH Budapest 2001,

HELIO – Hungary 12/22
Another issue to be studied can be the electricity export- import right which coulddecrease this tension.

HELIO – Hungary 13/22
▶Indicator 4: Investment in Clean Energy (a proxy for employment)
Vector calculation of indicator 4Energy efficiency and renewable energy investments were for 1992 (the first yearavailable) 4,22 million 1992 ECU, and 34,5 million 2000 EUR for year 2000. These dataare to be compared with the total energy sector investment for 1992, which was 320million 1992 ECU and increased to 636,3 million 1999 EUR.
Metric (actual data) for 1992: 1,4% for 2000: 5,5%
Vector value for 2000: 0,956
Discussion of indicator 4The calculation of this vector is one of the most challenging which is due to the followingfacts. However, total energy sector investment data are available25, but the statesubsidies are not calculated into them. E.g. the above-mentioned 228 million EURsubsidy for 10 years for the Vértes PP, the instalments that the Paks Nuklear Power Plantpays to the Hungarian state on which there is no interest (!).The percentage of clean energy investments is increasing. New programs were initiatedto support these developments, but these are far less than what could utilise the hugeenergy efficiency potential of the Hungarian economy, and let's say there is almostnothing to promote the renewable potential. It is important to note the difficulties of collecting data that reflects the reality, as past,present and future subsidies or the lack of subsidy in case of RES makes the comparisonsdifficult. As it was mentioned in the introduction, after privatisation and before the strictregulation was in place there had not been any significant investment (like power plantshutdown, lifetime expansion or building a new big one). It is to happen in the followingyears.
It is even more difficult to gather the energy efficiency and renewable investments datathat are not directly subsidy related. We used state or internationally co-financedprograms to estimate the total investment into clean energy. As the first data availablewere those of 1992 for total energy sector investments, we calculated the cleaninvestments generated by subsidies for this year too, which were 4,22 million 1992 ECU.For clean energy investment calculations in year 1992 we have no data on RESinvestment, compared to 320 million 1992 ECU total energy sector investments. In thisyear the only fund for clean energy was the Energy Saving Credit Fund which became arevolving fund and was financed by the German Coal Aid.
In the year 2000, the main sources of clean energy investments were the following:- the Energy Saving Credit Fund generating 6,577 million 2000 EUR; - the Energy Saving Credit Program (1997); later the Energy Saving Program generating9,135 million 2000 EUR;
25 Based on the combined data of Statistical Yearbook of Hungary 2000, KSH 2001 Budapest; Vízgazdálkodási
adatok (Water management data) 1992-95, KSH Budapest 1996; Vízgazdálkodási adatok (Watermanagement data) 1997-2000, KSH 2001 Budapest

HELIO – Hungary 14/22
- and the Energy Efficiency Co-Financing Scheme generating 18,8 million 2000 EUR;totalling 34,512 million 2000 EUR investment into energy efficiency and renewables26. This is to be compared to the 636,28 million 2000 EUR 27.
Note to future Observer-reporterThe Hungarian development plan (Széchényi Plan) is to be monitored: the total credit tobe granted and the direct financial support, the items that it can be allocated to.Investment data should be collected and calculated on the same basis, for the sameyear. For this state subsidy should be carefully measured.
26 Calculation is based on data in Good Practices in Policies and Measures for Climate Change Mitigation (Draft),
Regional Environmental Center, 2002,
27 We used 1999 data as this was the latest available on the basis as it is for 1992, and based on theinvestment trends simply calculated as if investments in 2000 had been in real terms equal with 1999investments.

HELIO – Hungary 15/22
▶Indicator 5: Energy Resilience: Energy Trade
Value and calculation of the vector 5
Hungary is definitely an energy import-dependent country.In 2000, the total energy import was 668 842 TJ while the country’s total non-renewableenergy consumption was 1 013 825 TJ. Whence: 668 842/1 013 825 = 0,660For the calculation of the indicator we took 100% of the energy import to be non-renewable, as only less than 2% of the imported electricity is produced by hydro powerplants purchased mainly from Slovak large hydro-power plants.
Vector: 0,660
Discussion of indicator 5Security of energy supply should be one of the main issues of all countries’ energy policy.In the official Hungarian energy policy28 it is mentioned, but not really reflectedconcretely in practice as far as domestic renewable use, energy efficiency, demand sidemanagement are concerned. In addition to that, the energy policy in practice is not really in favour of clean energy,Hungary does not take significant steps towards source and fuel diversification. Almost70% of the total energy demand are covered by import. Domestic production of almostall kinds of fuels is decreasing, due to the scare sources. The most critical is the issue ofnatural gas as Hungary is historically dependent on Russian gas (80% of the import,more than 50% of gas consumption), while 40% of total energy demand is covered bynatural gas. 70% of the country’s natural gas consumption takes place in the heatingseason. As domestic sources are decreasing, demand – especially residential demand – isincreasing, Hungary is very sensitive to price changes. This extreme situation is due tothe residential sector’s gasification and the intensive fuel switch in the power sector, byCHP promotion29.The main short-term challenge for the Hungarian energy sector is to meet the EUrequirement of liberalising the market, eliminating cross subsidies, while elaborating acompensation scheme for the vulnerable consumers and meeting security of supplyneeds. Now there is a tension in the gas sector because the import price is changing,while the domestic prices are partly regulated. As the MOL (Hungarian Oil and Gas Co.)runs both the import and the domestic production, and it is the wholesaler, it is the statethat suffers losses due to the regulation.
Note to the future Observer-Reporter
The MOL (Hungarian Oil and Gas Co) is the exclusive gas importer and the producer of(cheap) domestic gas. It would be very useful to study the production, import andstorage costs, to have a picture on MOL’s real and reclaimed losses that are due toimported gas price changes.
28 21/1993. (IV.9) OGY határozat a magyar energiapolitikáról (Parliamentary Resoulution on the Hungarian
Energy Policy)
29 A földgáz szerepe a magyar energiapolitikában (The Role of Natural Gas in the Hungarian Energy Policy), EUEnlargement Watch, Budapest, 2000

HELIO – Hungary 16/22
▶Indicator 6: Burden of Energy Investments
Discussion of indicator 6In Hungary, the state is involved into the development of the energy sector. Before theyears of transition (1988/89) the whole energy sector was run by the state. Theelectricity sector was run by the Hungarian Electricity Works (MVM), while the oil and gasindustry was run by the Hungarian Oil and Gas Trust (later the MOL Co.). Mainly due to the huge amount of state debt, the government decided privatising theenergy sector, which took place very fast mainly in 1996/96. By this time the gas andelectricity distributors, plenty of power plants and a great proportion of MOL Co. (stillexclusively produces oil and gas, importers, transports and it also stores stocks) wereprivatised.What the state kept for itself are the MVM which runs among others and owns the PaksNuclear Power Plant, Vértes Power Plant and some other smaller power plants,generating more than 50% of the electricity. The state also has 25% of MOL shares.For a quantitative analysis, even for an estimation that could provide a basis for thecalculation of this vector, more time and deeper research are needed. Below are somepoints.To estimate the non–renewable energy investments and the burden on the budget is thebiggest challenge in this review for the following reasons:
• As it was mentioned above, after privatisation, no significant investment did takeplace either by the private sector or by state run companies. In Hungary, the mainlyhidden and direct subsidies from the state to different players puts the main burdenon the budget. To estimate the state’s role, these subsidies should be studied byfuture Observer – Reporters.
• For the companies run by MVM, the Hungarian State gave capital for capital increase.
• Uneconomical power plants (like Vértes) get a subsidy for every kWh electricityproduced.
• The Paks Nuclear Power Plant (producing 40% of the electricity and satisfying 13% oftotal energy demand of Hungary) does not clearly provision the needed funds for itsshutdown, retrofit, and the radioactive wastes deposit. These enormous costs will bea burden on the budget- and would have a high present value if they were calculated.
• It would be crucial to estimate the real costs reflecting market prices for both naturalgas and electricity, which could be the first step to calculate the volume of statesubsidies.
• State guaranties given to borrowing companies also should be counted as budgetcosts related to investments.

HELIO – Hungary 17/22
▶Indicator 7: Energy Productivity (energy consumption/GDP)
Value and calculation of indicator 7Hungary’s GDP production was 8,7% (46 977 million 2000 EUR) lower in 1990 than in2000 and used 1 244,2 PJ1 energy for producing it. It is to be compared to the 50 568million EUR GDP in 2000 and 1 036,1 PJ. The energy intensity of Hungary was 26,49 in1990 and 20,47 MJ/ EUR of GDP30 in 2000 more than double of the world average in1990. Therefore to say the vector for 1990 is 2,655 and for 2000 is 2,029 which meansthat Hungary uses 92% more energy to produce one EUR of GDP than the rest of theworld on average. Note that energy intensity data are not calculated on purchasing power parity basis.
Metric for 1990: 26, 49 MJ/EUR of GDP for 2000: 20,47 MJ/EUR of GDP
Vector for 1990: 2,655 for 2000: 2,029
Discussion of indicator 7After the collapse of the energy-wasteful heavy industry in Hungary, western typeinvestors bought them out and therefore invested into energy efficiency or financedfirms. Also some foreign and governmental programmes provided some funding forenergy efficiency investments. Generally under market pressure, inspired by someforeign and domestic support, and also due to structural changes in the economy, theenergy intensity of Hungary slowly decreased after the collapse of GDP production andenergy use. The GPD production exceeded the 1990 level just in 1999, while the energyconsumption remained under the 1990 energy consumption level by almost 20%. Butstill the Hungarian economy uses almost double of the world average energy, and almostthree times more than the EU. Energy efficiency investment should work under market conditions and would favourenergy saving companies. To favour such investments, one of the key issues is todevelop a bank culture that can rely on future energy savings as a guarantee behindloans31. Despite gasification, the residential sector remained very inefficient. It is especially truefor the district heating sector which covers 1/5 of the population, where up to 26% ofenergy saving could be achieved, without counting the impact of changed heatinghabits32. It is due to the following factors:
30 Gross Domestic Product 2000, KSH Budapest 2002
31 Pesentation of Landis and Staefa – Siemens ESCO at a workshop of Hungarian Energy Efficiency Workshoprun by the International Finance Corporation on 4 July 2002
32 Kovacsics István: Fogyasztó oldali energiahatékonyság a távhőszolgáltatásban (Consumers’ Side EnergyEfficiency in the District Heating Sector), presentation of earlier studies at a Hungarian Energy EfficiencyWorkshop run by the International Finance Corporation on 4 July 2002
HELIO – Hungary 18/22
• huge heat loss (lack of insulation);
• consumers behaviour (flat rates are paid in most cases, so more efficient heating andwarm water use are not necessary decreasing district heating costs);
• pricing practice (40-60% of the district heating cost is a fixed charge for capacitywhich cannot be affected by any kind of energy saving, so the rate of return ofenergy efficiency investments is lower).
Note for future Observer – ReporterAn other important issue for energy saving companies (ESCOs) is that the Hungariantaxation system does not know about the ESCO category and therefore they have to pay25% VAT, and not the 12% like energy trading companies.The energy saving potential in the district heating sector is huge. In 2002-2003 theproblems of this sector should be somehow solved: pricing, demand-side management,the district heating companies involvement into secondary side investments, etc. Thisprocess should be followed, and the energy savings should be measured.The main role player is the Budapest District Heating Company (FŐTÁV) which has theworst system in the country, but has the biggest lobby power. The calculation of FŐTÁV’soperational costs should be the key step to possible capacity charge backdrop, which iscrucial for secondary side energy efficiency investments.
HELIO – Hungary 19/22
▶Indicator 8: Renewable Energy Deployment
Value and calculation of vector 8Hungary’s primary energy consumption in 2000 was 1 036 096 TJ while using 31,5 PJ ofrenewables. Therefore the 3,04% of the energy consumed can be considered to berenewable, which result in a quite poor 1,064 for the indicator which is quite far awayfrom the world average and the desired 8,64%.
Metric for 2000: 3,04%
Vector for 2000: 1,064
Discussion of vector 8In a country where only 3 % of the energy demand is satisfied by renewable sourcesthere are huge RES potentials. Many studies emphasise the possibilities33 34 35 fortechnical utilisation of RES potentials calculating with 220-250 PJ technical potential. Thebasis of these calculations is doubtful, as there are no updated overviews on biomass,wind and geothermal potentials. Traditional renewable energy consumption decreased to almost zero level due togasification and electrification programs. These also hindered the creation of small,flexible energy systems on a local basis. There are some places where biomass andgeothermal sources are used.The main issue is not the potential itself, but the legislation, awareness raising andattractiveness for investments. The main step for RES promotion is being taken in 2002when the price of renewable electricity with purchasing obligation is defined. The otherbig issue is bank loans, which can be more easily gotten in case the legislation and RESpromotion are coordinated.In Hungary, we do not know about studies on public acceptance of clean technologiesthat would facilitate the RES promotion. The slowly increasing amount in thedevelopment program (Széchenyi Plan) will hopefully increase the household sector’sRES utilisation and acceptance.It is a fact that the lobby power of the Nuclear Power Plant and the other polluting powerplants is huge, and they practice it against system reforms and changes.
33 A közös megvalósításban való hazai részvétel stratégiája (National Strategy for Participation in Joint
Implementation), MAKK és Env-Int-Cent, Budapest 2001, background study
34 Kocsikk, K.. Intenational Collaboration for Decentralized Energy Supply of Rural Areas, InternationalAgrophysics, 1998
35 Állásfoglalás a biomassza energetikai felhasználásról, (Position paper on Utilisation of the Biomass forEnergy), Centre for Environmental Studies, Budapest, 2000
HELIO – Hungary 20/22
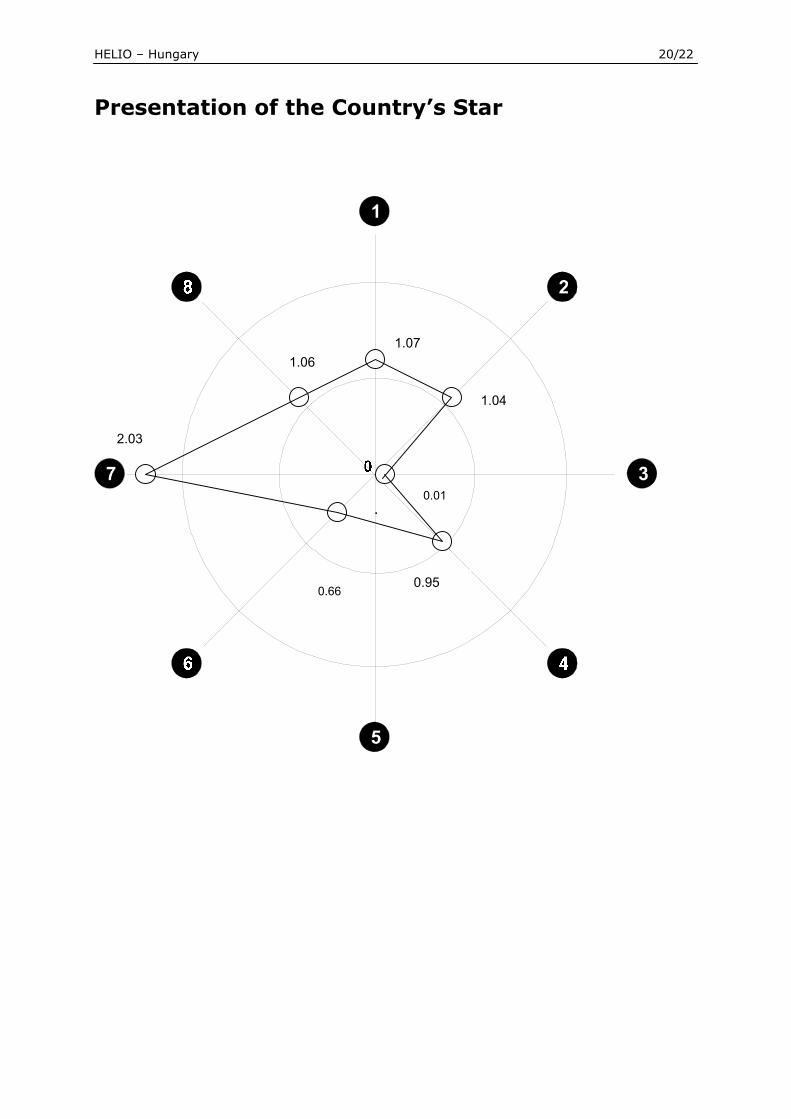
Presentation of the Country’s Star
1.06
2.03
0.660.95
0.01
1.04
1.07

HELIO – Hungary 21/22
Conclusions
Reporter’s conclusions on all indicatorsThe sharp reduction of the energy sector’s CO2 emissions is triggering a nice decrease ofthe indicator on carbon dioxide emissions. This picture can be misleading as this tookplace unintentionally simply due to structural changes. As forecasted by estimations, theenergy and electricity demand will increase, and CO2 emissions may increase again.
The increasing SO2 emissions of the energy sector is mainly due to domestic – lowquality - coal and lignite purchasing regulation. Even though a strict SO2 regulation is inplace, for political reasons the predicted shutdown of polluting power plants is postponed.
With practically 100% access to affordable electricity, Hungary performs very well fromthe social sustainability point of view. Unfortunately this level of connection to thenational grid makes the supply less secure as it promotes the big base-power plants, andhinders the spreading of small renewable-based small systems.
The indicator for investment into clean energy (0,956) shows a pretty nice improvementbetween 1992 and 2000 with almost 400% increase. But despite the improvement, theproportion of clean energy in the Hungarian energy sector remains around 5 % being farless then the desired 8,6 %.
The energy trade indicator (0.66) clearly shows that in addition to Hungary’s energyimport dependency, the country imports from non-renewable sources, using its oldconnections with the former socialist block.
We simply did not calculate the 6 indicator evaluating the non-renewable investments asbudget burdens for two reasons. Energy Club’s opinion – hard to prove, should bestudied - is that in Hungary the biggest burdens on state budget are not directinvestments into the energy sector – there are hardly any, and the ones that take placeare not necessarily burdens -, but price subsidies, and present values of future expensesthat should be covered by present savings.
For energy intensity vector (2,029 for 2000) we can say that despite a significant totalenergy efficiency improvement (20% less energy for one EUR of GDP), the Hungarianeconomy still uses double of the world average. In addition to energy efficiency programs– that have small amount of funds compared to the possible energy saving (= nationalinterest), public awareness raising and third-party financing should be promoted to workin favour of energy efficiency.
As only 3,04 % of Hungary’s energy demand is satisfied by renewables the vector forindicator 8 (1,064) clearly indicates how much Hungary neglects its domestic RESsources.
Note to SEWFor better sustainability, source diversification and reliance on smaller, more flexible,local sources would be crucial. These are the systems that RES technologies couldoperate. Maybe an indicator for domestic sources, and a number of systems (three powerplants for a country of twelve) is worth to be considered. However it is clear, that the aimof SEW is not to produce as many indicators as it can, but rather to simplify.
For indicator 6. As most of the states give price support to some of its players (e.g. formines for regional development and unemployment reasons, or for power plants to keep

HELIO – Hungary 22/22
the production of expensive electricity, etc. not only direct investments but long termprice subsidies should be taken into account being a continuous burden on the budget,and they take away funds from cleaner energy.
Note to future Observer-ReportersIncluded into discussion of indicators.