humans use what is available to them to build shelter. new inventions have made life more...
TRANSCRIPT


• Humans use what is available to them to build shelter.
• New inventions have made life more comfortable:–Indoor plumbing–Air-conditioning–Heating–Insulated windows, etc.

Types of structures• Buildings in places where there is heavy snow
or rain must have sloped roofs.
Flat roofs would collapse from the weight.

Mediterranean – light color to reflect heat, not much rain – flat roof. Build into the mountain side to use all available land.

A fale – open to the outside so that air can blow through. This is a common house type in many island nations.

Yurts are portable. Used in cold climates such as Mongolia.

Mudhif - Houses made of reeds by the Madan people in the marshes in Southern Iraq.

Russian Izba – traditional home in the country including the kitchen.
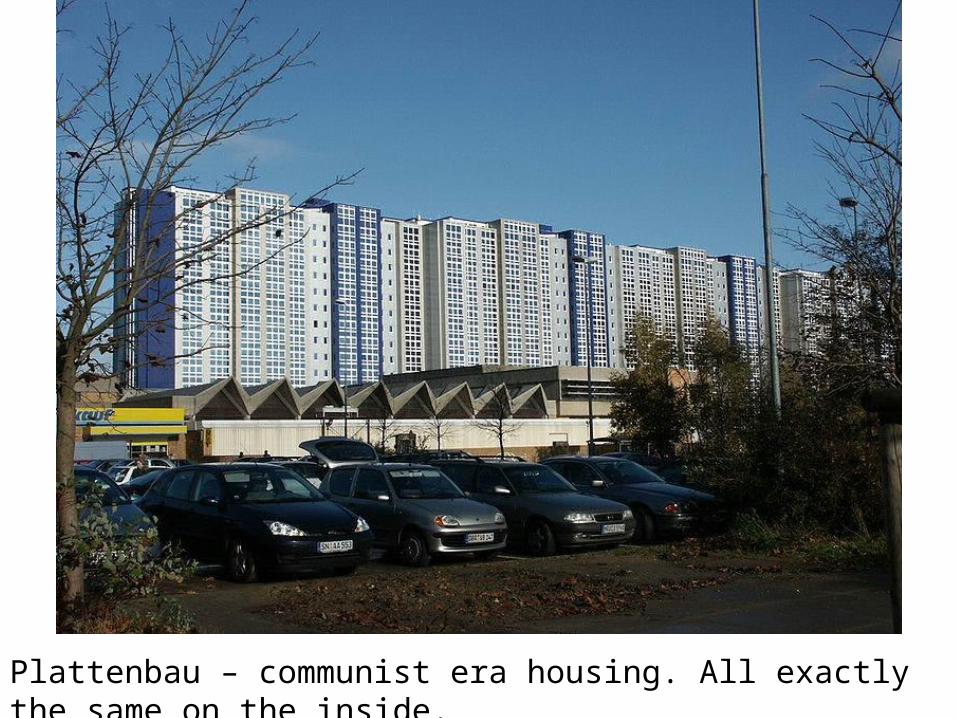
Plattenbau – communist era housing. All exactly the same on the inside.

Tong lau (shop house) – extended families live in these buildings with a shop on the ground floor

Igloo – used by some Inuit of Canada and Greenland. Snow is used because the air pockets trapped in the bricks make it an insulator. On the outside, temperatures may be -49, but on the inside the temperature may range from 19 to 61 when warmed by body heat alone.

Some poorer countries build huts. Usually with mud walls. Roofs made from grass / reeds.

Japan – must save space – toilet & shower in one. Invented futons and stackable washer / dryer

Houses on stilts – Myanmar (Burma)

Air-conditioning made it possible for people to adapt to hot, humid areas. This invention improved lives. The population in the southern part of the US was greatly impacted by this invention.

Desalination plants made it possible for countries without access to fresh water to produce some from sea / ocean water.

Other adaptations
• Hurricane shutters• Roads and buildings adapted for earthquakes
including anchor plates, computer controlled weights in the rooftops, automatic window shutters to prevent falling glass, and steel frames that can sway in the movement.
• Reservoir – man-made body of water that is used for water storage – usually for drinking water


Current World Populationhttp://www.worldometers.info/population/
http://www.census.gov/population/www/popclockus.html
This morning – US:
World:
For the US:
One birth every................................................ 7 seconds
One death every............................................. 13 seconds
(we added a whole second since last year)!
One international migrant (net) every............ 45 seconds
(It was 29 last year)
Net gain of one person every......................... 12 seconds

History of Human Population Growth
Years Elapsed Year Human Population
3,000,000 10,000 B.C. (Agricultural Revolution) 5-10 Million
10,000 1 A.D. 170 Million
1,800 1800 (Industrial Revolution) 1 Billion
130 1930 2 Billion
30 1960 3 Billion
15 1975 4 Billion
12 1987 5
Billion
12 1999 6 Billion
10 2009 6.8 Billion
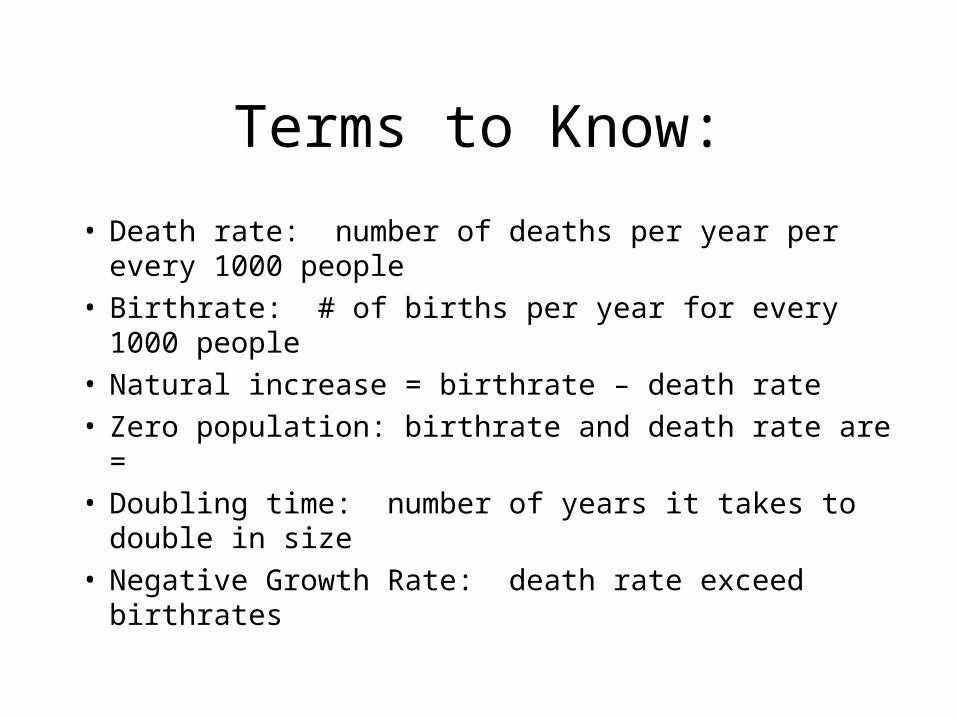
Terms to Know:
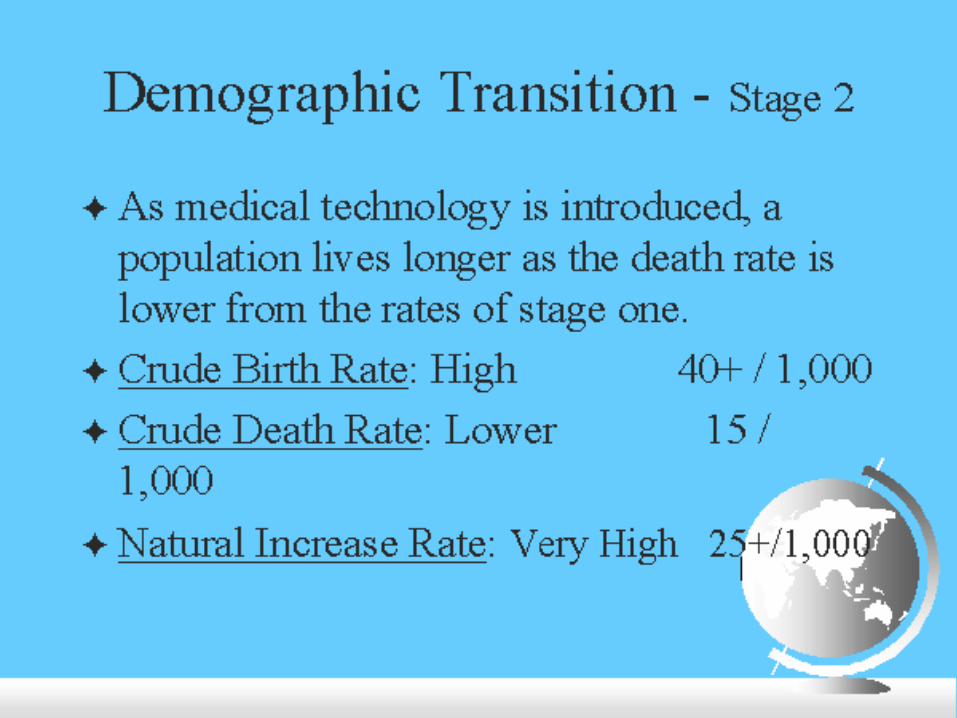
• Death rate: number of deaths per year per every 1000 people
• Birthrate: # of births per year for every 1000 people• Natural increase = birthrate – death rate • Zero population: birthrate and death rate are = • Doubling time: number of years it takes to double in
size • Negative Growth Rate: death rate exceed birthrates


Rates of Natural Increase

The world’s population is growing because:•Better medical care / medicine
•Improved sanitation
•Lower infant mortality
•Longer life expectancy
•Birth rates not declining as fast as death rates.
•More abundant food.
•Better living conditions
Birth rates have not increased! Around the world women are actually having less children than in the past.

Challenges to Rapid Growth• Difficulty producing enough food• Use resources too quickly• Too many children – not contributing to farming
(too young) or paying taxes.

What problems can be caused by population increase?
• We will need more of everyday things: Food, land to grow food, clean water, shelter, schools, hospitals, roads, energy
•Poor will probably not be able to change circumstances because more people will be sharing the same amount of resources
•Governments will have difficulty keeping up with demands of the people.

Negative Population Growth• Must import workers from other countries.
• Immigrant populations don’t always get along with native population.
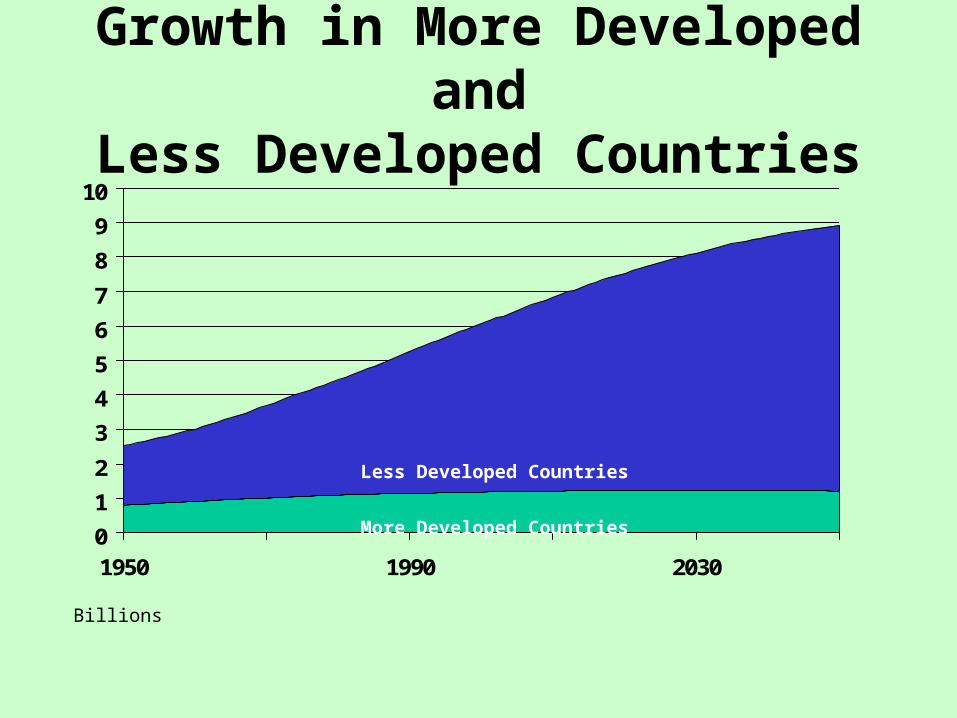
Billions
Growth in More Developed and
Less Developed Countries
0
1
2
3
4
5
6
7
8
9
10
1950 1990 2030
Less Developed Countries
More Developed Countries

Present Rate of Growth
80 Million a Year
World Adds as many people as:
• 1 New York City every month
• 1 Germany every year
• 1 Europe every decade

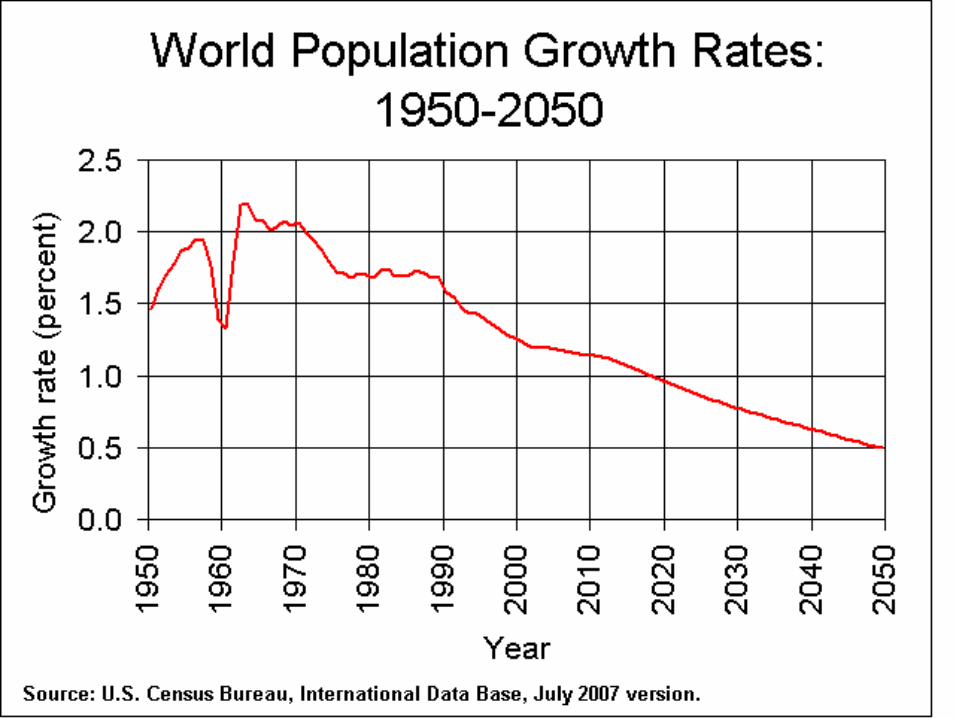
Population J-Curve At current rate of 1.4%
Estimated Population:
9 billion by 2025
12 Billion by 2050

World’s most populated countries
Know top 5

Where do people live?
• 61% live in Asia.
• Most people want to live on or near:– Flat land– Fertile soil– available water– In a mild climate– Near transportation routes

Why people move
• Availability of resources and jobs
• Creation or expansion of cities
• Efficient transportation systems

World Population Density Map
Population density is people per square mile / kilometer – total population divided by total land area.

What is the most important factor influencing population distribution?
Geography!There are some areas that are not suitable or comfortable to live – too hot, too cold, too high, swampy, dry, rocky, etc.
Population distribution is where people actually live. All the world’s people live on about 1/3 of the world’s land
Think about it – very few people live in Alaska


Egypt as a Case Study
• Arithmetic = 181 per sq. mile
• Physiological = 5,807 per sq mile
• Why the disparity?

Migration?
• Natural increase does not account for migration – movement of people from place to place
• Common migrations:– Rural to urban
– Why do you think this occurs
– Country to country
– Emigrants in their homelands; immigrants to new county
– Why do you think this occurs?

Demographic Transition Model


When geographers want to examine
the structure of a population and the
potential for growth in that population,
they turn to a basic tool in demography:
the population pyramid.
Just as a builder uses a blueprint for depicting
the structure of a house, a geographer uses
a population pyramid as a blueprint
for interpreting the
dynamics of a population
Population Pyramids: graphically display a population's age and gender are bar graphs; show numbers or proportions of males and females in each age group show gains of cohort (same age group) members due to immigration and birth, show loss of cohort members due to emigration and death; reflect population growth or decline

Rapidly Growing Population – usually developing & poor

Slow Population Growth – usually developed - stable

Negative Population Growth – will need to import
workers. Notice the big change between 25-29 and
20-25 and also 20-25 and 15-19

Population Structures by Age and Sex, 2005 Millions
300 100 100 300300 200 100 0 100 200 300
Less Developed Regions
More Developed Regions
Male Female Male Female
80+ 75-79 70-74 65-69 60-64 55-59 50-54 45-49 40-44 35-39 30-34 25-29 20-24 17-19 10-16
5-90-4
Age

That long arm of post-adolescent males should be a dead giveaway for a military town, in this case Onslow County, NC,
home of Marine Corps Base Camp Lejuene.

The tourist town has little opportunity for young adults and they clear out as shown here in Narrangasett, RI.

Seniors rule in Sarasota, Fl, but not the ones in high school. The high concentration of senior citizens puts Sarasota County Transit at among the highest demand response trips per fixed route trip in Florida.

The overwhelming number of co-eds should instantly reveal the college town, this one the home of the Gators, Gainesville, FL.


Computer engineers – small families – working women and men.

HDI: Human Development Index Human Development Index (HDI) is a way to compare the standards of living for countries worldwide. It measures well-being, especially child welfare. It is used to distinguish whether the country is a developed, a developing, or an under-developed country, and also to measure the impact of economic policies on quality of life. These rankings are accepted as accurate in most nations around the world.
Note: The State of Texas uses different terms – YOU NEED TO KNOW BOTH!!!!:
Developed = more developed
developing = Newly industrialized
under developed = less developed


More Developed
• The main factor is economics – high GNI PPP / GDP per capita
• Another factor is industrialization.• Countries where the largest economic sectors
are tertiary and quaternary. • These countries are

Dark blue countries.

Top 20 for 2010
• Norway• Australia• New Zealand• United States• Ireland• Liechtenstein• Netherlands• Canada• Sweden• Germany
• Japan• South Korea• Switzerland• France• Israel• Finland• Iceland• Belgium• Denmark• Spain

newly industrialized country (NIC) are countries whose economies have not yet reached the top level – more developed, but have outpaced their less developed counterparts. Usually nations that have economic growth (mostly export-oriented) On-going industrialization is an important indicator of a NIC. In many NICs, social upheaval can occur as primarily rural, or agricultural, populations migrate to the cities, where the growth of manufacturing and factories can draw many thousands of laborers.

Common characteristics of NICs
• Increased social freedoms and civil rights• strong political leaders• A switch from agricultural (primary) to
industrial economies, especially in manufacturing sector (Secondary)
• free trade with other nations in the world. • Large national corporations operating in
several continents.

• Mexico• Brazil• South Africa• Turkey• India• China
• Thailand• Philippines• Malaysiz
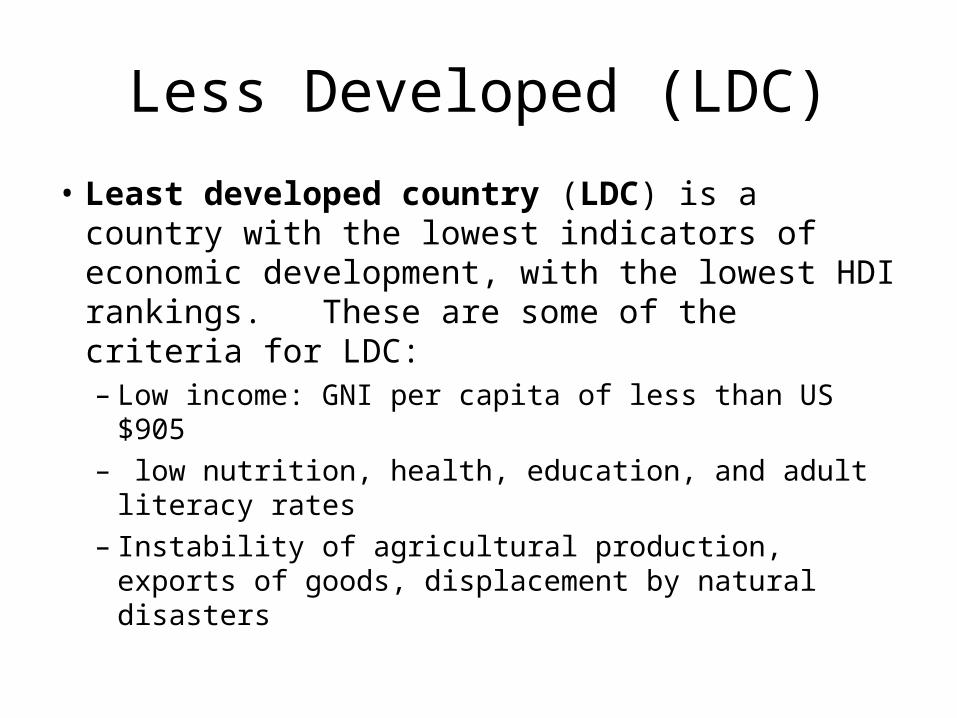
Less Developed (LDC)
• Least developed country (LDC) is a country with the lowest indicators of economic development, with the lowest HDI rankings. These are some of the criteria for LDC:– Low income: GNI per capita of less than US $905– low nutrition, health, education, and adult
literacy rates– Instability of agricultural production, exports of
goods, displacement by natural disasters


Population Dilemmas in Europe

The Geographic Setting• One of the smallest continents in size• 1/8th of the population lives there• Population Density is shrinking
– Why?• Oldest population• Lowest birthrate

Births, Deaths and Migration• Total Fertility Rate in Italy = 1• To stop shrinking needs to raise to
replacement rate• Longer Life expectancies• Changing trend in migration: now more
migrants to Europe, but still not enough

Dependency Ratio
• Compares the number of people too young (under 16) or too old (over 64) to work with those in the working- age population
• High dependency ratio = more people to support
• Low dependency ratio = less people to support
• Where is Europe?

Population Change in Europe
• From slow to fast to no growth• Remember the Demographic Transition
Model?

Dilemma One: A Shrinking Population
• Between 2005 and 2050, Italy is expected to shrink from 58 million to about 50 million
• Causes:– Women wanting to pursue education and careers– Women are waiting to have children– Family planning– High cost of living– Child care

• Effects:– Declining enrollment in schools results in
unemployment and loss of business– Labor shortages, relocating businesses– Smaller militaries

• Some possible responses:– “birth bonuses” and benefits such as reduced rent
and lower taxes– Lowering the cost of children– Providing quality childcare– Paid leave for parents– Flexible work hours
What do you think?

Dilemma Two: An Aging Population
• “Old Continent”• By 2050 average age in Spain will be 50,
making it the oldest in the world• Causes:
– Rise in life expectancy– Drop in the birthrate– Baby Boom

• Effects:– Government Pensions – Government Health care– Only works when a country has a low dependency
ratio– Higher taxes

• Some possible responses:– Cut the amount of money each worker receives in
pensions– Raise the retirement age– Bonuses to those who delay retirement– Prevention is better than treatment– Home care instead of nursing homes
What do you think?

Dilemma Three: A Declining Workforce
• Causes:– More people retire than enter the workforce– Will increase as baby boomers retire– Dependence Ratio in 2000 was 87 dependents to
100 workers, in 2030 it is estimated to be 100 workers for 121 dependents
• Effects:– More Jobs for young workers– Decline in highly skilled workers– Businesses may move– Less revenue from taxes

• Some possible responses: – Keep older workers working– Encourage women to join and stay in the
workforce– Move jobs to other parts of the world– Encourage immigration
What do you think?