humans signature to detect renal transplant tolerance in · identifying transplant recipients in...
TRANSCRIPT

Development of a cross-platform biomarkersignature to detect renal transplant tolerance inhumans
Pervinder Sagoo, … , Maria P. Hernandez-Fuentes, Robert I.Lechler
J Clin Invest. 2010;120(6):1848-1861. https://doi.org/10.1172/JCI39922.
Identifying transplant recipients in whom immunological tolerance is established or isdeveloping would allow an individually tailored approach to their posttransplantationmanagement. In this study, we aimed to develop reliable and reproducible in vitro assayscapable of detecting tolerance in renal transplant recipients. Several biomarkers andbioassays were screened on a training set that included 11 operationally tolerant renaltransplant recipients, recipient groups following different immunosuppressive regimes,recipients undergoing chronic rejection, and healthy controls. Highly predictive assays wererepeated on an independent test set that included 24 tolerant renal transplant recipients.Tolerant patients displayed an expansion of peripheral blood B and NK lymphocytes, feweractivated CD4+ T cells, a lack of donor-specific antibodies, donor-specifichyporesponsiveness of CD4+ T cells, and a high ratio of forkhead box P3 to a-1,2-mannosidase gene expression. Microarray analysis further revealed in tolerant recipients abias toward differential expression of B cell–related genes and their associated molecularpathways. By combining these indices of tolerance as a cross-platform biomarker signature,we were able to identify tolerant recipients in both the training set and the test set. Thisstudy provides an immunological profile of the tolerant state that, with further validation,should inform and shape drug-weaning protocols in renal transplant recipients.
Research Article Transplantation
Find the latest version:
http://jci.me/39922-pdf

Research article
1848 TheJournalofClinicalInvestigation http://www.jci.org Volume 120 Number 6 June 2010
Development of a cross-platform biomarker signature to detect renal
transplant tolerance in humansPervinder Sagoo,1,2,3,4 Esperanza Perucha,1,2,3,4 Birgit Sawitzki,2,3,5 Stefan Tomiuk,2,3,6 David A. Stephens,7 Patrick Miqueu,2,3,8 Stephanie Chapman,2,3,9 Ligia Craciun,2,3,10
Ruhena Sergeant,11 Sophie Brouard,2,3,8 Flavia Rovis,1,2 Elvira Jimenez,1,2 Amany Ballow,11 Magali Giral,8 Irene Rebollo-Mesa,3,4 Alain Le Moine,1,2,10 Cecile Braudeau,2,3,8 Rachel Hilton,1,4
Bernhard Gerstmayer,6 Katarzyna Bourcier,12 Adnan Sharif,2,3 Magdalena Krajewska,2,3 Graham M. Lord,1,4 Ian Roberts,9 Michel Goldman,2,3,10 Kathryn J. Wood,2,3,9 Kenneth Newell,12,13
Vicki Seyfert-Margolis,12 Anthony N. Warrens,2,11 Uwe Janssen,2,3,6 Hans-Dieter Volk,2,3,5 Jean-Paul Soulillou,2,3,8 Maria P. Hernandez-Fuentes,1,2,3,4 and Robert I. Lechler1,2,3
1MRC Centre for Transplantation, King’s College London, London, United Kingdom. 2Indices of Tolerance EU consortium (www.transplant-tolerance.org.uk). 3Reprogramming the Immune System for the Establishment of Tolerance (RISET) EU consortium (www.risetfp6.org).
4NIHR Biomedical Research Centre at Guy’s and St Thomas’ Hospital and King’s College London, London, United Kingdom. 5Institute of Medical Immunology and Berlin-Brandenberg Center for Regenerative Therapies (BCRT), Charité University Medicine, Berlin, Germany. 6MACSmolecular Business Unit, Miltenyi Biotec GmbH, Bergisch Gladbach, Germany. 7Department of Mathematics and Statistics, McGill University,
Montreal, Quebec, Canada. 8Institut National de la Santé et de la Recherche Médicale (INSERM) U643 and Institut de Transplantation et de Recherche en Transplantation (ITERT), Nantes, France. 9Nuffield Department of Surgery,
University of Oxford, Oxford, United Kingdom. 10Institute for Medical Immunology, Université Libre Bruxelles, Charleroi, Belgium. 11Departments of Immunology and Renal Medicine, Imperial College London, London, United Kingdom. 12Immune Tolerance Network,
San Francisco, California, USA (www.immunetolerance.org). 13Emory University, Atlanta, Georgia, USA.
Identifyingtransplantrecipientsinwhomimmunologicaltoleranceisestablishedorisdevelopingwouldallowanindividuallytailoredapproachtotheirposttransplantationmanagement.Inthisstudy,weaimedtodevelopreliableandreproducibleinvitroassayscapableofdetectingtoleranceinrenaltransplantrecipients.Severalbiomarkersandbioassayswerescreenedonatrainingsetthatincluded11operationallytolerantrenaltransplantrecipients,recipientgroupsfollowingdifferentimmunosuppressiveregimes,recipientsundergo-ingchronicrejection,andhealthycontrols.Highlypredictiveassayswererepeatedonanindependenttestsetthatincluded24tolerantrenaltransplantrecipients.TolerantpatientsdisplayedanexpansionofperipheralbloodBandNKlymphocytes,feweractivatedCD4+Tcells,alackofdonor-specificantibodies,donor-spe-cifichyporesponsivenessofCD4+Tcells,andahighratioofforkheadboxP3toα-1,2-mannosidasegeneexpression.MicroarrayanalysisfurtherrevealedintolerantrecipientsabiastowarddifferentialexpressionofBcell–relatedgenesandtheirassociatedmolecularpathways.Bycombiningtheseindicesoftoleranceasacross-platformbiomarkersignature,wewereabletoidentifytolerantrecipientsinboththetrainingsetandthetestset.Thisstudyprovidesanimmunologicalprofileofthetolerantstatethat,withfurthervalidation,shouldinformandshapedrug-weaningprotocolsinrenaltransplantrecipients.
IntroductionTransplantation tolerance can be defined as the stable main-tenance of good allograft function in the sustained absence of immunosuppressive therapy. In the clinical arena, it is only apparent when patients experience stable allograft function despite having ceased all immunosuppression for an extended period of time. This state, defined as operational tolerance, has rarely been reported in renal transplantation (1–5), being more common in liver transplantation (6, 7).
Long-term survival of kidney transplants currently depends on sustained drug-induced immunosuppression. However, this is accompanied by increased morbidity and mortality, mainly due to
cardiovascular disease, opportunistic infection, and malignancy (8). Currently, we do not have the means to identify a priori those patients who are developing tolerance to their transplants and who would therefore benefit from partial or complete ces-sation of immunosuppression. Hence, there is an increasing need to develop assays and identify biomarkers that would allow clinicians to safely minimize immunosuppression, based on a patient’s specific immunological profile.
We report on a multicenter study aimed at defining specific immunological characteristics that identify the tolerant state. We recruited renal transplant patients from distinct clinical groups from across Europe, focusing on operationally tolerant recipients, defined as stable renal transplant recipients that had ceased all immunosuppressive drugs for more than a year with no increase in serum creatinine (CRT; <10%) during the last 12 months (tol-erant, drug-free [Tol-DF]). As control groups, we selected patients with stable renal function maintained on less than 10 mg/d predni-sone as the only immunosuppressive agent (stable, low prednisone
Authorshipnote: Pervinder Sagoo and Esperanza Perucha are co–first authors. Maria P. Hernandez-Fuentes and Robert I. Lechler are co–senior authors.
Conflictofinterest: Uwe Janssen, Stefan Tomiuk, and Bernhard Gerstmayer are employees of Miltenyi Biotec.
Citationforthisarticle: J Clin Invest. 2010;120(6):1848–1861. doi:10.1172/JCI39922.
Related Commentary, page 1803

research article
TheJournalofClinicalInvestigation http://www.jci.org Volume 120 Number 6 June 2010 1849
[s-LP]); those who had never received calcineurin-based immuno-suppression (stable, no calcineurin inhibitor [s-nCNI]); patients who were maintained on standard calcineurin inhibitor therapy (s-CNI); patients with biopsy-proven and immunologically driven chronic rejection (CR); and age- and sex-matched healthy controls (HCs). The tolerant cohort collected by the Indices of Tolerance (IOT) consortium in Europe was used as a training set of renal transplant patients on which a series of bioassays and biomarkers were screened for their ability to detect immunological parameters uniquely associated with the tolerant state. In this set we identified a tolerance signature comprising a set of 10 genes with significantly altered expression, elevated numbers of peripheral blood B and NK cells, diminished numbers of recently activated CD4+ T cells, donor-specific hyporesponsiveness of CD4+ T cells, and a high ratio of FoxP3/α-1,2-mannosidase gene expression in peripheral blood, in relation to the other renal transplant comparator groups.
These findings were then validated on an independent test set of renal transplant recipients of similar clinical groups recruited by the Immune Tolerance Network (ITN) in the United States.
This and the study by Newell et al. (9) are the first to our knowl-edge in which cross-platform biomarkers have been used to analyze operational tolerance in kidney transplantation. Together, we have studied the largest cohort of tolerant renal transplant recipients to date, and although using different assays and platforms, both studies have identified a B cell signature associated with opera-tional tolerance. Here, we describe a robust set of research tools that, when combined, can distinguish drug-free tolerant patients from other groups of renal transplant patients and healthy con-trols with a high degree of specificity and sensitivity. More impor-tantly, cross-platform biomarker analysis highlights subjects with-in stable renal transplant groups who display an immunological profile similar to that of tolerant patients and who may therefore benefit from managed drug withdrawal.
ResultsTolerant renal transplant patient demographics. The training set com-prised 71 European kidney transplant recipients and 19 age- and sex-matched healthy controls (Table 1). The Tol-DF group had a high percentage of cadaveric donors (7 of 11), a high degree of HLA mismatching (median mismatches, 4.0), was predominantly male (9 of 11), and had varied causes of end-stage renal failure and some evidence of sensitizing events, such as blood transfusions and pre-vious transplants (Table 2). These patients had relatively unevent-ful post-transplantation courses, with only 1 patient having a documented episode of acute cellular rejection (ACR). The period of being immunosuppression-free varied from 1 to 21 years.
The Tol-DF group of the test set (Table 3) consisted of 24 patients, most of whom had received their transplant from a highly HLA-matched living donor (median mismatches, 0.0) and had ceased taking all immunosuppression medication for periods from 1 to 32 years.
Tol-DF recipients displayed increased numbers of B and NK lymphocytes. As shown in Figure 1, Tol-DF patients of the training set displayed an increased percentages of peripheral blood B and NK cells and a corresponding decrease in the percentage of T cells. When the percentages of B cells and T cells were expressed as a ratio, Tol-DF patients displayed the highest ratio compared with all other study groups, including HCs. For 6 Tol-DF patients and 10 s-CNI patients, it was also possible to calculate the absolute number of cells per lymphocyte subset. This showed that the altered ratio was
Tab
le 1
Clin
ical
and
dem
ogra
phic
cha
ract
eris
tics
of th
e tra
inin
g se
t (IO
T co
hort)
n
AgeA
%
Post
-TxC
eGFR
DCR
TELy
mph
F%
1st
%
HL
A-
Pat.
Pa
t.
Pat.
Pa
t.on
Ab
Fem
aleB
TxG
CADH
MM
Ion
CNI
Jon
MM
FKon
Aza
Lst
eroi
dsM
in
duct
ionN
HCs
19
44 (3
7–52
) 47
–
– –
– –
– –
– –
– –
–To
l-DF
11
54 (4
1–58
) 18
12
(7–2
3)
76.2
(58–
69)
97.0
(88–
119)
1.
855
(1.4
–2.2
) 64
64
4.
0 0
0 0
0 2
s-LP
11
44
(36–
58)
36
12 (9
–17)
58
.1 (4
1–70
) 12
0.6
(107
–141
) 1.
980
(1.5
–2.3
) 73
91
4.
0 0
0 0
11
0s-
nCNI
10
49
(44–
57)
40
25 (2
3–26
) 64
.2 (5
9–74
) 10
1.5
(87–
121)
1.
790
(1.6
–1.9
) 70
30
3.
5 0
0 10
10
0
s-CN
I 30
42
(37–
47)
47
6 (5
–9)
56.3
(49–
63)
115.
0 (1
06–1
27)
1.20
0 (0
.9–1
.8)
86
7 4.
0 22
11
14
29
5
CR
9 52
(31–
54)
33
5 (3
–11)
19
.0 (1
3–31
) 31
2.0
(208
–382
) 1.
335
(1.2
–1.5
) 78
44
4.
0 6
4 3
7 5
All p
at.
71
44 (3
7–56
) 38
9
(5–1
8)
58.1
(43–
70)
117.
0 (9
8–14
3)
1.50
0 (1
.2–1
.9)
77
38
4.0
28
15
27
57
13
Med
ian
and
inte
rqua
rtile
ran
ge p
er g
roup
are
sho
wn.
AA
ge in
yea
rs. B
Per
cent
age
of fe
mal
es in
eac
h gr
oup
CT
ime
afte
r tr
ansp
lant
atio
n (y
r). D
Cal
cula
ted
as d
escr
ibed
in M
etho
ds. E
Ser
um C
RT
val
ues
(nor
mal
ra
nge,
60–
105 μ
mol
/l). F
Per
iphe
ral b
lood
lym
phoc
yte
coun
ts (×1
09 c
ells
/l). G
Per
cent
age
of p
atie
nts
with
thei
r fir
st tr
ansp
lant
. HP
erce
ntag
e of
pat
ient
s w
ith c
adav
eric
don
ors.
I Med
ian
num
ber
of H
LA-A
, -B
, -C
, -D
R, a
nd -
DQ
mis
mat
ches
bet
wee
n do
nor
and
reci
pien
t (m
axim
um, 1
0). J
Num
ber
of p
atie
nts
on C
NI a
t the
tim
e of
sam
ple
colle
ctio
n. K
Num
ber
of p
atie
nts
on m
ycop
heno
late
mof
etil.
LN
umbe
r of
pat
ient
s on
az
athi
oprin
e. M
Num
ber
of p
atie
nts
on s
tero
ids.
NN
umbe
r of
pat
ient
s tr
eate
d by
ant
ibod
y in
duct
ion
ther
apy.

research article
1850 TheJournalofClinicalInvestigation http://www.jci.org Volume 120 Number 6 June 2010
due to an expansion in B and NK cell numbers and not a reduction in T cell numbers, as none of the Tol-DF group were lymphopenic (Table 2).
In line with our findings in the training set, Tol-DF patients of the test set also showed elevated per-centages of peripheral blood B cells and a higher ratio of B/T cell percentages (Figures 1, E and H) compared with all other groups except HCs.
Given the distinct increase in peripheral blood B cells detected in Tol-DF patients, B cell subsets were analyzed (Supplemental Figure 1; supple-mental material available online with this article; doi:10.1172/JCI39922DS1) and cytokine produc-tion (Supplemental Figure 2) assessed in selected patients of both study sets. The Tol-DF group dis-played a trend toward redistribution of B cell sub-sets, with a decreased memory pool and concomi-tant increase in transitional and naive B cell subsets. When the percentages of B cell subsets were exam-ined as a ratio, Tol-DF patients were found to have a significantly lower proportion of memory and high-er proportion of transitional B cells compared with CR patients. A significant proportion of B cells from Tol-DF patients was found to produce TGF-β upon in vitro stimulation, rather than IL-10 or IFN-γ. However, no significant differences in production of IL-10 were detected for any study group. The capacity of B cells from each patient group to pro-duce either cytokine on stimulation was analyzed by calculating the ratio of the number of B cells pro-ducing each cytokine. This suggested that B cells of Tol-DF patients had a skewed cytokine response, with a higher propensity for TGF-β production than B cells from other study groups.
Tolerant recipients had fewer activated CD4+ T cells in peripheral blood. Expression of CD25 by CD4+ T cells was analyzed as described in Methods. Tol-DF patients in the training set were found to have significantly lower percentages of circulating CD4+CD25int T cells, broadly thought of as activated T cells (10, 11) (Figure 2A), compared with the HC, s-LP, s-nCNI, and CR groups. Interestingly, no signif-icant differences in the percentages of CD4+CD25hi Tregs were detected among the study groups (Fig-ure 2B). Similar results were also found in the test set, with Tol-DF patients having significantly lower percentages of CD4+CD25int T cells compared with s-CNI and chronic allograft nephropathy (CAN) groups, but again no differences in the percentages of CD4+CD25hi Tregs were detected between Tol-DF and any other study group (Figure 2, C and D). Statistical comparisons between other groups of the training and test sets are shown in Supplemental Table 1, A and B, respectively.
When we tested the ability of enriched CD4+CD25hi T cells to suppress autologous T cell proliferation induced by polyclonal stimulation, no significant differences were found between any of the patient groups or HCs (data not shown). Furthermore, Tol-DF patients did not display higher percentages of
Tab
le 2
Clin
ical
and
nat
ural
his
tory
sum
mar
y of
Tol
-DF
patie
nts
of th
e tra
inin
g se
t (IO
T co
hort)
AgeA
Sex
Caus
eof
Po
st-
eGFR
CLy
mph
DDo
nor
HLA-
IS
-free
FTx
Ot
hers
ensi
tizat
ion
Re
ason
fors
topp
ing
Co
untr
y
re
nalf
ailu
re
TxB
type
M
ME
(yr)
no
.Gev
ents
im
mun
osup
pres
sion
40
Mal
e Gl
omer
ulon
ephr
itis
6 79
.2
1.90
0 Ca
dave
ric
0 5
2 Tr
, PRA
pre
-Tx
= 80
%,
Stop
ped
due
to
UK
pe
ak P
RA =
92%
ne
ck c
ance
r57
M
ale
Drug
-indu
ced
4
76.4
N/
D Li
ving
, rel
ated
0
3 2
None
reco
rded
Re
ceiv
ed B
MTx
from
UK
post
-leuk
emia
ther
apy
sam
e do
nor b
efor
e ki
dney
,
had
hem
opoi
etic
chi
mer
ism
60
Mal
e Et
iolo
gy u
ncer
tain
18
79
.6
2.54
0 Ca
dave
ric
8 3
1 Tr
, PRA
pre
-Tx
= 0%
, Se
lf-w
eani
ng p
roce
ss
Fran
ce
pe
ak P
RA =
0%
75
M
ale
IgA
neph
ropa
thy
33
45.7
1.
273
Cada
veric
3
21
2 Tr
Se
lf-w
eani
ng p
roce
ss
Fran
ce
over
4 y
r56
M
ale
Cyst
ic/p
olyc
ystic
kid
ney
9
60.8
1.
700
Cada
veric
4
3 1
Tr, P
RA p
re-T
x =
0,
Stop
ped
sudd
enly
due
Cz
ech
Repu
blic
dise
ase
pe
ak P
RA =
2, A
CR II
A to
3 w
k lo
cal f
lood
s48
M
ale
Urol
ogic
al/n
euro
path
ic
29
76.2
1.
440
Cada
veric
4
11
1 Tr
Se
lf-w
eane
d an
d st
oppe
d UK
54
Mal
e Gl
omer
ulon
ephr
itis
18
56.0
1.
855
Livi
ng, r
elat
ed
2 12
1
None
reco
rded
Se
lf-w
eane
d an
d st
oppe
d Ita
ly43
Fe
mal
e Ob
stru
ctiv
e/re
flux
neph
ropa
thy
5 72
.7
1.30
0 Ca
dave
ric
5 3
2 No
ne re
cord
ed
Unkn
own
Fran
ce29
Fe
mal
e W
egen
er g
ranu
lom
atos
is
11
84.5
Cada
veric
5
2 1
PRA
pre-
Tx a
nd
Self-
wea
ning
pro
cess
Sw
itzer
land
peak
PRA
= 0
%
over
1.5
yr
34
Mal
e Hy
perte
nsio
n 12
50
.1
2.17
0 Li
ving
, rel
ated
1
2 1
Tr, p
eak
PRA
= 9%
Se
lf-w
eani
ng p
roce
ss
UK59
M
ale
Glom
erul
onep
hriti
s 29
84
.0
2.40
0 Li
ving
, rel
ated
6
2 1
Tr, p
eak
PRA
= 0%
Se
lf-w
eani
ng p
roce
ss
UK
AA
ge in
yea
rs. B
Tim
e af
ter
tran
spla
ntat
ion
(yr)
. CC
alcu
late
d as
des
crib
ed in
Met
hods
. DP
erip
hera
l blo
od ly
mph
ocyt
e co
unts
(×1
09 c
ells
per
lite
r). E
Num
ber
of H
LA-A
,- B
, -C
, -D
R, a
nd -
DQ
mis
mat
ches
bet
wee
n do
nor
and
reci
pien
t (m
axim
um, 1
0). F
Yea
rs p
atie
nt h
ad b
een
free
of a
ll im
mun
osup
pres
sive
dru
gs. G
Tra
nspl
ant n
umbe
r. T
r, p
atie
nt r
ecei
ved
mor
e th
an 1
blo
od tr
ansf
usio
n be
fore
tran
spla
ntat
ion;
PR
A, p
anel
re
activ
e an
tibod
y; p
re-T
x, P
RA
>1%
rec
orde
d be
fore
tran
spla
ntat
ion;
pea
k P
RA
, any
his
toric
PR
A >
1% r
ecor
ded;
BM
Tx,
BM
tran
spla
nt; A
CR
IIA
, 1 e
piso
de o
f bio
psy-
prov
en B
anff
clas
sific
atio
n of
AC
R s
core
IIA
; N/D
, no
data
ava
ilabl
e.
research article
TheJournalofClinicalInvestigation http://www.jci.org Volume 120 Number 6 June 2010 1851
other Treg subsets such as CD3+CD8+CD28– or CD3+CD4–CD8– T cells (data not shown).
The majority of tolerant recipients did not have detectable anti-donor HLA-specific antibodies. Serum non-donor-specific antibodies (NDSAs) were detectable in some patients from all study groups of the training set (Figure 3A) by Luminex xMAP analysis. Within this cohort, no Tol-DF patients had detectable donor-specific antibod-ies (DSAs), whereas all other groups had some patients with detect-able DSAs, with almost half of the CR patients having detectable levels of both donor- and non-donor-specific anti–HLA class I and class II antibodies. Similar to the training set, only 1 of 22 Tol-DF patients within the test set had detectable DSAs (data not shown). Interestingly, in general, graft function was worse in DSA-positive patients than DSA-negative patients, with an estimated glomerular filtration rate (eGFR) of 31 (range, 17–87) in DSA-positive patients compared with 60 (range, 13–94) in DSA-negative patients.
The possible pathogenicity of detected anti-donor antibodies was tested in the training set (Figure 3B). In 7 of 20 patients with anti–class I antibodies and 4 of 13 patients with anti–class II antibodies, we found complement-fixing isotypes (IgG1 and IgG3); the remaining positive cases were exclusively of non-complement-fixing isotypes.
Detection of non-donor-specific anti–class I and anti–class II anti-bodies was significantly associated with having received a previous transplant and having detectable panel reactive antibodies before transplant (Fisher’s exact test, P < 0.05), but not with previous preg-nancies, blood transfusions, graft dysfunction, or episodes of ACR. In contrast, donor-specific anti–class II antibodies were associated with previous episodes of ACR and the number of HLA mismatches between donor and recipient (Fisher’s exact test, P < 0.05).
Tolerant patients have lower frequencies of direct pathway anti-donor IFN-γ CD4+ T cell responses. Comparison of direct pathway CD4+ T cell anti-donor and anti–third party (equally mismatched to donor) responses was assessed by IFN-γ ELISpot. Tol-DF patients had significantly higher ratios of responder anti-donor/anti–third party frequencies, indicating donor-specific hyporesponsiveness, compared with all other stable patient groups within the training set (Figure 4A; individual responder frequencies against donor and third party are shown in Supplemental Figure 3). Donor-specific hyporesponsiveness was not mediated by Tregs, as depletion of CD25+ cells from responder T cells did not result in an increase in responder frequencies (data not shown).
As patients within the Tol-DF group of the test set were fre-quently completely HLA matched with their donors, anti-donor and anti–third party IFN-γ responses were generally very low (responder frequencies, >1:200,000). Despite this, the trend in anti-
donor responses in this Tol-DF group was generally reproduced, although a significant difference compared with other groups was not detected (Figure 4B).
Tolerant recipients displayed a higher ratio of expression of FoxP3 to α-1,2-mannosidase genes in peripheral blood. Whole blood gene expres-sion levels of FoxP3 and α-1,2-mannosidase, both of which have been shown to correlate with anti-donor immune reactivity after transplantation (12), were analyzed by quantitative RT-PCR (qRT-PCR) (Supplemental Figure 4). When calculating the ratio of FoxP3 to α-1,2-mannosidase expression, a significant difference was detected between Tol-DF and the CR and HC groups of the training set (Figure 5A). The patient groups displaying the highest ratio were HC, s-LP, and Tol-DF, whereas the ratio was dramati-cally lower in CR patients (Mann-Whitney U test P values for com-parisons between groups other than Tol-DF of the training and test sets are shown in Supplemental Table 2, A and B, respectively). This ratio significantly correlated with eGFR and inversely corre-lated with serum CRT (Pearson coefficients: 0.372, P = 0.002, and –0.299, P = 0.014, respectively; data not shown).
When the same analysis was performed on the test set, the ratio in Tol-DF patients was significantly higher than in all other patient groups except HCs (Figure 5B). Combining the training and test set observations shows that tolerance is associated with a high ratio of peripheral blood FoxP3 to α-1,2-mannosidase expression.
Tolerant patients exhibited a distinct gene expression profile. The RISET 2.0 custom microarray, designed with a focus on transplantation research, was assembled by the inclusion of 5,069 probes and used to analyze the expression of 4,607 genes (valid Entrez Gene ID) in peripheral blood samples.
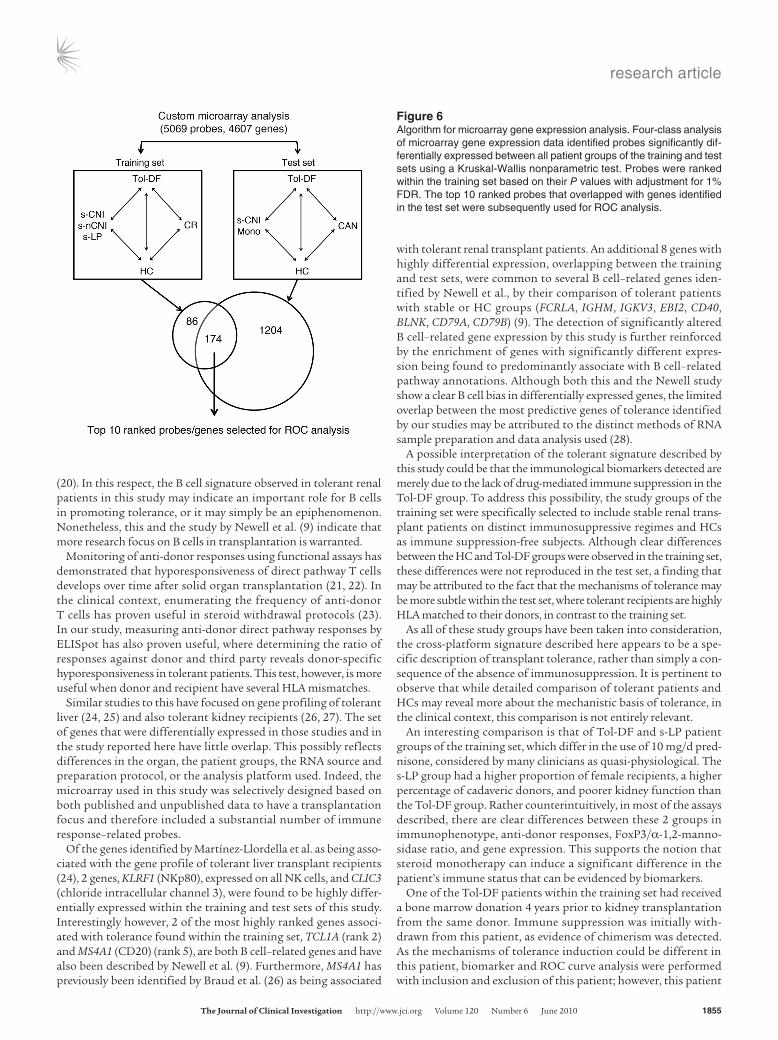
A 4-class analysis of microarray data was performed on the training set (Figure 6). Significantly altered gene expression detected between Tol-DF patients and other comparator groups, stable recipients (s-CNI, s-nCNI, and s-LP), CR patients, and HCs, was statistically determined using the Kruskal-Wallis non-parametric test with adjustment for false discovery rate (FDR) at 1% (13). The HC group was included in this analysis in order to address the lack of immune suppression in Tol-DF patients compared with the other study groups. Two hundred and sixty probes, corresponding to 255 genes, were identified as being significantly differentially expressed between the study groups (Supplemental Table 3A; median fold changes in gene expres-sion for each patient group are shown in Supplemental Figure 5A). When a similar analysis was performed on the test set, 1,378 probes, corresponding to 1,352 genes, with significantly altered expression were identified (Supplemental Table 3B and Supple-
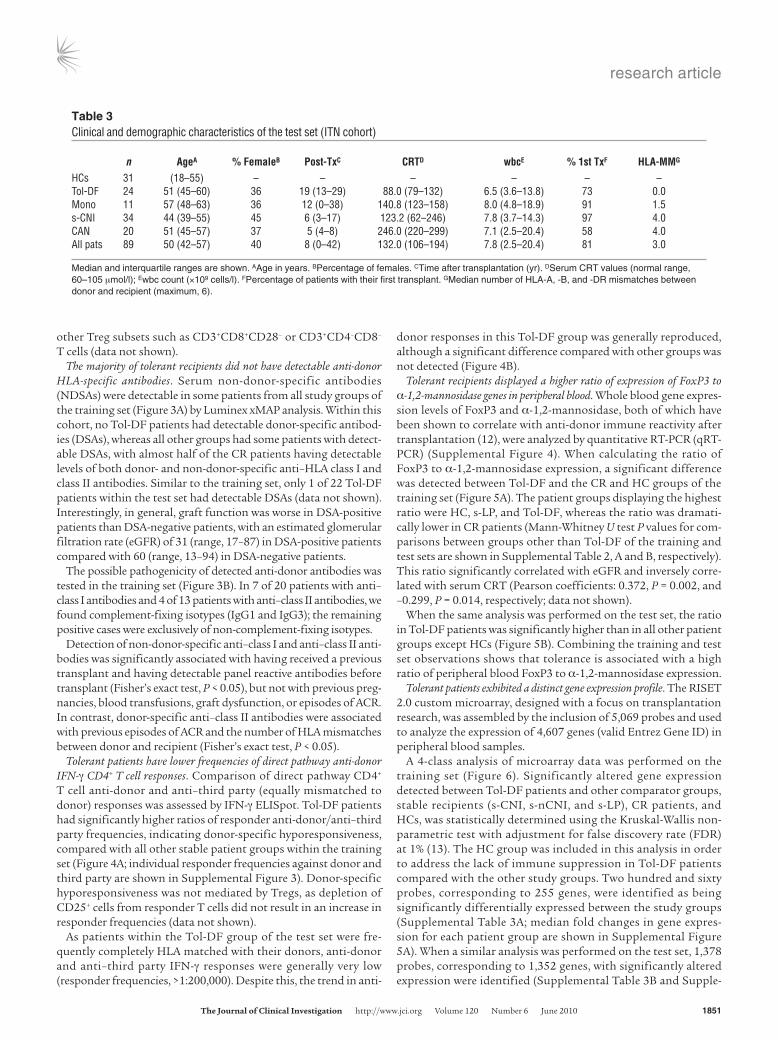
Table 3Clinical and demographic characteristics of the test set (ITN cohort)
n AgeA %FemaleB Post-TxC CRTD wbcE %1stTxF HLA-MMG
HCs 31 (18–55) – – – – – –Tol-DF 24 51 (45–60) 36 19 (13–29) 88.0 (79–132) 6.5 (3.6–13.8) 73 0.0Mono 11 57 (48–63) 36 12 (0–38) 140.8 (123–158) 8.0 (4.8–18.9) 91 1.5s-CNI 34 44 (39–55) 45 6 (3–17) 123.2 (62–246) 7.8 (3.7–14.3) 97 4.0CAN 20 51 (45–57) 37 5 (4–8) 246.0 (220–299) 7.1 (2.5–20.4) 58 4.0All pats 89 50 (42–57) 40 8 (0–42) 132.0 (106–194) 7.8 (2.5–20.4) 81 3.0
Median and interquartile ranges are shown. AAge in years. BPercentage of females. CTime after transplantation (yr). DSerum CRT values (normal range, 60–105 μmol/l); Ewbc count (×109 cells/l). FPercentage of patients with their first transplant. GMedian number of HLA-A, -B, and -DR mismatches between donor and recipient (maximum, 6).

research article
1852 TheJournalofClinicalInvestigation http://www.jci.org Volume 120 Number 6 June 2010
mental Figure 5B), with 174 probes (170 genes) found to be com-mon between the training and test sets (Supplemental Table 4). Median probe expression values for the top-ranked probes are shown in Supplemental Table 5.
Gene expression detected by microarray was reproducible by qRT-PCR. Differential gene expression detected by microarray analysis was further confirmed by qRT-PCR analysis of several probes that were highly ranked within the list and were a combination of probes detected to be either down- or upregulated. Expression of all the genes was highly correlated using both assays (Supplemental Fig-ure 6, A–E), and qRT-PCR–quantitated expression of the selected genes was significantly different compared with expression in at least one of the other patient groups, depending on the gene stud-ied (Supplemental Figure 6, F–J). Interestingly, the median expres-sion levels in Tol-DF patient samples for all selected genes was very similar in the training and test sets, although due to the higher sample number in the test set, their correlation coefficients were generally higher (Supplemental Figure 7, A–E). Furthermore, gene expression in Tol-DF patients was significantly different compared
with that in most of the other groups for 4 of 5 genes tested (Supplemental Figures 6 and 7, F–J).
Gene expression diagnostic capabilities. For a more precise quantitative approach to gene expression analysis, with the utility to distinguish tolerant from non-tolerant individuals, we employed the top-ranked genes identified by microarray analysis, excluding any overlapping probes for any single gene (e.g., TCLA-1 ranked 2 and 4, excluding probe ranked 4), in an additive binary regression model to build receiver oper-ating characteristic (ROC) curves. These probes were used to build a gene expression signature to specifically identify Tol-DF patients by first producing predicted classes (within-sample) and hence a classification for each individual.
For this analysis, 2-class ROC curves (tolerant versus non-tolerant) were built by both including and excluding the HC group from the nontolerant comparator groups. This was done because while the comparison of HCs with tolerant individuals is of interest in identifying tolerance-specific gene expression, in the context of developing a clinical diag-nostic test for tolerance in renal transplant patients, this comparison is not useful.
The corresponding ROC curve built excluding HCs (Figure 7A) and based on the expression of the top 10 ranked genes (Table 4) delivered a peak specificity and sensitivity of 1, with a threshold of 0.01, and corresponding positive predictive
and negative predictive values (PPV and NPV, respectively) of 100% within the training set (ROC including HC: threshold 0.2, specificity 0.853, sensitivity 0.923). Although 6 genes were sufficient to deliver good discrimination of tolerant patients within the training set, the top 10 ranked genes were selected for use, as they improved the specificity and sensitivity of subsequent ROC analysis of the test set (Figure 7B). Within sample analysis of the test set delivered a peak specificity of 0.890 and sensitivity of 0.806, with a threshold of 0.35, and PPV and NPV of 71% and 93%, respectively (ROC including HCs: threshold 0.23, specificity 0.801, sensitivity 0.806).
Annotation enrichment analyses on significant genes coincide between the training set and the test set. To identify significant associations of tolerance-related genes with any specific molecular pathway screened by microarray, we performed annotation enrichment analyses on the set of 174 overlapping probes identified between the training and test sets. The majority of genes found to have any significant association with annotated pathways were enriched within B cell–related pathways (Supplemental Table 6). In line with these data, of the top 11 ranked probes, corresponding to 10
Figure 1Flow cytometry analysis of peripheral blood lymphocyte subsets of renal transplant recipient groups and HCs. Flow cytometry analysis of peripheral blood lymphocyte subsets of the training (A–D) and test sets (E–H). Lymphocyte subsets were defined as follows: B cells as CD19+ lymphocytes (A and E), NK cells as CD56+CD3- lymphocytes (B and F); T cells as CD3+ lympho-cytes (C and G). Ratio of CD19+/CD3+ lymphocytes is shown (D and H). Box plots show median and interquartile range. Whiskers above and below the boxes indicate the 5th and 95th percentiles. Two-sided P values for Mann-Whitney U test com-parisons between Tol-DF patients and other groups are shown (***P < 0.001, **P < 0.01, *P < 0.05). P values for comparisons between other study groups for the training and test sets are shown in Supplemental Table 1, A and B, respectively.

research article
TheJournalofClinicalInvestigation http://www.jci.org Volume 120 Number 6 June 2010 1853
genes, 6 genes are described to be expressed by B cells or related to B cell function (Table 4). This generalized B cell signature of toler-ance is also cross-validated by Newell et al. (9). In addition to the B cell–related pathways enriched within this probe list, other path-ways were also significantly regulated, including those involving protein tyrosine kinases and generation of secondary signaling messenger molecules as well as other T cell activation–related pathways (Supplemental Table 6).
Cross-platform biomarker diagnostic capabilities. All assays described in Methods section were tested in parallel for their diagnostic abil-ity to distinguish Tol-DF patients from all other study groups. Assays performed on the test set were those that were highly pre-dictive of tolerance within the training set and are shown above. By combining bioassays and biomarkers that indicate the pres-ence of tolerance, we would expect that by using a cross-platform approach, we can significantly improve the diagnostic ability of any such individual test. This was indeed observed for the test set.
Indeed, when biomarkers and microarray data were analyzed in combination, using (a) the ratio of B to T lymphocyte subsets, (b) the percentage of CD4+CD25int T cells, (c) the ratio of anti-donor to anti–third party ELISpot frequencies, (d) the ratio of FoxP3 to α-1,2-mannosidase expression, and (e) a signature of the top 10 ranked
genes, the specificity and sensitivity for the training set was 1, with a threshold of 0.01, which implied PPV and NPV of 100% (Figure 8A).
When analyzing the test set, a peak specificity of 0.923 and a sensitivity of 0.903 were obtained, with a threshold of 0.27, and a corresponding PPV of 80%, and NPV of 96% (Figure 8B), which improved the diagnostic capacity compared with that obtained with gene expression alone.
Therefore, application of a cross-platform biomarker signature may be more capable of identifying bona fide tolerance, as in addition to gene expression and phenotype analysis, it can also take into consideration an individual’s immunological functional state, which may be more closely related to describing the mecha-nistic basis of tolerance.
Figure 2Flow cytometry analysis of CD4+ T cell expres-sion of CD25 in peripheral blood of renal trans-plant recipient groups and HCs. Flow cytome-try analysis of CD4+ T cell expression of CD25 of the training (A and B) and test set groups (C and D). Box plots show median and inter-quartile range. Whiskers above and below the boxes indicate the 5th and 95th percentiles. Percentages of CD4+ T cells with intermediate (CD4+CD25int) and high (CD4+CD25hi) CD25 expression are shown. Two-sided P values for Mann-Whitney U test comparisons between Tol-DF patients and the rest of the groups are shown (**P < 0.01, *P < 0.05). P values for comparisons between other study groups are shown in Supplemental Table 1, A and B.
Figure 3Serum analysis of donor-specific and nonspecific anti-HLA antibod-ies, and eGFR. (A) Percentage of patients per group with positive detection of serum donor–specific (DSA) and nonspecific (NDSA) anti–HLA class I (CI) and class II (CII) antibodies in the training set. (B) Renal function of patients in whom complement-fixing (IgG1, IgG3) or non-complement-fixing (IgG2, IgG4) DSAs were present (+) or absent (–). Box plots show median and interquartile range. Whiskers above and below the boxes indicate the 5th and 95th per-centiles. Two-sided P values for Mann-Whitney U test comparisons between groups are shown (*P < 0.05).

research article
1854 TheJournalofClinicalInvestigation http://www.jci.org Volume 120 Number 6 June 2010
The utility of this cross-platform biomarker signature lies in its ability to identify renal transplant patients who may be unknow-ingly operationally tolerant. As shown in Figure 8, C and D, 5 sta-ble recipients of the test set could be identified to have the tolerant signature and therefore may benefit from managed weaning from immunosuppression. Interestingly, 2 CAN patients of the test set were also identified as having a high probability of being tolerant. This finding may be explained by differences in the clinical assess-ment of chronic rejection, as unlike the CR group of the training set, CAN patients were not proven by biopsy to have immune-mediated rejection, but were defined on the basis of poor graft function. It is possible that the cross-platform biomarkers used to test these patients have sufficient sensitivity to detect subtle differ-ences between these 2 patient groups, a property that may be revealed by serial immune monitoring of patients such as these over time.
DiscussionIn this study we have developed a cross-platform set of biomarkers that distinguish tolerant renal transplant recipients from patients with stable renal function under different degrees of immunosuppression, patients undergoing chronic rejection, and HCs. Biomarkers identified in a train-ing set of tolerant patients have been validated in an independent test set.
Both this study and that of Newell et al. (9) have found an expansion of B and NK cells in peripheral blood of drug-free tolerant recipients, which is
similar to the findings of a previous study on a smaller cohort of similar patients (14). Not only do our findings extend earlier observa-tions, but they also highlight the value of an altered T/B cell ratio as a biomarker of transplantation tolerance. Microarray analy-sis also revealed a clear and strong B cell bias of genes with altered expression between Tol-DF and the other groups. Whereas the role of T cells in initiating and maintain-ing allograft rejection (15, 16) and tolerance (17) has been clearly established, the role of B cells and the mechanisms whereby they may contribute to the tolerant state have yet to be elucidated. Interestingly, a murine study of transplantation tolerance induced by anti-CD45RB therapy has shown a mech-anistic role for B cells (18). Recent data have also shown the ability of naive B cells, follow-ing antigen-specific cognate interactions, to induce Tregs that inhibit graft rejection in a murine model of heart transplanta-tion (19). While no significant increase in Br-1 (IL-10–producing B cells) was detected in any patient group within this study, the data presented here show altered ratios of B cell transitional and memory populations,
a relative increase in TGF-β–producing B cells, and absence of serum donor-specific antibodies and donor-specific direct T cell hyporesponsiveness in tolerant recipients. These observations allow speculation that renal transplant tolerance may be associated with alterations in both T cell– and B cell–mediated functions. Given the essential role of antigen-specific B cell–T cell help, this would be an anticipated finding, although no correlation between anti-donor IFN-γ ELISpot responder frequencies and the presence/absence of donor-specific antibodies was detected within other study groups (data not shown). However, Porcheray et al., studying both B cell and T cell immunity in combined kidney and bone marrow trans-plant recipients, recently demonstrated the uncoupling of T cell and B cell anti-donor immunity in some of their tolerant patients
Figure 4Detection of donor-specific hyporesponsiveness in renal transplant study groups by IFN-γ ELISpot analysis. IFN-γ ELISpots were used to detect direct pathway alloresponses in patients of the (A) training and (B) test sets. The number of IFN-γ–producing cells in recipient CD4+ T cells was calculated (background-deducted) when stimulated with donor cells and third-party cells (3rdP), to obtain a frequency of responder cells (1 responder/n cells). Box plots show median and interquartile range. Whiskers above and below the boxes indicate the 5th and 95th percentiles. Ratio of responder frequencies on donor/3rdP stimulation are shown. Ratio values greater than 1.5 indicate hyporesponsiveness to donor. Two-sided P values for Mann-Whitney U test comparisons between groups are shown (**P < 0.01, *P < 0.05). Individual patient IFN-γ ELISpot responder frequencies to donor and third party are shown in Supplemental Figure 3. ζ, Wilcoxon test between donor and 3rdP frequencies, P < 0.05.
Figure 5Ratio of FOXP3 to α-1,2-mannosidase (MAN1A2) expression assessed by qRT-PCR gene expres-sion analysis of peripheral blood. A ratio of the expression values of FOXP3 and MAN1A2 in periph-eral blood, determined by qRT-PCR, was calculated for patients of the training set (A) and test set (B). Box plots show median and interquartile range. Whiskers above and below the boxes indicate the 5th and 95th percentiles. Two-sided P values for Mann-Whitney U test comparisons between Tol-DF and other groups are shown (***P < 0.001, **P < 0.01). Statistical values for comparisons between other study groups are shown in Supplemental Table 2, A and B.
research article
TheJournalofClinicalInvestigation http://www.jci.org Volume 120 Number 6 June 2010 1855
(20). In this respect, the B cell signature observed in tolerant renal patients in this study may indicate an important role for B cells in promoting tolerance, or it may simply be an epiphenomenon. Nonetheless, this and the study by Newell et al. (9) indicate that more research focus on B cells in transplantation is warranted.
Monitoring of anti-donor responses using functional assays has demonstrated that hyporesponsiveness of direct pathway T cells develops over time after solid organ transplantation (21, 22). In the clinical context, enumerating the frequency of anti-donor T cells has proven useful in steroid withdrawal protocols (23). In our study, measuring anti-donor direct pathway responses by ELISpot has also proven useful, where determining the ratio of responses against donor and third party reveals donor-specific hyporesponsiveness in tolerant patients. This test, however, is more useful when donor and recipient have several HLA mismatches.
Similar studies to this have focused on gene profiling of tolerant liver (24, 25) and also tolerant kidney recipients (26, 27). The set of genes that were differentially expressed in those studies and in the study reported here have little overlap. This possibly reflects differences in the organ, the patient groups, the RNA source and preparation protocol, or the analysis platform used. Indeed, the microarray used in this study was selectively designed based on both published and unpublished data to have a transplantation focus and therefore included a substantial number of immune response–related probes.
Of the genes identified by Martínez-Llordella et al. as being asso-ciated with the gene profile of tolerant liver transplant recipients (24), 2 genes, KLRF1 (NKp80), expressed on all NK cells, and CLIC3 (chloride intracellular channel 3), were found to be highly differ-entially expressed within the training and test sets of this study. Interestingly however, 2 of the most highly ranked genes associ-ated with tolerance found within the training set, TCL1A (rank 2) and MS4A1 (CD20) (rank 5), are both B cell–related genes and have also been described by Newell et al. (9). Furthermore, MS4A1 has previously been identified by Braud et al. (26) as being associated
with tolerant renal transplant patients. An additional 8 genes with highly differential expression, overlapping between the training and test sets, were common to several B cell–related genes iden-tified by Newell et al., by their comparison of tolerant patients with stable or HC groups (FCRLA, IGHM, IGKV3, EBI2, CD40, BLNK, CD79A, CD79B) (9). The detection of significantly altered B cell–related gene expression by this study is further reinforced by the enrichment of genes with significantly different expres-sion being found to predominantly associate with B cell–related pathway annotations. Although both this and the Newell study show a clear B cell bias in differentially expressed genes, the limited overlap between the most predictive genes of tolerance identified by our studies may be attributed to the distinct methods of RNA sample preparation and data analysis used (28).
A possible interpretation of the tolerant signature described by this study could be that the immunological biomarkers detected are merely due to the lack of drug-mediated immune suppression in the Tol-DF group. To address this possibility, the study groups of the training set were specifically selected to include stable renal trans-plant patients on distinct immunosuppressive regimes and HCs as immune suppression-free subjects. Although clear differences between the HC and Tol-DF groups were observed in the training set, these differences were not reproduced in the test set, a finding that may be attributed to the fact that the mechanisms of tolerance may be more subtle within the test set, where tolerant recipients are highly HLA matched to their donors, in contrast to the training set.
As all of these study groups have been taken into consideration, the cross-platform signature described here appears to be a spe-cific description of transplant tolerance, rather than simply a con-sequence of the absence of immunosuppression. It is pertinent to observe that while detailed comparison of tolerant patients and HCs may reveal more about the mechanistic basis of tolerance, in the clinical context, this comparison is not entirely relevant.
An interesting comparison is that of Tol-DF and s-LP patient groups of the training set, which differ in the use of 10 mg/d pred-nisone, considered by many clinicians as quasi-physiological. The s-LP group had a higher proportion of female recipients, a higher percentage of cadaveric donors, and poorer kidney function than the Tol-DF group. Rather counterintuitively, in most of the assays described, there are clear differences between these 2 groups in immunophenotype, anti-donor responses, FoxP3/α-1,2-manno-sidase ratio, and gene expression. This supports the notion that steroid monotherapy can induce a significant difference in the patient’s immune status that can be evidenced by biomarkers.
One of the Tol-DF patients within the training set had received a bone marrow donation 4 years prior to kidney transplantation from the same donor. Immune suppression was initially with-drawn from this patient, as evidence of chimerism was detected. As the mechanisms of tolerance induction could be different in this patient, biomarker and ROC curve analysis were performed with inclusion and exclusion of this patient; however, this patient
Figure 6Algorithm for microarray gene expression analysis. Four-class analysis of microarray gene expression data identified probes significantly dif-ferentially expressed between all patient groups of the training and test sets using a Kruskal-Wallis nonparametric test. Probes were ranked within the training set based on their P values with adjustment for 1% FDR. The top 10 ranked probes that overlapped with genes identified in the test set were subsequently used for ROC analysis.

research article
1856 TheJournalofClinicalInvestigation http://www.jci.org Volume 120 Number 6 June 2010
did not appear as an outlier within the tolerant group in any of the assays in the study.
The utility of this tolerant signature depends on its ability to identify transplant recipients that can safely be weaned from immunosuppression. We have now developed a specific and sensi-tive set of reproducible assays that, when combined, can identify tolerant renal allograft recipients and also several renal transplant recipients on immunosuppressive drugs. Validation of these bio-markers and bioassays has been achieved using a completely inde-pendent set of patients, and this validation is reinforced by the fact that the test set was derived from a genetically different popula-tion and that there were also differences in the collection and pro-cessing of test set and training set samples. However, before these cross-platform biomarkers can be implemented as a decisional tool in the clinical setting, the findings of this study are being car-ried forward into a larger observational clinical study of immune monitoring in an independent cohort of renal transplant recipi-ents (www.transplant-tolerance.org.uk). This signature provides a model for future immunosuppression minimization protocols, which in combination with immune monitoring of emerging bio-markers of rejection (29, 30) may allow for tailored and safe clini-cal posttransplantation management of renal allograft recipients.
MethodsTraining set description. This cohort of patients, recruited by the IOT net-work, consisted of 71 kidney transplant recipients and 19 age- and sex-matched HCs. Five patient groups were included: 11 functionally stable kidney transplant recipients (serum CRT, <160 μmol/l; and <10% rise in the last 12 months) despite having stopped all their immunosuppression
for more than 1 year (Tol-DF); 11 patients with stable renal function (same criteria) maintained on less than 10 mg/d prednisone as the only immu-nosuppressive agent (s-LP); 10 patients maintained on “full” immunosup-pression (azathioprine and prednisone) in the absence of a calcineurin inhibitor since transplantation (s-nCNI); 30 patients maintained on stan-dard calcineurin inhibitor therapy (s-CNI); 9 patients with biopsy-proven (all reevaluated for this study) and immunologically driven chronic rejec-tion (CR). Patient clinical characteristics are described in Table 1. eGFR was calculated from serum creatinine by the Modification of Diet in Renal Disease (MDRD) equation (http://nephron.org/mdrd_gfr_si).
Approval of the study protocol was obtained from the Hammersmith and St Mary’s Research Ethics Committee (REC), which was the main study REC (application: 2002/6378), and from the RECs of all other Euro-pean recruitment sites. All participants in this study provided informed consent. All samples were processed and analyzed in a blinded fashion.
Test set description. An independent set of kidney transplant recipients were recruited in the United States through the ITN study; some of these patients were included and described by Newell et al. (9). The protocol was approved by the institutional review board of each participating center and by a data safety monitoring board convened by the NIAID. The cohort con-sisted of (a) Tol-DF (n = 24) patients, functionally stable kidney transplant recipients (serum CRT within 25% of baseline) despite having stopped all immunosuppression for more than 1 year; (b) “Mono” patients (n = 11) with stable renal function who were maintained on monotherapy with steroids; (c) s-CNI subjects (n = 34), with clinically stable renal function using the same criteria as Tol-DF patients while on maintenance with a triple drug immunosuppressive regimen (including a calcineurin or mTOR inhibitor, an anti-proliferative agent, and corticosteroids); and (d) CAN participants (n = 20), defined as those with chronic allograft nephropathy
Figure 7ROC curve generation using highest-ranked genes identified by microarray analysis. ROC curves of the training (A) and test sets (B) generated using up to 10 highest-ranked genes (black lines). Significant differential gene expression was detected by microarray analysis of peripheral blood. Using a binary regression model for classification ROC curves (Tol-DF vs. nontolerant groups, excluding HCs) were generated using the top 10 ranked significant genes identified by 4-class Kruskal-Wallis analysis of microarray data. Genes were ranked within the training set based on their P value with 1% FDR. The same 2-class model was used to assess the diagnostic capabilities of the same genes to detect Tol-DF recipients within the test set. Sens., sensitivity; Spec., specificity.
research article
TheJournalofClinicalInvestigation http://www.jci.org Volume 120 Number 6 June 2010 1857
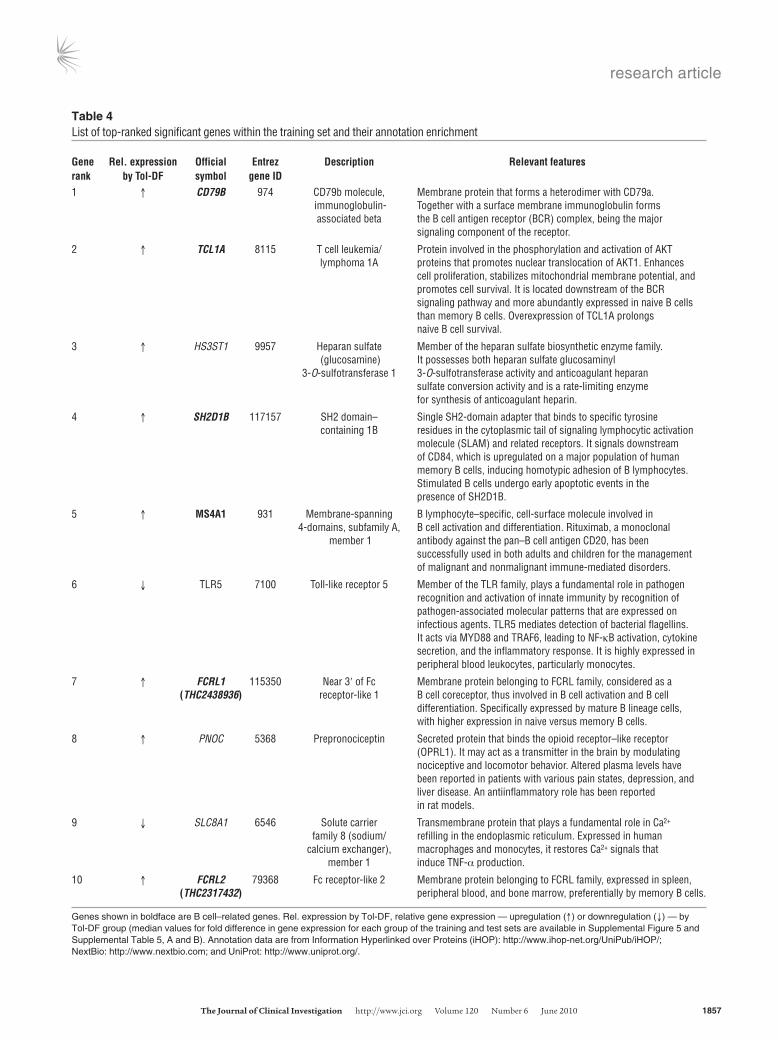
Table 4List of top-ranked significant genes within the training set and their annotation enrichment
Gene Rel.expression Official Entrez Description Relevantfeaturesrank byTol-DF symbol geneID1 ↑ CD79B 974 CD79b molecule, Membrane protein that forms a heterodimer with CD79a. immunoglobulin- Together with a surface membrane immunoglobulin forms associated beta the B cell antigen receptor (BCR) complex, being the major signaling component of the receptor.
2 ↑ TCL1A 8115 T cell leukemia/ Protein involved in the phosphorylation and activation of AKT lymphoma 1A proteins that promotes nuclear translocation of AKT1. Enhances cell proliferation, stabilizes mitochondrial membrane potential, and promotes cell survival. It is located downstream of the BCR signaling pathway and more abundantly expressed in naive B cells than memory B cells. Overexpression of TCL1A prolongs naive B cell survival.
3 ↑ HS3ST1 9957 Heparan sulfate Member of the heparan sulfate biosynthetic enzyme family. (glucosamine) It possesses both heparan sulfate glucosaminyl 3-O-sulfotransferase 1 3-O-sulfotransferase activity and anticoagulant heparan sulfate conversion activity and is a rate-limiting enzyme for synthesis of anticoagulant heparin.
4 ↑ SH2D1B 117157 SH2 domain– Single SH2-domain adapter that binds to specific tyrosine containing 1B residues in the cytoplasmic tail of signaling lymphocytic activation molecule (SLAM) and related receptors. It signals downstream of CD84, which is upregulated on a major population of human memory B cells, inducing homotypic adhesion of B lymphocytes. Stimulated B cells undergo early apoptotic events in the presence of SH2D1B.
5 ↑ MS4A1 931 Membrane-spanning B lymphocyte–specific, cell-surface molecule involved in 4-domains, subfamily A, B cell activation and differentiation. Rituximab, a monoclonal member 1 antibody against the pan–B cell antigen CD20, has been successfully used in both adults and children for the management of malignant and nonmalignant immune-mediated disorders.
6 ↓ TLR5 7100 Toll-like receptor 5 Member of the TLR family, plays a fundamental role in pathogen recognition and activation of innate immunity by recognition of pathogen-associated molecular patterns that are expressed on infectious agents. TLR5 mediates detection of bacterial flagellins. It acts via MYD88 and TRAF6, leading to NF-κB activation, cytokine secretion, and the inflammatory response. It is highly expressed in peripheral blood leukocytes, particularly monocytes.
7 ↑ FCRL1 115350 Near 3ʹ of Fc Membrane protein belonging to FCRL family, considered as a (THC2438936) receptor-like 1 B cell coreceptor, thus involved in B cell activation and B cell differentiation. Specifically expressed by mature B lineage cells, with higher expression in naive versus memory B cells.
8 ↑ PNOC 5368 Prepronociceptin Secreted protein that binds the opioid receptor–like receptor (OPRL1). It may act as a transmitter in the brain by modulating nociceptive and locomotor behavior. Altered plasma levels have been reported in patients with various pain states, depression, and liver disease. An antiinflammatory role has been reported in rat models.
9 ↓ SLC8A1 6546 Solute carrier Transmembrane protein that plays a fundamental role in Ca2+ family 8 (sodium/ refilling in the endoplasmic reticulum. Expressed in human calcium exchanger), macrophages and monocytes, it restores Ca2+ signals that member 1 induce TNF-α production.
10 ↑ FCRL2 79368 Fc receptor-like 2 Membrane protein belonging to FCRL family, expressed in spleen, (THC2317432) peripheral blood, and bone marrow, preferentially by memory B cells.
Genes shown in boldface are B cell–related genes. Rel. expression by Tol-DF, relative gene expression — upregulation (↑) or downregulation (↓) — by Tol-DF group (median values for fold difference in gene expression for each group of the training and test sets are available in Supplemental Figure 5 and Supplemental Table 5, A and B). Annotation data are from Information Hyperlinked over Proteins (iHOP): http://www.ihop-net.org/UniPub/iHOP/; NextBio: http://www.nextbio.com; and UniProt: http://www.uniprot.org/.

research article
1858 TheJournalofClinicalInvestigation http://www.jci.org Volume 120 Number 6 June 2010
and impaired renal function (50% increase in their baseline CRT at the time of enrollment relative to their initial posttransplantation baseline) due to presumed immune-mediated allograft rejection. An additional group of 31 HC volunteers with no known history of renal disease/dysfunction or evidence of acute medical illness was enrolled. Group characteristics are summarized in Table 3.
Whole blood mRNA and frozen PBMCs were received by laboratories performing the selected validation assays described.
Blood samples. The training set samples were processed in all cases within 24 hours of venesection. PBMCs were obtained by density gradient centrif-
ugation using Lymphocyte Separation Medium (PAA Laboratories). Cells were washed and resuspended in 10% DMSO (Sigma-Aldrich) and human serum (BioWest) and frozen immediately at –80°C. After 24 hours cells were transferred into liquid nitrogen and kept until use.
Flow cytometry on PBMCs. Thawed PBMCs were washed and resuspended at 1 × 10⁶/ml. Titrated amounts of fluorochrome-conjugated monoclonal antibodies were used to identify leukocytes, CD45+CD14– for lymphocytes, CD3+ for T cells, CD19+ for B cells, CD56+CD3– for NK cells, CD4+CD3+ for CD4+ T cells, CD8+CD3+ for CD8+ T cells. B cell subsets were defined as previously described (31) as CD19+CD27+IgD–CD24+CD38–/int for late
Figure 8ROC curve generation combining cross-platform biomarkers. ROC curves of the training set (A) and test set (B) generated using cross-platform biomarkers and genes identified by microarray analysis. Two-class ROC curves (Tol-DF vs. nontolerant groups, excluding HCs) were generated using 4 biomarkers: B/T lymphocyte ratio, percent CD4+CD25int, ratio of anti-donor/anti-3rdP ELISpot frequencies, and ratio of FOXP3/MAN1A2 expression, combined with sequential addition of the 10 most significant genes. Estimated probabilities of patients from each study group of the training set (C) and test set (D) being classified as tolerant based on the cross-platform biomarker signature of tolerance (4 biomarkers plus 10 genes), calculated using a binary regression procedure.

research article
TheJournalofClinicalInvestigation http://www.jci.org Volume 120 Number 6 June 2010 1859
memory B cells, CD19+CD27–CD24intCD38int for naive/mature B cells, and CD19+CD27–CD24+CD38hi for T1/T2 transitional B cells (all from Caltag). Cells were fixed with 1% paraformaldehyde/PBS and data acquired on a FACScalibur (BD) within 48 hours. CD25 expression was studied on CD4+ T cells as described in ref. 32. B cell production of TGF-β, IL-10, and IFN-γ (all from eBioscience) was assessed by intracellular cytokine staining on in vitro stimulated PBMCs with 500 ng/ml phorbol 12-myristate 13-acetate and 1 μM ionomycin in the presence of 2 μM monensin and 10 μg/ml brefeldin A for 5 hours at 37°C. A minimum of 10,000 CD19+ events were acquired for each sample.
Anti-donor antibody detection. Peripheral blood was collected in clotting activator vacutainers (BD) and allowed to clot for a minimum of 2 and a maximum of 24 hours. Samples were centrifuged and collected serum stored at –80°C until use.
Screening for IgG anti-HLA antibodies of any specificity by xMAP (Luminex) tech-nology. Screening was performed as previously described (33). After wash-ing, HLA-coated Luminex screening beads and 12.5 μl of patient serum or control serum were added on a plate and mixed gently for 30 minutes in the dark. Plates were washed 3 times and PE-conjugated goat anti-human IgG (1:10) added to each test well. Plates were incubated for 1 hour, wash buffer was added, and then data were collected using the Luminex 100 instrument, as recommended by the manufacturer.
Screening for IgG subclass and anti-HLA broad specificity. Positive sera were tested for IgG subclass identification and class I and class II broad specific-ity distinction. Screening was performed using class I and II Luminex iden-tification kits (Quest Biomedical). Secondary antibodies used for detection of bound patient antibodies were as follows: anti-human IgG1 conjugated to biotin (clone 8c/6–39, Sigma-Aldrich), anti-human IgG2 conjugated to biotin (clone HP-6014, Sigma-Aldrich), anti-human IgG3 conjugated to biotin (clone HP-6050, Sigma-Aldrich), anti-human IgG4 conjugated to biotin (clone HP-6050, Sigma-Aldrich), and streptavidin-PE (Calbiochem).
Cell fractions for functional assays. PBMCs were thawed on the day of the assay. T cell subsets CD4+ and CD4+CD25– (CD4+ depleted of CD25+ cells) were separated using standard methods of negative immune isolation as previously described (34). Purity was verified by flow cytometry.
Donor, surrogate donor, and third-party cells. Cells from the 31 living kidney donors were used for the 71 donor-specific cellular assays on the train-ing set, and 28 of 64 cell samples on the test set. Where donor blood was unavailable, surrogate donor cells were obtained. These cells and similarly mismatched third-party cells were used from: healthy volunteers from the Anthony Nolan bone marrow registry, HLA-typed healthy volunteers and splenocytes collected at the time of cadaveric donation at the Hammer-smith and Guy’s Hospitals in London.
Similarly mismatched third-party cells were selected by the number of HLA mismatches for class II (HLA-DR and HLA-DQ) when compared with the relevant donor and recipient.
Mixed lymphocyte reaction cultures for ELISpot. Human IFN-γ ELISpotPRO (Mabtech) kits were used and developed according to the manufacturer’s instructions. Background-deducted positive spots were enumerated using an automatic image analyzer for ELISpot plates (AID). Quantitative assess-ment of direct pathway donor antigen–specific responder T cell frequen-cies was made by stimulating recipient CD4+ T cells with T cell– and NK cell–depleted PBMCs (APCs) separated from either donor PBMCs or HLA-typed third-party cells. Allogeneic mixed lymphocyte reaction cultures were performed over 24 hours. Duplicates were set up with 3 doubling dilutions starting typically at 2 × 10⁵ responder cells per well. The ratio of stimulator to responder cells was kept constant by always using half the number of APCs compared with the number of responder cells used in the top dilu-tion, typically 1 × 10⁵ responders per well. Donor reactivity was expressed as a ratio of frequency to donor and frequency to third party. The inverse
of the frequency was recorded in the database (i.e., 1 in 54,000 cells was recorded as 54,000); therefore, ratio values greater than 1.5 were defined as indicating a hyporesponse to donor stimulation.
Blood sampling for gene expression analysis. For the training set cohort, peripheral vein blood was drawn directly into PAXgene Blood RNA tubes (QIAGEN). Whole blood RNA was extracted using the PAXgene Blood RNA Kit including DNAse I treatment (QIAGEN).
For the test set cohort, peripheral vein blood was drawn directly into Tem-pus Blood RNA tubes (Applied Biosystems Inc.). Whole blood RNA was extracted according to the manufacturer’s instructions (9). Total RNA sam-ples were subjected to gene expression analysis by RT-PCR and microarrays.
Samples for mRNA studies. Ninety-five samples from the training set were used, consisting of 13 samples from 10 Tol-DF patients, 16 samples from 11 s-LP patients, 8 samples from 8 s-nCNI patients, 40 samples from 28 s-CNI patients, 10 samples from 9 CR patients, and 8 samples from 8 HCs.
As the test set, 142 samples from the ITN cohort were used, consisting of 31 samples from 23 Tol-DF patients, 14 samples from 11 Mono patients, 52 samples from 34 s-CNI patients, 25 samples from 18 CAN patients, and 20 samples from 20 HCs.
RNA quality control. Quality and integrity of PAXgene (training set) and Tempus-purified (test set) RNA were determined using the Agilent RNA 6000 Nano Kit on the Agilent 2100 Bioanalyzer (Agilent Technologies). RNA was quantified by measuring absorbance at 260 nm on the ND-1000 Spectrophotometer (NanoDrop Technologies).
RNA amplification and labeling. Sample labeling was performed as detailed in ref. 35. Briefly, 0.5 μg total RNA was used for the amplifica-tion and labeling steps using the Agilent Low RNA Input Linear Amp Kit (Agilent Technologies) in the presence of cyanine 3-CTP. Yields of cRNA and the dye incorporation rate were measured with the ND-1000 Spectrophotometer (Thermo Scientific).
Hybridization of RISET 2.0 Agilent custom microarrays. All whole blood sam-ples were hybridized on the RISET 2.0 microarray platform. This is a cus-tom Agilent 8 × 15K 60-mer oligonucleotide microarray comprising 5,069 probes represented in triplicate. Probes selected corresponded to 4,607 genes with a valid Entrez Gene ID and an additional 407 probes that could not be assigned to a valid Entrez Gene ID. The microarray is focused on the detection of genes relevant in the field of transplantation and was designed based on current literature and published and unpublished data provided by RISET consortium partners. Probe design was optimized for the detec-tion of multiple transcript variants of a gene, on optimized hybridization properties of the probes, and avoiding cross-hybridization.
The hybridization procedure was performed after control of RNA qual-ity and integrity and according to ref. 35 using the Agilent Gene Expres-sion Hybridization Kit (Agilent Technologies). Briefly, 0.6 μg Cy3-labeled fragmented cRNA in hybridization buffer was hybridized overnight (17 hours, 65°C) to RISET 2.0 microarrays. Following hybridization, the microarrays were washed once with Agilent Gene Expression Wash Buffer 1 for 1 minute at room temperature, followed by a second wash with pre-heated (37°C) Agilent Gene Expression Wash Buffer 2 containing 0.005% N-lauroylsarcosine for 1 minute. The last washing step was performed with acetonitrile for 30 seconds.
Scanning and data analysis. Fluorescence signals of the Agilent Microarrays were detected using Agilent’s Microarray Scanner System (Agilent Technol-ogies Inc.). The Agilent Feature Extraction Software (FES version 9.5.1.1) was used to read out and process the microarray image files. To determine differential gene expression, FES-derived output data files were further analyzed using the Rosetta Resolver gene expression data analysis system (version 7.1.0.2., Rosetta Inpharmatics LLC).
First, an artificial common reference was computed from all samples included in the IOT dataset. Using this baseline, log2 ratios were calculated
research article
1860 TheJournalofClinicalInvestigation http://www.jci.org Volume 120 Number 6 June 2010
for each gene and sample. Additionally, P values indicating the reliability of an observed difference between a sample and the common reference were calculated for each gene, applying the universal error model implemented in the Rosetta Resolver software (36).
Annotation enrichment analysis. Lists of genes found to be discriminatory between different sample groups, and common to both study sets, were analyzed for a statistically significant enrichment of biological pathway annotation terms in comparison to the complete RISET 2.0 microarray configuration. Term enrichment relative to the expected background dis-tribution was scored using Fisher’s exact test. Annotations were derived from different sources, e.g., Gene Ontology (GO, www.geneontology.org), signaling pathway membership, sequence motifs, chromosomal proximity, literature keywords, and cell-specific marker genes.
The data discussed in this publication have been deposited in NCBI’s Gene Expression Omnibus (37) and are accessible through GEO Series accession number GSE14655 (http://www.ncbi.nlm.nih.gov/geo/query/acc.cgi?acc=GSE14655).
Quantitative RT-PCR analysis. Whole blood total RNA (200 ng) was reverse transcribed using the QPCR First-Strand Synthesis Kit (Stratagene), and synthesized cDNA was subjected to RT-PCR analysis.
Microarray data validation. A selected set of genes identified by microarray gene expression analysis were validated by qRT-PCR. qRT-PCR was performed for the following genes using pre-made TaqMan panels from Applied Biosys-tems: Hs01017452_m1 B lymphoid tyrosine kinase (BLK), Hs00236881_m1 CD79b molecule (CD79b), Hs01099196_m1 heparan sulfate (glucosamine) 3-O-sulfotransferase 1 (HS3ST1), Hs01592483_m1 SH2 domain containing 1B (SH2D1B), Hs00172040_m1 T cell leukemia (TCL1A).
Other assays screened in the training set. We also performed indirect pathway IFN-γ ELISpot, direct and indirect pathway trans-vivo delayed-type hyper-sensitivity assays, RT-PCR amplification for cytokine genes on direct and indirect pathway cultures of donor and recipient cells, and TCR-repertoire profiling by TCR landscape analysis.
Statistics. Nonparametric tests were used to estimate statistical signifi-cance, as n < 20 in many group comparisons and data did not conform to a normal distribution. Wilcoxon signed-rank test was used to compare responses within the same group of patients. Mann-Whitney U tests were used to compare medians between patient groups. To compare associa-tions between clinical variables, usually recorded as categorical data and the presence or absence of anti-HLA antibodies, we used Fisher’s exact test. Two-sided P values were used to indicate a significant difference when it was less than 0.05.
Statistical analysis of microarrays and biomarkers. Significantly altered expres-sion detected by microarray was statistically determined using 4-class anal-ysis and the Kruskal-Wallis test with Benjamini-Hochberg adjustment for FDR at 1%. We chose a nonparametric test for this analysis, as the data in some cases appeared to deviate from normality. A similar procedure was used to rank the biomarkers (tested on the log scale, with missing values set equal to the sample-wide mean).
To evaluate the predictive power of a number of variables to detect toler-ant patients, we used ROC curves. To build these, first 4-class analysis iden-
tified differentially expressed probes of Tol-DF within the training set and were ranked using the Kruskal-Wallis test. Then the top-most significantly differentially expressed probes were added in a binary regression model and used to perform classification within sample. The binary regression procedure was used to compute probabilities p[1], . . . ,p[n] of being a Tol-DF patient for each subject. The ROC curve was produced by varying a probability threshold between 0 and 1; for each value of the threshold t, a 2 × 2 classification table of actual class versus predicted class for subject i was set equal to “Tol-DF” if p[i] > t. Bootstrap resampling of the subjects indi-cated that the within-sample classification results were robust. For the ITN test set, the same probes from the training set analysis were used.
AcknowledgmentsThis study was initially funded by EU (QLRT–2002–02127) and Immune Tolerance Network (ITN503ST) grants. Validation assays were funded by the RISET consortium (512090 IP, of EU FP6). B cell analysis work was funded by MRC (G0801537/ID: 88245) and Guy’s and St Thomas’s Charity grants (no. 080530). M.P. Her-nandez-Fuentes, P. Sagoo, E. Perucha, I. Rebollo-Mesa, and G.M. Lord acknowledge financial support from the Department of Health via National Institute for Health Research (NIHR) compre-hensive Biomedical Research Centre award to Guy’s and St Thom-as’ NHS Foundation Trust in partnership with King’s College London and King’s College Hospital NHS Foundation Trust. B. Sawitzki and H.-D. Volk were partly funded by the Deutsche Forsc-hungsgemeinschaft (DFG-SFB 650). Many thanks go to Laurence Turka for scientific discussions and critical reading of the manu-script. Thanks also go to the Indices of Tolerance study adminis-trator, Sharon Hughes, and all collaborating physicians (Richard Baker, Juan Bravo, Sue Carr, Fritz Dickman, Sui Phin Kon, Phil Mason, Will McKane, Markus Mohaupt, Herve Le Monies, Ondrej Viklický, Giuseppe Orlando, Evangeline Pillebout, Jo Taylor, Mar-tin Wissing, and Alan Watson). Many thanks also go to healthy volunteers from the Anthony Nolan bone marrow registry, Paul Brookes and colleagues at Hammersmith Hospital Tissue-Typing, and Robert Vaughan and colleagues at Guy’s Hospital Immuno-genetics. Thanks also go to Hartmut Scheel for his contribution toward annotation enrichment analysis (Miltenyi Biotec GmbH). Further, we acknowledge Carmen Fuentes Bol for statistical advice throughout this study.
Received for publication May 20, 2009, and accepted in revised form March 16, 2010.
Address correspondence to: Maria Hernandez-Fuentes, Senior Fellow in Translational Research, King’s College London, Depart-ment of Nephrology and Transplantation, MRC Centre for Transplantation, Guy’s Hospital, London SE1 9RT, United King-dom. Phone: 44.0.20718.85435; Fax: 44.0.20718.83638; E-mail: [email protected].
1. Christensen LL, Grunnet N, Rudiger N, Moller B, Birkeland SA. Indications of immunological tol-erance in kidney transplantation. Tissue Antigens. 1998;51(6):637–644.
2. Owens ML, Maxwell JG, Goodnight J, Wolcott MW. Discontinuance of immunosuppression in renal trans-plant patients. Arch Surg. 1975;110(12):1450–1451.
3. Roussey-Kesler G, et al. Clinical operational toler-ance after kidney transplantation. Am J Transplant. 2006;6(4):736–746.
4. Uehling DT, Hussey JL, Weinstein AB, Wank R, Bach FH. Cessation of immunosuppression after renal
transplantation. Surgery. 1976;79(3):278–282. 5. Strober S, Benike C, Krishnaswamy S, Engleman
EG, Grumet FC. Clinical transplantation toler-ance twelve years after prospective withdrawal of immunosuppressive drugs: studies of chime-rism and anti-donor reactivity. Transplantation. 2000;69(8):1549–1554.
6. Takatsuki M, et al. Weaning of immunosuppres-sion in living donor liver transplant recipients. Transplantation. 2001;72(3):449–454.
7. Lerut J, Sanchez-Fueyo A. An appraisal of toler-ance in liver transplantation. Am J Transplant.
2006;6(8):1774–1780. 8. Padiyar A, Akoum FH, Hricik DE. Management
of the kidney transplant recipient. Prim Care. 2008;35(3):433–450, v.
9. Newell KA, et al. Identification of a B cell signa-ture associated with renal transplant tolerance in humans. J Clin Invest. 2010;120(6):1836–1847.
10. Miyara M, et al. Functional delineation and dif-ferentiation dynamics of human CD4+ T cells expressing the FoxP3 transcription factor. Immu-nity. 2009;30(6):899–911.
11. Shevach EM. Certified professionals: CD4(+)CD25(+)

research article
TheJournalofClinicalInvestigation http://www.jci.org Volume 120 Number 6 June 2010 1861
suppressor T cells. J Exp Med. 2001;193(11):F41–F46. 12. Sawitzki B, et al. Identification of gene markers for
the prediction of allograft rejection or permanent acceptance. Am J Transplant. 2007;7(5):1091–1102.
13. Strimmer K. A unified approach to false discovery rate estimation. BMC Bioinformatics. 2008;9:303.
14. Louis S, et al. Contrasting CD25hiCD4+T cells/FOXP3 patterns in chronic rejection and opera-tional drug-free tolerance. Transplantation. 2006; 81(3):398–407.
15. Afzali B, Lombardi G, Lechler RI, Lord GM. The role of T helper 17 (Th17) and regulatory T cells (Treg) in human organ transplantation and autoimmune disease. Clin Exp Immunol. 2007;148(1):32–46.
16. Ely LK, Burrows SR, Purcell AW, Rossjohn J, McCluskey J. T-cells behaving badly: structural insights into alloreactivity and autoimmunity. Curr Opin Immunol. 2008;20(5):575–580.
17. Lechler RI, Garden OA, Turka LA. The complemen-tary roles of deletion and regulation in transplanta-tion tolerance. Nat Rev Immunol. 2003;3(2):147–158.
18. Deng S, et al. Cutting edge: transplant tolerance induced by anti-CD45RB requires B lymphocytes. J Immunol. 2007;178(10):6028–6032.
19. Reichardt P, et al. Naive B cells generate regulatory T cells in the presence of a mature immunologic synapse. Blood. 2007;110(5):1519–1529.
20. Porcheray F, et al. B-cell immunity in the context of T-cell tolerance after combined kidney and bone marrow transplantation in humans. Am J Trans-plant. 2009;9(9):2126–2135.
21. de Haan A, et al. Decreased donor-specific cytotoxic T cell precursor frequencies one year after clinical
lung transplantation do not reflect transplanta-tion tolerance: a comparison of lung transplant recipients with or without bronchiolitis obliterans syndrome. Transplantation. 2000;69(7):1434–1439.
22. Hornick PI, Mason PD, Yacoub MH, Rose ML, Batchelor R, Lechler RI. Assessment of the con-tribution that direct allorecognition makes to the progression of chronic cardiac transplant rejection in humans. Circulation. 1998;97(13):1257–1263.
23. Beik AI, Higgins RM, Lam FT, Morris AG. Ste-roid withdrawal and donor-specific hyporeactiv-ity after cadaveric renal allotransplantation on maintenance triple therapy. Nephrol Dial Transplant. 1997;12(9):1949–1955.
24. Martínez-Llordella M, et al. Using transcriptional profiling to develop a diagnostic test of operational tolerance in liver transplant recipients. J Clin Invest. 2008;118(8):2845–2857.
25. Martínez-Llordella M, et al. Multiparameter immune profiling of operational tolerance in liver transplan-tation. Am J Transplant. 2007;7(2):309–319.
26. Braud C, et al. Immunosuppressive drug-free oper-ational immune tolerance in human kidney trans-plant recipients: I. blood gene expression statistical analysis. J Cell Biochem. 2008;103(6):1681–1692.
27. Brouard S, et al. Identification of a peripheral blood transcriptional biomarker panel associated with operational renal allograft tolerance. Proc Natl Acad Sci U S A. 2007;104(39):15448–15453.
28. Asare AL, et al. Differential gene expression pro-files are dependent upon method of peripheral blood collection and RNA isolation. BMC Genom-ics. 2008;9:474.
29. Gunther OP, et al. Functional genomic analysis of peripheral blood during early acute renal allograft rejection. Transplantation. 2009;88(7):942–951.
30. Sawitzki B, Schlickeiser S, Reinke P, Volk HD. Pretransplant immune risk assessment. Curr Opin Organ Transplant. 2009;14(6):650–655.
31. Carsetti R, Rosado MM, Wardmann H. Peripheral development of B cells in mouse and man. Immunol Rev. 2004;197:179–191.
32. Garin MI, Chu CC, Golshayan D, Cernuda-Morol-lon E, Wait R, Lechler RI. Galectin-1: a key effec-tor of regulation mediated by CD4+CD25+ T cells. Blood. 2007;109(5):2058–2065.
33. Ozawa M, et al. 14th International HLA and Immu-nogenetics Workshop: report on the Prospective Chronic Rejection Project. Tissue Antigens. 2007; 69(suppl 1):174–179.
34. Game DS, Hernandez-Fuentes MP, Chaudhry AN, Lechler RI. CD4+CD25+ regulatory T cells do not significantly contribute to direct pathway hypore-sponsiveness in stable renal transplant patients. J Am Soc Nephrol. 2003;14(6):1652–1661.
35. Agilent Technologies, One-Color Microarray-Based Gene Expression Analysis: Protocol [version 5.5, part number G4140-90040]. Santa Clara, California, USA: Agilent Technologies Inc.; 2007.
36. Weng L, Dai H, Zhan Y, He Y, Stepaniants SB, Bas-sett DE. Rosetta error model for gene expression analysis. Bioinformatics. 2006;22(9):1111–1121.
37. Edgar R, Domrachev M, Lash AE. Gene expres-sion omnibus: NCBI gene expression and hybrid-ization array data repository. Nucleic Acids Res. 2002;30(1):207–210.