humanitarian bulletin - · pdf fileand humanitarian partners have carried out the 2013...
TRANSCRIPT

Funded
Unmet requirements
IN THIS ISSUEThe humanitarian situation continues to deteriorate in the Gaza Strip. On 13 October, one week after the reported discovery of a tunnel leading from the southern Gaza Strip into Israel, the Israeli authorities halted the transfer of construction materials into Gaza, including those slated for international organizations. As a result, UNRWA, the largest UN agency in the Gaza Strip, has been forced to suspend 20 ongoing projects, intended to address housing, education, water and sanitation needs. The recent Israeli decision exacerbated the shortages triggered by the sharp reduction in the smuggling of building materials through the illegal tunnels
Overview
oPt
www.ochaopt.org United Nations Office for the Coordination of Humanitarian Affairs occupied Palestinian territoryP. O. Box 38712 East Jerusalem 91386 l tel +972 (0)2 582 9962 l fax +972 (0)2 582 5841 l [email protected]
Coordination Saves Lives
HUMANITARIAN BULLETINMONTHLY REPORTOCTOBER 2013
HIGHLIGHTS
● The data analysis phase of the Vulnerability Profile Project has been completed. The VPP is an inter-cluster humanitarian survey that aims to identify vulnerabilities in Area C of the West Bank.
● More Palestinians have been injured in Palestinian-Israeli violence in the first ten months of 2013, than in any other entire year since 2005.
●Israeli restrictions on construction material entering into Gaza continue to force the suspension of humanitarian reconstruction and rehabilitation projects.
Data analysis for the 2013 Vulnerability Profile Project completed .........................3
Concerns over settlement expansion in Bethlehem governorate .............................4
First ten months of 2013: Increase in civilian casualties in the West Bank .........7
Israel halts all transfers of building materials to Gaza ........................................9
CAP 2013 FUNDING
401 million requested (US$)
401million
requested (US$)
62% funded
OCTOBER FIGURES Palestinian civilians killed (direct conflict) 8Palestinian civilians injured (direct conflict) 120Palestinian children under Israeli detention 211Structures demolished in the West Bank 21Patients’ applications to leave Gaza approved by Israel 92%
Funded
Unmet requirement
62%
38%
under the Egypt-Gaza border. In addition to delaying response to address urgent needs, the developments led to the temporary layoff of tens of thousands of workers, compounding pre-existing pressures on livelihoods.
Due to restrictions on construction material allowed to enter Gaza, UNRWA was forced to suspend 19 out of 20 ongoing projects, including a housing project in Rafah.
Phot
o by
UN
RWA

HUMANITARIAN BULLETINOCTOBER 2013
2
This is the second of four releases agreed upon between the sides, in the context of the current negotiations. As such, this is an
encouraging development. However, the following day the Israeli authorities published tenders for the construction of 2,258 new housing units in settlements across the West Bank, including East Jerusalem, and announced the promotion of
plans for nearly 2,500 additional units. Continued settlement construction, expansion and encroachment on Palestinian
land and water resources is an integral part of the ongoing fragmentation of the West Bank, and has resulted in the shrinking of
space available for Palestinians to develop adequate housing, basic infrastructure and services and to sustain their livelihoods. Settlements are illegal under international law and constitute a key driver of humanitarian vulnerability.
In addition to the above announcements, this month Israeli settlers began developing a plot of land south of Bethlehem city to establish an agricultural farm, negatively impacting the agricultural livelihoods of Palestinian farmers. Although the planning process has not yet formally started, in the past the area surrounding this parcel was declared “state land” and allocated for the establishment of a large urban settlement (Giv’at Eitam). This takes place in the context of the longstanding fragmentation of the Bethlehem governorate due to the expansion of Israeli settlements, the construction of the Barrier, and the designation of large tracts of land as closed military areas and nature reserves; at present, only 13 percent of the governorate’s area, much of it fragmented is available for Palestinian use.
Although settlement activities impact the entire Palestinian population in the West Bank, those residing in Area C, where the majority of settlements are located, are particularly affected. In order to better understand Area C residents’ unique vulnerability, OCHA and humanitarian partners have carried out the 2013 Vulnerability Profile Project (VPP), which entered this month into its data analysis phase. The VPP is a comprehensive survey of the nearly 550 communities that have any part of their built up area in Area C, designed to identify vulnerabilities, flag areas for in-depth assessments, and inform humanitarian interventions and advocacy. The preliminary findings are expected to be released during December 2013.
Settlements, and the security measures implemented to protect them, have also been a constant trigger of tensions and clashes between the Palestinian population and Israeli forces. While the number of casualties during October decreased, in the first ten months of 2013 as a whole, nearly 3,500 Palestinians were injured by Israeli forces in the West Bank – more than in any other entire year since 2005, when OCHA began collecting data on conflict-related casualties. About 41 percent of these injuries were caused by tear gas inhalation requiring medical treatment, and 38 percent by rubber-coated metal bullets.
This month, the
Israeli authorities released 26 Palestinian prisoners, who began
serving their sentences before the beginning of the Israeli-Palestinian
“Oslo process” in 1993.
3HUMANITARIAN BULLETINOCTOBER 2013
Current negotiations offer an extraordinary window of opportunity to end the Palestinian-Israeli conflict and the related longstanding occupation. Ensuring that the basic needs of the most vulnerable are properly met, particularly in Area C and in the Gaza Strip, is not only a legal obligation but also a contribution to the creation of an environment conducive to negotiations.
DATA ANALYSIS FOR THE 2013 VULNERABILITY PROFILE PROJECT COMPLETED
Baseline data on over 550 Area C communities collected
In October, OCHA and partners began the data analysis phase of the 2013 Vulnerability Profile Project (VPP). The VPP is an inter-agency, inter-cluster humanitarian survey designed to identify vulnerabilities in Area C of the West Bank, flag areas for in-depth assessments, and inform humanitarian interventions and advocacy.
Area C, constituting over 60 per cent of the West Bank, has been identified by the humanitarian community as a priority area for humanitarian assistance. The area, which is under Israeli control, is home to some of the most vulnerable communities in the West Bank in terms of humanitarian needs.1 Since the built-up area of Palestinian communities does not correspond to the administrative
HIGHLY VULNERABLE COMMUNITIES IN AREA C: THE CASE OF KHIRBET ZANUTA
In the southern hills of the Governorate of Hebron lies the herding community of Khirbet
Zanuta. Road 60, which leads to the village, splits it into two parts: the center of the village,
where about 10 families (150 people) reside, and another, smaller section which is home to
three Palestinian families; Khirbet Zanuta’s residents claim that the community has existed
in the area for hundreds of years. The community’s housing consists of tents and shacks,
which along with animal shelters, are located on 70 dunums of privately-owned land. Like
most herding communities in Area C it lacks basic service infrastructure, such as water
and electricity networks, schools, primary health services and paved roads. The community
depends on rainwater collected from cisterns, and candlelight and kerosene for lighting.
The residents travel about eight kilometers to access the nearest clinic and school; UNICEF
and the Palestinian Ministry of Education and Higher Education (MoEHE) provide a school
transport (bus) for 20 children who attend schools in Ad Dahiriya.
The Israeli authorities have designated the area in which the community is located as a
“protected archeological site”, where any development is prohibited, placing 27 families at
risk of displacement due to demolition orders issued against their homes. The Association
for Civil Rights in Israel (ACRI), which since 2007 represents the affected families in a
petition filed with the Israeli High Court of Justice, managed to postpone the execution of
most of the orders. Yet on August 2012, the authorities demolished 12 structures, resulting
in the displacement of 13 people including nine children, and affecting another 25. Among
the demolished structures were a cistern and an animal shelter funded by international
donors. The petition is still pending.
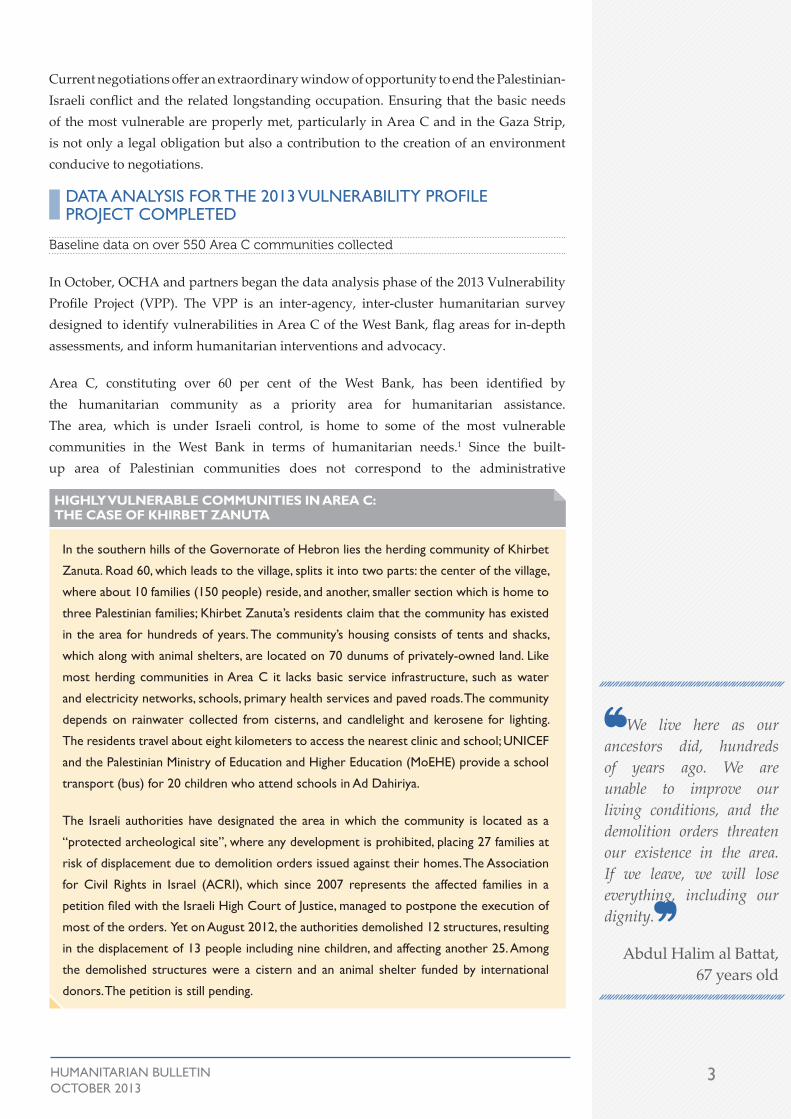
We live here as our ancestors did, hundreds of years ago. We are unable to improve our living conditions, and the demolition orders threaten our existence in the area. If we leave, we will lose everything, including our dignity.
Abdul Halim al Battat, 67 years old

HUMANITARIAN BULLETINOCTOBER 2013
4
division of Areas A, B and C, there is a lack of disaggregated data on Area C.2
This lack of information has been a challenge to humanitarian agencies, as well as others, in planning response activities designed to address humanitarian needs. Unlike previous surveys, which targeted communities located entirely or mostly in Area C, the 2013 VPP targeted all Palestinian communities that have any part of their residential area in Area C, some 550 communities.3
Active partners in the VPP have included members of the Humanitarian Country Team, particularly Cluster lead agencies, and the Palestinian Authority’s (PA) Ministry of Local Government (MLG). The process has also been closely coordinated with the Palestinian Central Bureau of Statistics (PCBS).
The VPP is based on key informant interviews with community representatives using a uniform questionnaire. In most cases, the key informant was appointed by the MLG, usually the Head of the Village or Municipal Council. In Bedouin and herding communities, field contacts were used to arrange meetings with the mukhtar, or recognized community representatives. MLG representatives distributed questionnaires in Arabic in advance, along with aerial photos of each community showing the Area C portions. The latter helped guide the discussion, and served as a resource against which information provided by key informants could be cross-checked.
The information provided by key informants on the number of Area C residents living in a particular locale was cross-checked against available information on electricity meters or water connections, as well as against the number of structures visible in the aerial photos. In smaller communities, information was gathered on households, disaggregated by sex and adult vs. child.
The VPP includes basic information on a range of humanitarian indicators related to physical protection, access to land, agriculture, water and sanitation, education and health, among others. The VPP also allows for dynamic data analysis and prioritization of issues and areas, through the use of weighted indicators.
Once the data is cleaned, the VPP will provide humanitarian and development agencies, as well as others, with the most comprehensive data collection available to date on Area C. The preliminary findings are expected to be released during December 2013.
CONCERNS OVER SETTLEMENT EXPANSION IN BETHLEHEM GOVERNORATE
New settler farm further disrupts agricultural livelihoods
During the last week of October, Israeli settlers began developing a 300 dunum plot of land located in Area C, south of Bethlehem city. While the current works are reportedly limited to the establishment of an agricultural farm, the area surrounding this parcel is planned for the establishment of a larger residential settlement (see below). Both the short- and long-term plans threaten to further undermine the agricultural livelihoods of Palestinian farmers in the area, block the urban development of Bethlehem city, and deepen the governorate’s fragmentation.

5HUMANITARIAN BULLETINOCTOBER 2013
Gilo
Efrata
Teqoa
Har Homa
Bat AyinAllon Shevut
El'azar
Noqedim
Har Gilo
Newe Daniyyel
Rosh Zurim
Kefar Ezyon
Ma'ale Amos
Mitzpe Shalem
Ein Fashkhah
Ovnat CollegeNahal Gevaot
Husan
Battir
Nahalin
Ad Doha
Nu'aman
Al Jab'a
Mar Saba
Al Khadr
Al Walaja
Wadi Fukin
Al Ma'sara
Ush GhurabBeit Sahur
Beit Fajjar
Duheisa Camp
Khallet Al Louza
'Arab ar Rashayida
Southern Villages
Rachel's Tomb
Beit Jala
Ayda Camp
Artas
Military Area
Nature Reserve
Area CArea A Area B
Gush Etzion
Al 'AzzaCamp
For the purpose of this report we have divided the Bethlehem governorate into three areas:centre-urban, western and eastern.
Old City
The eastern governorate comprises an extensive area of desert and semi-desertand the Dead Sea. This area is effectivelyoff-limits to Palestinians, because of Israeli-administered Area C, nature reserves and military areas. According to the World Bank, a Palestinian Dead Sea hotel industry“of comparable profitability to Israel, this would provide annual revenues of someUSD 290 million while “the potential incremental value from ...potash, bromine and magnesium has been conservatively estimated at USD 918 million per annum.”
Eastern Area:
Dead Sea
Planned Industrial Zone
Beitar Illit
(Palestinian Designated)
Territorial and Administrative Division of the Bethlehem Governorate
7.5 % 5.5 % 66 %19.4 %
LegendArea A: The Palestinian Authority has security and civil control. Urban areas.
Closed Military Area (40 % of the governorate and 60 % of Area C)
Area C: Israel retains security control and jurisdiction over planning and construction.(Approximately 66% of Bethlehem governorate)
Area B: The Palestinian Authority has full civil control and joint security responsibility. Rural communities.
Constructed Barrier
Planned Barrier, (under construction) If completed as planned, the Barrier will isolate12 % of the total area of the governorate.
Under the Wye River Memorandum of 1998, land reserves, were handed over to the Palestinian Authority (PA) to be set aside as a Green area/Nature Reserves: however,the PA has not been allowed to utilize this area.
Settlement Outposts (digitized from satellite imagery March 2005)
Israeli Declared Nature Reserves
Source: OCHA, JRC, PA- MOPIC
Dead Sea : Around 90 % of the Palestinian Dead Sea coast falls withinthe Bethlehem governorate
Settlement Municipal Area
Settlement built-up and outer limits
1.6 % within Jerusalemmunicipal boundary
Khirbet an Nahla
Artas
Rakhme
Hindaza
Harmala
Ad Doha
Al 'Iqab
Bureid'a
Al Beida
Al Khadr
Al Halqum
Ath Thabra Abu Nujeim
Al Ma'sara
Al 'AsakiraAl FureidisBeit Ta'mir
Wadi an Nis
WadiRahhal
Khallet Hamad
Marah Ma'alla
WadiUmm Qal'a
Khallet 'AfanaKhirbet ad Deir
New Settler agricultural farm
Khallet al Louza
Ad Duheisha Camp
Khallet al Haddad
Khallet al Balluta
Jannatah (Beit Falouh)
Dhahratan Nada
Jurat ash Sham'a
Khallet al QaraninEfrata
Teqoa
El'azar
Newe Daniyyel
Noqedim
New settler agricultural farm
0 4 82 Kilometers
The fertile Western Bethlehem area is the governorate's traditional breadbasket. In recent decades, settlement constructionand expansion has reduced the agricul-tural space available for Bethlehem farmers. Planned Barrier construction threatens to sever this agricultural hinterland from the urban core to the east.
Western Area: Centre-Urban Area:
The centre-urban area comprises Bethle-hem city, Beit Sahur, Beit Jala, and adja-cent refugee camps, municipalities and villages, which form a continuous urbanfabric. It also includes the southern villages and Beit Fajar, which are separated from each other and from the urban area in the north by large tracts of Israeli-administeredArea C.
Centre-Urban Area:
United Nations Office for the Coordination of Humanitarian Affairs occupied Palestinian territory
TERRITORIAL AND ADMINISTRATIVE DIVISION OF THE BETHLEHEM GOVERNORATE
September 2013
oPt

HUMANITARIAN BULLETINOCTOBER 2013
6
The recent works included the leveling of uncultivated land, the erection of tents, currently used by security guards, and the installation of basic electricity and water infrastructure. The plot, which lies within the boundaries of the Wadi Rahal village, was reportedly purchased during the 1980’s by a settler association known as “Himanuta”. According to Israeli media reports, the Israeli authorities approved the establishment of an agricultural farm on this plot in 2011.4
The immediate concerns are related to movement of settlers and soldiers between Efrata settlement and the new farm. The only access route between the two sites passes through privately-owned and cultivated Palestinian land. The Israeli Civil Administration opened this route earlier this year, allegedly to reach an adjacent area declared as “state land” in order to uproot Palestinian trees planted there. The establishment of the farm is likely to result in an increase in the volume of Israeli traffic through this road, alongside the adoption of security measures, which may further disrupt the livelihoods of Palestinian farmers cultivating this area.
This parcel is located next to a 1,400 dunum plot of land, named by settlers as Giv’at Eitam, declared by the Israeli authorities in 2004 “state land” and incorporated within the municipal boundaries of Efrata settlement. Subsequently, the Israeli authorities began drafting a planning scheme allocating this area for the construction of approximately 2,500 housing units. However, the planning process was put on hold following legal action taken by several Palestinians claiming ownership of the plot. A petition filed with the Israeli High Court of Justice in this context is currently pending.
Regardless of the fate of this petition, the establishment of the new farm may serve as a first step on the ground towards the development of the larger settlement plan. This concern is based on several well-documented cases in the past, where the Israeli authorities approved the construction of agricultural infrastructure which later evolved into fully residential settlements.5
I, my brothers, and my cousins own 300 dunums of land in Khallet An Nahla, which we are trying to save from confiscation through legal proceedings. In the meantime, the Israelis opened a road through an adjacent parcel that we cultivate and which was not confiscated. We fear this road will be expanded and take even more land; land that we rely on for our income.
Mohammed Ayesh, 50 years old from Irtas
Gate for new settlement outpost near Efrat settlement (Gush Etzion block); the outpost will cut Bethlehem from the south of the West Bank.
Phot
o by
Pie
tro
Mas
turz
o

7HUMANITARIAN BULLETINOCTOBER 2013
These developments take place in the context of the longstanding fragmentation of the Bethlehem governorate, addressed by OCHA in a comprehensive report in 2009.6 The report showed how the space available to the Palestinian population of the governorate has been significantly constricted by Israeli measures such as the building and continued expansion of Israeli settlements and outposts, construction of the Barrier, and the zoning of the majority of the Bethlehem governorate as Area C, closed military areas and nature reserves. Of the 660 km2 comprising the Bethlehem governorate, only 13 percent - much of it fragmented - is available for Palestinian use. These measures have reduced Bethlehem’s development space, limited its access to resources (including the Dead Sea coastline),7
severed Bethlehem’s historic links to Jerusalem and restricted the urban area’s potential for residential and industrial expansion.
FIRST TEN MONTHS OF 2013: INCREASE IN CIVILIAN CASUALTIES IN THE WEST BANK
A third of all Palestinian injuries are children
On 17 October, a 29-year-old Palestinian civilian was shot and killed by Israeli forces next to Ar Ram town, north-east of
Jerusalem, while reportedly attempting to break into a military base with a bulldozer. On 22 October, a 28-year-old Palestinian man from Beit Liqya village was shot and killed fired by the Israeli armed forces in a cave between Kufr Ni’ma and Bil’in villages. The incident followed a search and
arrest operation carried out by the Israeli army in Kufr Ni’ma village after midnight, during which the Israeli army arrested
three Palestinians. On 31 October, Israeli forces shot and killed a 22-year-old Palestinian civilian in the village of Qabatiya (Jenin), during
clashes with the village’s residents that erupted during a search-and-arrest operation. On 11 October, an Israeli settler was beaten to death in the northern Jordan Valley; two Palestinian civilians, reportedly unaffiliated with any armed faction, have been detained and are currently being prosecuted for the attack. These incidents bring the total number
In October, three Palestinians and one
Israeli were killed due to Palestinian-Israeli violence
in the West Bank.
Child
Adult
Not known
2007
425
231
524
2008
33
416
993
2009
22
239
676
2010
145
282
834
2011
308
1332
2012
551
2,638
2013
1,102
2,384
Palestinians injured in WB Direct Conflict
2006-2012 (entire years) vs. Jan-Oct 2013

HUMANITARIAN BULLETINOCTOBER 2013
8
of deaths from Palestinian-Israeli violence in the West Bank since the beginning of 2013 to 23 fatalities (19 Palestinians and four Israelis).
During October, there was a significant decrease in the number of injuries in the West Bank in comparison with the rest of 2013: 102 Palestinians and 12 Israelis, compared to a monthly average of 374 and 15, respectively, from January to September.
The decrease in injuries in October belies a larger upward trend for 2013 as a whole: in the first ten months of 2013 alone, more Palestinians have been injured in Palestinian-Israeli violence than in any other entire year since 2005. The data regarding Israeli casualties in the West Bank is less conclusive. According to the Israeli Security Agency, since July 2013, there was a 72 per cent increase in attacks against Israeli soldiers and settlers in the West Bank, including East Jerusalem, (76 attacks in July vs. 131 in October).8 However, the vast majority of these attacks did not result in casualties,9 and there has actually been a decrease in the number of Israeli injuries in September (7 injured) and October (5 injured) in comparison with the average number of Israelis injured during the rest of the year (15 injured).
With regard to Palestinian casualties, in 2013 clashes during demonstrations (generally) were the most prevalent context resulting in Palestinian injuries, making up roughly 64 percent of the total, higher than the proportion of demonstration-related injuries in the parallel period in 2012 (59 per cent) and significantly higher than the average from 2005 to 2012 (40 percent). Most of the injuries occurred during popular protests, such as the Nakba Day and Land Day demonstrations, or protests in solidarity with Palestinian prisoners. However, it should be noted that the number of injuries in Barrier-related demonstrations decreased by 58 per cent.
This year also witnessed a significant rise in the number of Palestinian injuries during clashes with Israeli forces in the context of search and arrest operations, military patrols, or ad-hoc stone-throwing incidents. An example of the latter occurred on 4 October near the Israeli Ofer prison (Ramallah), when a group of Palestinian youth threw stones at Israeli forces, who responded by firing tear gas canisters, live ammunition, and rubber-coated metal bullets, injuring four civilians, including two children.
Palestinian injuries by context
Jan-Oct
2012 2013 Percentage of change
Demonstrations (barrier) 313 131 -58%
Demonstrations (non-barrier) 1567 2067 32%
Search and Arrest or other Military operations
104 447 330%
Clashes or attacks unrelated to any other category
93 446 380%
Other 269 621 131%

9HUMANITARIAN BULLETINOCTOBER 2013
Of the Palestinian injuries that occurred during clashes (including those during or following search-and-arrest operations, demonstrations, or other spontaneous clashes), more than 43 per cent10 were due to tear gas inhalation requiring medical treatment. While in absolute numbers this represents an increase compared to 2012, it is a decrease relative to the percentage tear gas inhalation injuries in 2012: 62 per cent. By contrast, in 2013 there has been a marked increase in the percentage (of the total) of people injured by rubber-coated
7 and younger
8 - 11
11 - 15
16 - 17
Unknown
2011
20
31
91
98
68
2012
22
54
17
24
53
2013
54
66
28
41
28
metal bullets or live ammunition compared to 2012: 40.5 vs. 23 percent, and 3.4 vs. 0.5 percent respectively. Although the high numbers of recorded tear gas inhalation injuries may indicate more frequent deployments of Palestinian ambulances to demonstrations, resulting in more people being treated for tear gas inhalation and therefore recorded as injured, increased reports of injuries caused by rubber-coated metal bullets and live ammunition are also an indication that these weapons are being used by the Israeli military with increased frequency compared to previous years.
Also of concern is a significant upward shift in the percentage of child casualties of the overall total casualties; children make up roughly 32 per cent of all those who have been injured in the West Bank. This is a large increase both in absolute numbers and in percentage of total (see chart above), in comparison with 2012 (21 per cent) and 2011 (23 per cent), respectively. Mirroring the trend in the larger population, more than 90 percent of child casualties occurred in clashes. Of note, there has been a significant increase in the number of children younger than 16 who are injured.
ISRAEL HALTS ALL TRANSFERS OF BUILDING MATERIALS TO GAZA
Aid agencies forced to suspend reconstruction and rehabilitation projects
On 13 October, one week after the reported discovery of a 1.8 km long underground tunnel leading from southern Gaza Strip into Israel, the Israeli authorities halted the transfer of construction materials into Gaza through the Kerem Shalom crossing. This decision applied to materials brought by international organizations implementing reconstruction and community rehabilitation projects, as well as by the private sector.
Palestinian children injured in Israeli-Palestinian violence in the West Bank
UNRWA contributed to this section of the Humanitarian Bulletin

HUMANITARIAN BULLETINOCTOBER 2013
10
This development exacerbates pre-existing shortages of building materials due to the sharp reduction (since July 2013) in materials smuggled through the illegal tunnels under the Egypt-Gaza border. The reduction followed measures taken by the Egyptian authorities in the context of ongoing instability in northern Sinai. Private sector construction activities have sharply declined in previous months, and the recent Israeli decision has impacted on the ability of international organization to continue with the implementation of their projects. UNRWA, the largest UN implementing agency in the Gaza Strip, was forced to suspend all 20 ongoing projects involving construction activities, including schools and housing units. These projects are worth almost USD 60 million.
Among the UNRWA projects affected is a housing project in Rafah, which aims to construct over 750 housing units for the Palestine refugee families who lost their shelter before 2005. The project is part of a larger, 132 million USD, initiative funded by the Saudi Fund for Development (SFD) and intended to provide homes to more than 4,500 refugees. After nearly 10 years of waiting, more than 700 refugee families are still holding out for their home to be built, and the delays oblige UNRWA to extend the rental subsidies it provides to families who lost their shelters in the context of hostilities, at the cost of 80,000 USD per month, and at the expense of other emergency initiatives.
Since the easing of the blockade in June 2010, only international organizations have been allowed to import basic construction materials (including cement, aggregates and metal bars) through the Israel-Gazan crossings, and only after receiving prior approval from Israel (and the Palestinian Authority in Ramallah). The approval process has been problematic and led to significant delays in the implementation of humanitarian projects, unnecessarily prolonging the hardship of Palestinian families in need of shelter rehabilitation, construction, and other essential infrastructure. While the coordination process for approved projects has improved over time, this was partially due to considerable resources the UN has dedicated to managing this process. Approval for UNRWA projects took on average almost nine months and those projects awaiting approval have been pending for almost a year. Although 13 projects were approved for UNDP in September, no UNRWA projects have been approved since March of this year. In addition to the 20 construction projects suspended worth almost 60 million USD, 37 projects with a value of 92 million USD are currently awaiting approval. Among them are 23 projects to construct larger schools in the same location as current small schools, bringing into question the justification for these delays.
From January to September 2013, a monthly average of 1,052 truckloads (67,000 tons) of construction materials for projects implemented by international organizations entered Gaza via Kerem Shalom, significantly higher than the 388 truckloads that entered in October. While the tunnels have served as the main channel for the supply of building materials to the private sector, last month (22 September), the Government of Israel began allowing the entry into Gaza of fifty truckloads of construction materials per day for commercial uses. This came in addition to the 20 truckloads of aggregates per day allowed since December 2012. This easing too has been discontinued since 13 October.

11HUMANITARIAN BULLETINOCTOBER 2013
In addition to the delay in the response provided to urgent infrastructure needs, the recent developments have led to the temporary layoff of tens of thousands of workers, compounding pre-existing pressures on livelihoods in Gaza. The construction sector has been the only sector generating jobs in the Gaza Strip, accounting for half of all jobs created in 2012 and employing some 24,000 people. In 2012 UNRWA alone generated almost 5,000 jobs through its construction projects, and was expecting to increase this to over 7,600 jobs in 2013. This has resulted in a domino effect: food security, already fragile in recent months, has been further impacted due to price increases in commodities such as bread, vegetable oil, rice and other goods vital to Gaza’s economy. The food security has also been indirectly affected by rising unemployment caused by the economic impact of the restrictions on imports, and the overall situation could be further exacerbated by possible delays in the payment of salaries by the de-facto authorities of Gaza. Steady improvements in food security (since 2009) were effectively reversed in 2012, when delays in the payment of public sector salaries and social benefits contributed to driving food insecurity levels up from 44 to 57 per cent in Gaza, and further deepened households’ reliance on food assistance.
End notes1. See OCHA oPt, “Area C of the West Bank: Key Humanitarian Concerns,” January 2013.
2. The division of most of the West Bank into Areas A, B and C was agreed in the 1995 Interim Agreement on the West Bank and Gaza Strip. Between 1995 and 2000, the divisions, which were intended to last no more than five years, changed multiple times following the phased re-deploy-ments of the Israeli military from some areas and the gradual transfer of authority to the newly-created Palestinian Authority. Since 2000, there have been no official changes in these areas.
3. In 2008, OCHA and UNRWA carried out a vulnerability study, gathering information on com-munities located entirely in Area C. In 2010, OCHA and partner organizations carried out a more comprehensive “community profile”, which collected more detailed information on com-munities with 50 per cent or more of their built up area in Area C.
4. Walla news, 30 November 2011; Amira Hass, Ha’aretz, 1 November 2013.
5. For further details see: Peace Now, “A new outpost is to be established South of the Bethle-hem”, 30 November 2011.
6. OCHA, Shrinking Space : Urban Contraction and Rural Fragmentation of Bethlehem Governorate, May 2009. http://www.ochaopt.org/documents/ocha_opt_bethlehem_shrinking_space_may_2009_english.pdf
7. According to the World Bank, if Palestinians could develop a Dead Sea hotel industry “of com-parable profitability to Israel, this would provide annual revenues of some USD 290 million and value added of about USD126 million, equivalent to 1 percent of 2011 Palestinian GDP,” while providing direct employment for about 2,900 workers. Regarding the economic potential of Dead Sea minerals, the World Bank estimates that “the potential incremental value added to the Palestinian economy from the production and sales of potash, bromine and magnesium has been conservatively estimated at USD 918 million per annum, or 9 percent of GDP. This is almost equivalent to the contribution of the entire manufacturing sector of Palestinian territories to-day.” World Bank, Area C and the Future of the Palestinian Economy, 2 October 2013, paras. 49, 28.
8. Israel Security Agency, October 2013 Monthly Summary Report, November 2013 http://www.shabak.gov.il/English/EnTerrorData/Reports/Pages/Oct13report.aspx
9. According to the Israeli Security Agency, most of the attacks did not result in injuries, 116 of 131 attacks were by Molotov cocktails, two were stabbings, one was gunfire, and ten were im-provised explosive devices (IEDs).
10. This figure only refers to tear gas inhalations that took place during the clashes outlined, the percentage of tear gas inhalations of all injuries is roughly 42 per cent.

Direct Israeli-Palestinian conflict related casualties
2011 2012 2013
Total Oct Nov Dec Total Jan Feb Mar April May June July Aug Sep Oct Total
Palestinian deathsGaza 108 14 180 2 253 2 0 0 1 0 0 0 1 1 1 6
West Bank 17 0 3 2 9 4 0* 2 2 0 0 1 5 0 3 17
Total 125 14 177 4 262 6 3 2 3 0 0 1 6 1 4 27
Of whom are civilians2 62 0 114 4 136 6 3 2 2 0 0 1 6 1 2 20
Of whom are female 3 0 22 0 23 1 0 0 0 0 0 0 0 0 0 1
Palestinian injuriesGaza 468 29 1516** 21 1834 13 10 5 4 1 2 2 7 5 1 50
West Bank 1647 57 740 177 3175 251 756 495 654 458 122 136 130 370 119 3491
Total 2115 86 2257 198 5009 264 766 500 658 459 124 138 137 375 120 3541
Of whom are civilians 2054 59 na 179 n/a 264 766 499 657 459 124 138 137 374 120 3538
Of whom are female 151 8 na 13 n/a 8 13 14 10 40 8 12 4 10 4 123
Israeli deathsIsrael, Gaza and West Bank 11 0 6 0 7 0 0 0 1 0 0 0 0 2 0 3
Of whom are civilians 11 0 3 0 3 0 0 0 1 0 0 0 0 0 0 1
Of whom are female 0 0 1 0 1 0 0 0 0 0 0 0 0 0 0 0
Israeli injuriesIsrael, Gaza and West Bank 122 1 253*** 6 345 6 24 42 18 33 1 11 5 7 15 162
Of whom are civilians 56 6 na 4 60 3 11 18 4 14 1 8 0 3 9 71
Of whom are female 3 0 na 1 7 0 1 1 2 4 0 0 0 0 1 9* Two Palestinians died of injuries they sustained by Israeli forces during the second intifada and by Israeli settlers in 2005** Figures include those provided by the Ministry of Health in Gaza during the recent Israeli offensive on Gaza (14-21 November)*** Figures by the Israeli Ministry of Foreign Affairs**** The number of injured Israeli soldiers is provided by COGAT
Tunnel-related casualties3
2011 2012 2013
Total Oct Nov Dec Total Jan Feb Mar April May June July Aug Sep Oct Total
Deaths 36 0 0 0 11 6 2 2 1 3 0 1 0 0 0 14Injuries 54 0 0 0 18 6 0 12 1 1 0 0 0 0 0 20
Israeli-settler related incidents resulting in casualties or property damage
2011 2012 2013
Total Oct Nov Dec Total Jan Feb Mar April May June July Aug Sep Oct Total
Incidents leading to Palestinian casualties4 120 11 7 10 98 7 8 11 17 10 7 6 4 8 9 87
Incidents leading to Palestinian property/land damages
291 48 20 18 268 17 19 24 38 45 29 22 16 28 36 274
Subtotal: incidents affecting Palestinians 411 59 27 28 366 24 27 35 55 55 36 28 20 36 45 361
Incidents leading to Israeli Casualties
23 3 5 5 35 2 1 9 4 5 1 2 0 4 4 32
Incidents leading to Israeli Property/land damages5 13 0 1 1 15 2 0 0 1 0 3 0 2 0 0 8
Subtotal: incidents affecting settlers 36 3 6 6 50 4 1 9 5 5 4 2 2 4 4 40
Conflict-related casualties and violence1Annex: Monthly Indicator Tables
Civilian Palestinians killed or injured by unexploded ordnance in Gaza
2011 2012 2013
Total Oct Nov Dec Total Jan Feb Mar April May June July Aug Sep Oct Total
AdultInjured 7 1 0 1 12 1 0 0 1 2 0 0 0 0 0 4Killed 1 0 1 0 2 0 0 0 0 0 0 0 0 0 0 4
ChildInjured 17 2 0 0 19 5 5 6 0 3 0 0 0 0 0 0Killed 2 0 0 0 1 1 1 0 0 0 0 0 0 0 0 0
Grand Total 27 3 1 1 34 7 6 6 1 5 0 0 0 0 0 0Source: United Nations Mine Action Service (UNMAS)

Child ProtectionNumber of Palestinian children killed - direct conflict
2011 2012 2013
Total Oct Nov Dec Total Jan Feb Mar Apr May June July Aug Sep Oct Total
West Bank 2 0 0 1 2 2 0 0 0 0 0 0 0 0 0 2Gaza Strip 11 0 40 0 44 0 0 0 0 0 0 0 0 0 0 0
Number of Palestinian children injured - direct conflictWest Bank 308 7 222 29 427 36 146 162 291 64 35 22 34 139 25 954
Gaza Strip 125 1024 -
without Gaza war
4 105 3 3 0 2 0 0 0 2 0 0 10
Number of Israeli children killed - direct conflict
oPt 1 0 0 0 1 0 0 0 0 0 0 0 0 0 0 0Israel 1 0 0 0 1 0 0 0 0 0 0 0 0 0 0 0
Number of Israeli children injured - direct conflict
oPt 0 0 0 0 3 1 0 4 0 0 0 0 0 0 0 5
Israel 0 0 2 0 2 0 0 0 0 0 0 0 0 0 0 0Number of Palestinian children held in detention by Israeli authorities
In Israel and oPt192
monthly average
164 178 195198
monthly average
219 236 236 238 223 193 195 180 179 NA211
monthly average
Number of Palestinian children displaced by demolitionsWest Bank, inc EJ 618 87 14 10 474 157 23 5 38 41 58 17 46 53 19 457Number of incidents resulting in the disruption of schools19
oPt na 4 297 2 321 1 7 4 8 5 4 1 2 15 NA 47Souce: OCHA, DWG, Defence for Children Inernational, Israel Palestine Working Group on grave violatons affecting children in armed conflict
AccessAccess to healthcare - Gaza
2011 2012 2013
2011 Monthly Average
Oct Nov Dec2012
Monthly Average
Jan Feb Mar Apr May June July Aug Sep OctMon.Ave.
Applications for permits to leave Gaza through Erez Crossing15
872 789 725 894 777 796 907 882 1155 1117 1165 1299 1023 1303 1420 1106.7
of which approved 721 705 629 820 719 738 836 762 957 900 985 1106 932 1182 1314 1043.1
of which denied 19 6 5 4 7 2 2 1 0 1 0 7 3 5 11 3.2
of which delayed 16 83 78 91 70 17 56 69 119 198 216 180 186 88 116 95 134
Source: WHO
Movement of humanitarian staff, West Bank
2011 2012 2013
2011 Monthly Average
Oct Nov Dec2012
monthly ave
Jan Feb Mar Apr May June July Aug Sep OctMon.Ave.
Incidents of delayed or denied access at WB checkpoint17
38 60 40 22 37.5 34 69 51 24 51 30 33 34 45 30 40.1
Of which occurred at Jerusalem checkpoint 22 28 26 15 21 18 52 33 10 32 15 12 19 22 10 22.3
Number of staff days lost due to checkpoint incidents
25 36 16 6 21 8 29 17 6 16 4 8 24 60 13 18.5
Source: OCHA

14
Search and Arrest2011 2012 2013
Monthly Average Oct Nov Dec Monthly
Average Jan Feb Mar Apr May June July Aug Sep OctMon. Ave.
Search Campaigns (West Bank)
349 319 291 367 338 313 287 282 338 370 461 242 333 252 281 316
Palestinians detained (West Bank) 262 318 468 391 283 296 411 421 367 459 472 298 341 416 8 380
Source: OCHA
Palestinians under Israeli custody (occupation related)6
2011 2012 2013
Monthly Average Oct Nov Dec Monthly
Average Jan Feb Mar Apr May June July Aug Sep Oct Total
Total as of the end of the month 5326 4298 4432 4517 4,451 4593 4713 4764 4748 4801 4827 4828 4762 4806 NA 4227
of whom are women 26 11 10 10 7 10 10 11 14 16 14 11 12 12 NA 10of whom are administrative detainees7
240 156 178 178 245 159 169 164 155 147 137 134 134 135 NA 132
of whom are detained until the conclusion of legal proceedings
633 925 990 1031 897 1069 1118 1196 1216 1194 1150 1219 1295 1299 NA 1062
Source: Israeli Prison Service (through B’Tselem)
Structures demolished8
2011 2012 2013
Total Oct Nov Dec Total Jan Feb Mar Apr May June July Aug Sep Oct Total
of which in Area C 571 81 28 19 540 120 11 2 40 58 69 32 20 93 13 458
of which in East Jerusalem 42 2 7 6 64 21 3 1 6 11 3 1 37 2 8 93
Grand Total 613 83 35 25 604 141 14 3 46 69 72 33 57 95 21 551
*20 are in Area B
People Displaced due to demolitions or evictions9
2011 2012 2013
Total Oct Nov Dec Total Jan Feb Mar Apr May June July Aug Sep Oct Total
of whom were displaced in Area C
1006 135 0 14 815 247 6 0 40 32 101 48 33 108 7 622
of whom were displaced in East Jerusalem 88 6 29 19 71 14 40 10 24 59 30 0 63 6 34 280
Grand Total 1094 141 29 33 886 261 46 10 64 91 131 48 96 114 41 902
Demolition of Structures

15
Truckloads of goods entering Gaza from Israel
Source: Palestinian Ministry of National Economy, Gaza* Due to historical differences in the modality of transfer, to preserve the uniformity of the data, figures do not include truckloads carrying fuel.
CAP 2012 CAP 2013
ClusterTotal request in
million $% of funds received
Total request in million $
% of funds received
Agriculture 24,921,339 61.4% 31,665,733 42%
Cash for Work and Cash Assistance
95,559,928 35.5% 70,481,900 49%
Cluster not yet specified
0 0.0% 0 0%
Coordination and Support Services
21,167,518 95.7% 21,295,427 94%
Education 16,662,763 54.7% 22,408,092 37%
Food Security 170,513,876 83.0% 160,052,254 71%
Health and Nutrition 20,742,170 86.6% 22,536,007 54%
Protection 46,131,077 73.8% 53,093,279 64%
Water, Sanitation and Hygiene
24,208,531 55.8% 19,307,048 31%
Total 419,907,202 72.0% 400,839,740 61.4%
Source: Financial Tracking System (FTS)
Consolidated Appeals Process (CAP): CAP 2012 and 2013 funding status as of 29 October 2013

16
Casualties1. Conflict-related casualties: includes all casualties that occurred in violent incidents immediately related to the Israeli
occupation and the Israeli-Palestinian conflict, such as military operations, search and arrest campaigns, clashes during demonstrations, attacks involving Israeli settlers, etc. These figures exclude other related casualties such as those in the context of access delays, the explosion of unexploded ordnance, reckless handling of weapons, collapse of tunnels, and internal Palestinian violence.
2. Civilians: includes people who, according to the information available at the time of publication, did not fulfill a “continuous combatant function” as part of an organized armed group, regardless of the circumstances of their injury or killing. Figures in this category should not be considered comprehensive, as unconfirmed or disputed cases are excluded.
3. Tunnel related casualties: figures in this category may overlap with those under conflict-related casualties, as it includes casualties in the context of Israeli attacks targeting tunnels, as well as those resulting from tunnel collapses and other accidents.
Israeli settler-related violence
4. Incidents resulting in casualties: includes all violent incidents involving Israeli settlers and Palestinians, including those in which the injury was caused by a member of the Israeli security forces during an intervention in such an incident.
5. Incidents resulting in property damage/losses: ibid.Search and Arrest
6. Palestinians in Israeli custody: includes all Palestinians from the oPt held by the Israeli authorities at the end of each month, whether in Israel or in the West Bank, in connection to an offense related to the Israeli occupation and classified by the Israeli authorities as a “security detainee/prisoner”. Therefore it excludes Palestinians held in connection to a “regular” criminal offense.
7. Administrative detainees: Palestinians held by the Israeli authorities without charge or trial, allegedly for preventive purposes.
Demolitions
8. Structures demolished: includes all Palestinian-owned structures in the oPt demolished by the Israeli authorities, regardless of their specific use (residential or non-residential) or the grounds on which the demolition was carried out (lack of building permit, military operation or punishment).
9. People displaced due to demolitions: includes all persons that were living in structures demolished by the Israeli authorities, regardless of the place in which they relocated following the demolition.
10. People affected by demolitions: includes all people that benefited from a demolished structure (as a source of income, to receive a service, etc), excluding those displaced.
Access West Bank
11. Permanently staffed checkpoints: staffed by Israeli security personnel, excluding checkpoints located on the Green Line and ‘agricultural gates’ along the Barrier.
12. Partially staffed checkpoints: checkpoint infrastructure staffed on an ad-hoc basis. 13. Unstaffed obstacles: includes roadblocks, earthmounds, earth walls, road gates, road barriers, and trenches. For
historical reasons, this figure excludes obstacles located within the Israeli-controlled area of Hebron City (H2). 14. ‘Flying’ or random checkpoints: checkpoints deployed on an ad hoc basis in places without pre-existing infrastructure. Access to health
15. Applications for permits to leave Gaza through Erez: includes only the applications submitted for travel scheduled within the reporting period.
16. Delayed applications: includes applications regarding which no answer was received by the date of the medical appointment, thus forcing the patient to restart the application process.
Movement of humanitarian staff
17. Incidents of delayed or denied access at a WB checkpoint: includes incidents affecting local or international staff of humanitarian organizations, both UN and international NGOs.
Imports to Gaza
18. Truckloads by type: for historical reasons this figure excludes truckloads carrying all types of fuel. Child Protection
19. Attacks include the targeting of schools that cause the total or partial destruction of such facilities. Other interferences to the normal operation of the facility may also be reported, such as the occupation, shelling, targeting for propaganda of, or otherwise causing harm to school facilities or its personnel.
Monthly Indicator Notes and Clarifications