human settlements - national treasury. chapter 6... · greater role in managing and developing...
TRANSCRIPT

105
6 Human settlements
Introduction
Since 1994, the South African state has provided about 3.7 million
housing opportunities; this is the term used by the Department of
Human Settlements to refer to houses built or under construction and
for housing subsidies that have been approved. However, adequate
housing continues to be one of the main problems facing the country.
The 2013 General Household Survey shows that 13.6 per cent of all
dwellings are informal. This is lower than the 15.7 per cent of 2005;
but at the current rate of delivery, the eradication of informal
settlements, originally anticipated for 2014, is likely to be achieved
only in 2030. Causes of this include the rise in property prices
between 2000 and 2007, which made housing unaffordable for many
low-income families; and supply-side constraints such as access to
suitable land, finance and basic services infrastructure.
Government’s comprehensive plan for the development of sustainable
human settlements has shifted the state’s focus from delivering
commoditised housing to supporting the entire property market and
ensuring that housing is delivered in sustainable and habitable
settlements. Underpinned by policy that responds to demand and to
the needs of poor households, sustainable human settlements can be
achieved through integrated planning and good governance that
supports optimal land use and stimulates private investment.
This chapter assesses the state of low-income housing delivery,
reviews expenditure and delivery performance, and outlines the
medium-term focus.
There is a shift from
delivering commoditised
housing to ensuring that
housing is delivered in
sustainable, habitable
settlements

PROVINCIAL BUDGETS AND EXPENDITURE REVIEW: 2010/11 – 2016/17
106
Current landscape
South African settlement patterns are consistent with global
urbanisation trends. Figure 6.1 below shows how rural/urban patterns
have changed worldwide since 1950 and how they are expected to
develop to 2050.
Figure 6.1 Global urbanisation patterns per world region, 1950 – 2050
Source: United Nations, World Urbanisation Prospects, 2011
Although the majority of Africa’s population live in rural areas, the
development patterns are quite clear. As with all other parts of the
world, there is an inexorable trend towards urbanisation. This creates
both risks and opportunities in meeting the developmental needs of the
continent’s people.
Census 2011 clearly illustrates the rapid shifts in South Africa and
shows that, in contrast to the continent as a whole, about 63 per cent
of the country’s population now lives in urban areas. The National
Development Plan (NDP) estimates that there will be 7.8 million more
people in the country’s urban centres by 2030, or about 70 per cent of
the total population. Along with other pressures such as environmental
and transportation issues, the development of sustainable human
settlements with security of tenure is inextricably linked with a
credible urban development strategy. Provinces with large city-
regions, such as Gauteng, Western Cape and KwaZulu-Natal, are thus
key priority areas notwithstanding the existence of policy for rural
development.
Figure 6.2 shows the steady decline in informal dwellings throughout
the country and in most provinces. Nevertheless, given the size of the
housing problem, government is accelerating the implementation of its
programmes relating to this type of housing. There are currently
approximately 1.2 million informal dwellings in the country.

CHAPTER 6: HUMAN SETTLEMENTS
107
Figure 6.2 Percentage of households living in informal dwellings
1996 2001 2007 2011
EC 11.2 11.2 8.1 7.7
FS 26.2 26.1 19.5 15.7
GT 24.1 23.9 23.6 18.9
KZN 11.1 10.7 8.9 8.3
LIM 5.3 7.1 5.7 5.2
MPU 14 14.5 12.1 10.9
NC 12.8 11.3 10.9 13.1
NW 23.4 22.9 24.8 21.2
WC 16.7 16.2 14.3 18.2
EC FS GT KZN LIM MPU NC NW WCSouthAfrica
1996 11.2 26.2 24.1 11.1 5.3 14 12.8 23.4 16.7 16.2
2001 11.2 26.1 23.9 10.7 7.1 14.5 11.3 22.9 16.2 16.4
2007 8.1 19.5 23.6 8.9 5.7 12.1 10.9 24.8 14.3 14.9
2011 7.7 15.7 18.9 8.3 5.2 10.9 13.1 21.2 18.2 13.6
0
5
10
15
20
25
30
Pe
rc
en
tag
e
Source: Statistics South Africa (2011 Census)
Government has also committed itself to providing 20 000 additional
rental units per year for low- and middle-income households.
Complementary programmes will help to increase access to water
from 92 per cent to 100 per cent; sanitation from 69 per cent to
100 per cent; refuse removal from 64 per cent to 75 per cent; and
electricity from 81 per cent to 92 per cent. These targets have been set
for the period ending March 2016.
The very significant progress that the country has made in providing
basic services is shown in Figure 6.3 below.
Figure 6.3 Access to sanitation: 1994/95 – 2011/12
Source: Statistics South Africa
To support densification and improve the efficient use of space, the
national Housing Development Agency, together with state-owned
enterprises and the departments of Public Works, Rural Development
and Land Reform, and Public Enterprises will be releasing 6 250
hectares of state-owned land for housing.
6 250 hectares of state-
owned land are to be
released for human
settlements

PROVINCIAL BUDGETS AND EXPENDITURE REVIEW: 2010/11 – 2016/17
108
Institutional arrangements
The Constitution assigns housing as a concurrent function of national
and provincial government. The Housing Act (1997) outlines the
responsibilities of national, provincial and local government for
housing delivery. The national Department of Human Settlements
develops policy and strategy, determines delivery goals, monitors and
evaluates sector performance, establishes a national funding
framework for housing development, and allocates the housing
subsidy budget to provincial departments and public entities.
Provinces manage policy within their jurisdiction, implement
programmes, manage stakeholder relations, ensure compliance with
financial management legislation, and account for expenditure and
performance on the Human Settlements Development grant. They
approve housing subsidies and projects, provide support to
municipalities and evaluate municipal applications for accreditation as
housing delivery agents.
Municipalities create an enabling environment for housing
development in their areas of jurisdiction. They also provide and
operate infrastructure and services such as water, sanitation, roads and
(in many cases) electricity. Municipalities share responsibility with
provinces for the release of land for housing development, land use
planning, and land use and building control. They often act as housing
developers.
Municipal accreditation
Government is expanding the role of municipalities, particularly in
metropolitan areas, in managing and developing human settlements.
This is necessary to integrate housing and infrastructure planning and
delivery at local level.
There are three levels of accreditation:
Level 1 identifies the foundational roles of a municipality (such as
drafting high-level housing strategy and managing beneficiaries)
and allows it to budget for human settlements expenditure.
Level 2 allows a municipality to manage programmes and
administer subsidies (excluding individual and relocation
subsidies).
Level 3 assigns the full housing function to a municipality, giving
it authority for financial administration and disbursement of
subsidies.
Provinces have assigned Level 2 accreditation to Johannesburg,
eThekwini, Tshwane, Cape Town, Nelson Mandela Bay, Ekurhuleni
and two district municipalities. To date, no municipality has received
Level 3 accreditation.
Provinces account for
spending and performance
on the Human Settlements
Development grant
Municipalities will have a
greater role in managing
and developing human
settlements
CHAPTER 6: HUMAN SETTLEMENTS
109
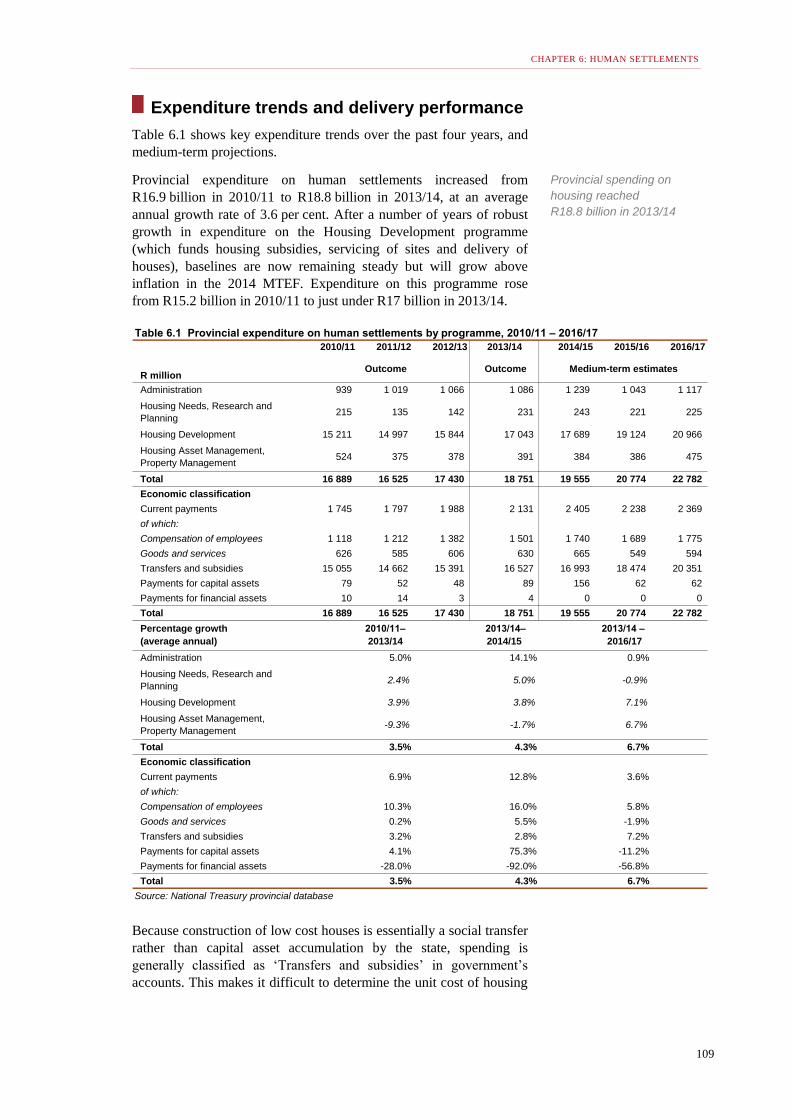
Expenditure trends and delivery performance
Table 6.1 shows key expenditure trends over the past four years, and
medium-term projections.
Provincial expenditure on human settlements increased from
R16.9 billion in 2010/11 to R18.8 billion in 2013/14, at an average
annual growth rate of 3.6 per cent. After a number of years of robust
growth in expenditure on the Housing Development programme
(which funds housing subsidies, servicing of sites and delivery of
houses), baselines are now remaining steady but will grow above
inflation in the 2014 MTEF. Expenditure on this programme rose
from R15.2 billion in 2010/11 to just under R17 billion in 2013/14.
Table 6.1 Provincial expenditure on human settlements by programme, 2010/11 – 2016/17
2010/11 2011/12 2012/13 2013/14 2014/15 2015/16 2016/17
R millionOutcome Outcome Medium-term estimates
Administration 939 1 019 1 066 1 086 1 239 1 043 1 117
Housing Needs, Research and
Planning215 135 142 231 243 221 225
Housing Development 15 211 14 997 15 844 17 043 17 689 19 124 20 966
Housing Asset Management,
Property Management524 375 378 391 384 386 475
Total 16 889 16 525 17 430 18 751 19 555 20 774 22 782
Economic classification
Current payments 1 745 1 797 1 988 2 131 2 405 2 238 2 369
of which:
Compensation of employees 1 118 1 212 1 382 1 501 1 740 1 689 1 775
Goods and services 626 585 606 630 665 549 594
Transfers and subsidies 15 055 14 662 15 391 16 527 16 993 18 474 20 351
Payments for capital assets 79 52 48 89 156 62 62
Payments for financial assets 10 14 3 4 0 0 0
Total 16 889 16 525 17 430 18 751 19 555 20 774 22 782
Administration 5.0% 14.1% 0.9%
Housing Needs, Research and
Planning2.4% 5.0% -0.9%
Housing Development 3.9% 3.8% 7.1%
Housing Asset Management,
Property Management-9.3% -1.7% 6.7%
Total 3.5% 4.3% 6.7%
Economic classification
Current payments 6.9% 12.8% 3.6%
of which:
Compensation of employees 10.3% 16.0% 5.8%
Goods and services 0.2% 5.5% -1.9%
Transfers and subsidies 3.2% 2.8% 7.2%
Payments for capital assets 4.1% 75.3% -11.2%
Payments for financial assets -28.0% -92.0% -56.8%
Total 3.5% 4.3% 6.7%
Source: National Treasury provincial database
2013/14 –
2016/17
Percentage growth
(average annual)
2010/11–
2013/14
2013/14–
2014/15
Because construction of low cost houses is essentially a social transfer
rather than capital asset accumulation by the state, spending is
generally classified as ‘Transfers and subsidies’ in government’s
accounts. This makes it difficult to determine the unit cost of housing
Provincial spending on
housing reached
R18.8 billion in 2013/14

PROVINCIAL BUDGETS AND EXPENDITURE REVIEW: 2010/11 – 2016/17
110
in each province and municipality, and how these costs are affected by
factors such as location and the cost of materials.
Total provincial expenditure is expected to grow at an annual average
rate of 6.7 per cent. The Human Settlements Development grant grows
at 7.4 per cent over the 2014 MTEF.
Table 6.2 Human settlements development grant per province, 2010/11 – 2016/17
2010/11 2011/12 2012/13 2013/14 2014/15 2015/16 2016/17
R millionOutcome Outcome Medium-term estimates
Eastern Cape 1 504 1 897 2 002 2 524 2 159 1 929 2 147
Free State 1 038 911 976 1 351 1 062 1 132 1 253
Gauteng 3 737 3 488 4 004 4 064 4 418 5 066 5 631
KwaZulu-Natal 2 711 2 770 2 943 3 334 3 273 3 314 3 547
Limpopo 1 265 1 170 1 189 295 1 219 1 202 1 329
Mpumalanga 1 011 917 953 1 013 1 147 1 316 1 450
Northern Cape 448 323 340 578 375 376 416
North West 1 039 1 149 1 064 1 341 1 517 2 154 2 364
Western Cape 1 940 1 639 1 725 1 959 1 915 2 044 2 271
Total 14 692 14 262 15 195 16 459 17 084 18 533 20 410
Eastern Cape 18.8% -14.4% -5.2%
Free State 9.2% -21.4% -2.5%
Gauteng 2.8% 8.7% 11.5%
KwaZulu-Natal 7.1% -1.8% 2.1%
Limpopo -38.4% 313.3% 65.2%
Mpumalanga 0.1% 13.2% 12.7%
Northern Cape 8.8% -35.1% -10.3%
North West 8.9% 13.1% 20.8%
Western Cape 0.3% -2.3% 5.1%
Total 3.9% 3.8% 7.4%
Source: National Treasury provincial database
2013/14 –
2016/17
Percentage growth
(average annual)
2010/11–
2013/14
2013/14–
2014/15
The Human Settlements Development Grant
Spending on the Human Settlements Development grant increased
from R14.7 billion in 2010/11 to R16.5 billion in 2013/14, although
this is muted compared with the average annual rate of over 23 per
cent between 2008/09 and 2010/11. This growth can be accounted for
by the additional allocations made to increase delivery of subsidised
housing. Between 2008/09 and 2011/12, expenditure in the Eastern
Cape, for instance, increased at an average annual rate of
64.6 per cent. These dramatic funding increases could clearly not be
maintained, particularly as the effects of the global financial crisis
began to affect government’s fiscal position. However, these escalated
amounts have now been built into the baseline allocation going
forward and total expenditure is expected to grow to R20.4 billion in
2016/17, at an average annual rate of 7.4 per cent.
The reduction in expenditure between 2010/11 and 2011/12 in the
Free State, Gauteng, Limpopo, Mpumalanga, Northern Cape and
Western Cape was the result of the new allocation formula for the
Human Settlements Development grant and the creation of the Urban
Settlements Development grant. The fund remained largely
Spending on the Human
Settlements Development
grant reached R16.5 billion
in 2013/14

CHAPTER 6: HUMAN SETTLEMENTS
111
unchanged; it was simply allocated directly to the cities delivering the
housing units.
Capacity and personnel
Although personnel expenditure as a percentage of total spending on
human settlements is small, it provides insight into how provinces
implement national programmes and deliver houses.
2010/11 2011/12 2012/13 2013/14 2014/15 2015/16 2016/17
R millionOutcome Outcome Medium-term estimates
Eastern Cape 158 170 199 226 250 262 276
Free State 34 39 65 92 103 123 127
Gauteng 246 247 299 317 348 372 393
KwaZulu-Natal 175 188 208 244 290 311 327
Limpopo 157 172 174 137 197 209 224
Mpumalanga 105 120 126 137 161 171 180
Northern Cape 55 62 72 84 86 96 94
North West 78 91 102 114 129 136 143
Western Cape 112 122 137 150 165 175 184
Total 1 118 1 212 1 382 1 501 1 729 1 855 1 949
Eastern Cape 12.7% 10.7% 6.9%
Free State 40.0% 12.0% 11.1%
Gauteng 8.8% 10.0% 7.5%
KwaZulu-Natal 11.7% 18.8% 10.3%
Limpopo -4.5% 43.8% 17.9%
Mpumalanga 9.4% 17.3% 9.4%
Northern Cape 15.2% 2.8% 4.0%
North West 13.4% 13.4% 8.1%
Western Cape 10.5% 9.8% 7.0%
Total 10.3% 15.2% 9.1%
Source: National Treasury provincial database
2013/14 –
2016/17
Table 6.3 Human settlements expenditure on compensation of employees per province,
2010/11 – 2016/17
Percentage growth
(average annual)
2010/11–
2013/14
2013/14–
2014/15
Personnel expenditure in provincial human settlements departments
increased from R1.1 billion in 2013/14 to R1.5 billion in 2013/14, at
an average annual rate of 10.3 per cent. Expenditure on personnel is
expected to increase to R1.9 billion in 2016/17, at an average annual
rate of 9.1 per cent. This is an improvement on historical trends;
however, the averages conceal some significant differences. As the
table above shows, Limpopo is planning to reduce compensation
spending in nominal terms, while Free State and KwaZulu-Natal will
continue to spend significantly on this item. Within this context, it is
important to note that a number of human settlements departments
have historically been combined with other sectors (most notably
Local Government and Traditional Affairs). This makes trend
analysis difficult, particularly in years where a departmental change is
proclaimed by the Premier, requiring the movement of staff from one
department to another.

PROVINCIAL BUDGETS AND EXPENDITURE REVIEW: 2010/11 – 2016/17
112
Western Cape uses municipalities as developers; as a result, the
project and contract management risks reside with the municipalities.
Consequently, the province does not need to build capacity to manage
these risks, and provincial budgets are unaffected. In contrast,
Gauteng, Eastern Cape and Free State act as developers and carry the
associated risks; these provinces have built capacity to manage
projects and programmes.
Service delivery quality
Up to 17 different programmes operate under the comprehensive
human settlements delivery strategy. These include integrated
residential development, upgrading of informal settlements, rental
housing and emergency housing assistance.
While statistics on subsidised housing have not been fully reliable and
data has at times been missing for certain provinces, the 2013 General
Household Survey confirms that more than 77 percent of the
population now live in formal dwellings compared with 64 per cent in
1994. It should be noted that the gap between “formal” dwellings and
“informal” dwellings includes “rural” and “other” in the publication
by Statistics South Africa. The value of the state-subsidised housing
market is now estimated at R300 billion compared to R100 billion in
1994.
The 2013 General Household Survey also reports on the perceived
quality of dwellings. About 16 per cent of subsidised households
report that their walls are weak or very weak and 14.8 per cent report
that their roofs are weak or very weak. Reports of poor quality are
highest in the Eastern Cape, Northern Cape and Western Cape where
they exceed 20 per cent.
Figure 6.4 Survey of the observed quality of low-cost houses
Walls weak or
very weak
Roof weak or
very weak
EC 28.7 29
FS 18.3 16.1
GT 7.9 6
KZN 14.2 13.3
LIM 13.4 15.8
MPU 12.1 15.1
NC 21.9 22.4
NW 14.6 11.9
WC 23.4 23.3
Source: Statistics South Africa 15.3
EC FS GT KZN LIM MPU NC NW WC RSA
Walls weak or very weak 28.7 18.3 7.9 14.2 13.4 12.1 21.9 14.6 23.4 15.9
Roof weak or very weak 29 16.1 6 13.3 15.8 15.1 22.4 11.9 23.3 15.3
0
5
10
15
20
25
30
35
Pe
rc
en
tag
e
Since 2002, any structural defects in low-income houses have been
covered by a warranty scheme managed by the National Home
Builders Registration Council (NHBRC). Provinces are required to
Personnel expenditure
figures vary depending on
how provinces manage
project and contract
management risks

CHAPTER 6: HUMAN SETTLEMENTS
113
register subsidy projects with the Council. This takes place in two
phases. Phase 1 is project enrolment, which includes a geotechnical
investigation with a focus on soil classification and ground conditions.
Phase 2 is home enrolment, which includes the township layout plan,
house drawings and specifications.
The NHBRC reports on the number of homes in the subsidy sector.
Provinces that do not enrol houses place a strain on provincial
rectification budgets as the warranty will not cover structural defects
in these houses. Failure to enrol houses means that provinces, as the
developers, are in breach of the Housing Consumers Protection
Measures Act (1998).
Medium-term outlook
Upgrading informal settlements
The requirement that provinces have prioritised programmes for
upgrading informal settlements, and for municipalities to have
transformational project plans, should ensure alignment with national
programmes and speed up the upgrading of informal settlements.
However, many provincial departments lack programmatic
approaches to upgrading, choosing instead project-linked subsidies.
These have often proven to be ad hoc and reactive rather than
proactive and influenced by provincial political priorities. A more
proactive approach by provinces and municipalities will enable them
to better harness resources, broaden their bases of experience and
innovation, and implement housing programmes on an appropriate
scale.
A number of programmes have been introduced to assist
municipalities with the skills and techniques to increase and improve
upgrading of informal settlements. The Breaking New Ground (BNG)
programme sets a target of upgrading 400 000 households in informal
settlements. Although this comprehensive plan identified the need for
informal settlement upgrading, incremental upgrading has not been
pursued at scale because it has been seen as less important than formal
housing provision. The purpose of the National Upgrade Support
Programme (NUSP) is to assist with improving the current approach
to upgrading informal settlements. Its upgrading resource toolkit
provides examples of implementation solutions and good practice, and
a capacity-building programme for provinces, municipalities and
communities.
Value for money
The mismatch between above-inflation growth in allocations and
declining housing delivery is a sign that there are problems in the
implementation of the national housing programme. The variances
between projected and actual expenditure show that provinces are not
implementing projects according to plan.
A lack of a programmatic
approach to upgrading
informal settlements has
undermined the programme
in provinces

PROVINCIAL BUDGETS AND EXPENDITURE REVIEW: 2010/11 – 2016/17
114
A pattern showing a spending surge in the fourth quarter of the
financial year does not appropriately reflect the three-year project
implementation cycle. Such trends, together with provincial over-
commitments and poor contract management, raise questions about
provinces’ ability to administer the Human Settlements Development
grant effectively.
Over the medium term, government must focus on strengthening
accountability and oversight to ensure improved planning and
delivery. This will require a review of planning frameworks, stronger
reporting and improved efficiency of allocations.
The role of local government
A “one size fits all” approach will not succeed in this sector. Large
cities are economic hubs and the largest sources of employment. In
2004, approximately 79 per cent of the country’s gross value added
(GVA) arose from its large cities and towns. This has been followed
by growth in the urban population and the urban poor.
Local government reforms need to address any current arrangements
that reinforce inequality and inefficiency, such as land-use
management.
Given the trends in migration and urbanisation, the role of
metropolitan municipalities in upgrading informal settlements is being
strengthened over the medium term, and the grant system is evolving
to improve the built environment and support sustainable human
settlements. The new Urban Settlements Development grant, which
consolidates the Municipal Infrastructure grant (for cities) with the
Human Settlements Development grant will help the eight
metropolitan municipalities to improve their efficiency and to
coordinate their management of the built environment.
Conclusion
The provision of housing is a deeply complex issue. Reforming and
co-ordinating the state’s role in it requires a wide array of policies and
systems. The National Development Plan identifies the following
issues as critical to finding a workable solution:
A long-term perspective on spatial transformation must be kept in
mind while addressing short-term needs.
The correct balance must be found between protecting the property
rights of vulnerable individuals, protecting state investment,
allowing integration of state-provided housing into the property
market to stimulate the secondary housing market and ensuring
locational flexibility for housing beneficiaries.
A national discussion is required on the future funding of housing
in South Africa and on the roles of the state, the private sector and
individual households in providing housing and creating integrated
and sustainable human settlements.
The Urban Settlements
Development Grant will help
metropolitan municipalities
improve efficiency

CHAPTER 6: HUMAN SETTLEMENTS
115
Innovation is urgently required as the current trajectory of housing
provision must be changed if the overall objectives of human
settlement transformation are to be achieved.
The state must play its role appropriately in providing basic
services and developing bulk services.
Management competence at the municipal level is critical to the
overall objective.
Many developed and developing economies are grappling with how to
ensure housing for their populations. Providing adequate shelter can
be a powerful part of the economy and contribute to social cohesion.
Until recently, a range of functional misalignments and the absence of
a broad view of the housing mandate have frustrated South Africa’s
policy objectives in this area. These shortcomings have been
recognised, and remedial measures are under way.
The available data does not provide information about many of the
important issues that affect the delivery of state-subsidised housing,
such as community relations, consultation, tradition, spatial efficiency
and integration.
Fast-tracking the delivery of sustainable human settlements requires a
bold acknowledgement of South Africa’s increasingly urban nature,
and a commitment to proper planning, particularly in the large cities.

PROVINCIAL BUDGETS AND EXPENDITURE REVIEW: 2010/11 – 2016/17
116