human resources solutions -...
TRANSCRIPT

Annual report 2004
H U M A N R E S O U R C E S S O L U T I O N S
SOLVUS RESOURCE GROUP
Bird’s-eye view 2
Key figures 4
Message to the shareholders 6
Profile 8
Temporary staffing 13
Secondment & projects 19
Services & consultancy 22
Brands portfolio 24
INFORMATION FOR SHAREHOLDERS
Report of the Board of Directors 26
Commentary on the consolidated
annual accounts - Operational overview -
Strategy - Outlook - Statutory annual
accounts and dividend - Effect of IFRS
introduction
Board of Directors and Committees 34
Corporate Governance 36
General information for shareholders 40
Capital - Shares - Composition of the Board
of Directors - Shareholding - General meeting
General information 42
FINANCIAL OVERVIEW
Consolidated annual accounts - Annex to 44
the consolidated annual accounts -
Auditor’s report
IFRS consolidated financial statements - 62
Auditor’s report – Valuation rules
Condensed statutory annual accounts 80
Addresses of the main operating companies 86
FINANCIAL CALENDAR
3 March 2005 Annual results 2004
12 April 2005 Annual Report 2004 available
for downloading from
www.solvus.com
14 April 2005 Analysts’ day
10 May 2005 General meeting
10 May 2005 Trading update first quarter
26 August 2005 Half-year results 2005
17 November 2005 Trading update third quarter
9 March 2006 Annual results 2005
INVESTOR RELATIONS CONTACT
Rob Zandbergen
Chief Financial Officer
Tel.: + 32 3 220 78 52
Fax: + 32 3 213 33 39
On 29 March 2005, the Banking, Finance and Insurance Commission granted
permission for this annual report to be used as a reference document for all
public issues of stock that might be made by Solvus NV up until the time of
publication of its next annual report, within the context of the Law dated
22 April 2003 concerning the public offering of stock by means of the pro-
cedure for the provision of separate information. Within the context of
that procedure, this annual report must be accompanied with an activity
report in order to constitute a prospectus within the meaning of Chapter 4
of the Law of 22 April 2003. This prospectus must be submitted for approval
to the Banking, Finance and Insurance Commission pursuant to article 14 of
the Law of 22 April 2003.

We are proud to share the same four values that
lie at the core of our success.
EntrepreneurshipA decentralised structure promotes responsibility and creates the
dynamism and the will to succeed.
ProximityLocal expertise, flexibility and a readiness to listen form the basis on
which we carry out assignments successfully.
Passion Enthusiasm and awareness of our socio-economic role in our markets are
the driving forces behind personal and collective development.
Ethics Our employees, candidates and clients are the very reason for our success.
We aim to create a corporate culture based on mutual respect and
confidence.

1,45 billion euro
13 STRONG BRANDS
3activities
> temporary staffing > secondment & projects > services & consultancy
1963
bird’s-ebird’s-eye view
founded inBelgium in
35 operating companies
275,00050,000 customers per year
3,200 permanent employees
candidates per year set to work
2 SOLVUS RESOURCE GROUP

TOTAL OPERATING INCOME PER ACTIVITY IN 2004TOTAL OPERATING INCOME PER COUNTRY IN 2004
ye view10Europeancountries
740offices
European top five player in human resources solutions
Switzerland1.9%Austria
2.5%
Belgium26.1%
France28.6%
Germany 3.6%
Italy4.1%
Luxembourg1.4%
The Netherlands 26.0%
Poland0.9%
Spain4.9%
Services &Consultancy
0.6%
Secondments &Projects7.4%
SpecialisedTemporaryStaffing13.4%
GeneralTemporaryStaffing78.6%
SOLVUS RESOURCE GROUP 3
4 SOLVUS RESOURCE GROUP
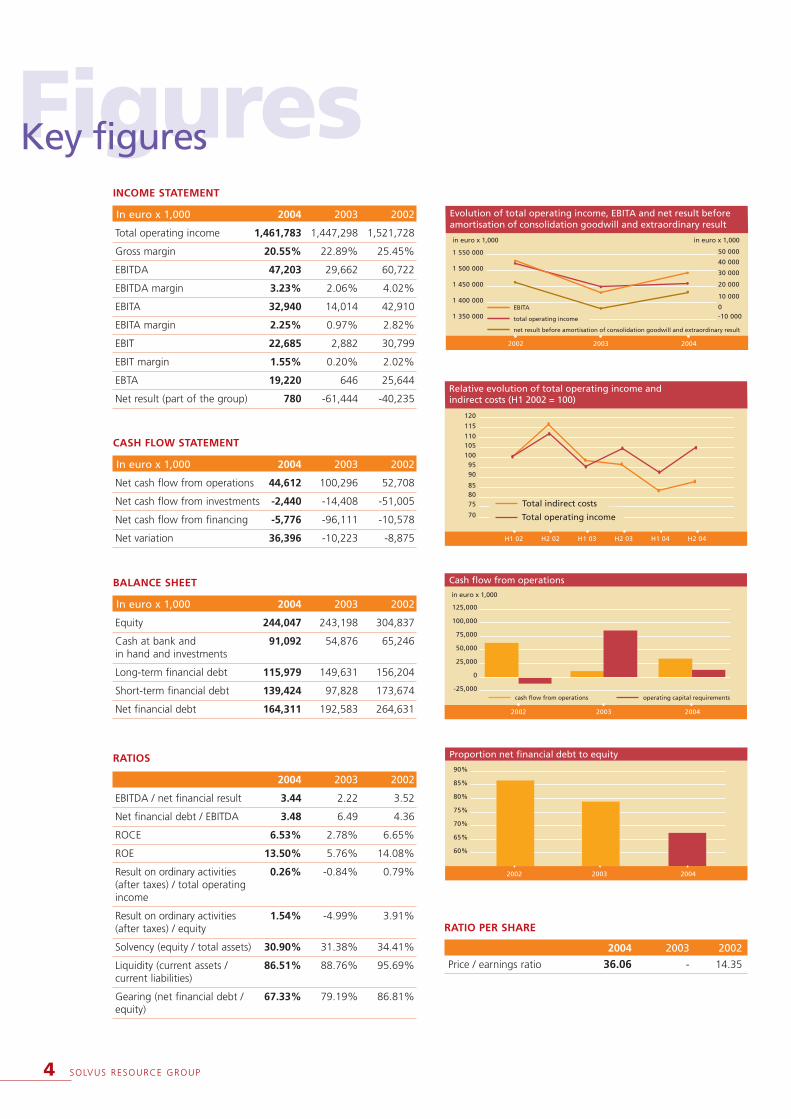
FiguresKey figures
total operating income
net result before amortisation of consolidation goodwill and extraordinary result
EBITA
Evolution of total operating income, EBITA and net result beforeamortisation of consolidation goodwill and extraordinary result
2002 2003 2004
1 550 000
1 500 000
1 450 000
1 400 000
1 350 000
10 000
20 000
30 000
40 000
50 000
0-10 000
in euro x 1,000 in euro x 1,000
Relative evolution of total operating income and indirect costs (H1 2002 = 100)
105 100
110
115
120
8075
70
9590
85
H1 02 H2 02 H1 03 H2 03 H1 04 H2 04
Total operating income
Total indirect costs
Cash flow from operations
125,000
100,000
75,000
50,000
25,000
0
-25,000
200420032002
cash flow from operations operating capital requirements
in euro x 1,000
RATIO PER SHARE
2004 2003 2002
Price / earnings ratio 36.06 - 14.35
CASH FLOW STATEMENT
In euro x 1,000 2004 2003 2002
Net cash flow from operations 44,612 100,296 52,708
Net cash flow from investments -2,440 -14,408 -51,005
Net cash flow from financing -5,776 -96,111 -10,578
Net variation 36,396 -10,223 -8,875
BALANCE SHEET
In euro x 1,000 2004 2003 2002
Equity 244,047 243,198 304,837
Cash at bank and 91,092 54,876 65,246in hand and investments
Long-term financial debt 115,979 149,631 156,204
Short-term financial debt 139,424 97,828 173,674
Net financial debt 164,311 192,583 264,631
RATIOS
2004 2003 2002
EBITDA / net financial result 3.44 2.22 3.52
Net financial debt / EBITDA 3.48 6.49 4.36
ROCE 6.53% 2.78% 6.65%
ROE 13.50% 5.76% 14.08%
Result on ordinary activities 0.26% -0.84% 0.79%(after taxes) / total operating income
Result on ordinary activities 1.54% -4.99% 3.91%(after taxes) / equity
Solvency (equity / total assets) 30.90% 31.38% 34.41%
Liquidity (current assets / 86.51% 88.76% 95.69%current liabilities)
Gearing (net financial debt / 67.33% 79.19% 86.81%equity)
90%
85%
80%
75%
70%
65%
60%
Proportion net financial debt to equity
200420032002
INCOME STATEMENT
In euro x 1,000 2004 2003 2002
Total operating income 1,461,783 1,447,298 1,521,728
Gross margin 20.55% 22.89% 25.45%
EBITDA 47,203 29,662 60,722
EBITDA margin 3.23% 2.06% 4.02%
EBITA 32,940 14,014 42,910
EBITA margin 2.25% 0.97% 2.82%
EBIT 22,685 2,882 30,799
EBIT margin 1.55% 0.20% 2.02%
EBTA 19,220 646 25,644
Net result (part of the group) 780 -61,444 -40,235
SOLVUS RESOURCE GROUP 5
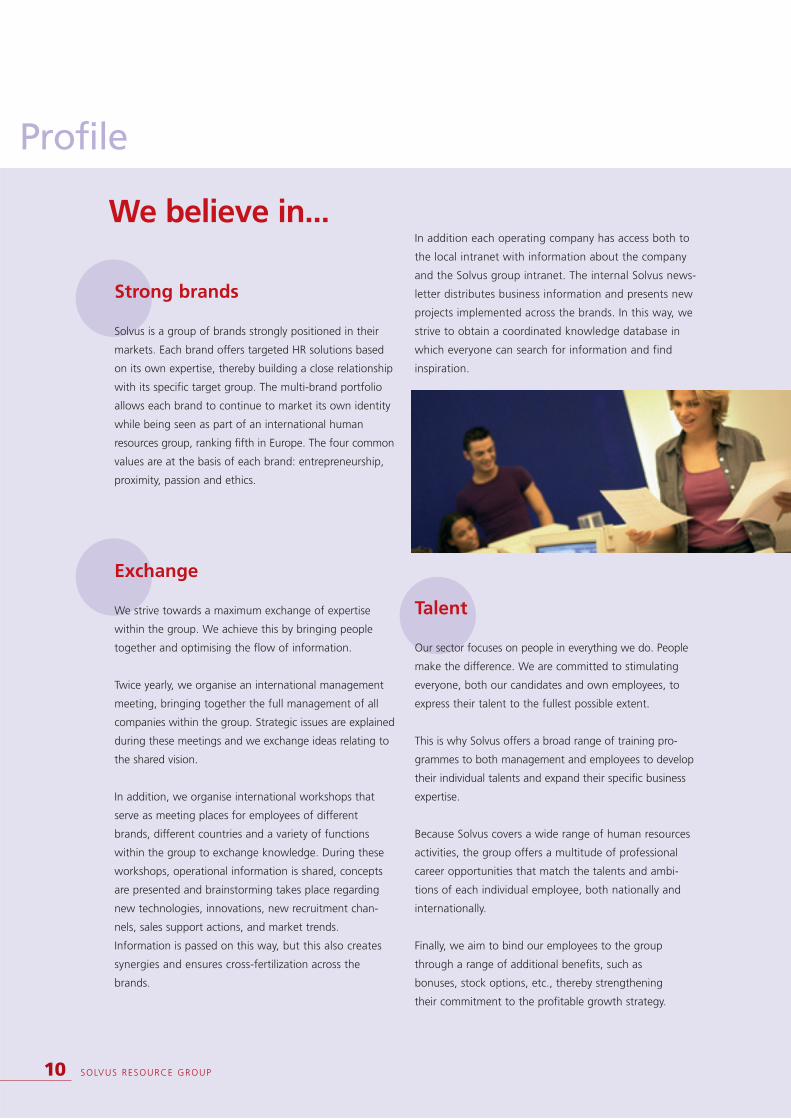
J F M A M J J A S O N D2004
Solvus
BEL20
Solvus vs BEL20
160
140
120
100
80
60
40
20
160
140
120
100
80
60
40
20
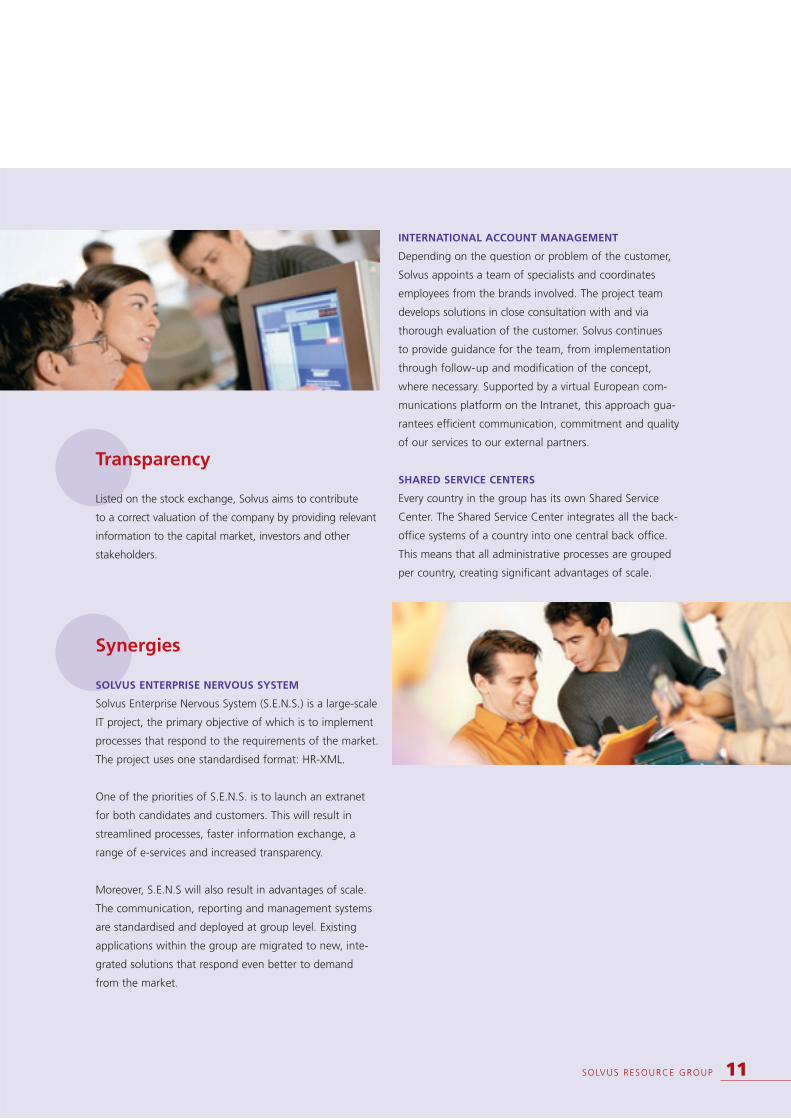
J F M A M J J A S O N D2004
Solvus
Next150
Solvus vs Euronext Next150
18
14
10
8
6
4
2
0
250,000
200,000
150,000
100,000
50,000
0
16
12
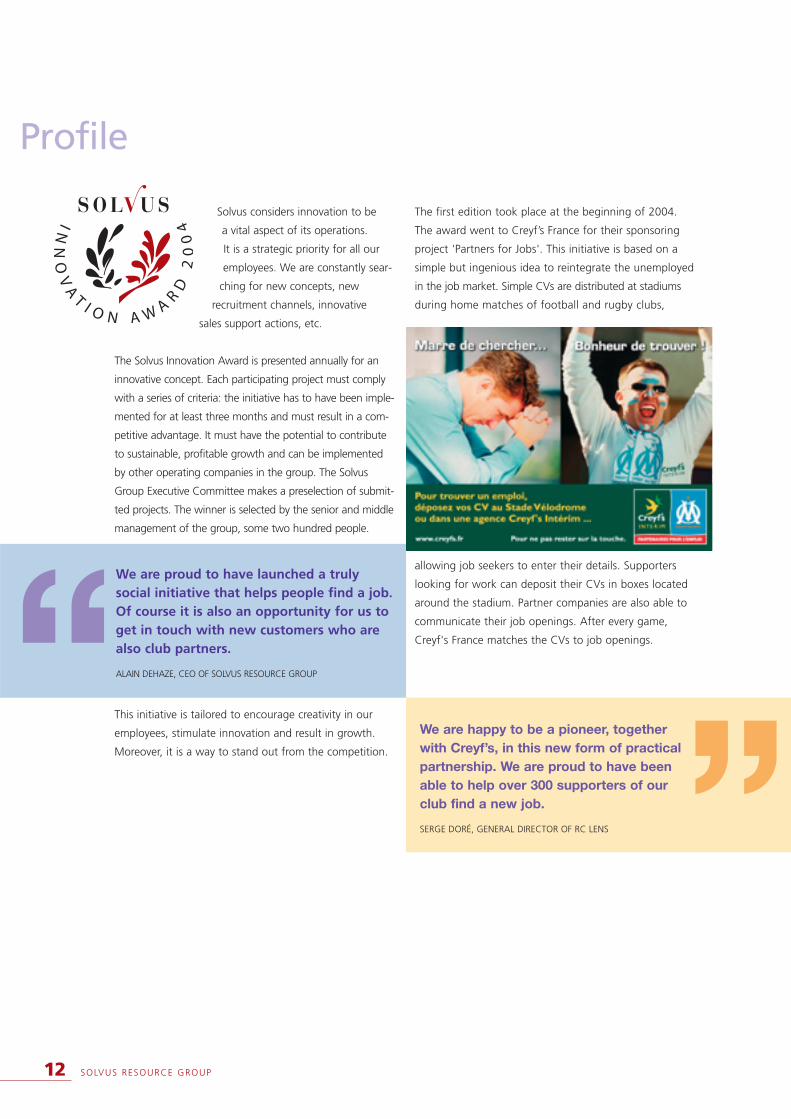
J F M A M J J A S O N D2004
Closing price
Volume
Closing prices and volumes
GENERAL INFORMATION
2004 2003 2002
Number of shares 25,180,691 25,180,691 25,180,691
• Ordinary shares 10,312,500 10,312,500 10,312,500
• VVPR 299,440 299,440 299,440
• Ordinary shares 14,568,751 14,568,751 14,568,751with VVPR strip sheet
Average daily volume 35,245 31,417 34,632
31/12/04 31/12/03 31/12/02
Stock market 320,968,138 287,129,632 195,150,355capitalisation (in euro)
27/01/04 31/12/03 09/05/02
Year high (in euro) 16.25 11.50 24.75
27/07/04 01/04/03 13/11/02
Year low (in euro) 11.20 4.45 5.41
Average price (in euro) 13.19 7.25 15.51
Price at 31/12 (in euro) 12.98 11.49 7.75
KEY FIGURES PER SHARE
Calculated on the number of shares at the end of the financial year.
In euro 2004 2003 2002
Intrinsic value 9.69 9.66 12.11
Fractional value per share 8.61 8.61 8.61
EBTA 0.76 0.03 1.02
Result on ordinary 0.36 -0.42 0.54activities before taxes
EPS 0.03 -2.44 -1.60
Net cash flow from operations 1.77 3.98 2.09
Gross dividend - - -
Net dividend - - -
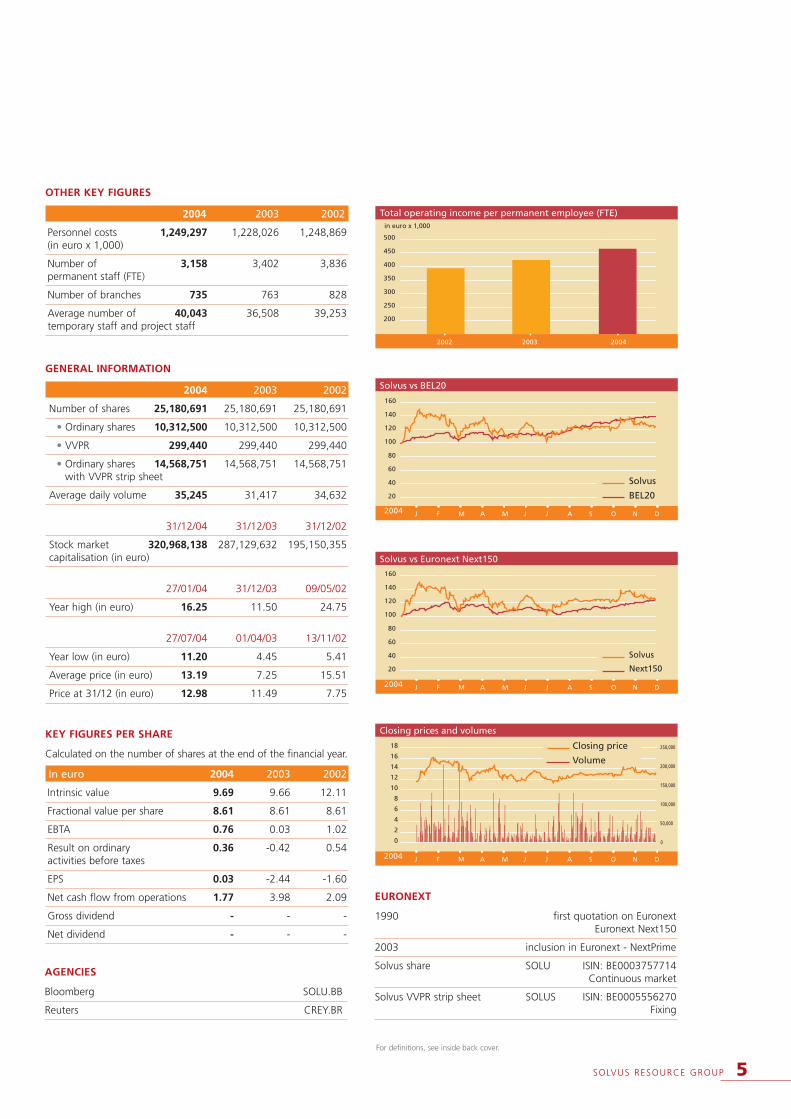
OTHER KEY FIGURES
2004 2003 2002
Personnel costs 1,249,297 1,228,026 1,248,869(in euro x 1,000)
Number of 3,158 3,402 3,836permanent staff (FTE)
Number of branches 735 763 828
Average number of 40,043 36,508 39,253temporary staff and project staff
AGENCIES
Bloomberg SOLU.BB
Reuters CREY.BR
500
450
400
350
300
250
200
Total operating income per permanent employee (FTE)
200420032002
in euro x 1,000
EURONEXT
1990 first quotation on EuronextEuronext Next150
2003 inclusion in Euronext - NextPrime
Solvus share SOLU ISIN: BE0003757714Continuous market
Solvus VVPR strip sheet SOLUS ISIN: BE0005556270Fixing
For definitions, see inside back cover.

6 SOLVUS RESOURCE GROUP
MessageMessage to the shareholders
Dear shareholder,
In 2004 Solvus has completed its turnaround successfully.
Solvus is profitable again, and as a result of the leverage
effect all growth in turnover will contribute to further
improvement in the result.
The objective in 2004 was to finalise the first phase of the
Master Plan 2005, thus laying strong foundations for
sustainable, profitable growth.
Financial objectives have been achieved in terms of cost
cutting, debt reduction and improving working capital. The
cost structure improved further to 18.3% of total operating
income. The working capital was allocated more efficiently
by keeping the number of days sales outstanding constant at
50 days. Net financial debt was reduced to 164 million euro.
The internal organisation was streamlined. The Shared
Service Center was implemented successfully in the
Netherlands. As a result, each country now has centralised
back-office systems for IT, finance, purchasing and facility.
The new ICT strategy was outlined in 2004, its objective
being to implement streamlined processes, faster
exchange of information, greater transparency and the
launch of numerous e-services. This will result in scale
advantages and standardised communications, reporting
and management systems at group level, enabling
Solvus to respond to market conditions more quickly
and effectively.
Senior management was strengthened in several opera-
ting companies, and convened regularly to maximise
IN 2004
SOLVUS HAS
COMPLETED ITS
TURNAROUND
SUCCESSFULLY

SOLVUS RESOURCE GROUP 7
synergy benefits within the group and to exchange
proven concepts.
Thanks to increasing demand in almost all our markets,
including the Netherlands since the fourth quarter of
2004, combined with increased commercial strength,
total operating income increased organically by 4.2%.
The sharpest increase occurred in the fourth quarter,
which is a positive sign for 2005. In the Netherlands,
turnover rose quarter after quarter. Content achieved
growth in its turnover for the first time in years and
gained market share. Turnover also rose in France,
and market share was gained there too. Belgium realised
a record year in terms of both turnover and result.
Gross margin decreased organically by 130 basis
points but stabilised in the second half of the year.
This decrease was the result of pricing pressure in
many markets and a change in the business mix.
A stabilisation in the second half of the year, strength-
ening demand, the rise of the recruitment and selection
share in the final quarter and higher turnover from the
SME segment and the specialised services will have a
beneficial effect on the gross margin.
2004’s operating result has more than doubled in
comparison with 2003. This increase took place espe-
cially in the second half of the year. The cost-cutting
measures that have been carried out are increasingly
showing their effectiveness. 8 out of the 10 countries
have achieved a positive operating result. Switzerland
ended almost break-even, and in Germany losses were
limited and the result is expected to improve further
in 2005. As a result, Solvus is profitable again after two
loss-making years.
In 2004 Schoevers and various activities of Bureau van Dijk
Computer Services were sold. This fitted in with Solvus’
sharpened focus on its core activities. No acquisitions
occurred in 2004.
In addition to general temporary staffing, Solvus also
wants to expand its specialised services. Over the course
of 2004, two new initiatives were successfully launched in
Belgium. HR Forces supports organisations in developing
their human resources management professionally
through the secondment of human resources professio-
nals. Legal Forces seconds legal experts to public and
private organisations.
Solvus is proceeding with its ‘strong brands’ strategy in
a consistent manner. In 2004 the international brand
Accea was launched, which incorporates the activities of
recruitment and selection, assessment and HR consul-
tancy. Accea integrates the former brands Creyf’s Select
and Wessel Coenen. Since the launch of the brand in
France at the start of 2004, Accea is now already opera-
ting in 8 European countries. At the start of 2005, the
two existing brands for outplacement and reintegration
(ADV Consult in Belgium and BCR in the Netherlands)
were integrated in the new international brand Carela.
Carela is now active in 4 countries since its launch in
France and Luxembourg.
In 2005, we will be focussing all our attention on
achieving sustainable, profitable growth. Solvus wants
to improve its turnover and its profitability further in the
near future.
Finally, we would like to thank all our employees for their
efforts in successfully completing the turnaround, our
clients for their loyalty and the shareholders for their
confidence in Solvus.
Alain DehazeCHIEF EXECUTIVE OFFICER
Luc BertrandCHAIRMAN OF THE BOARD OF DIRECTORS

8 SOLVUS RESOURCE GROUP
?ProfileProfile
Who are we?We are a group of strong brands that offer total solutions in human resources. Our expertise focuses
on three activities: temporary staffing, secondment & projects and services & consultancy. We are the
European number five in human resources services with a turnover of 1.45 billion euro.
SOCIO-ECONOMIC ROLE
Solvus and its operating companies fulfil an important
socio-economic role. Employment and career guidance
are the group's core activities. Our objective is to employ
the right talent for the right job. Our candidates can turn
to us throughout their careers for new professional chal-
lenges, guidance and training.
Because ethical behaviour within the group is vital,
we encourage our operating companies to become mem-
bers of national sector organisations. This means that our
high quality standards are officially recognised and that
we contribute to a regulated and socially responsible fra-
mework for the sector. We also ensure correct payment
for all our temporary workers and project staff and pro-
tect the rights of our candidates. Our employees treat
everyone as equals, regardless of origin, gender, age,
religion or disability.
Our strategyDifferentiation through innovation. Achieving organic growth in general
temporary staffing and developing specialised services with high added value,
both through organic growth and acquisition within continental Europe.
Our visionStriving towards the right talent in the
right place. This socio-economic role is
the driving force for all employees of
the group to give their very best.
Providing innovative and flexible human resources
solutions through strong brands at local, national and
European level.Our mission

SOLVUS RESOURCE GROUP 9
Services & ConsultancyThe Solvus brands operating in Services & Consultancy offer tailor-made solutions to the customer. They have different
specialisations, including recruitment & selection, direct search, assessment, career guidance, coaching, presenteism,
consultancy, outplacement and in-placement. Each solution is tailored to the customer's specific needs. In consultation
with the company, we strive to achieve concrete results with high added value. We build a relationship based on trust
with both customers and candidates.
Secondment & ProjectsThe brands within Secondment & Projects focus on well defined profiles. These companies are managed by people with
great experience in the sector. This means they add considerable value for both customers and candidates.
CUSTOMERS
Temporary staffing responds to temporary personnel
requirements for companies in all industries, by offering a
fast solution for peaks in demand for personnel and tem-
porary replacements. Temporary personnel improves effi-
ciency and visibly increases productivity. Our brands are
able to supply large numbers of temporary workers rapid-
ly, thereby responding efficiently to customer needs. They
can also handle the planning of personnel requirements
and ensure that the right number of employees is availa-
ble at the right time. Our brands can also initiate an in-
house project to handle the temporary workers on site at
the company.
CANDIDATES
One of the greatest advantages of temporary staffing is
the freedom it offers to choose how, where and when to
work. Temping offers an extremely flexible solution to
students and job seekers, allowing them to gain valuable
experience in a range of industries. Temping can provide
extra income for students and help starters take their
first step into the labour market. Moreover, a temping
contract often results in a permanent contract.
Our brands also offer a
range of courses ena-
bling job seekers to
improve their skills and
chances of employment.
CUSTOMERS
These brands offer companies tailor-made services.
Companies can rely on the expertise and experience of
our professionals, who have a thorough knowledge of
their sector. They look for the best solution for your
company and work with highly qualified candidates.
CANDIDATES
Highly qualified candidates with talents in a specific field
can turn to our brands when they want to step up in
their careers. Moreover, they can rely on our experts to
provide coaching throughout the entire process.
Temporary StaffingTemporary staffing provides fast, flexible solutions for both job seekers and companies. In addition to general temporary
staffing, Solvus also includes brands that offer targeted solutions for specialist niches in the job market.
3 activities for total solutions
Strong brands
Solvus is a group of brands strongly positioned in their
markets. Each brand offers targeted HR solutions based
on its own expertise, thereby building a close relationship
with its specific target group. The multi-brand portfolio
allows each brand to continue to market its own identity
while being seen as part of an international human
resources group, ranking fifth in Europe. The four common
values are at the basis of each brand: entrepreneurship,
proximity, passion and ethics.
Exchange
We strive towards a maximum exchange of expertise
within the group. We achieve this by bringing people
together and optimising the flow of information.
Twice yearly, we organise an international management
meeting, bringing together the full management of all
companies within the group. Strategic issues are explained
during these meetings and we exchange ideas relating to
the shared vision.
In addition, we organise international workshops that
serve as meeting places for employees of different
brands, different countries and a variety of functions
within the group to exchange knowledge. During these
workshops, operational information is shared, concepts
are presented and brainstorming takes place regarding
new technologies, innovations, new recruitment chan-
nels, sales support actions, and market trends.
Information is passed on this way, but this also creates
synergies and ensures cross-fertilization across the
brands.
In addition each operating company has access both to
the local intranet with information about the company
and the Solvus group intranet. The internal Solvus news-
letter distributes business information and presents new
projects implemented across the brands. In this way, we
strive to obtain a coordinated knowledge database in
which everyone can search for information and find
inspiration.
Talent
Our sector focuses on people in everything we do. People
make the difference. We are committed to stimulating
everyone, both our candidates and own employees, to
express their talent to the fullest possible extent.
This is why Solvus offers a broad range of training pro-
grammes to both management and employees to develop
their individual talents and expand their specific business
expertise.
Because Solvus covers a wide range of human resources
activities, the group offers a multitude of professional
career opportunities that match the talents and ambi-
tions of each individual employee, both nationally and
internationally.
Finally, we aim to bind our employees to the group
through a range of additional benefits, such as
bonuses, stock options, etc., thereby strengthening
their commitment to the profitable growth strategy.
We believe in...
Profile
10 SOLVUS RESOURCE GROUP
Transparency
Listed on the stock exchange, Solvus aims to contribute
to a correct valuation of the company by providing relevant
information to the capital market, investors and other
stakeholders.
Synergies
SOLVUS ENTERPRISE NERVOUS SYSTEM
Solvus Enterprise Nervous System (S.E.N.S.) is a large-scale
IT project, the primary objective of which is to implement
processes that respond to the requirements of the market.
The project uses one standardised format: HR-XML.
One of the priorities of S.E.N.S. is to launch an extranet
for both candidates and customers. This will result in
streamlined processes, faster information exchange, a
range of e-services and increased transparency.
Moreover, S.E.N.S will also result in advantages of scale.
The communication, reporting and management systems
are standardised and deployed at group level. Existing
applications within the group are migrated to new, inte-
grated solutions that respond even better to demand
from the market.
INTERNATIONAL ACCOUNT MANAGEMENT
Depending on the question or problem of the customer,
Solvus appoints a team of specialists and coordinates
employees from the brands involved. The project team
develops solutions in close consultation with and via
thorough evaluation of the customer. Solvus continues
to provide guidance for the team, from implementation
through follow-up and modification of the concept,
where necessary. Supported by a virtual European com-
munications platform on the Intranet, this approach gua-
rantees efficient communication, commitment and quality
of our services to our external partners.
SHARED SERVICE CENTERS
Every country in the group has its own Shared Service
Center. The Shared Service Center integrates all the back-
office systems of a country into one central back office.
This means that all administrative processes are grouped
per country, creating significant advantages of scale.
SOLVUS RESOURCE GROUP 11
12 SOLVUS RESOURCE GROUP
Solvus considers innovation to be
a vital aspect of its operations.
It is a strategic priority for all our
employees. We are constantly sear-
ching for new concepts, new
recruitment channels, innovative
sales support actions, etc.
The Solvus Innovation Award is presented annually for an
innovative concept. Each participating project must comply
with a series of criteria: the initiative has to have been imple-
mented for at least three months and must result in a com-
petitive advantage. It must have the potential to contribute
to sustainable, profitable growth and can be implemented
by other operating companies in the group. The Solvus
Group Executive Committee makes a preselection of submit-
ted projects. The winner is selected by the senior and middle
management of the group, some two hundred people.
This initiative is tailored to encourage creativity in our
employees, stimulate innovation and result in growth.
Moreover, it is a way to stand out from the competition.
The first edition took place at the beginning of 2004.
The award went to Creyf’s France for their sponsoring
project 'Partners for Jobs'. This initiative is based on a
simple but ingenious idea to reintegrate the unemployed
in the job market. Simple CVs are distributed at stadiums
during home matches of football and rugby clubs,
allowing job seekers to enter their details. Supporters
looking for work can deposit their CVs in boxes located
around the stadium. Partner companies are also able to
communicate their job openings. After every game,
Creyf's France matches the CVs to job openings.
We are proud to have launched a trulysocial initiative that helps people find a job.Of course it is also an opportunity for us toget in touch with new customers who arealso club partners.
ALAIN DEHAZE, CEO OF SOLVUS RESOURCE GROUP
We are happy to be a pioneer, togetherwith Creyf’s, in this new form of practicalpartnership. We are proud to have beenable to help over 300 supporters of ourclub find a new job.
SERGE DORÉ, GENERAL DIRECTOR OF RC LENS
Profile

T E M P O R A R Y S T A F F I N G
Temping allows her more freedom

14 SOLVUS RESOURCE GROUP
realised
79%of turnover
2004Creyf’s Spain is the second company in Europe to receive
the SA 8000 certificate. SA 8000 is the international stan-
dard for socially responsible enterprise.
Creyf’s France was awarded the first Trophée Sporsora for
sports marketing in the category 'best innovative product
or service associated with a sports marketing action'.
Creyf’s Poland was granted the Business Fair Play Award.
The Dutch, German and Italian markets have undergone
a liberalisation of legislation.
2,247>
>
>>
number 5 in Europe
Creyf’s specialises in deploying staff in all sectors.
Creyf’s offers tailor-made solutions through its
specialised offices, including Horeca & Events,
Logistics, Office, Student, Technics etc., and through
its in-house concepts for large accounts.
Creyf’s strives to be recognised as the preferred partner
for innovative, integrated human resources services and
solutions by both its temporary staff as well as its custo-
mers and employees. Creyf’s continuously improves the
efficiency of its business processes to guarantee optimal
satisfaction for these three interest groups.
and
40%of EBITA in 2004
flexibleandqualitative
Austria
Belgium
France
Germany
Italy
Luxembourg
the Netherlands
Poland
Spain
Switzerland
present in10countries
T E M P O R A R Y S T A F F I N G
permanentemployees

569offices
humanresources solutions
As a sports partner, Creyf’s does more than just
sponsoring: recruitment at the stadia... a unique
initiative to help people find a job.
The initiative ‘Partners for Jobs’ is based on a simple but
ingenious idea to reintegrate the unemployed in the job
market. During the home matches of football, rugby and
basketball clubs, Creyf's distributes simple CVs that job
seekers fill out. Supporters looking for work deposit their
CVs in boxes around the stadium. Partner companies can
also pass on their job openings. After every game, Creyf's
matches the CVs to job openings. This initiative was
launched in France. In the first season 600 CVs were
collected, with 370 supporters returning to work thanks
to Creyf’s. Meanwhile the initiative has also been imple-
mented in Belgium.
The second edition of a competition on behalf of a
social project.
Employees, temporary workers, customers and suppliers
of Creyf’s Spain submit social project proposals. A jury,
consisting of Creyf's directors and representatives of
other organisations, then selects the winning project.
Preference is given to projects that improve access to the
labour market. The winning project receives financial sup-
port for one year.
The winning project for 2004 was a project to help raise
the employment rate of young people with unequal
chances.
“I had been looking for a job since June 2003
after having graduated in engineering. But I was
unable to find a job. At the Lens-Sochaux match
in December 2003, I decided to submit my CV
after having become familiar with the action at
previous matches. I considered giving temping a
try and it worked!”,
SÉBASTIEN VAN WANSEELE, WHO IS NOW WORKING AS
AN IT EXPERT VIA CREYF’S.
www.creyfs.com
Partners for Jobs Creyf’s Solidario
T E M P O R A R Y S T A F F I N G
SOLVUS RESOURCE GROUP 15

16 SOLVUS RESOURCE GROUP
specialist and quality player
SPEED,
QUALITY AND
TRANSPARENT
AGREEMENTS
Content is the expert in recruiting and selecting per-
manent and temporary office personnel at all levels
in the Netherlands. Content stands for speed, quality
and transparent agreements and excels in the field of
administrative, financial, secretarial, commercial and
call centre functions.
CONTENT FLEXACADEMY
The strength of Content is determined by a strong culture
in which entrepreneurship, development, quality and
result-orientedness go hand in hand. As such, Content
invests a lot of time and money in the continuous deve-
lopment of its personnel. The company does this through
the online Content FlexAcademy, which teaches not just
professional knowledge, but also skills. This results in an
extremely low turnover of personnel for the sector and
great corporate pride.
over 100 offices in 77 cities
more than 500 permanent employees
MARKET LEADER IN E-RECRUITMENT
Content is the market leader in e-recruitment in the
Dutch labour market. Content recruits 40% of the candi-
dates it places via the Internet. With 100,000 visitors per
month, www.content.nl is among the top three most visi-
ted sites in the industry. This success is based on the
multi-channel e-recruitment concept developed by
Content. This unique concept enables the offices to reach
over 4 million job seekers with just one mouse click, via
www.content.nl and various other job sites.
www.content.nl
T E M P O R A R Y S T A F F I N G
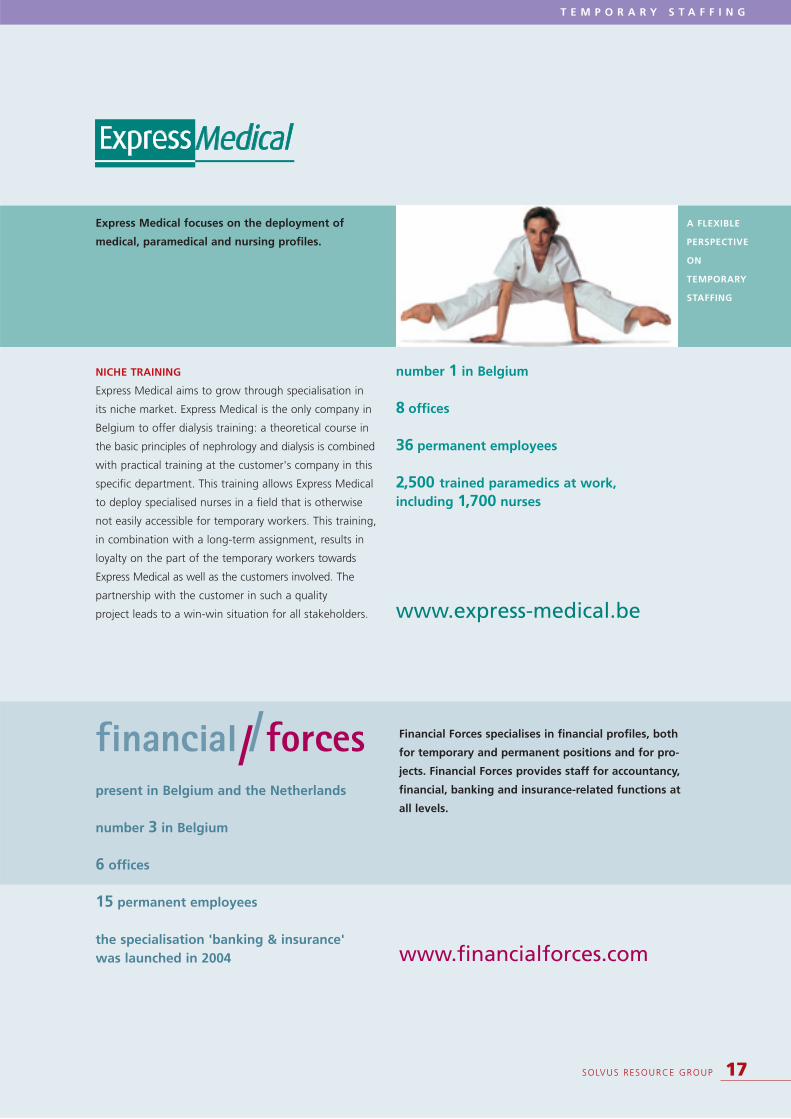
Express Medical focuses on the deployment of
medical, paramedical and nursing profiles.
NICHE TRAINING
Express Medical aims to grow through specialisation in
its niche market. Express Medical is the only company in
Belgium to offer dialysis training: a theoretical course in
the basic principles of nephrology and dialysis is combined
with practical training at the customer's company in this
specific department. This training allows Express Medical
to deploy specialised nurses in a field that is otherwise
not easily accessible for temporary workers. This training,
in combination with a long-term assignment, results in
loyalty on the part of the temporary workers towards
Express Medical as well as the customers involved. The
partnership with the customer in such a quality
project leads to a win-win situation for all stakeholders.
number 1 in Belgium
8 offices
36 permanent employees
2,500 trained paramedics at work, including 1,700 nurses
www.express-medical.be
A FLEXIBLE
PERSPECTIVE
ON
TEMPORARY
STAFFING
T E M P O R A R Y S T A F F I N G
SOLVUS RESOURCE GROUP 17
present in Belgium and the Netherlands
number 3 in Belgium
6 offices
15 permanent employees
the specialisation 'banking & insurance' was launched in 2004
Financial Forces specialises in financial profiles, both
for temporary and permanent positions and for pro-
jects. Financial Forces provides staff for accountancy,
financial, banking and insurance-related functions at
all levels.
www.financialforces.com
18 SOLVUS RESOURCE GROUP
T E M P O R A R Y S T A F F I N G
STAR@WORK - THE TRAINING PROGRAMME FOR
SECRETARIES
66.5% of new secretarial employees are not (properly)
settled in their jobs. StarJob Secretaresse Uitzendbureau
conducted a survey on this subject in the Netherlands
in October 2003. The conclusions of the survey were
that the training period is too short, that information is
incomplete, or that the predecessor has already left,
making a proper transfer impossible. At the beginning
of 2004 StarJob therefore introduced a training pro-
gramme on cd-rom called star@work, specially develo-
ped to help secretaries settle in their new jobs. Some
5,000 cd-roms have already been requested to date.
ABI focuses on deploying hosts/hostesses and
promotional staff for trade shows, congresses,
exhibitions, seminars, business events, etc., in
Belgium.
number 3 in Belgium
www.abi-interim.com
number 2 in the Netherlands
19 offices
75 permanent employees
celebrated its 20th anniversary in 2004
for the recruitment and selection of top secretariesand mediation for freelance executive assistants,StarJob turns to its specialised office: S&C Select.
www.starjob.nl
StarJob is the expert in the deployment, secondment,
recruitment and selection of secretaries with at least
three years of work experience in the Netherlands.

Building the right team around the project
S E C O N D M E N T & P R O J E C T S
new specialisation in Belgium since October 2004
www.legalforces.be
“HR Forces assisted us in the start-up phase of the hospi-
tal network. Thanks to its excellent grasp of HR compe-
tencies and the fast solution provided by HR Forces, we
were able to lay the foundation for a high-performance
HR policy”, DOMINIQUE DESOMBERE, HRM DIRECTOR OF HOSPI-
TAL NETWORK ANTWERP.
Legal Forces seconds legal experts (general and
specialised) to public and private organisations.
The assignments include both temporary replace-
ments or projects and structural outsourcing of
legal affairs.
HR Forces supports organisations in developing
their human resources management professionally
through the secondment of human resources pro-
fessionals. This may be for temporary replacement,
for structural outsourcing as well as for supporting
organisations just starting up or in transition.
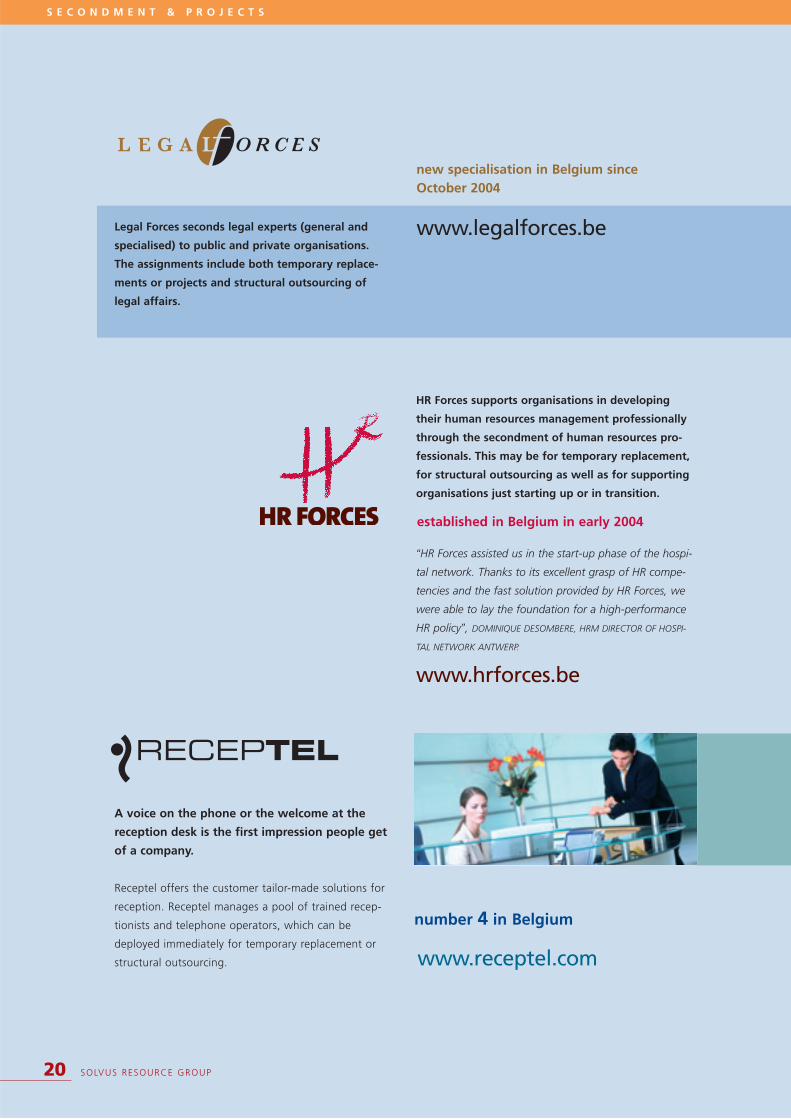
A voice on the phone or the welcome at the
reception desk is the first impression people get
of a company.
Receptel offers the customer tailor-made solutions for
reception. Receptel manages a pool of trained recep-
tionists and telephone operators, which can be
deployed immediately for temporary replacement or
structural outsourcing.
established in Belgium in early 2004
number 4 in Belgium
www.hrforces.be
www.receptel.com
S E C O N D M E N T & P R O J E C T S
20 SOLVUS RESOURCE GROUP
SOLVUS RESOURCE GROUP 21
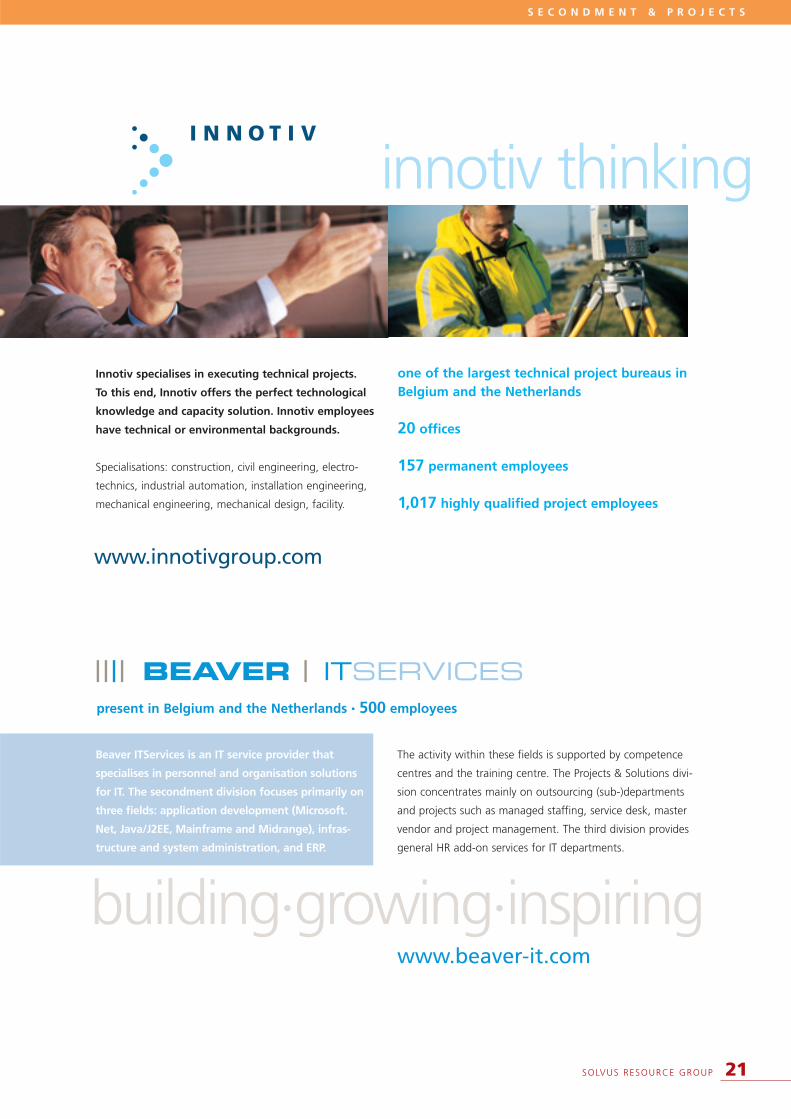
one of the largest technical project bureaus inBelgium and the Netherlands
20 offices
157 permanent employees
1,017 highly qualified project employees
Beaver ITServices is an IT service provider that
specialises in personnel and organisation solutions
for IT. The secondment division focuses primarily on
three fields: application development (Microsoft.
Net, Java/J2EE, Mainframe and Midrange), infras-
tructure and system administration, and ERP.
The activity within these fields is supported by competence
centres and the training centre. The Projects & Solutions divi-
sion concentrates mainly on outsourcing (sub-)departments
and projects such as managed staffing, service desk, master
vendor and project management. The third division provides
general HR add-on services for IT departments.
www.beaver-it.com
www.innotivgroup.com
Innotiv specialises in executing technical projects.
To this end, Innotiv offers the perfect technological
knowledge and capacity solution. Innotiv employees
have technical or environmental backgrounds.
Specialisations: construction, civil engineering, electro-
technics, industrial automation, installation engineering,
mechanical engineering, mechanical design, facility.
innotiv thinking
building•growing•inspiring
S E C O N D M E N T & P R O J E C T S
present in Belgium and the Netherlands • 500 employees

S E R V I C E S & C O N S U L T A N C Y
The right person for the right job
SOLVUS RESOURCE GROUP 23
Accea offers integrated human resources solutions
for permanent staff. Accea has three areas of exper-
tise: recruitment and selection of permanent staff,
assessment and consultancy in the field of human
resources.
Accea stands for an integrated vision of human resources
that is translated not only to members of the board and
executive staff, but also to the operational levels of an
organisation.
“Accea stands out from other recruitment and consulting
companies because it is able to quickly form a picture of
the organisation's needs or problems. Based on their
analysis they can propose a suitable person or solution
without losing track of the people side. The candidates
proposed by Accea confirm this”, CHANTAL BOUDAER,
HUMAN RESOURCES MANAGER, VASCO DATA SECURITY.
present in Austria, Belgium, Luxembourg, the Netherlands, Poland, Spain andSwitzerland, and since 2004 in France
35 offices
60 permanent employees
www.accea.com
Carela offers a total package for career consultancy:
outplacement (individual and collective), in-place-
ment, coaching and presenteism. Carela offers
employees professional guidance through a tailor-
made programme created at the request of their
employers.
Carela is the new name of ADV Consult in Belgium,
France and Luxembourg and of BCR in the Netherlands.
The new name goes hand in hand with the internationali-
sation and expansion of services in career consultancy.
VIRTUAL CAREER CENTER
The Virtual Career Center is a virtual work environment
in which clients are able to find information about all
aspects of career development: testing skills, interests
and personality; support in job search; information on
application techniques.
PRESENTEISM
In 2004, Carela launched a new concept in relation to
presenteism: a preventive, positive and solution-oriented
approach to the problem of absenteeism. Instead of simply
combating the symptoms, Carela looks at the underlying
causes of absenteeism. This approach results in a cons-
tructive and sustainable solution.
“From the very first contact, I was confident that it would
turn out well. Outplacement gives you the time to find
yourself, the opportunity to reorient yourself without
feeling on your own. Outplacement gives support and
confidence when making decisions”,
A 48-YEAR-OLD MARKETING MANAGER, NOW BACK AT WORK IN
THE PHARMACEUTICAL INDUSTRY.
present in Belgium and the Netherlands;launched in France and Luxembourg in 2004
number 2 in Belgium
12 offices
56 permanent employees
Carela Belgium acquired the activities ofV.V.O. Outplacement in 2004
www.carela.info
PRAGMATIC,
TAILOR-MADE
SOLUTIONS
S E R V I C E S & C O N S U L T A N C Y

24 SOLVUS RESOURCE GROUP
BrandsBrands portfolio

Informationfor shareholders
26 INFORMATION FOR SHAREHOLDERS
ReportReport of the Board of Directors
COMMENTARY ON THE CONSOLIDATED
ANNUAL ACCOUNTS
Income statement
Total operating income rose by 1.0% to 1.46 billion euro
(2003: 1.45 billion euro). Total operating income increased
organically by 4.2% thanks to the increase in demand in
an expanding market and greater commercial strength.
Throughout 2004, turnover improved with each succes-
sive quarter. In the first quarter, turnover decreased by
5.8%, in the traditionally strong second quarter, this was
+2.0%, in the third quarter the figure was +0.8%, and in
the final quarter, we achieved an increase in turnover once
again, this time by 6.7%. The organic growth figures per
quarter (without Schoevers and the activities of Bureau
van Dijk Computer Services) are as follows:
-3.5%, +4.8%, +2.7% and +12.5%. Increasing growth
in turnover, with the sharpest increase in the final quarter,
is a positive sign for 2005.
This improvement was achieved in the majority of markets
in which Solvus is active. Once again, the Belgian market per-
formed well in 2004, and the French market also showed a
clear improvement from the fourth quarter onwards.
In the Dutch market, which is of great importance to us, we
were also able to achieve increased turnover from the fourth
quarter onwards, after a very difficult start of the year.
On an annual basis, and in addition to a decline in
turnover in the Dutch market, negative turnover growth
was also registered in Germany and Luxembourg. In all
the other markets growth in turnover was achieved on an
annual basis.
To the general meeting of shareholders
The Board of Directors is honoured to report to you on the activities of our company during the
past financial year and to present you the consolidated annual accounts as at the close of
31 December 2004.
In 2004, the emphasis for Solvus was on restoring profitability by strengthening the company’s basic
parameters. The cost structure has been considerably reduced in this respect. In addition, efforts have
been successful at pushing back net financial debt and thus strengthening the balance sheet. 2004
also saw the successful launch of the Shared Service Center in the Netherlands, thereby centralising
all of our Dutch operating companies’ operational back-office processes. This resulted in a significant
improvement in efficiency. It had previously been successfully implemented on the Belgian market.
Finally, the programme to make further improvements to the quality of management in all our
operating companies came to a close.
Thanks to the results outlined above, Solvus’ position and the external orientation of management
and employees have improved considerably.
While we will maintain our financial discipline, the focus will shift towards reinforcing our commercial
strength in order to create increased turnover and profit (thanks to the leverage effect) and thus
maximise the benefits of the recovery evident in our markets.

INFORMATION FOR SHAREHOLDERS 27
SOLVUS
PROFITABLE
AGAIN
Gross margin amounted to 20.6% in 2004, a fall of 230
basis points compared with 2003. By mid-2004, gross
margin was at 20.7%, which indicates a stabilisation
during the second half of the year. Organically, this de-
crease amounts to 130 basis points and gross margin ends
up at 20.5%. This is the result of pricing pressure in many
of our markets and changes in the business mix (decrease
in the recruitment and selection share, where a high mar-
gin is realised). Stabilisation in the second half of the year
and a rise in the recruitment and selection share in the
final months of 2004 raise expectations of a future in-
crease in gross margin. This will be further supported by
an expansion in demand and higher turnover from the
SME segment and from the more specialised temporary
staffing which also realises a high margin.
The operating result (EBITA) amounted to 32.9 million
euro (2.3% of total operating income). This is more than
twice as much as in 2003 (14.0 million euro; 1.0% of
total operating income) and is a substantial improvement
of the operating result for the first half of the year
(11.0 million euro). Therefore, the effect of the cost-
cutting measures that have been implemented is
becoming increasingly clear. In 2004, general costs,
including depreciation (SG&A), amounted to 18.3% of
total operating income. In 2003, this figure was 21.9%.
This implies that the cost base fell by 49.8 million euro
in 2004 compared with 2003.
Regular goodwill amortisation amounted to 10.3 million
euro in 2004. Because of an increase in demand, resulting
in higher turnover, together with lower costs and higher
profit, the impairment exercise did not result in additional
write-off. The impairment model was applied consistently
as in previous years and is based on the future cash flow
from subsidiary companies. Since the result under IFRS is
not charged with goodwill amortisations, the net IFRS
result will increase by 10.3 million euro.
Net financial costs amounted to 13.7 million euro.
Compared with 2003, this represents an increase of 0.3
million euro. In 2003, however, there was a non-recurring
positive influence on the net financial result, being the
sale of an interest rate swap of 1.1 million euro.
Therefore, financial costs have decreased by 0.8 million
euro compared with 2003. In 2005, Solvus aims to reduce
debt and the interest payable further still.
The extraordinary result, entirely realised in the first 6
months, amounted to 2.9 million euro and is associated
with the disinvestments of Schoevers and the activities
of Bureau van Dijk Computer Services.
The net result (part of the group) amounted to 0.8 million
euro (2003: -61.4 million euro) and is a positive figure
again for the first time since 2001. The result (part of the
group) before the amortisation of goodwill (10.3 million
euro) and the extraordinary result (2.9 million euro)
amounted to 14.0 million euro (2003: 0 million euro).
Balance sheet
Solvus’ balance structure improved further in 2004.
Equity amounted to 244.0 million euro. Goodwill
decreased by 11.6 million euro due to the entry of
regular amortisations, the sale of JConsults and the
acquisition of an additional percentage of Creyf’s Italy
in accordance with the current purchase agreement.
Tangible fixed assets decreased to 33.5 million euro due
to the sale of Schoevers, which owned many buildings,
leasing and similar rights.

28 INFORMATION FOR SHAREHOLDERS
Report of the Board of Directors
Financial fixed assets amounted to 7.4 million euro and
mainly comprise the (statutory) loans granted to French
government institutions, and rental guarantees for the
various operating companies.
The deferred tax asset on fiscal losses carried forward
amounted to 19.9 million euro and are accounted for only
when it can be substantiated by the expected results
within a foreseeable period.
The principal entry under other amounts receivable is the
receivable formation premium.
Compared with 2003, provisions fell by 8.5 million euro
to 3.9 million euro due to the implementation of restruc-
turing in the Netherlands (4.1 million euro) and decreased
value on the sale of Schoevers (4.4 million euro).
Other amounts payable include payable earn-outs and
received guarantees.
Accrued charges and deferred income mainly concerned
prepaid expenses (7.9 million euro) and wages to be
allocated for temporary staff (12.7 million euro).
Net financial debt was reduced to 164.3 million euro,
which shows a further improvement in comparison with
the end of 2003 when net financial debt amounted to
192.6 million euro. Net financial debt, as a percentage of
equity, improved to 67.3% (2003: 79.2%).
On 31 December 2004 and 2003, the structure of
financial debt was as follows:
In euro x 1,000 2004 2003
Long-term loans 115,979 149,631
Short-term loans 139,424 97,828
Investments and cash at bank and in hand 91,092 54,876
Net financial debt 164,311 192,583
Cash flow statement
Net cash flow from operations amounted to 44.6 million
euro and was composed of a positive cash flow from the
operational result of 31.3 million euro (2003: 11.5 million
euro) and an improvement in operating working capital
of 13.3 million euro. Operating working capital was
allocated more efficiently by keeping the number of
days sales outstanding constant at 50 days and by better
gearing the outgoing payments to incoming cash flows.
Net cash flow from investments shows an investment of 2.4
million euro. Free cash flows were allocated to pay off debt.
Investments
2.4 million euro was invested on an annual basis, of which
15.4 million euro was invested and 13.0 million euro
disinvested.
Composition of investments:
In euro x 1,000 2004 2003 2002
Intangible fixed assets 3.4 3.9 5.7
Tangible fixed assets 8.0 14.6 21.8
Financial fixed assets 4.0 5.2 38.3
Total 15.4 23.7 65.8
The total investments of 15.4 million euro imply
a decrease of 8.3 million euro compared with 2003.
This decrease was caused by acquisitions being halted and
a fall in investments in tangible fixed assets due to the
strict policy on costs.
On an annual basis, disinvestments amounted to a sum of
13.0 million euro. This included the sale of Schoevers and
components of Bureau van Dijk Computer Services.
Interest risk and credit risk control
Solvus pursues a dynamic policy, among others
dependent on the expectations concerning the interest
evolution and the economical evolution. It is expected that
the long-term euro interest will rise followed by a rise of
the short-term euro interest. Within the framework of this
interest policy and given the character of the financial
debt, two interest portfolio hedges were concluded.
Dependent on the risk profile of the customers, a decision is
made per operational entity as to whether the interest rate
should be covered by a credit insurance policy. Generally it
can be stated that the main part of the credit risk of the
group is covered.

INFORMATION FOR SHAREHOLDERS 29
Current matters and disputes
The Dutch tax authorities have carried out an investiga-
tion of all employment agencies’ compliance with the law
on compulsory identification. This has also been done in
respect of our Dutch companies. The results of this
investigation have not yet been made available. However,
an additional tax assessment as a result of this remains
a possibility. The employment agencies and the Dutch
professional federation ABU are contesting the tax autho-
rities’ initial findings.
Operating result per activity (organic)
In euro x 1,000 2004 2003 % change
Temporary Staffing 29,479.4 17,932.3 +64%
• General 13,416.7 8,807.6 +52%
• Specialised 16,062.7 9,124.7 +76%
Secondment & Projects 4,138.8 2,441.1 +70%
• IT 2,329.4 860.6 +171%
• Engineering 974.5 1,221.0 -20%
• Other 834.9 359.5 +132%
Services & Consultancy 126.3 169.8 -26%
Total 33,744.5 20,543.2 +64%
OPERATIONAL OVERVIEW
Total operating income per country
Total operating income per activity
Switzerland1.5%Austria
2.3%
Belgium24.4%
France28.1%
Germany 3.9%
Italy3.8%
Luxembourg1.5%
The Netherlands29.1%
Poland0.8%
Spain4.6%
2003Switzerland
1.9%Austria
2.5%
Belgium26.1%
France28.6%
Germany 3.6%
Italy4.1%
Luxembourg1.4%
The Netherlands 26.0%
Poland0.9%
Spain4.9%
2004
Services &Consultancy
1.6%
Secondments &Projects9.2%
2003
SpecialisedTemporaryStaffing12.6%
GeneralTemporaryStaffing76.6%
Services &Consultancy
0.6%
Secondments &Projects7.4%
2004
SpecialisedTemporaryStaffing13.4%
GeneralTemporaryStaffing78.6%

30 INFORMATION FOR SHAREHOLDERS
Report of the Board of Directors
General Temporary Staffing
Turnover for the activity General Temporary Staffing
(Creyf’s) grew by 3.3% to 1,143 million euro (2003:
1,106 million euro). This growth occurred in all countries
except in the Netherlands, Germany and Luxembourg.
In the fourth quarter growth was achieved again in the
Netherlands and Germany; decline was reduced in
Luxemburg.
Gross margin decreased by 80 basis points due to pricing
pressure in many of our markets, since growth has been
realised mainly among larger clients who have lower margins.
Additional turnover from the SME segment is expected to
result in a higher gross margin in the coming years.
After a difficult start, the Dutch market gradually realised
an improvement in turnover. In the first quarter, turnover
fell by more than 29%, but in the fourth quarter, an in-
crease in turnover of more than 5% was again achieved.
The focus had been internal due to cost reductions, ope-
rational improvements and changes to management, and
as a result we missed out on some turnover. Meanwhile,
internal improvements have been completed successfully,
and the focus is fully external once again. The success of
this approach is reflected in the increase in turnover quar-
ter after quarter. This trend will be reinforced in 2005. In
Belgium, turnover rose by 11.4%, and a considerably hig-
her gross margin was realised. In order to support the con-
tinuing growth in turnover, investments were made in
additional capacity in the second half of the year. France
managed to realise an increase in turnover of 5.2% and
increased its market share, particularly as a result of a
good first six months and fourth quarter. Pressure on the
gross margin continued in 2004. Spain made a strong
start of the year but saw the increased turnover from the
first six months decline somewhat in the second half of
the year as a result of a moderate summer tourist season
and fewer harbour activities. On an annual basis, an incre-
ase in turnover of 8.8% was realised. Profitability conti-
nued to improve in 2004. 2004 was positive for Italy as
well. Turnover rose by 9.6%, gross margin increased and a
positive operating result was realised for the first time.
Germany experienced a very difficult start, following what
had already been a difficult 2003. As a result of cost
reductions and a strong external focus, both turnover and
the operating result improved with each quarter. At the
end of 2004 a number of large client contracts were con-
cluded that will generate additional turnover in 2005.
Switzerland has recovered after a poor 2003. Turnover
rose considerably and a break-even result was nearly
achieved. In Poland, it was a transitional year as a result of
the new legislation which came into effect. Turnover rose
by more than 20%, while the gross margin decreased as a
result of the new legislation and pricing pressure. The
emphasis in Luxembourg and Austria was placed on deve-
loping turnover and improving return.
Specialised Temporary Staffing
The Specialised Temporary Staffing activity showed a
sharp increase in turnover by 6.9% to 194.2 million euro
(2003: 181.7 million euro). Market share was won thanks
to the sharp increase in this traditionally late-cyclical acti-
vity. In the beginning of 2004 there was pricing pressure,
but in the final months of 2004 the margin stabilised.
The operating result increased by 76.9%.
Express Medical consolidated its market leadership and
realised a higher gross margin and operating result.
Financial Forces, specialised in financial profiles, had a very
good year. Turnover, gross margin and the operating result
all increased sharply. The Dutch company Content, specia-
lising in administrative profiles, also had a very good year.
Growth in turnover (more than 5%) was achieved for the
first time in years and market share was won. The opera-
ting result increased by more than 20% despite the decre-
ase in gross margin.
TURNAROUND
COMPLETED
SUCCESSFULLY

INFORMATION FOR SHAREHOLDERS 31
Secondment & Projects
Turnover from this activity decreased by 16.8% due to
the disinvestment of Bureau van Dijk Computer Services
(IT projects). Not taking into account disinvestments,
turnover grew organically by 2.3% to 107.9 million euro
(2003: 105.4 million euro). After a number of years in
which turnover decreased, there are indications of renewed
growth. The operating result is positive again thanks to
an increased focus on idle time and improved cost-
consciousness.
Beaver ITServices (IT secondment) had a strong year with
turnover growing by more than 10%. Gross margin and
operating result also improved.
Turnover from Innotiv (Engineering secondment and
projects) decreased by 18.2%, despite an increase in
turnover and operating result for the surveying specialty
within Innotiv. The decrease in turnover, as a result of
clients' postponed investments and cost reductions,
was set off by economies and pushing back idle time.
Since the end of 2004, Innotiv’s market has appeared
to stabilise and generate growth again.
HR Forces and Legal Forces were launched successfully
and showed very positive growth in turnover and
operating result.
Solvus confirms that it is prepared to subscribe, at
a price of 0.50 euro per share, to the capital increase
proposed by Bureau van Dijk Computer Services NV by
contributing certain claims. The purpose of this action
is to settle the negative equity of Bureau van Dijk CS.
Given the current financial situation of Bureau van Dijk CS
and its limited activities, a listing of the shares at Euronext
Brussels would have little added value. Consequently,
Solvus intends to remove the share from the stock
exchange by means of a public buyout offer. The buyout
offer will be at the same price per share as applied for the
capital increase.
Services & Consultancy
Turnover from this activity has fallen by 65.3% due to
the disinvestment of Schoevers. However, not taking into
account this sale, an organic growth in turnover of almost
60% has been achieved.
Accea, which groups together the activities recruitment &
selection, assessment and HR consultancy, experienced a
very encouraging growth. The integration of the services
and the introduction of a strong international brand pro-
ved to be successful and constitute the driving force
behind the sustainable, profitable growth of these specia-
lised services. Outplacement specialist ADV Consult expe-
rienced a slightly weaker year but maintains its position as
market leader. BCR performed better than the market.
STRATEGY
The Master Plan 2005 contains four strategic core
principles:
• introduction of a new management structure and cul-
ture, while retaining a strong entrepreneurial vision;
• focus on operational excellence by introducing a strict
financial framework and management accountability;
• introduction of a new mission statement aimed at
offering integrated HR services and solutions through
strong international and local brands;
• achieving long-term, profitable growth in existing coun-
tries through targeted diversification and segmentation.
FINANCIAL
TARGETS
REALISED
32 INFORMATION FOR SHAREHOLDERS
Report of the Board of Directors
By the end of 2004, the first phase of the Master Plan
2005 had been completed successfully. A considerable
part of senior management in the operating companies
has been substantially and structurally strengthened over
the past two years. This has necessarily required an inter-
nal focus and orientation, but at present both manage-
ment and staff have their full focus on external and com-
mercial matters once again.
The financial objectives have been realised in respect of
debt reduction, cost reductions and increasing profit,
both at the consolidated level as well as in terms of the
contribution made by several individual operating compa-
nies. Net financial debt has continued to improve, and cash
flow from operational result has increased. Moreover, the
cost base has fallen sharply in relation to previous years. This
creates a strong leverage effect causing all growth in turn-
over to convert automatically into increased profitability.
In 2004 a number of operating companies were
divested in order to focus more on our core activities.
The internal organisation continued to be streamlined
through, among others, the establishment of a Shared
Service Center in the Netherlands. The information and
reporting systems were further improved, and these allow
us to react quickly and effectively to changing market con-
ditions.
The first phase of the Master Plan 2005 has therefore
been successfully completed. The second phase of the
strategic plan provides for sustainable, profitable growth:
Solvus wants to improve further on its turnover and its
profitability in the coming years. The exact content of this
second phase will be announced at the beginning of the
second quarter of 2005.
OUTLOOK
Demand for our services is strengthening in an increasing
number of markets in which Solvus is actively involved.
The economic recovery, the first signs of which were
evident at the end of 2003, has gained in strength.
Solvus will be continuing to work on improving its opera-
tional profitability by focussing on operational excellence
and profitable core activities. The effect of the objectives
achieved in the first phase of the Master Plan will become
increasingly evident over the course of 2005.
Consequently, Solvus anticipates higher turnover and
profit in 2005 than in 2004. Continuing economic reco-
very and strengthening demand from the SME
segment will give Solvus an additional boost.
STATUTORY ANNUAL ACCOUNTS AND DIVIDEND
As previously mentioned, the consolidated net result
(part of the group) for 2004 amounted to 0.8 million
euro. The individual result of Solvus NV amounts to
-47.9 million euro. Including the deferred result of 2003,
the total amount available for appropriation of 2004
amounts to -69.9 million euro. The Board of Directors
proposes not to pay out any dividends and to transfer the
loss to the next financial year. Solvus will be resuming its
dividend distribution policy as soon as circumstances
allow.
The loss carried forward arose through non-recurring
costs in the financial years of 2004, 2003 and 2002,
namely the remission of the long-term loan to Solvus
Nederland (50 million euro) and the loss in value /
downward revaluation of participating interests (81.9
million euro). Solvus Nederland’s proportion of equity to
equity to debts was not healthy during 2004. In order to
support Solvus Nederland in a sustainable manner, it has
been decided to acquit the long-term loan to Solvus
Nederland (50 million euro) and to carry out a capital
increase (55 million euro). This capital increase is
expressed in the increase in participating interests
and shares.
INTERNAL
ORGANISATION
STREAMLINED

INFORMATION FOR SHAREHOLDERS 33
Since the balance sheet shows a loss carried forward,
application of the valuation rules must be accounted for
in line with corporate legislation. In view of positive equity
to the sum of 254.3 million euro, the Board of Directors
believes that the present valuation rules, as included with
the annual accounts, are correct and well-founded under
the present circumstances and that continuity of the
business is not in danger.
PROPOSAL FOR DISCHARGE TO THE BOARD OF
DIRECTORS AND THE CERTIFIED AUDITOR
We request that you grant discharge to the Board of
Directors and the Certified Auditor and that you approve
the annual accounts as presented.
EFFECT OF IFRS INTRODUCTION
As of 2005, Solvus will be compiling its consolidated annual
accounts according to IFRS. Everything has been internally
prepared for this to take place seamlessly. In addition to the
results according to Belgian accounting standards, compara-
tive figures have been compiled in accordance with IFRS in
the course of 2004 so as to enable a transparent comparison
in 2005 with the results from 2004.
The transition to IFRS will mainly affect the presentation
of the balance sheet, the income statement, and the cash
flow statement, and it requires more extensive explana-
tion. The total effect on equity as of 31 December 2004
is negligible (0.05 million euro). Under IFRS, net profit in
2004 (before minority interests) amounted to 10.2 million
euro instead of 0.9 million euro under Belgian GAAP,
mainly due to the reversal of the annual amortisations of
goodwill according to Belgian valuation rules.
Please refer to the IFRS consolidated financial statements
on page 62 for a more detailed explanation.
On behalf of the Board of Directors
25 February 2005
SUCCESSFUL
LAUNCH OF
SPECIALISED
ACTIVITIES

34 INFORMATION FOR SHAREHOLDERS
BoardBoard of Directors and Committees
BOARD OF DIRECTORS
Mandate from until
Chairman Luc Bertrand 12/05/1998 08/05/2007
Directors Christian Dumolin (independent director) 12/05/1998 08/05/2007
Ackermans & van Haaren NV (represented by Luc Bertrand) 29/04/1999 08/05/2007
Jan Suykens 08/05/2001 08/05/2007
Rennie F. Hendriksen (independent director) 14/02/2002 10/05/2005*
Martin Dekker (independent director) 14/02/2002 10/05/2005*
Alain Dehaze 01/10/2002 08/05/2007
Tom Bamelis 31/10/2002 10/05/2005*
* The renewal of mandates for Rennie F. Hendriksen, Martin Dekker and Tom Bamelis will be proposed to the general meeting of shareholders.
AUDIT COMMITTEE
Rennie F. Hendriksen, chairman
Tom Bamelis
Martin Dekker
NOMINATION AND REMUNERATION COMMITTEE
Luc Bertrand, chairman
Christian Dumolin
Alain Dehaze (until 25/02/2005)
Jan Suykens (since 25/02/2005)
STRATEGIC COMMITTEE
Jan Suykens (via Legimco NV), chairman
Alain Dehaze
Rob Zandbergen
CERTIFIED AUDITOR
Ernst & Young Bedrijfsrevisoren BCV represented by
Boudewijn Van Ussel. The Auditor was reappointed in
2003 for a new term of 3 years, which will end with
immediate effect after the general meeting in 2006.
GROUP EXECUTIVE COMMITTEE
Chief Executive Officer:
Alain Dehaze
Chief Financial Officer:
Rob Zandbergen
Executive Vice President Corporate Human Resources:
Herman Swinnen
Executive Vice President:
Marc Frustié
Executive Vice President:
Bart Rentmeesters (until 26/11/2004)
EVP HRHerman Swinnen
CFORob Zandbergen
EVPMarc Frustié
EVP
BelgiumFranceItaly
LuxembourgPolandSpain
AustriaGermany
The NetherlandsSwitzerland
Beaver ITServicesBureau van Dijk CS
Innotiv
CEOAlain Dehaze
INFORMATION FOR SHAREHOLDERS 35
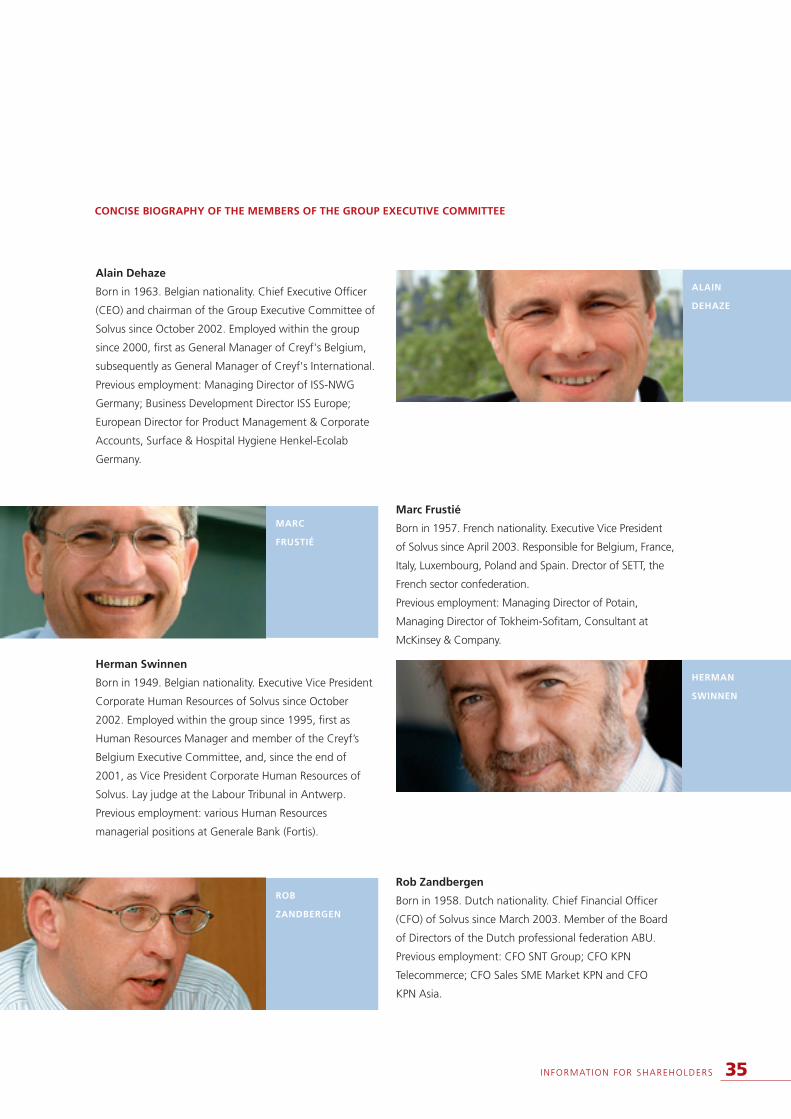
Alain Dehaze
Born in 1963. Belgian nationality. Chief Executive Officer
(CEO) and chairman of the Group Executive Committee of
Solvus since October 2002. Employed within the group
since 2000, first as General Manager of Creyf's Belgium,
subsequently as General Manager of Creyf's International.
Previous employment: Managing Director of ISS-NWG
Germany; Business Development Director ISS Europe;
European Director for Product Management & Corporate
Accounts, Surface & Hospital Hygiene Henkel-Ecolab
Germany.
Herman Swinnen
Born in 1949. Belgian nationality. Executive Vice President
Corporate Human Resources of Solvus since October
2002. Employed within the group since 1995, first as
Human Resources Manager and member of the Creyf’s
Belgium Executive Committee, and, since the end of
2001, as Vice President Corporate Human Resources of
Solvus. Lay judge at the Labour Tribunal in Antwerp.
Previous employment: various Human Resources
managerial positions at Generale Bank (Fortis).
Marc Frustié
Born in 1957. French nationality. Executive Vice President
of Solvus since April 2003. Responsible for Belgium, France,
Italy, Luxembourg, Poland and Spain. Drector of SETT, the
French sector confederation.
Previous employment: Managing Director of Potain,
Managing Director of Tokheim-Sofitam, Consultant at
McKinsey & Company.
Rob Zandbergen
Born in 1958. Dutch nationality. Chief Financial Officer
(CFO) of Solvus since March 2003. Member of the Board
of Directors of the Dutch professional federation ABU.
Previous employment: CFO SNT Group; CFO KPN
Telecommerce; CFO Sales SME Market KPN and CFO
KPN Asia.
ALAIN
DEHAZE
HERMAN
SWINNEN
MARC
FRUSTIÉ
ROB
ZANDBERGEN
CONCISE BIOGRAPHY OF THE MEMBERS OF THE GROUP EXECUTIVE COMMITTEE

36 INFORMATION FOR SHAREHOLDERS
GovernanceCorporate Governance
The Board of Directors of Solvus has taken note of the
provisions of the Belgian Corporate Governance Code
which the Corporate Governance Committee, chaired by
Mr Lippens, announced on 9 December 2004.
The Board of Directors has long recognised the
importance of sound company management and has
continued to apply such principles to the present date.
The Board lends its full support to the Committee’s
initiative and will be drawing up a charter over the course
of 2005 which will examine the Code’s various recom-
mendations and provide explanations should it not be
possible to comply with some of them.
Although the Code only comes into effect as of 1 January
2005, the chapter entitled Corporate Governance in this
annual report will already be compiled in accordance with
the provisions of the new Code as far as possible.
Solvus is a company limited by shares and comes under
Belgian law. Its shares are listed on Euronext Brussels.
It plays an active role in the management of the
companies it controls.
MANAGEMENT AND SUPERVISORY BODIES
OF SOLVUS
The internal rules for Corporate Governance, laid down
by the Board of Directors, provide the company with a
framework for the way in which power and responsibility
is divided between the Board of Directors and executive
management and ensure that the business is managed
efficiently and properly.
The Board of Directors approves corporate strategy and
major investments, supervises day-to-day management
and compiles the annual accounts as well as the annual
report. The Board of Directors also follows up the
implementation of the decisions that it makes.
BOARD OF DIRECTORS
The Board of Directors is composed of eight members.
They are selected by the Board of Directors on the
proposal of the Nomination and Remuneration
Committee, after which the choice is presented to the
shareholders. The chairman is chosen from among the
members of the Board of Directors and is appointed by
the Board of Directors.
Luc Bertrand (°1951), Jan Suykens (°1960) and Tom
Bamelis (°1966) are members of the Board of Directors
and/or the Executive Committee of the benchmark
shareholder Ackermans & van Haaren. Christian Dumolin
(°1945), Rennie F. Hendriksen (°1939) and Martin Dekker
(°1938) sit as independent directors in which their quali-
fications as independent directors within the meaning of
Article 524 §4 of the Belgian Company Code was con-
firmed by the general meetings of 13 May 2003 and
11 May 2004. This also complies with the provisions of
the new Code. Christian Dumolin is also chairman of the
Board of Directors of Koramic Building Products and
TrustCapital Partners, vice-chairman of Wienerberger
and a member of the Board of Governors of the National
Bank of Belgium. Rennie F. Hendriksen fulfils various
international, non-executive management mandates and
is also a business consultant. Before his retirement,
Martin Dekker was chairman of the board of NPM
Capital BV in Amsterdam and, at present, continues to
hold various commissioner’s positions in the Netherlands,
Ireland and Luxembourg at Belron International NV,
Koninklijke Boskalis Westminster NV, Fugro NV, van
Lanschot Bankiers NV, Fine Ace BV, Algemeen
Nederlands Trustkantoor NV, Arklow Shipping Ltd, van
Wijnen NV, IHCHollandMerwdede BV and SI Holding BV.
He is also a business consultant. Alain Dehaze (°1963) is
a director and CEO. He is also chairman of the Group
Executive Committee that is charged with the day-to-day
management.
There are no statutory regulations concerning an age limit
for managerial mandates within Solvus, but the Board of
Directors operates an internal rule of a 70-year age limit.
Appointments and renewal of mandates are made
according to the relevant legal requirements.
The Board of Directors met ten times in 2004, once by
means of teleconferencing. One of the meetings was held
in the Netherlands at the offices of Content BV for the
purpose of being able to observe the Dutch activities more

INFORMATION FOR SHAREHOLDERS 37
closely with the management concerned. There was an
attendance level of over 96%. Martin Dekker was present
on nine occasions and Christian Dumolin eight times,
while the other members were present at all meetings.
In preparation of these meetings, all members receive the
agenda and the minutes from the previous meeting, as
well as the necessary documents and management report
figures. At each meeting the CEO gives a thorough report
on the current situation. Rob Zandbergen and Herman
Swinnen have permanent seats on the Board of Directors
in their respective capacities as CFO and secretary of the
Board of Directors. The Board of Directors normally
reaches decisions by consensus. Although the directors
can obtain the advice of external consultants at the
company’s expense, this option was not employed in
2004.
The non-executive members of the Board of Directors do
not possess any Solvus NV shares, options or warrants in a
private capacity. As a member of the Board of Directors,
Ackermans & van Haaren owns 10,519,553 Solvus NV
shares.
MANAGEMENT COMMITTEES
The Board of Directors is assisted by three management
committees to improve decision-making efficiency:
The Audit Committee is composed of three directors:
Rennie F. Hendriksen as chairman, Martin Dekker and
Tom Bamelis. In accordance with the recommendations
of the Belgian Corporate Governance Code, this
committee is composed solely of non-executive directors,
and independent directors are in the majority.
The Audit Committee oversees the company’s
accounting and financial reporting within the context
of a charter approved by the Board of Directors. It also
supervises the internal financial and operational audit,
asset management and management processes. The
Audit Committee can request reports and information
on all aspects of the company at any time, both
internally as well as from the Certified Auditor, and can
carry out any type of audit. In conjunction with the
Certified Auditor, it discusses points related to
accounting, including the valuation of the company’s
assets. It evaluates the financial reports audited by
the Certified Auditor and advises the Board of
Directors on them.
The Audit Committee met five times in 2004. As CEO and
CFO, Alain Dehaze and Rob Zandbergen have permanent
seats at meetings. The Certified Auditor is usually invited
and members of management from the operating
companies can also be invited in respect of certain
matters.
The Remuneration Committee advises the Board of
Directors on the overall remuneration of the directors and
members of the Group Executive Committee and on how
management bodies are operating. Luc Bertrand,
Christian Dumolin and Alain Dehaze were members of this
committee over the course of 2004. Bearing in mind
recommendations 5.3 and 5.4 of the Belgian Corporate
Governance Code, the Board of Directors’ meeting of
25 February 2005 remodelled this committee into a
Nomination and Remuneration Committee and appointed
Luc Bertrand, Christian Dumolin and Jan Suykens as its
members. All of the members are non-executive directors
in accordance with the aforementioned recommendation.
However, the Board of Directors ruled that Jan Suykens’
knowledge of the company constituted such added value
for the new Nomination and Remuneration Committee
that it justified a departure from points 5.3.1 and 5.4.1 of
the Belgian Corporate Governance Code (which prescribes
a majority of independent directors). Luc Bertrand acts as
this committee’s chairman. The expansion of this renewed
committee’s duties will be discussed further by the Board
in accordance with the new Code. The Remuneration
Committee convened four times over the course of 2004.
Appointments at managerial level within the operating
companies are made in consultation with the companies
involved.
The Strategic Committee prepares important Board
decisions concerning acquisitions and divestments. It
provides advice on investor relations and holds business
reviews with important operating companies. It is
composed of Jan Suykens (via Legimco NV) who acts as its
chairman, Alain Dehaze, CEO and Rob Zandbergen, CFO.
Last year, the Strategic Committee convened in an official
capacity on 11 occasions.
These committees report to the Board about their
activities and make recommendations in line with their
roles and assignments.
The external audit is carried out by Ernst & Young
Bedrijfsrevisoren BCV, represented by Boudewijn Van

38 INFORMATION FOR SHAREHOLDERS
Ussel. They account for the external audit as Certified
Auditor of both the statutory annual accounts and the
consolidated annual accounts.
DAY-TO-DAY MANAGEMENT
The company’s day-to-day management rests with the
Group Executive Committee under the chairmanship of
Alain Dehaze, CEO. The Board of Directors appoints its
members. It is composed of Rob Zandbergen as CFO,
Marc Frustié as Executive Vice President and responsible
for operational steering of the operating companies, and
Herman Swinnen as Executive Vice President Corporate
Human Resources. The Group Executive Committee meets
every two weeks and convened nineteen times in 2004.
Given that Solvus’ activities are mainly local in character,
the operating companies’ general managers enjoy far-
reaching operational autonomy. On the other hand,
accurate and detailed reports are expected, as well as an
audit carried out by the CFO and the financial and
operational controllers. The CEO and/or members of the
Group Executive Committee always hold mandates in the
operating companies’ Boards of Directors. Structured
monthly business reviews complete this supervision.
As of 1 January 2005, the members of the Group Executive
Committee owned 2,900 shares in Solvus NV in a private
capacity. As of the same date, Alain Dehaze owned 26,721
warrants (with exercise prices of 26.05 euro, 19.25 euro,
20.09 euro and 8.61 euro) and 18,300 options (with
exercise prices of 6.94 euro and 11.17 euro).
Rob Zandbergen and Marc Frustié each owned 7,500
warrants (with exercise price of 11.17 euro) and 7,500
options (with exercise price of 6.94 euro). Herman Swinnen
owned 8,600 warrants (with exercise prices of 23.00 euro,
21.48 euro, 26.05 euro and 19.25 euro) and 15,000
options (with exercise prices of 6.94 euro and 11.17 euro).
REMUNERATIONS
Over the course of 2004, payments were awarded to the
non-executive members of the Board of Directors within
and beyond their managerial mandates amounting to the
sum of 331 ('000) euro. Independent, non-executive
directors receive annual payments respectively of 25 ('000)
euro (Rennie F. Hendriksen) or 23 ('000) euro (Martin
Dekker and Christian Dumolin) depending on whether or
not they chair a committee. These payments did not
contain any variables. With regard to the other non-
executive directors, Jan Suykens (via Legimco NV) received
37 ('000) euro and Ackermans & van Haaren 223 ('000)
euro within and beyond their managerial mandates. These
payments did not contain any variables.
Members of the Group Executive Committee and the
directors of Solvus’ operating companies also receive a
variable payment in addition to a fixed payment. On the
one hand, this variable payment depends on the growth
and profitability (EBITA, conversion rate and operating
cash flow) of the companies that they control and, on the
other hand, on the achievement of personal objectives.
In 2004, 1,519 (‘000) euro was paid gross to the members
of the Group Executive Committee (including the CEO)
who were in office in the course of that year (of which
1,253 ('000) euro was in fixed payments and 266 ('000)
euro in variable payments on the results of 2003). The
premiums paid in 2004 for the group insurance of the
Group Executive Committee’s members amounted to
100 ('000) euro.
In the same year, a fixed payment was paid to Alain Dehaze,
as CEO, of 300 ('000) euro, as well as a variable payment of
90 ('000) euro. The premium for his group insurance amoun-
ted to 35 ('000) euro. During the same period, he accepted
15,000 options with a exercise price of 11.17 euro.
The total payment made to the group auditor Ernst &
Young in Belgium and abroad for services to the group for
2004 amounted to 1,961 ('000) euro, of which 1,290
('000) euro was for assignments within the mandate and
670 ('000) euro for assignments beyond the mandate.
These latter assignments principally concerned fiscal or
legal advice and IFRS-related assignments. The group
auditor in Belgium and abroad invoiced approximately a
third of these personally, and approximately 15% related
to a Solvus NV assignment.
Members of the Board of Directors or of the Group
Executive Committee were not awarded any loans or
benefits in kind.
WARRANTS AND OPTIONS
Since 1999, warrant and option plans have been drawn
up for the benefit of executive and senior staff members
of Solvus and of executive members of the group’s

INFORMATION FOR SHAREHOLDERS 39
operating companies. The Board of Directors considers
warrants and options a valuable instrument for motivating
managers and strengthening bonds with the group.
These warrants were issued within the context of
authorised capital.
Presently (situation on 1 March 2005), there are 259,729
issued warrants (taking into account the stock split),
which were allocated after their creation by the Board
Meetings of 11 February 1999, 6 March 2001,
28 February 2002, 19 March 2002 and 28 February 2003.
This represents 1.02 % of issued shares. The exercise
price, the date from which these warrants can be
exercised and the year in which this right expires
can be summarised as follows:
18,200 23.00 01/01/2003 2012
14,765 21.48 01/01/2004 2012
15,267 26.05 01/01/2005 2014
4,002 26.64 01/01/2005 2012
71,943 19.25 01/01/2006 2015
8,836 19.53 01/01/2006 2015
32,500 20.09 01/01/2006 2015
11,721 8.61 01/01/2006 2015
82,495 11.17 01/01/2008 2013
* Situation as at 1 March 2005. Warrants and options that have expired in the interim have been taken into account.
In addition to this, and within the context of the share
option plans approved by the Board of Directors in 2000
and 2003, there are a further 136,800 share options
outstanding with the following exercise prices and dates
from which they may be exercised:
22,500 19.25 01/01/2006 2006
86,800 6.94 01/01/2007 2013
27,500 11.17 01/01/2008 2013
* Situation as at 1 March 2005. Warrants and options that have expired in the interim have been taken into account.
Moreover, a further 110,300 options (situation on
1 March 2005) have been offered to board members
at present at an exercise price of 14.24 euro within the
context of a share option plan approved by the Board of
Directors on 19 January 2005. Of this total, 29,000 have
been offered to the chairman and members of the Group
Executive Committee. These options have an exercise
period of 5 to 10 years. They were offered subject to
current fiscal legislation and cannot be exercised before
the end of the third year following the year of offer.
In respect of warrants issued before the end of 2002, it
was decided by the Board of Directors of 16 June 2003 to
extend their exercise period by three years in accordance
with article 407 of the programme act of 24 December
2002.
To enable compliance with the obligations that relate to
the abovementioned option plans, Solvus has repurchased
its own shares following approval of this by the extra-
ordinary general meetings of 22 December 2000 and
16 December 2003. As of 1 March 2005, Solvus owns
185,129 own shares. This figure represents 0.73%
of the number of existing shares and warrants. 140,000
of these were bought over the course of 2004 at an
average price of 14.42 euro.
POLICY REGARDING THE APPROPRIATION OF RESULTS
AND DIVIDEND
Taking into account the results of the past financial year,
the proposal will be put to the general meeting not to
pay out any dividends for the financial year of 2004.
Solvus will be resuming its dividend distribution policy as
soon as circumstances allow.
PROTECTION AGAINST INSIDER TRADING
All of Solvus’ employees, the executive members of
the group’s operating companies and the members
of the Board of Directors signed a protocol to prevent
insider trading.
Number of Exercise May be Untilwarrants* price exercised from (not beyond)
Number of Exercise Can be Untiloptions * price exercised from (not beyond)
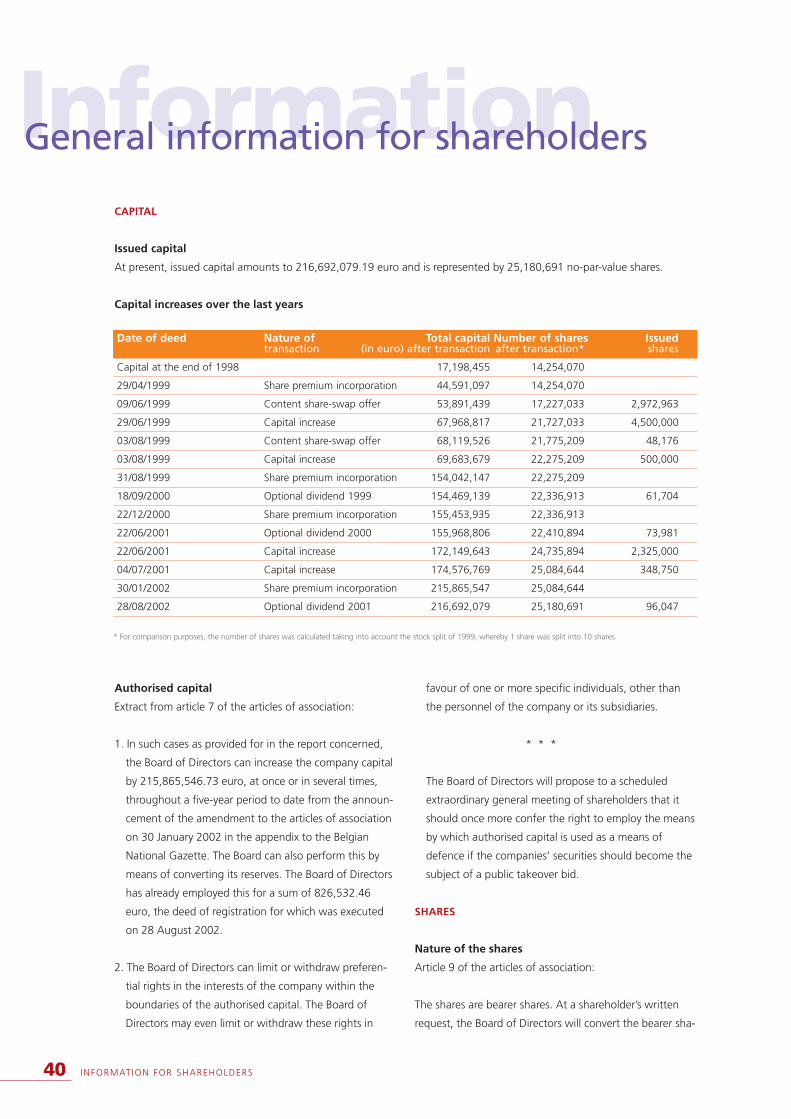
40 INFORMATION FOR SHAREHOLDERS
Authorised capital
Extract from article 7 of the articles of association:
1. In such cases as provided for in the report concerned,
the Board of Directors can increase the company capital
by 215,865,546.73 euro, at once or in several times,
throughout a five-year period to date from the announ-
cement of the amendment to the articles of association
on 30 January 2002 in the appendix to the Belgian
National Gazette. The Board can also perform this by
means of converting its reserves. The Board of Directors
has already employed this for a sum of 826,532.46
euro, the deed of registration for which was executed
on 28 August 2002.
2. The Board of Directors can limit or withdraw preferen-
tial rights in the interests of the company within the
boundaries of the authorised capital. The Board of
Directors may even limit or withdraw these rights in
favour of one or more specific individuals, other than
the personnel of the company or its subsidiaries.
* * *
The Board of Directors will propose to a scheduled
extraordinary general meeting of shareholders that it
should once more confer the right to employ the means
by which authorised capital is used as a means of
defence if the companies’ securities should become the
subject of a public takeover bid.
SHARES
Nature of the shares
Article 9 of the articles of association:
The shares are bearer shares. At a shareholder’s written
request, the Board of Directors will convert the bearer sha-
InformationGeneral information for shareholders
CAPITAL
Issued capital
At present, issued capital amounts to 216,692,079.19 euro and is represented by 25,180,691 no-par-value shares.
Capital increases over the last years
Date of deed Nature of Total capital Number of shares Issuedtransaction (in euro) after transaction after transaction* shares
Capital at the end of 1998 17,198,455 14,254,070
29/04/1999 Share premium incorporation 44,591,097 14,254,070
09/06/1999 Content share-swap offer 53,891,439 17,227,033 2,972,963
29/06/1999 Capital increase 67,968,817 21,727,033 4,500,000
03/08/1999 Content share-swap offer 68,119,526 21,775,209 48,176
03/08/1999 Capital increase 69,683,679 22,275,209 500,000
31/08/1999 Share premium incorporation 154,042,147 22,275,209
18/09/2000 Optional dividend 1999 154,469,139 22,336,913 61,704
22/12/2000 Share premium incorporation 155,453,935 22,336,913
22/06/2001 Optional dividend 2000 155,968,806 22,410,894 73,981
22/06/2001 Capital increase 172,149,643 24,735,894 2,325,000
04/07/2001 Capital increase 174,576,769 25,084,644 348,750
30/01/2002 Share premium incorporation 215,865,547 25,084,644
28/08/2002 Optional dividend 2001 216,692,079 25,180,691 96,047
* For comparison purposes, the number of shares was calculated taking into account the stock split of 1999, whereby 1 share was split into 10 shares.
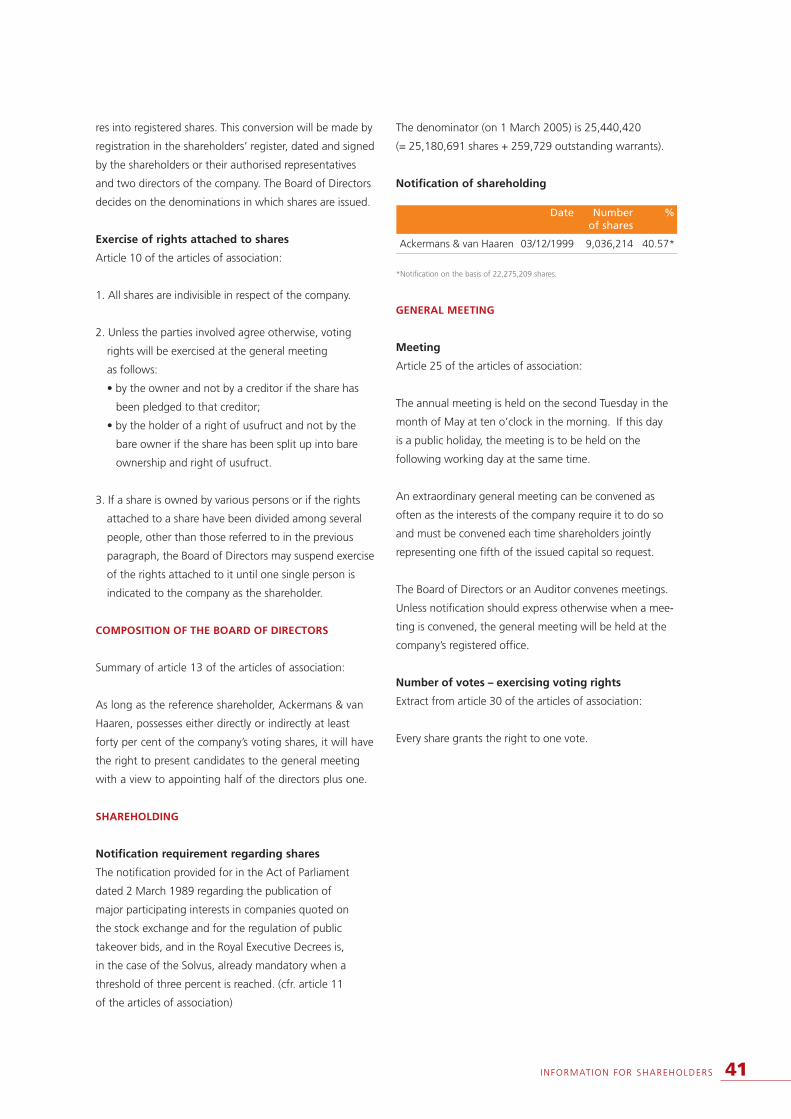
INFORMATION FOR SHAREHOLDERS 41
res into registered shares. This conversion will be made by
registration in the shareholders’ register, dated and signed
by the shareholders or their authorised representatives
and two directors of the company. The Board of Directors
decides on the denominations in which shares are issued.
Exercise of rights attached to shares
Article 10 of the articles of association:
1. All shares are indivisible in respect of the company.
2. Unless the parties involved agree otherwise, voting
rights will be exercised at the general meeting
as follows:
• by the owner and not by a creditor if the share has
been pledged to that creditor;
• by the holder of a right of usufruct and not by the
bare owner if the share has been split up into bare
ownership and right of usufruct.
3. If a share is owned by various persons or if the rights
attached to a share have been divided among several
people, other than those referred to in the previous
paragraph, the Board of Directors may suspend exercise
of the rights attached to it until one single person is
indicated to the company as the shareholder.
COMPOSITION OF THE BOARD OF DIRECTORS
Summary of article 13 of the articles of association:
As long as the reference shareholder, Ackermans & van
Haaren, possesses either directly or indirectly at least
forty per cent of the company’s voting shares, it will have
the right to present candidates to the general meeting
with a view to appointing half of the directors plus one.
SHAREHOLDING
Notification requirement regarding shares
The notification provided for in the Act of Parliament
dated 2 March 1989 regarding the publication of
major participating interests in companies quoted on
the stock exchange and for the regulation of public
takeover bids, and in the Royal Executive Decrees is,
in the case of the Solvus, already mandatory when a
threshold of three percent is reached. (cfr. article 11
of the articles of association)
The denominator (on 1 March 2005) is 25,440,420
(= 25,180,691 shares + 259,729 outstanding warrants).
Notification of shareholding
Date Number %of shares
Ackermans & van Haaren 03/12/1999 9,036,214 40.57*
*Notification on the basis of 22,275,209 shares.
GENERAL MEETING
Meeting
Article 25 of the articles of association:
The annual meeting is held on the second Tuesday in the
month of May at ten o’clock in the morning. If this day
is a public holiday, the meeting is to be held on the
following working day at the same time.
An extraordinary general meeting can be convened as
often as the interests of the company require it to do so
and must be convened each time shareholders jointly
representing one fifth of the issued capital so request.
The Board of Directors or an Auditor convenes meetings.
Unless notification should express otherwise when a mee-
ting is convened, the general meeting will be held at the
company’s registered office.
Number of votes – exercising voting rights
Extract from article 30 of the articles of association:
Every share grants the right to one vote.
42 INFORMATION FOR SHAREHOLDERS
Registered office of the company
Frankrijklei 101, 2000 Antwerp
Legal structure
Public Limited Company under Belgian law (N.V.)
Solvus Resource Group is the trading name of Solvus N.V.
Date of foundation
16 November 1972
Unique company number
Unique company number 0412 773 897
Court of Commerce, Antwerp
Duration of the company
Indefinite
Objectives of the company
Article 3 of the articles of association:
The objectives of the company are:
• to be a holding company;
• to have interests in other companies in order to control
their management or participate within them;
• to assist companies in terms of trade, industry and
administration, to perform secretarial work, to domicile
companies, to provide offices, warehouses and manu-
facturing premises, to provide preparatory studies and
give advice in the fields of management, marketing,
import and export; to send and receive mail and,
more generally, to do everything that may be
efficacious in the foundation, operation and
management of companies.
The company may take out a mortgage on its properties
and offer as collateral all of its other assets, including its
operating capital, and may grant endorsements for all
loans, credit and other obligations both for itself and for
any third parties, on the condition that it has a vested
interest therein.
It may carry out the function of director or liquidator for
other companies
Financial year
The financial year begins on 1 January and ends on
31 December.
Locations where the public can consult the docu-
ments
The company’s articles of association can be consulted at
the offices of the Registrar of the Court of Commerce in
Antwerp and at the company’s registered office.
The annual accounts are deposited at the National Bank
of Belgium.
Decisions in respect of appointments and dismissals of
members of the company’s bodies are published in the
appendices to the Belgian National Gazette.
Financial news concerning the company, as well as calls to
convene general meetings, are published in the financial
press and are available on the company’s website.
The most recent version of the coordinated articles of
association and the Board of Directors’ special reports
are available on the company’s website.
Printed copies of the annual report can be obtained free
of charge from the company’s registered office and will be
sent to anyone who so requests.
The annual report is available on the company’s website
(www.solvus.com).
Certified Auditor
Ernst & Young Bedrijfsrevisoren BCV, with registered offi-
ces at Marcel Thirylaan 204, 1200 Brussels, represented by
Boudewijn Van Ussel.
The Auditor was reappointed in 2003 for a new term of
3 years, which will end with immediate effect after the
general meeting in 2006.
InformationGeneral Information

Financialoverview

44 F INANCIAL OVERVIEW
ConsolidatedConsolidated annual accountsBALANCE SHEET
Assets
In euro x 1,000 Notes 2004 2003 2002
Fixed assets 402,190 431,270 478,974
I. Formation expenses VII 778 1,769 3,489
II. Intangible assets VIII 14,077 13,074 12,764
III. Positive consolidation differences XII 346,368 358,038 401,179
IV. Tangible assets XI 33,529 53,541 58,189
A. Land and buildings 2,458 9,497 14,281
B. Plant, machinery and equipment 5,088 7,775 7,840
C. Furniture and vehicles 8,966 10,921 13,473
D. Leasing and other similar rights 28 121 249
E. Other tangible fixed assets 16,989 23,583 22,331
F. Assets under construction and advance payments - 1,644 15
V. Financial assets I to IV and X 7,438 4,848 3,353
B. Other enterprises 7,438 4,848 3,353
1. Participating interests and shares 988 400 358
2. Amounts receivable 6,450 4,448 2,995
Current assets 387,497 343,639 406,986
VI. Amounts receivable after one year 20,177 16,796 10,301
A. Trade debtors 300 - -
B. Other amounts receivable - 28 1
C. Deferred tax 19,877 16,768 10,300
VII. Stocks and contracts in progress 103 658 364
A. Stocks 103 523 198
4. Goods purchased for resale 103 523 198
B. Contracts in progress - 135 166
VIII. Amounts receivable within one year 268,246 262,707 320,747
A. Trade debtors 253,783 239,263 286,224
B. Other amounts receivable 14,463 23,444 34,523
IX. Investments 48,725 1,619 18,262
A. Own shares 2,388 518 363
B. Other investments and deposits 46,337 1,101 17,899
X. Cash at bank and in hand 42,367 53,257 46,984
XI. Deferred charges and accrued income 7,879 8,602 10,328
Total assets 789,687 774,909 885,960

F INANCIAL OVERVIEW 45
Liabilities
In euro x 1,000 Notes 2004 2003 2002
Equity 244,047 243,198 304,837
I. Capital 216,692 216,692 216,692
A. Issued capital 216,692 216,692 216,692
II. Share premium account 62,710 62,710 62,710
IV. Consolidated reserves XI 26,119 25,339 86,783
V. Negative consolidation differences XII 214 224 215
Vbis Imputed positive consolidation differences -61,609 -61,609 -61,609
VI. Translation differences -79 -158 42
VII. Investment grants - - 4
Minority interests 1,153 1,072 1,357
VIII. Minority interests 1,153 1,072 1,357
Provisions, deferred tax and latent taxation liabilities 3,879 12,373 8,256
IX. A. Provisions for liabilities and charges 3,879 12,373 8,256
1. Pensions and similar obligations 884 1,448 1,860
4. Other liabilities and charges 2,995 10,925 6,396
Creditors 540,608 518,266 571,510
X. Amounts payable after one year XIII 115,986 150,044 156,952
A. Financial debts 115,979 149,631 156,204
2. Unsubordinated debentures 68,956 68,956 68,956
3. Leasing and other similar obligations - 40 132
4. Credit institutions 46,897 80,536 87,005
5. Other loans 126 99 111
D. Other amounts payable 7 413 748
XI. Amounts payable within one year XIII 411,942 352,056 402,251
A. Current portion of amounts payable after one year 30,788 15,739 29,994
B. Financial debts 108,636 82,089 143,679
1. Credit institutions 50,030 16,495 19,628
2. Other loans 58,606 65,594 124,051
C. Trade debts 25,622 29,384 27,556
1. Suppliers 25,622 29,384 27,556
D. Advances received on contracts in progress 40 356 403
E. Amounts payable regarding taxes, remuneration 237,462 208,056 171,142
1. Taxes 85,938 78,067 51,161
2. Remuneration and social security 151,524 129,989 119,981
F. Other amounts payable 9,394 16,432 29,477
XII. Accrued charges and deferred income 12,680 16,166 12,307
Total liabilities 789,687 774,909 885,960
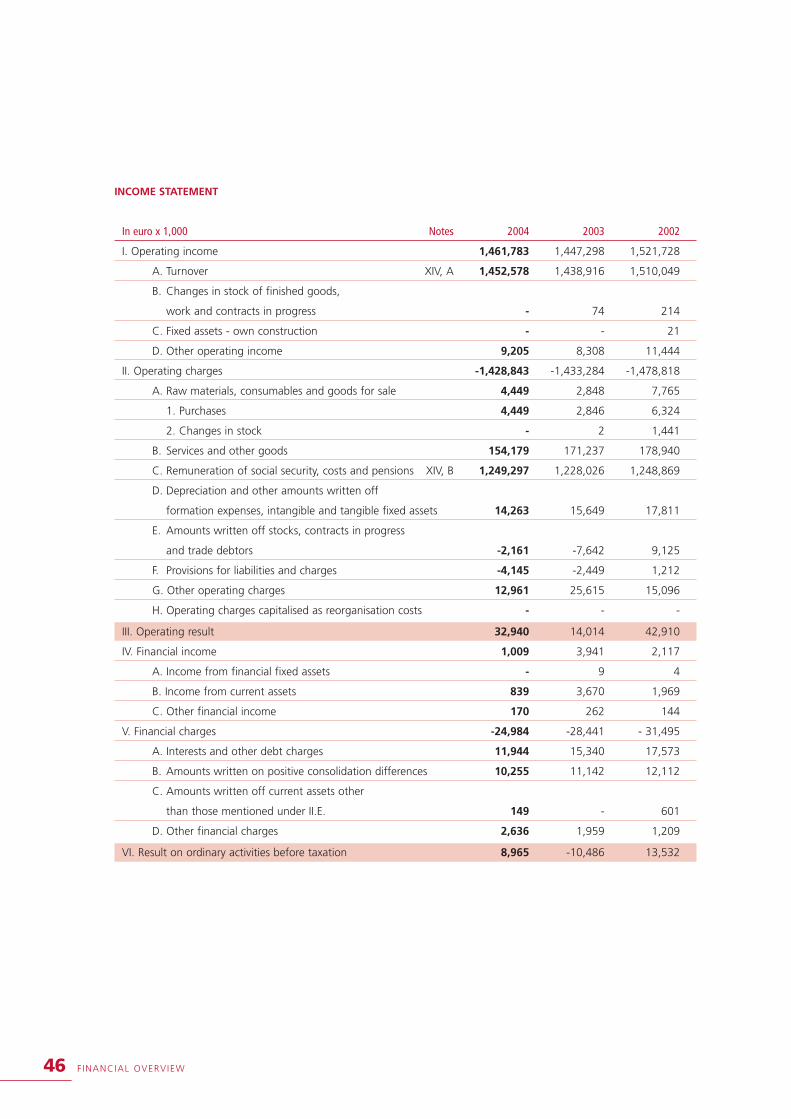
46 F INANCIAL OVERVIEW
INCOME STATEMENT
In euro x 1,000 Notes 2004 2003 2002
I. Operating income 1,461,783 1,447,298 1,521,728
A. Turnover XIV, A 1,452,578 1,438,916 1,510,049
B. Changes in stock of finished goods,
work and contracts in progress - 74 214
C. Fixed assets - own construction - - 21
D. Other operating income 9,205 8,308 11,444
II. Operating charges -1,428,843 -1,433,284 -1,478,818
A. Raw materials, consumables and goods for sale 4,449 2,848 7,765
1. Purchases 4,449 2,846 6,324
2. Changes in stock - 2 1,441
B. Services and other goods 154,179 171,237 178,940
C. Remuneration of social security, costs and pensions XIV, B 1,249,297 1,228,026 1,248,869
D. Depreciation and other amounts written off
formation expenses, intangible and tangible fixed assets 14,263 15,649 17,811
E. Amounts written off stocks, contracts in progress
and trade debtors -2,161 -7,642 9,125
F. Provisions for liabilities and charges -4,145 -2,449 1,212
G. Other operating charges 12,961 25,615 15,096
H. Operating charges capitalised as reorganisation costs - - -
III. Operating result 32,940 14,014 42,910
IV. Financial income 1,009 3,941 2,117
A. Income from financial fixed assets - 9 4
B. Income from current assets 839 3,670 1,969
C. Other financial income 170 262 144
V. Financial charges -24,984 -28,441 - 31,495
A. Interests and other debt charges 11,944 15,340 17,573
B. Amounts written on positive consolidation differences 10,255 11,142 12,112
C. Amounts written off current assets other
than those mentioned under II.E. 149 - 601
D. Other financial charges 2,636 1,959 1,209
VI. Result on ordinary activities before taxation 8,965 -10,486 13,532
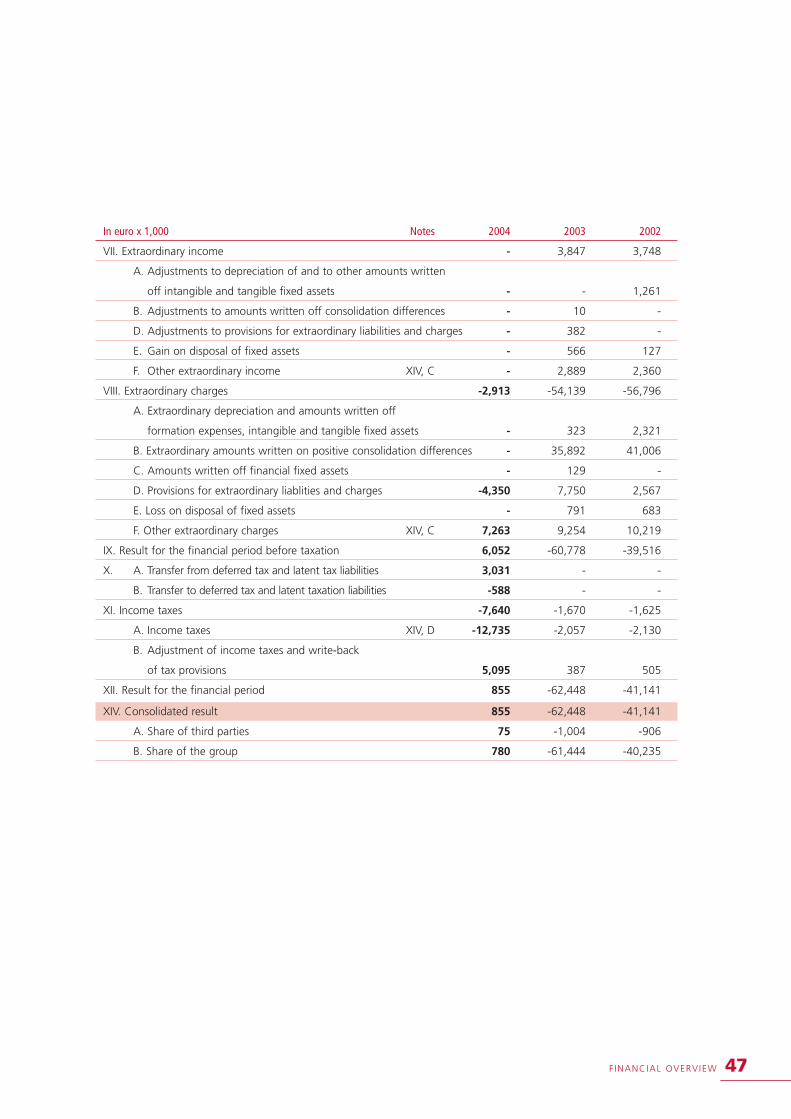
F INANCIAL OVERVIEW 47
In euro x 1,000 Notes 2004 2003 2002
VII. Extraordinary income - 3,847 3,748
A. Adjustments to depreciation of and to other amounts written
off intangible and tangible fixed assets - - 1,261
B. Adjustments to amounts written off consolidation differences - 10 -
D. Adjustments to provisions for extraordinary liabilities and charges - 382 -
E. Gain on disposal of fixed assets - 566 127
F. Other extraordinary income XIV, C - 2,889 2,360
VIII. Extraordinary charges -2,913 -54,139 -56,796
A. Extraordinary depreciation and amounts written off
formation expenses, intangible and tangible fixed assets - 323 2,321
B. Extraordinary amounts written on positive consolidation differences - 35,892 41,006
C. Amounts written off financial fixed assets - 129 -
D. Provisions for extraordinary liablities and charges -4,350 7,750 2,567
E. Loss on disposal of fixed assets - 791 683
F. Other extraordinary charges XIV, C 7,263 9,254 10,219
IX. Result for the financial period before taxation 6,052 -60,778 -39,516
X. A. Transfer from deferred tax and latent tax liabilities 3,031 - -
B. Transfer to deferred tax and latent taxation liabilities -588 - -
XI. Income taxes -7,640 -1,670 -1,625
A. Income taxes XIV, D -12,735 -2,057 -2,130
B. Adjustment of income taxes and write-back
of tax provisions 5,095 387 505
XII. Result for the financial period 855 -62,448 -41,141
XIV. Consolidated result 855 -62,448 -41,141
A. Share of third parties 75 -1,004 -906
B. Share of the group 780 -61,444 -40,235
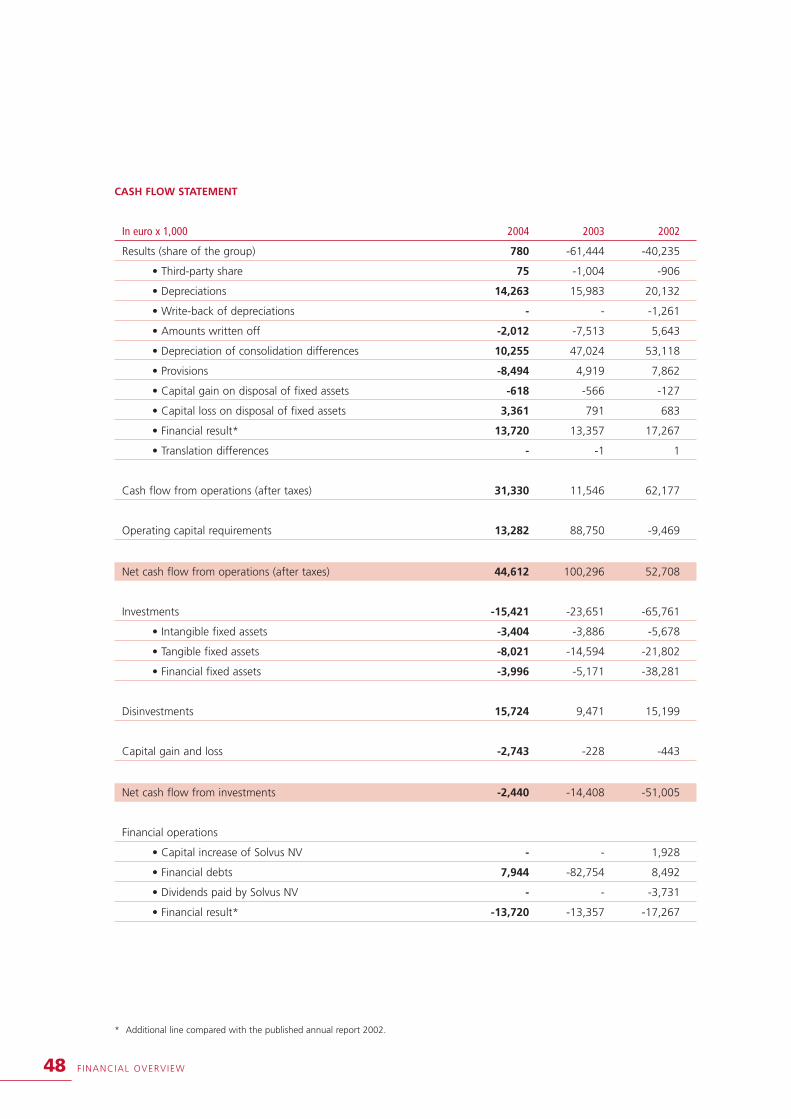
48 F INANCIAL OVERVIEW
CASH FLOW STATEMENT
In euro x 1,000 2004 2003 2002
Results (share of the group) 780 -61,444 -40,235
• Third-party share 75 -1,004 -906
• Depreciations 14,263 15,983 20,132
• Write-back of depreciations - - -1,261
• Amounts written off -2,012 -7,513 5,643
• Depreciation of consolidation differences 10,255 47,024 53,118
• Provisions -8,494 4,919 7,862
• Capital gain on disposal of fixed assets -618 -566 -127
• Capital loss on disposal of fixed assets 3,361 791 683
• Financial result* 13,720 13,357 17,267
• Translation differences - -1 1
Cash flow from operations (after taxes) 31,330 11,546 62,177
Operating capital requirements 13,282 88,750 -9,469
Net cash flow from operations (after taxes) 44,612 100,296 52,708
Investments -15,421 -23,651 -65,761
• Intangible fixed assets -3,404 -3,886 -5,678
• Tangible fixed assets -8,021 -14,594 -21,802
• Financial fixed assets -3,996 -5,171 -38,281
Disinvestments 15,724 9,471 15,199
Capital gain and loss -2,743 -228 -443
Net cash flow from investments -2,440 -14,408 -51,005
Financial operations
• Capital increase of Solvus NV - - 1,928
• Financial debts 7,944 -82,754 8,492
• Dividends paid by Solvus NV - - -3,731
• Financial result* -13,720 -13,357 -17,267
* Additional line compared with the published annual report 2002.

F INANCIAL OVERVIEW 49
In 2004, Solvus generated a cash flow from operational
result of 31.3 million euro, or 19.8 million euro more than
in the previous year. The working capital requirement
improved to 13.3 million euro by keeping the number
of days sales outstanding constant (this was already
considerably improved in 2003) and by better
coordinating our outgoing payments to the incoming
cash flows.
Net investments fell by 12 million euro to 2.4 million euro,
mainly due to the fact that there were no acquisitions in
2004 as well as to a decline in investments in tangible
fixed assets owing to a strict policy on costs.
Free cash flows were used to reduce financial debt, cau-
sing net financial debt to decrease to 164.3 million euro.
In euro x 1,000 2004 2003 2002
Net cash flow from financing -5,776 -96,111 -10,578
Total cash variation 36,396 -10,223 -8,875
• Net variation - - 3,252
• Translation differences -32 -147 -18
• Changes in the consolidation circle 36,364 -10,370 -5,641
Liquidity position at the start of the period 54,874 65,244 70,885
Liquidity position at the end of the period 91,238 54,874 65,244
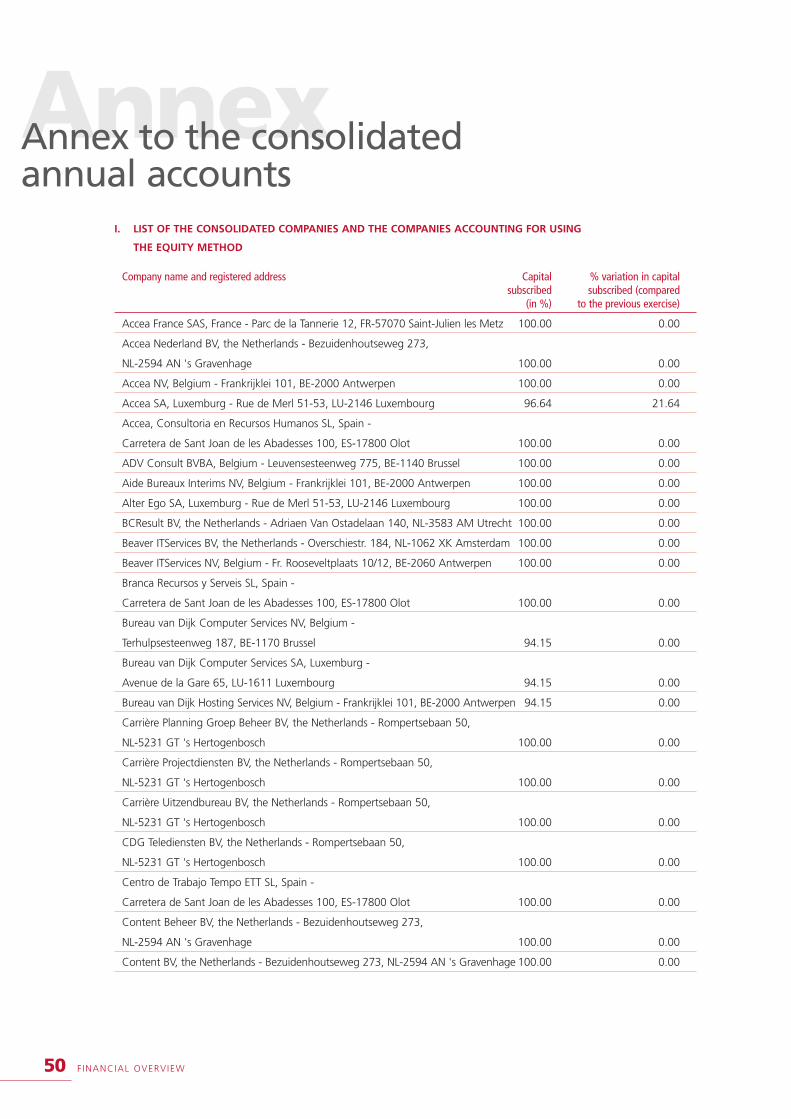
50 F INANCIAL OVERVIEW
AnnexAnnex to the consolidated annual accounts
I. LIST OF THE CONSOLIDATED COMPANIES AND THE COMPANIES ACCOUNTING FOR USING
THE EQUITY METHOD
Company name and registered address Capital % variation in capitalsubscribed subscribed (compared
(in %) to the previous exercise)
Accea France SAS, France - Parc de la Tannerie 12, FR-57070 Saint-Julien les Metz 100.00 0.00
Accea Nederland BV, the Netherlands - Bezuidenhoutseweg 273,
NL-2594 AN 's Gravenhage 100.00 0.00
Accea NV, Belgium - Frankrijklei 101, BE-2000 Antwerpen 100.00 0.00
Accea SA, Luxemburg - Rue de Merl 51-53, LU-2146 Luxembourg 96.64 21.64
Accea, Consultoria en Recursos Humanos SL, Spain -
Carretera de Sant Joan de les Abadesses 100, ES-17800 Olot 100.00 0.00
ADV Consult BVBA, Belgium - Leuvensesteenweg 775, BE-1140 Brussel 100.00 0.00
Aide Bureaux Interims NV, Belgium - Frankrijklei 101, BE-2000 Antwerpen 100.00 0.00
Alter Ego SA, Luxemburg - Rue de Merl 51-53, LU-2146 Luxembourg 100.00 0.00
BCResult BV, the Netherlands - Adriaen Van Ostadelaan 140, NL-3583 AM Utrecht 100.00 0.00
Beaver ITServices BV, the Netherlands - Overschiestr. 184, NL-1062 XK Amsterdam 100.00 0.00
Beaver ITServices NV, Belgium - Fr. Rooseveltplaats 10/12, BE-2060 Antwerpen 100.00 0.00
Branca Recursos y Serveis SL, Spain -
Carretera de Sant Joan de les Abadesses 100, ES-17800 Olot 100.00 0.00
Bureau van Dijk Computer Services NV, Belgium -
Terhulpsesteenweg 187, BE-1170 Brussel 94.15 0.00
Bureau van Dijk Computer Services SA, Luxemburg -
Avenue de la Gare 65, LU-1611 Luxembourg 94.15 0.00
Bureau van Dijk Hosting Services NV, Belgium - Frankrijklei 101, BE-2000 Antwerpen 94.15 0.00
Carrière Planning Groep Beheer BV, the Netherlands - Rompertsebaan 50,
NL-5231 GT 's Hertogenbosch 100.00 0.00
Carrière Projectdiensten BV, the Netherlands - Rompertsebaan 50,
NL-5231 GT 's Hertogenbosch 100.00 0.00
Carrière Uitzendbureau BV, the Netherlands - Rompertsebaan 50,
NL-5231 GT 's Hertogenbosch 100.00 0.00
CDG Telediensten BV, the Netherlands - Rompertsebaan 50,
NL-5231 GT 's Hertogenbosch 100.00 0.00
Centro de Trabajo Tempo ETT SL, Spain -
Carretera de Sant Joan de les Abadesses 100, ES-17800 Olot 100.00 0.00
Content Beheer BV, the Netherlands - Bezuidenhoutseweg 273,
NL-2594 AN 's Gravenhage 100.00 0.00
Content BV, the Netherlands - Bezuidenhoutseweg 273, NL-2594 AN 's Gravenhage 100.00 0.00

F INANCIAL OVERVIEW 51
Company name and registered address Capital % variation in capitalsubscribed subscribed (compared
(in %) to the previous exercise)
Content Professionals BV, the Netherlands - Bezuidenhoutseweg 273,
NL-2594 AN 's Gravenhage 100.00 0.00
Contentancy BV, the Netherlands - Adriaen van Ostadelaan 140,
NL-3583 AM Utrecht 100.00 0.00
Creyf's AG, Switzerland - Rue du Criblet 1, CH-1700 Fribourg 100.00 0.00
Creyf's Anzeigenservice GmbH, Germany - Landsberger Strasse 312,
DE-80687 München 100.00 0.00
Creyf's ASA Student BV, the Netherlands - Rompertsebaan 50,
NL-5231 GT 's Hertogenbosch 100.00 0.00
Creyf's Beheer BV, the Netherlands - Rompertsebaan 50,
NL-5231 GT 's Hertogenbosch 100.00 0.00
Creyf's Construct NV, Belgium - Frankrijklei 101, BE-2000 Antwerpen 100.00 0.00
Creyf's France SAS, France - Parc de la Tannerie 12,
FR-57070 Saint-Julien Les Metz 100.00 0.00
Creyf's Holding Deutschland GmbH, Germany - Landsberger Strasse 312,
DE-80687 München 100.00 0.00
Creyf's Interim BV, the Netherlands - Rompertsebaan 50,
NL-5231 GT 's Hertogenbosch 100.00 0.00
Creyf's Interim Horeca BV, the Netherlands - Rompertsebaan 50,
NL-5231 GT 's Hertogenbosch 100.00 0.00
Creyf's Interim SA, Luxemburg - 51-53 Rue de Merl, LU-2146 Luxembourg 100.00 0.00
Creyfs Interim SAS, France - Parc de la Tannerie 12,
FR-57070 Saint-Julien Les Metz 100.00 0.00
Creyf's NV, Belgium - Frankrijklei 101, BE-2000 Antwerpen 100.00 0.00
Creyf's Outsourcing GmbH, Germany - Landsberger Strasse 312,
DE-80687 München 100.00 0.00
Creyf's Personalservice GmbH, Germany - Landsberger Strasse 312,
DE-80687 München 100.00 0.29
Creyf's Personalservice GmbH, Austria - Mariahilferstrasse 88a,
AU-1070 Wien 100.00 0.00
Creyf's Polska. Sp.z.o.o., Poland - ul. Piotrkowska 111, PL-90-425 Lodz 62.05 0.00
Creyf's Recursos Humanos SL, Spain -
Carretera de Sant Joan de les Abadesses 100, ES-17800 Olot 100.00 0.00
Creyf's Select BV, the Netherlands - Rompertsebaan 50,
NL-5231 GT 's Hertogenbosch 100.00 0.00
Creyf's Select SpA, Italy - Via G. Murat 23, IT-20159 Milano 73.00 8.00
Creyf's Select Sp.z.o.o., Poland - Grzybowska 77, PL-00-844 Warsawa 100.00 0.00
Creyf's Services NV, Belgium - Frankrijklei 101, BE-2000 Antwerpen 100.00 0.00
Creyf's SpA, Italy - Via G. Murat 23, IT-20159 Milano 73.00 8.00
Creyf's Trabajo Temporal ETT SA, Spain -
Carretera de Sant Joan de les Abadesses 100, ES-17800 Olot 100.00 0.00

52 F INANCIAL OVERVIEW
Company name and registered address Capital % variation in capitalsubscribed subscribed (compared
(in %) to the previous exercise)
Development Assistance BVBA, Belgium - Fr. Rooseveltplaats 12/9,
BE-2060 Antwerpen 100.00 0.00
East West European Staffing SA, Luxemburg - Boulevard du Prince Henri 3 B,
LU-1724 Luxembourg 66.10 0.00
Express Medical Interim NV, Belgium - Boulevard de France 7,
BE-1420 Braine l'Alleud 100.00 0.00
Financial Forces Nederland BV, the Netherlands - Bezuidenhoutseweg 273,
NL-2501 's Gravenhage 100.00 0.00
Financial Forces NV, Belgium - Frankrijklei 101, BE-2000 Antwerpen 51.00 0.00
Gestion Publicité Commercialisation SA, France - Place Gramont 12, FR-64000 Pau 100.00 0.00
HR Forces NV, Belgium - Frankrijklei 101, BE-2000 Antwerpen 51.00 -49.00
Innotiv Belgium NV, Belgium - Rijnkaai 37, BE-2000 Antwerpen 100.00 0.00
Innotiv France SAS, France - Rue Gallieni 114, FR-92100 Boulogne Billancourt 100.00 0.00
Innotiv Germany GmbH, Germany - Kuckelke 4, DE-44135 Dortmund 100.00 0.00
Innotiv Group BV, the Netherlands - Het Rond 18, NL-2711 BW Zoetermeer 100.00 0.00
Innotiv Netherlands Beheer BV, the Netherlands - Het Rond 18,
NL-2711 BW Zoetermeer 100.00 0.00
Innotiv Netherlands Engineering BV, the Netherlands - Het Rond 18,
NL-2711 BW Zoetermeer 100.00 0.00
Innotiv Netherlands Operations BV, the Netherlands - Het Rond 18,
NL-2711 BW Zoetermeer 100.00 0.00
Inter-Re SA, Luxemburg - Route de Trèves 6b, LU-2633 Luxembourg 100.00 0.00
K. Reijerkerk 's Gravendeel Beheer BV, the Netherlands - Houtkoperstraat 17,
NL-3334 KD Zwijndrecht 100.00 0.00
Landmeetkundig Buro Geotec BV, the Netherlands - Houtkoperstraat 17,
NL-3334 KD Zwijndrecht 100.00 0.00
Oberon Informatiesystemen BV, the Netherlands - Teteringsedijk 295B,
NL-4817 ME Breda 100.00 0.00
Receptel NV, Belgium - Frankrijklei 101, BE-2000 Antwerpen 100.00 0.00
S&C Select BV, the Netherlands - Bezuidenhoutseweg 273, NL-2501 's Gravenhage 100.00 0.00
Solcos BV, the Netherlands - Rompertsebaan 50, NL-5231 GT 's Hertogenbosch 100.00 0.00
Solvus International NV, Belgium - Frankrijklei 101, BE-2000 Antwerpen 100.00 0.00
Solvus Nederland BV, the Netherlands - Rompertsebaan 50,
NL-5231 GT 's Hertogenbosch 100.00 0.00
Spekan Engineering NV, Belgium - De Bruwaan 35/b, BE-9700 Oudenaarde 100.00 0.00
StarJob BV, the Netherlands - Reaal 5c, NL-2353 TK Leiderdorp 100.00 0.00
StarJob Recruitment Services BV, the Netherlands - Reaal 5c, NL-2353 TK Leiderdorp 100.00 0.00
TechniTemps Interim NV, Belgium - Frankrijklei 101, BE-2000 Antwerpen 100.00 0.00
Top 64 Intérim SARL, France - Rue Marca 18, FR-64000 Pau 100.00 0.00
Topdrill Intérim SARL, France - Rue Marca 18, FR-64000 Pau 100.00 0.00
F INANCIAL OVERVIEW 53
V. CONSOLIDATION CRITERIA AND CHANGES TO THE
CONSOLIDATION CIRCLE
Consolidation criteria
AREA OF APPLICATION
The consolidating company Solvus NV and all of its subsi-
diaries are included in the consolidation.
CONSOLIDATION METHOD
All of the subsidiary companies, whether controlled directly
or indirectly, are fully consolidated. Creyf’s Projects NV and
Legal Forces NV were not included in the consolidation cir-
cle due to their negligible size.
Changes to the consolidation circle
In the first half of the year, Schoevers (the Netherlands),
Bureau van Dijk France (France), Bureau van Dijk IT and
JConsults (Belgium) were sold. Additionally, some mergers
took place, among others in Belgium and the Netherlands,
and the activity of Creyf’s Technics (Luxembourg) was
discontinued.
VI. VALUATION RULES
Principle
The valuation rules applied to drawing up the consolida-
ted annual accounts are the same as those used for the
annual accounts of Solvus NV.*
At the consolidated level, deferred tax assets should be
accounted for if the subsidiary concerned has generated a
fiscal loss carried forward. These deferred tax assets can
be accounted for only if there is relative certainty that the
subsidiary concerned is in a position of continuity and
taxable profit in the long term. Deferred tax assets are
entered in the consolidated balance sheet as long-term
receivables.
Consolidation differences
Consolidation differences relate to the positive difference
between the purchase price of a participating interest and
the proportional share of the equity, corresponding to the
purchased percentage of the participating interest.
Within the sectors where Solvus is active, the acquisition
price principally reflects goodwill, making direct allocation
to components for assets and liabilities impossible. In 1999,
the Board of Directors opted to amortise the consolidation
goodwill on participating interests over a maximum of 40
years. Moreover, on the basis of an exemption granted by
the Banking, Finance and Insurance Commission, the Board
of Directors offset the positive consolidation difference for
Content Beheer of 61.6 million euro against the share pre-
mium accrued as a result of the Creyf’s / Content share-
swap offer as described in the offer notice of 5 May 1999.
The long-term strategy of Solvus is based on acquiring or
maintaining a dominant presence in Europe in the temping
sector, secondment and projects and in other human
resources services. In view of this, Solvus is entering into
long-term participating interests to support the expansion
of its national and international network and/or the provi-
sion of services. The acquisition price paid in these sectors
principally reflects the goodwill component. Generally spea-
king, this goodwill can only increase over time as a result of
growth in annual performance. The growth potential of the
purchased company is always the determining factor in the
initial purchase price paid by Solvus.
It is only when this growth fails to materialise in the future
that the issue arises of a lasting decrease in value thus
requiring amortisation.
Additionally, in the temping sector on an international
level and especially in neighbouring countries, positive
consolidation differences are written off against equity
without passing through the income statement. The inter-
national dimension forces Solvus to compare itself with its
main European competitors. The various methods of
handling goodwill lead to distortion in the ratios applied
by international analysts.
Countries neighbouring Belgium interpret Article 30 §2
of the 7th European Directive on positive consolidation
differences very differently, with Belgium maintaining the
strictest interpretation.
In 1999, therefore, the Board of Directors requested a dero-
gation from the Banking, Finance and Insurance Commission
permitting them to offset the positive consolidation diffe-
rence for Content Beheer of 61.6 million euro against the
share premium that arose as a result of the Creyf’s / Content
share-swap offer. The Commission gave its consent on the
basis of Article 8 of the Royal Decree of 1 September 1986.
*See summary of the valuation rules on page 84.

54 F INANCIAL OVERVIEW
In 1999, on the basis of the same arguments, the Board of
Directors decided to change the valuation rules regarding
the amortisation of positive consolidation differences and to
set the amortisation period at a maximum of 40 years.
In principle, positive consolidation differences on partici-
pating interests acquired after 1 January 1999 will be
amortised over a period of 40 years. An Audit Committee
within the Board of Directors carries out an annual evalua-
tion of the amortisation period for every individual partici-
pating interest in the light of a participating interest’s
annual performance and, consequently, its lasting value.
The Board of Directors will proceed with additional
amortisation in the event of a lasting loss in value.
For positive consolidation differences already existing at the
end of 1998, it was specifically decided to spread the
balance to be amortised over 40 years less the period for
which amortisation had already taken place.
Moreover, no reversal was made of any amortisation that
had already been accounted for. In 2004, goodwill was
amortised according to the amended valuation rules of
1999.
If the goodwill for Content Beheer had not been deducted
from the share premium for the sum of 61.6 million euro
but instead had been amortised over 40 years, this would
have meant additional amortisation costs of 1.5 million
euro for 2004. Without imputation of the positive
consolidation differences on the share premium, equity
would have been 296.5 million euro as at 31 December
2004, i.e. 21.5% higher than the published equity of
244.0 million euro.
The Board of Directors believes that by making these
amendments they are meeting with requirements
concerning:
• transparency as regards information for investors and
a clear European comparison with its competitors;
• the 7th European Directive, Article 30 §2.
Conversions for foreign subsidiaries
The individual accounts of companies that do not come
under the euro are analysed in the consolidation in their
local currency and only then converted into euros.
Conversion is performed at the average rate for the
income statement; the balance sheet is converted at the
closing price. The consolidation included 18 companies
under Belgian law, 6 under Luxembourg law, 7 under
French law, 26 under Dutch law, 5 under German law,
1 under Swiss law, 1 under Austrian law, 5 under Spanish
law, 2 under Italian law and 2 under Polish law.
Start-up losses of new offices in Italy
In the consolidated annual accounts, start-up losses
from the new offices opened in Italy in 2000 and 2001
were capitalised on the balance sheet and amortised
over 5 years.
Amortisation costs in 2004 amounted to 0.323 million
euro. No losses were capitalised in 2004.

F INANCIAL OVERVIEW 55
VII. STATEMENT OF FORMATION EXPENSES
In euro x 1,000 Amounts
Net carrying value at the end of the preceding period 1,770
Movements during the period
• New expenses incurred 8
• Depreciation -964
• Translation differences -
• Other -36
Net carrying value at the end of the period 778
Detail
• Expenses of formation or capital increase, loan issue expenses,
discounts and other formation expenses 740
• Reorganisation costs 38
VIII. STATEMENT OF INTANGIBLE ASSETS
Research and Concessions, Goodwill Advancedevelopment patents, payments
In euro x 1,000 expenses licences, etc.
a) Acquisition cost at the end of the preceding period 20 14,270 6,596 -
Movements during the period
• Acquisitions including fixed assets,
own production - 3,253 143 -
• Sales and disposals - -2,015 - -
• Transfers from one heading to another - 1,845 - -
• Translation differences - 9 - -
• Other movements* - -2,508 - -
At the end of the period 20 14,854 6,739 -
c) Depreciation and amounts written down
at the end of the previous period 9 6,624 1,179 -
Movements during the period
• Recorded 7 2,885 199 -
• Written down after sales and disposals - -1,596 - -
• Transfers from one heading to another - - - -
• Translation differences - 7 - -
• Other movements* - -1,778 - -
At the end of the period 16 6,142 1,378 -
d) Net carrying value at the end of the period 4 8,712 5,361 -
* Specifically modifications caused by variations of consolidation parameters (article 11 of the Royal Decree of 3 December 1993).

56 F INANCIAL OVERVIEW
IX. STATEMENT OF TANGIBLE FIXED ASSETS
Land and Machinery Furniture Leasing Other Assets con- buildings and and and similar tangible structions
equipment vehicules engage- assets and advanceIn euro x 1,000 ments payments
a) Acquisition cost at the end
of the preceding period 15,013 23,008 27,198 790 44,854 1,644
Movements during the period
• Acquisitions including fixed assets,
own construction 944 761 2,362 3 3,951 -
• Sales and disposals -924 -2,021 -6,037 -534 -3,821 -18
• Transfers from one heading to another 1,280 -1,742 337 -80 -1,119 -1,626
• Translation differences 3 25 16 -10 -1 -
• Other movements* -13,102 -6,957 -4,908 -27 -6,583 -
At the end of the period 3,214 13,074 18,968 142 37,281 -
c) Depreciation and amounts written down at
the end of the previous period 5,516 15,233 16,277 669 21,271 -
Movements during the period
• Recorded 212 2,308 1,940 49 5,699 -
• Reversals - - - - - -
• Written down after sales and disposals -345 -2,001 -4,581 -516 -3,318 -
• Transferred from one heading to another 665 -950 - -67 -753 -
• Translation differences 1 16 5 -8 -2 -
• Other movements* -5,293 -6,620 -3,639 -13 -2,605 -
At the end of the period 756 7,986 10,002 114 20,292 -
d) Net carrying value at the end of the period 2,458 5,088 8,966 28 16,989 -
Of which
• Furniture and vehicles - - - 28 - -
* Specifically modifications caused by variations of consolidation parameters (article 11 of the Royal Decree of 3 December 1993).

F INANCIAL OVERVIEW 57
X. STATEMENT OF FINANCIAL FIXED ASSETS
In euro x 1,000 Other enterprises
1. Participating interests and shares
a) Acquisition cost at the end of the preceding period 474
Movements during the period
• Acquisitions 652
• Sales and disposals -64
• Transfers from one heading to another -
At the end of the period 1,062
d) Uncalled-up amounts
At the end of the previous period 74
Movements during the period -
At the end of the period 74
Net carrying value at the end of the period 988
2. Amounts receivable
Net carrying value at the end of the previous period 4,448
Movements during the period
• Additions 2,225
• Reimbursements -230
• Translation differences 7
• Other -
Net book value at the end of the period 6,450
XI. STATEMENT OF CONSOLIDATED RESERVES
In euro x 1,000 Amounts
Consolidated reserves at the end of the previous period 25,339
Movements
• Share of the group in the consolidated result 780
• Other movements -
Exchange-rate differences for the businesses in foreign currency relating to the 2004 opening balance sheet -
Consolidated reserves at the end of the period 26,119
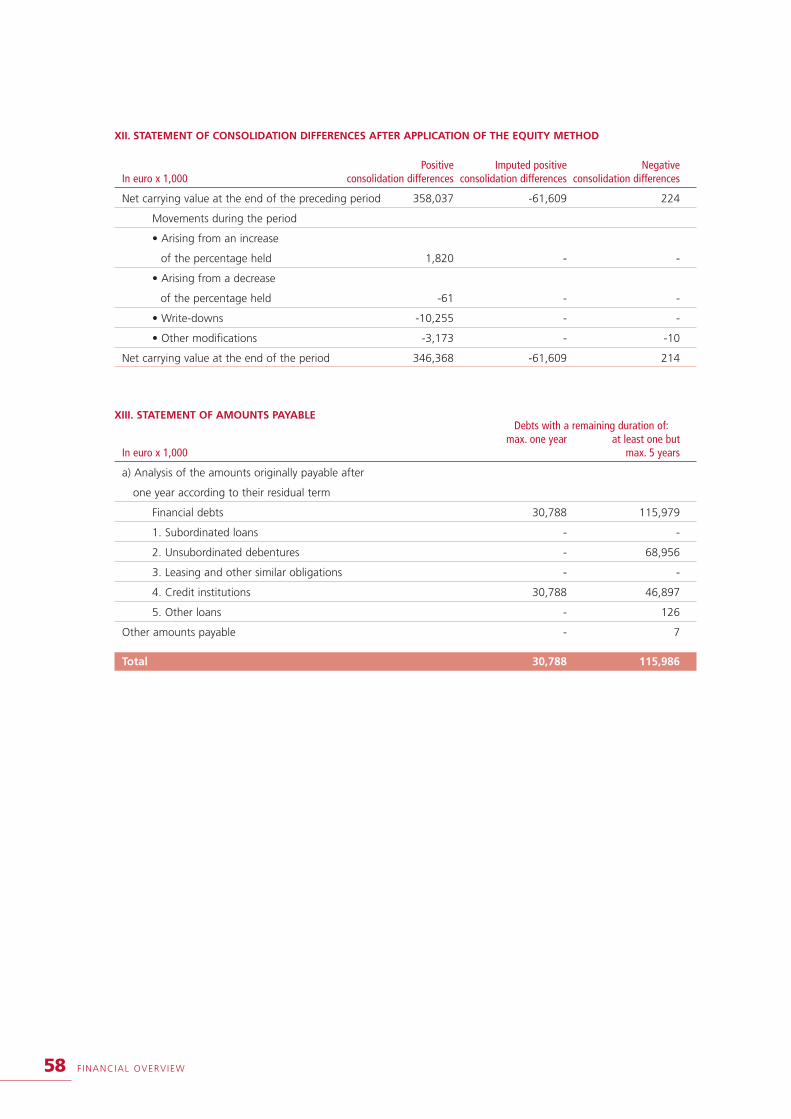
58 F INANCIAL OVERVIEW
XII. STATEMENT OF CONSOLIDATION DIFFERENCES AFTER APPLICATION OF THE EQUITY METHOD
Positive Imputed positive NegativeIn euro x 1,000 consolidation differences consolidation differences consolidation differences
Net carrying value at the end of the preceding period 358,037 -61,609 224
Movements during the period
• Arising from an increase
of the percentage held 1,820 - -
• Arising from a decrease
of the percentage held -61 - -
• Write-downs -10,255 - -
• Other modifications -3,173 - -10
Net carrying value at the end of the period 346,368 -61,609 214
XIII. STATEMENT OF AMOUNTS PAYABLEDebts with a remaining duration of:
max. one year at least one but In euro x 1,000 max. 5 years
a) Analysis of the amounts originally payable after
one year according to their residual term
Financial debts 30,788 115,979
1. Subordinated loans - -
2. Unsubordinated debentures - 68,956
3. Leasing and other similar obligations - -
4. Credit institutions 30,788 46,897
5. Other loans - 126
Other amounts payable - 7
Total 30,788 115,986
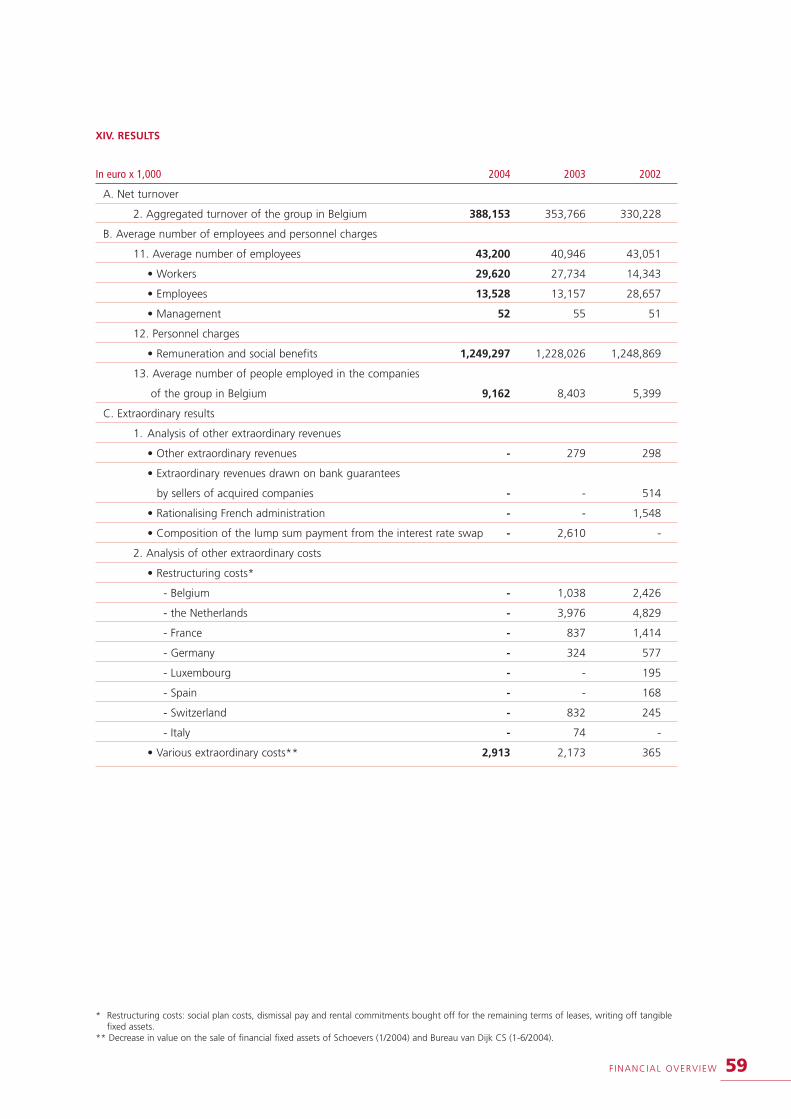
F INANCIAL OVERVIEW 59
XIV. RESULTS
In euro x 1,000 2004 2003 2002
A. Net turnover
2. Aggregated turnover of the group in Belgium 388,153 353,766 330,228
B. Average number of employees and personnel charges
11. Average number of employees 43,200 40,946 43,051
• Workers 29,620 27,734 14,343
• Employees 13,528 13,157 28,657
• Management 52 55 51
12. Personnel charges
• Remuneration and social benefits 1,249,297 1,228,026 1,248,869
13. Average number of people employed in the companies
of the group in Belgium 9,162 8,403 5,399
C. Extraordinary results
1. Analysis of other extraordinary revenues
• Other extraordinary revenues - 279 298
• Extraordinary revenues drawn on bank guarantees
by sellers of acquired companies - - 514
• Rationalising French administration - - 1,548
• Composition of the lump sum payment from the interest rate swap - 2,610 -
2. Analysis of other extraordinary costs
• Restructuring costs*
- Belgium - 1,038 2,426
- the Netherlands - 3,976 4,829
- France - 837 1,414
- Germany - 324 577
- Luxembourg - - 195
- Spain - - 168
- Switzerland - 832 245
- Italy - 74 -
• Various extraordinary costs** 2,913 2,173 365
* Restructuring costs: social plan costs, dismissal pay and rental commitments bought off for the remaining terms of leases, writing off tangiblefixed assets.
** Decrease in value on the sale of financial fixed assets of Schoevers (1/2004) and Bureau van Dijk CS (1-6/2004).

60 F INANCIAL OVERVIEW
XVI. RELATIONSHIPS WITH AFFILIATED ENTERPRISES AND ENTERPRISES LINKED BY PARTICIPATING INTERESTS BUT
NOT INCLUDED IN THE CONSOLIDATION
In euro x 1,000 2004 2003 2002
1. Financial fixed assets
• Participating interests and shares 751 400 358
2. Amounts receivable - 4,448 2,995
• Within one year - 4,448 2,995
XVII. FINANCIAL RELATIONSHIPS WITH DIRECTORS OR MANAGERS OF THE CONSOLIDATING ENTERPRISE
In euro x 1,000 2004
A.Total amount of remunerations granted in respect of their responsabilities in the consolidation
enterprise, its subsidiaries and its affiliated enterprises, including the amounts in respect of
retirement pensions granted to former directors or managers 721
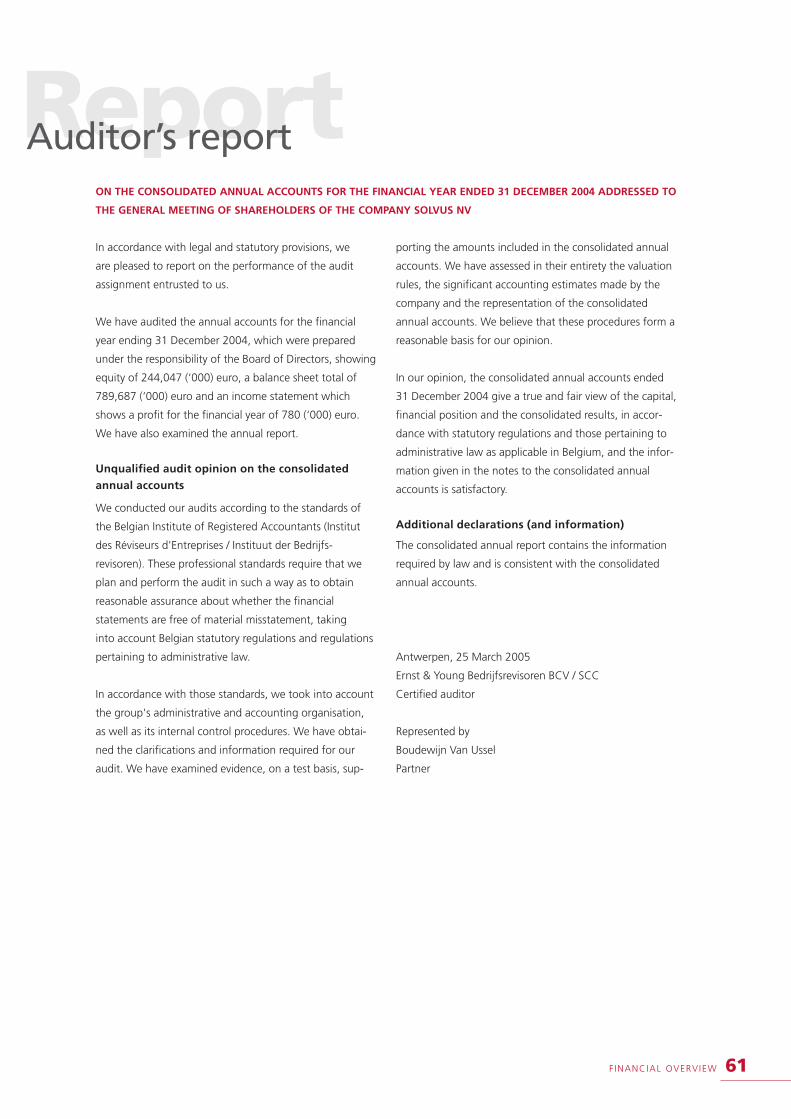
F INANCIAL OVERVIEW 61
ReportAuditor’s reportON THE CONSOLIDATED ANNUAL ACCOUNTS FOR THE FINANCIAL YEAR ENDED 31 DECEMBER 2004 ADDRESSED TO
THE GENERAL MEETING OF SHAREHOLDERS OF THE COMPANY SOLVUS NV
In accordance with legal and statutory provisions, we
are pleased to report on the performance of the audit
assignment entrusted to us.
We have audited the annual accounts for the financial
year ending 31 December 2004, which were prepared
under the responsibility of the Board of Directors, showing
equity of 244,047 (‘000) euro, a balance sheet total of
789,687 (‘000) euro and an income statement which
shows a profit for the financial year of 780 (‘000) euro.
We have also examined the annual report.
Unqualified audit opinion on the consolidatedannual accounts
We conducted our audits according to the standards of
the Belgian Institute of Registered Accountants (Institut
des Réviseurs d'Entreprises / Instituut der Bedrijfs-
revisoren). These professional standards require that we
plan and perform the audit in such a way as to obtain
reasonable assurance about whether the financial
statements are free of material misstatement, taking
into account Belgian statutory regulations and regulations
pertaining to administrative law.
In accordance with those standards, we took into account
the group's administrative and accounting organisation,
as well as its internal control procedures. We have obtai-
ned the clarifications and information required for our
audit. We have examined evidence, on a test basis, sup-
porting the amounts included in the consolidated annual
accounts. We have assessed in their entirety the valuation
rules, the significant accounting estimates made by the
company and the representation of the consolidated
annual accounts. We believe that these procedures form a
reasonable basis for our opinion.
In our opinion, the consolidated annual accounts ended
31 December 2004 give a true and fair view of the capital,
financial position and the consolidated results, in accor-
dance with statutory regulations and those pertaining to
administrative law as applicable in Belgium, and the infor-
mation given in the notes to the consolidated annual
accounts is satisfactory.
Additional declarations (and information)
The consolidated annual report contains the information
required by law and is consistent with the consolidated
annual accounts.
Antwerpen, 25 March 2005
Ernst & Young Bedrijfsrevisoren BCV / SCC
Certified auditor
Represented by
Boudewijn Van Ussel
Partner

62 F INANCIAL OVERVIEW IFRS
IFRSIFRS consolidated financial statements
As a company listed on the stock exchange, Solvus will be
compiling its consolidated annual accounts according to
IFRS as of 2005. Consequently, both the opening balance
sheet as at 1 January 2004 and the consolidated balance
sheet and income statement on 31 December 2004 were
converted from Belgian valuation rules to IFRS.
In accordance with IFRS standards, the adjustments
resulting from the transition from Belgian accounting
standards (Belgian GAAP) to IFRS were acknowledged in
the equity as of 1 January 2004. In this transition, Solvus
opted to make use of five exemptions as provided for in
IFRS 1:
• no business combinations were corrected that
appeared prior to the transition date;
• all cumulative actuarial profits and losses on pension
commitments from the past were acknowledged in
the equity;
• the ‘fair value’ or revaluation was employed as the
purchase price for land and buildings;
• the option and warrant plans issued before 7
November 2002 were not dealt with according
to IFRS 2;
• it was assumed that there were no cumulative
exchange rate differences in foreign operations on
1 January 2004.
In these explanatory notes, the balance sheet reported
according to Belgian valuation rules on 31 December
2003 is reconciled with the converted IFRS opening
balance sheet as at 1 January 2004.
In addition, the balance sheet as at 31 December 2004,
the income statement for 2004 and the 2004 cash flow
statement were converted to IFRS. The reconciliation
between the reported financial statements according to
Belgian valuation rules and the converted IFRS balance
sheet, income statement, and cash flow statement was
included under point 2 (page 66).
A more detailed explanation follows of the most
important differences in both the opening balance
sheet and the balance sheet as at 31 December 2004.
In addition, a distinction was made for ease of under-
standing between adjustments and reclassifications.

F INANCIAL OVERVIEW IFRS 63
1. OPENING BALANCE SHEET AS AT 1 JANUARY 2004
Belgian Revisions IFRS In euro x 1,000 valuation rules Reclassifications Adjustments
Total non-current assets 448,066 -3,053 5,900 450,913
Tangible assets 53,541 -5,556 A,B 5,138 (1) 53,123
Goodwill 358,038 0 0 358,038
Intangible assets (including formation expenses) 14,843 1,311 A,B -295 (2) 15,859
Investments in associates 0 0 0 0
Investments in subsidiaries 0 0 0 0
Financial assets 4,848 581 A,F -1,196 (3) 4,233
Deferred tax assets 16,796 611 A,D 2,253 (4) 19,660
Total current assets 326,843 22,827 -1,616 348,054
Inventories 658 -315 0 343
Trade receivables 239,263 25,760 C,E -446 264,577
Tax receivables 0 6,543 D 0 6,543
Other receivables
(including deferred charges and accrued income) 32,046 -8,060 E -1,170 (5) 22,816
Cash and cash equivalents 54,876 -1,101 F 0 53,775
Total assets 774,909 19,774 4,284 798,967
Total equity 244,270 -518 -6,961 236,791
Issued capital 216,692 -4,981 G 0 211,711
Group reserves 26,506 3,880 G -6,961 23,425
Minority interests 1,072 583 G 0 1,655
Total non-current liabilities 162,417 -7,393 7,751 162,775
Long-term borrowings 149,631 0 3,085 (6) 152,716
Other payables 413 0 0 413
Provisions 12,373 -8,927 H -88 3,358
Employee benefit obligations 0 1,534 I 570 2,104
Deferred tax liabilities 0 0 4,184 (4) 4,184
Total current liabilities 368,222 27,685 3,494 399,401
Short-term borrowings 97,828 25,215 C 2,671 (6) 125,714
Trade payables 29,384 28 0 29,412
Tax payables 78,067 714 0 78,781
Other payables
(including accrued charges and deferred income) 32,954 -2,050 I 823 31,727
Provisions 0 2,226 H,I 0 2,226
Employee benefit obligations 129,989 1,552 I 0 131,541
Total equity and liabilities 774,909 19,774 4,284 798,967

64 F INANCIAL OVERVIEW IFRS
Identified IFRS - Belgian GAAP revisions (in million euro) Effect on equity*1 January 2004
Reclassification of leasing contracts (1), (2) and (6) 0.8
Revaluation of buildings on first application of IFRS (1) 0.3
Start-up losses of new offices (2) -1.1
Capital increase costs (2) -0.5
Internal development of Solvus trademark (2) -0.5
Effective interest method on an authorised loan (3) -1.2
Deferred taxes (4) -1.9
Capitalised publicity costs (5) -1.2
Other effects -1.7
Total revisions before minority interests -7.0
* The effect of the adjustments in the explanatory notes is shown prior to the possible effects of taxation.
1.1 Adjustments to equity in the opening balance sheet
The most important adjustments to equity as at 1 January 2004 are:
The adjustments are explained in more detail below for
each balance sheet heading:
(1) In accordance with the criteria of Belgian accounting
law, a number of rights of use relating to tangible
assets were treated as operational leasing. Given the
more stringent conditions under IFRS, a number of
contracts needed to be reclassified as financial lea-
sing. 4.8 million euro in tangible assets was capitali-
sed by this means. Because of the IFRS first appliance,
land and buildings were re-evaluated on the basis of
an appraiser’s report, which resulted in a net increase
in value of 0.3 million euro.
(2) A number of rights of use relating to intangible
assets were also reclassified as financial leasing for a
total of 1.8 million euro. Moreover, a number
of other costs that were capitalised under Belgian
valuation rules had to be charged against equity
under IFRS. These costs relate to the start-up losses of
a number of new offices (-1.1 million euro), costs of
capital increase (-0.5 million euro) and the internally
developed and patented Solvus trademark (-0.5 mil-
lion euro).
(3) In accordance with IAS 39, the loans authorised
for a French government institution should be written
down according to the effective interest method
(effect of -1.2 million euro).
(4) In addition to the deferred tax assets on fiscal
losses carried forward, deferred taxes on temporary
differences between the tax basis for assets and
liabilities and their book value should also be
recorded for financial reports under IFRS (impact
on assets +2.3 million euro and impact on liabilities
+4.2 million euro). The greatest effect is related to
the equalisation reserve of the Luxembourg
reinsurance company (effect on assets of +4.2 million
euro).
(5) Under Belgian GAAP, costs for publicity campaigns
and promotions had been capitalised; these have to
be acknowledged directly as cost in accordance with
IAS 38 (effect of -1.2 million euro).
(6) The adjustment to financial debts, both long-term
and short-term, is explained by the reclassification of
a number of rights of use as financial leasing.
Financial leasing reclassifications have had a total
positive impact on Solvus’ equity of 0.8 million euro.
In addition to the effects already mentioned, a further
number of smaller effects were included in the opening
balance sheet, including the collective provision for bad
debts, actuarial calculations for pension commitments and
revaluations of interest rate swaps.
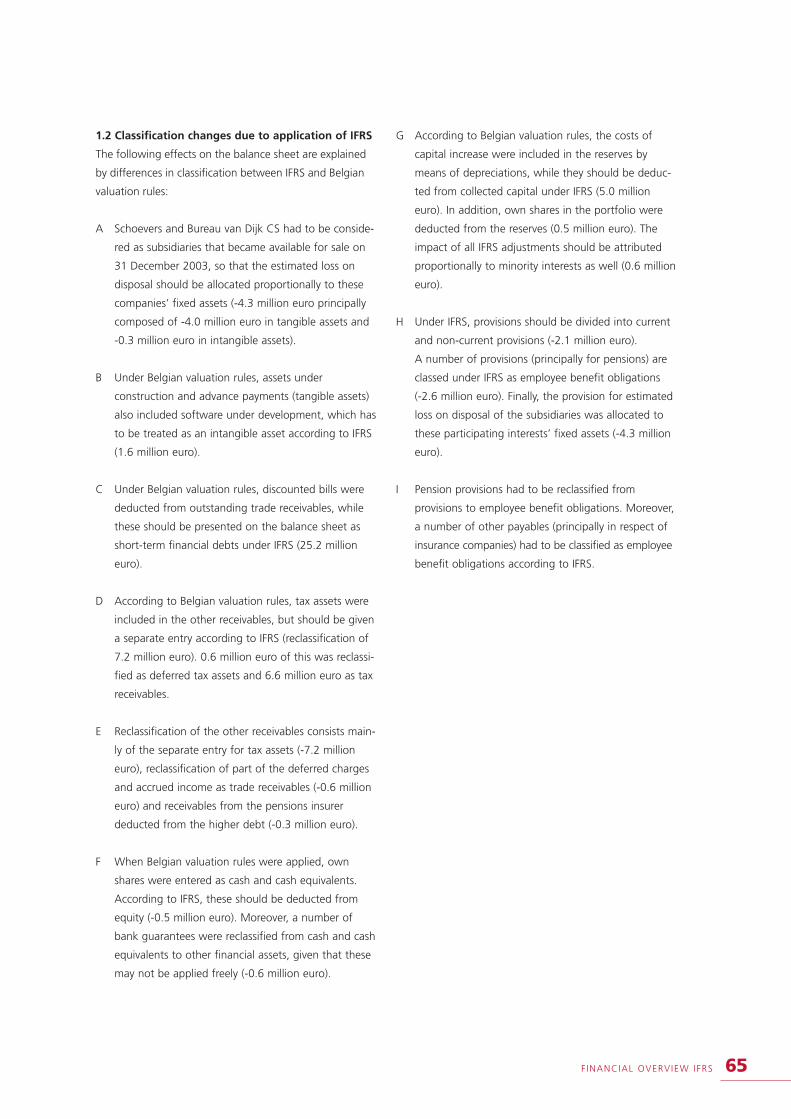
F INANCIAL OVERVIEW IFRS 65
1.2 Classification changes due to application of IFRS
The following effects on the balance sheet are explained
by differences in classification between IFRS and Belgian
valuation rules:
A Schoevers and Bureau van Dijk CS had to be conside-
red as subsidiaries that became available for sale on
31 December 2003, so that the estimated loss on
disposal should be allocated proportionally to these
companies’ fixed assets (-4.3 million euro principally
composed of -4.0 million euro in tangible assets and
-0.3 million euro in intangible assets).
B Under Belgian valuation rules, assets under
construction and advance payments (tangible assets)
also included software under development, which has
to be treated as an intangible asset according to IFRS
(1.6 million euro).
C Under Belgian valuation rules, discounted bills were
deducted from outstanding trade receivables, while
these should be presented on the balance sheet as
short-term financial debts under IFRS (25.2 million
euro).
D According to Belgian valuation rules, tax assets were
included in the other receivables, but should be given
a separate entry according to IFRS (reclassification of
7.2 million euro). 0.6 million euro of this was reclassi-
fied as deferred tax assets and 6.6 million euro as tax
receivables.
E Reclassification of the other receivables consists main-
ly of the separate entry for tax assets (-7.2 million
euro), reclassification of part of the deferred charges
and accrued income as trade receivables (-0.6 million
euro) and receivables from the pensions insurer
deducted from the higher debt (-0.3 million euro).
F When Belgian valuation rules were applied, own
shares were entered as cash and cash equivalents.
According to IFRS, these should be deducted from
equity (-0.5 million euro). Moreover, a number of
bank guarantees were reclassified from cash and cash
equivalents to other financial assets, given that these
may not be applied freely (-0.6 million euro).
G According to Belgian valuation rules, the costs of
capital increase were included in the reserves by
means of depreciations, while they should be deduc-
ted from collected capital under IFRS (5.0 million
euro). In addition, own shares in the portfolio were
deducted from the reserves (0.5 million euro). The
impact of all IFRS adjustments should be attributed
proportionally to minority interests as well (0.6 million
euro).
H Under IFRS, provisions should be divided into current
and non-current provisions (-2.1 million euro).
A number of provisions (principally for pensions) are
classed under IFRS as employee benefit obligations
(-2.6 million euro). Finally, the provision for estimated
loss on disposal of the subsidiaries was allocated to
these participating interests’ fixed assets (-4.3 million
euro).
I Pension provisions had to be reclassified from
provisions to employee benefit obligations. Moreover,
a number of other payables (principally in respect of
insurance companies) had to be classified as employee
benefit obligations according to IFRS.

66 F INANCIAL OVERVIEW IFRS
Balance sheet as at 31/12/2004 Belgian Revisions IFRS In euro x 1,000 valuation rules Reclassifications Adjustments
Total non-current assets 422,367 2,250 12,547 437,164
Tangible assets 33,529 0 2,854 (1) 36,383
Goodwill 346,368 0 10,255 (2) 356,623
Intangible assets (including formation expenses) 14,855 0 -431 (3) 14,424
Investments in associates 0 0 0 0
Investments in subsidiaries 0 250 0 250
Financial assets 7,738 2,000 A -1,521 (4) 8,217
Deferred tax assets 19,877 0 1,390 (5) 21,267
Total current assets 367,320 20,909 -1,059 387,170
Inventories 103 0 0 103
Trade receivables 253,783 25,547 B -319 279,011
Tax receivables 6,061 0 0 6,061
Other receivables
(including deferred charges and accrued income) 16,281 0 -740 (6) 15,541
Cash and cash equivalents 91,092 -4,638 C 0 86,454
Total assets 789,687 23,159 11,488 824,334
Total equity 245,200 -2,388 2,343 245,155
Issued capital 216,692 -4,981 D 0 211,711
Group reserves 27,355 2,222 D 2,343 31,920
Minority interests 1,153 371 D 0 1,524
Total non-current liabilities 119,865 29 6,572 126,466
Long-term borrowings 115,979 0 1,061 (7) 117,040
Other payables 7 0 0 7
Provisions 3,879 -854 -1 3,024
Employee benefit obligations 0 883 349 1,232
Deferred tax liabilities 0 0 5 163 (5) 5,163
Total current liabilities 424,622 25,518 2,573 452,713
Short-term borrowings 139,424 25,547 B 2,165 (7) 167,136
Trade payables 25,622 0 0 25,622
Tax payables 85,938 0 0 85,938
Other payables (including accrued charges and
deferred income) 22,114 -82 523 22,555
Provisions 0 2 0 2
Employee benefit obligations 151,524 51 -115 151,460
Total equity and liabilities 789,687 23,159 11,488 824,334
2. CONSOLIDATED BALANCE SHEET AS AT 31 DECEMBER 2004, INCOME STATEMENT, AND CASH FLOW STATEMENT
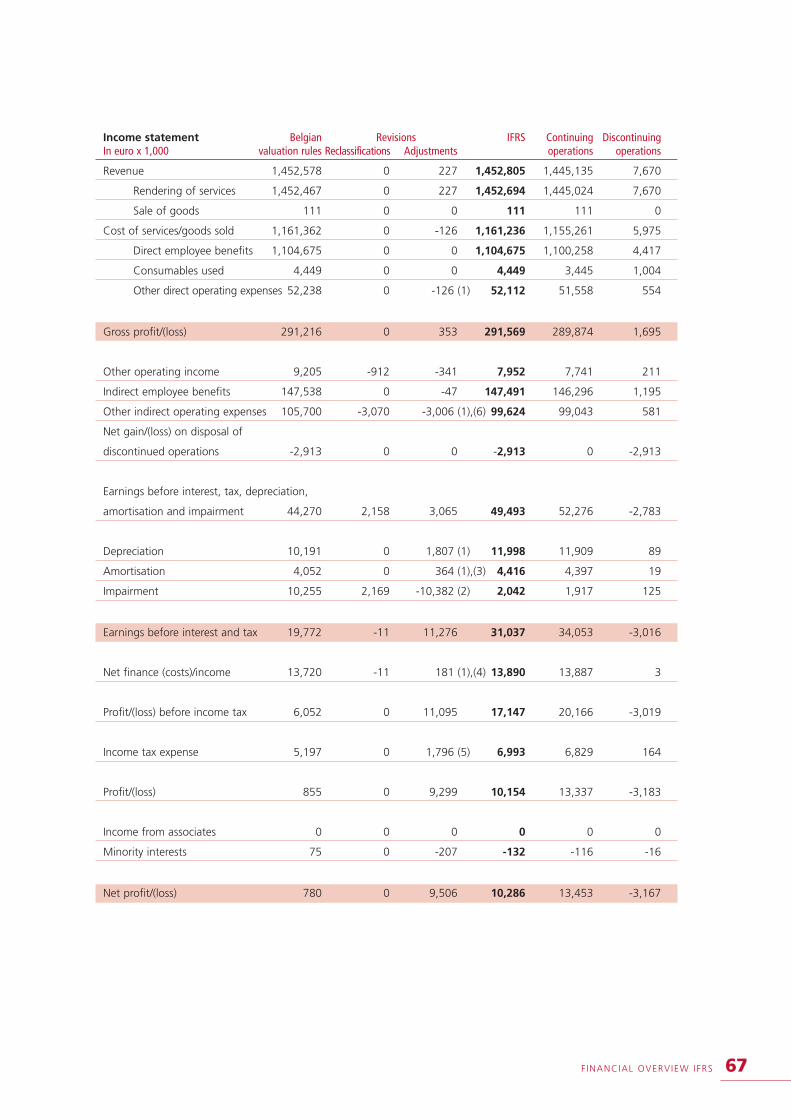
F INANCIAL OVERVIEW IFRS 67
Income statement Belgian Revisions IFRS Continuing DiscontinuingIn euro x 1,000 valuation rules Reclassifications Adjustments operations operations
Revenue 1,452,578 0 227 1,452,805 1,445,135 7,670
Rendering of services 1,452,467 0 227 1,452,694 1,445,024 7,670
Sale of goods 111 0 0 111 111 0
Cost of services/goods sold 1,161,362 0 -126 1,161,236 1,155,261 5,975
Direct employee benefits 1,104,675 0 0 1,104,675 1,100,258 4,417
Consumables used 4,449 0 0 4,449 3,445 1,004
Other direct operating expenses 52,238 0 -126 (1) 52,112 51,558 554
Gross profit/(loss) 291,216 0 353 291,569 289,874 1,695
Other operating income 9,205 -912 -341 7,952 7,741 211
Indirect employee benefits 147,538 0 -47 147,491 146,296 1,195
Other indirect operating expenses 105,700 -3,070 -3,006 (1),(6) 99,624 99,043 581
Net gain/(loss) on disposal of
discontinued operations -2,913 0 0 -2,913 0 -2,913
Earnings before interest, tax, depreciation,
amortisation and impairment 44,270 2,158 3,065 49,493 52,276 -2,783
Depreciation 10,191 0 1,807 (1) 11,998 11,909 89
Amortisation 4,052 0 364 (1),(3) 4,416 4,397 19
Impairment 10,255 2,169 -10,382 (2) 2,042 1,917 125
Earnings before interest and tax 19,772 -11 11,276 31,037 34,053 -3,016
Net finance (costs)/income 13,720 -11 181 (1),(4) 13,890 13,887 3
Profit/(loss) before income tax 6,052 0 11,095 17,147 20,166 -3,019
Income tax expense 5,197 0 1,796 (5) 6,993 6,829 164
Profit/(loss) 855 0 9,299 10,154 13,337 -3,183
Income from associates 0 0 0 0 0 0
Minority interests 75 0 -207 -132 -116 -16
Net profit/(loss) 780 0 9,506 10,286 13,453 -3,167

Cash flow statement Belgian Revisions IFRS Continuing DiscontinuedIn euro x 1,000 valuation rules* operations operations
Net cash flow from operating activities 44,612 2,136 46,748 50,958 -4,210
Net profit/(loss) 780 9,506 10,286 13,453 -3,167
Minority interest 75 -207 -132 -116 -16
Income tax expense/(income) 5,197 1,651 6,848 6,685 163
Net finance costs/(income) 13,720 170 13,890 13,887 3
Depreciation, amortisation and impairment 22,506 -8,360 14,146 13,978 168
Provisions -7,625 0 -7,625 -3,095 -4,530
Capital (gain)/loss on disposal of fixed assets 2,743 342 3,085 299 2,786
Cost of allocated options/warrants 0 156 156 156 0
Change in net operating capital 10,530 -1,266 9,264 8,881 383
Income taxes (paid)/received -3,314 144 -3,170 -3,170 0
Net cash (used in)/from investing activities 294 18 312 -9,411 9,723
Acquisition of subsidiary, net of cash/
(net overdraft) acquired -2,271 0 -2,271 -2,271 0
Disposal of subsidiary, including net overdraft/
(cash) disposed of 9,923 0 9,923 0 9,923
Purchase of tangible assets -8,021 -95 -8,116 -8,015 -101
Purchase of intangible assets -3,404 0 -3,404 -3,304 -100
Proceeds from the disposal of tangible assets 2,658 0 2,658 2,657 1
Proceeds from the disposal of intangible assets 400 0 400 400 0
Interest received 1,009 113 1,122 1,122 0
Dividends received 0 0 0 0 0
Net cash (used in)/from financing activities 368 -3,821 -3,453 -3,429 -24
Return of capital 0 0 0 0 0
Proceeds from financial debts 19,389 332 19,721 19,721 0
Repayment of financial debts 0 -2,528 -2,528 -2,528 0
Change in financial fixed assets -2,241 -1,342 -3,583 -3,562 -21
(Purchase)/Sale of own shares -2,019 0 -2,019 -2,019 0
Proceeds from issuance of share capital 0 0 0 0 0
Translation difference -32 0 -32 -32 0
Interest paid -14,729 -283 -15,012 -15,009 -3
Dividends paid 0 0 0 0 0
Net variation in available resources 45,274 -1,667 43,607 38,118 5,489
Cash and cash equivalents - opening balance sheet 38,381 -583 37,798 37,454 344
Cash and cash equivalents - closing balance sheet 83,655 -2,250 81,405 81,405 0
* The cash flow statement according to Belgian valuation rules above is already in the new IFRS layout. See commentary on the cash flow statement on page 70.
68 F INANCIAL OVERVIEW IFRS

F INANCIAL OVERVIEW IFRS 69
Established IFRS - Belgian GAAP revisions (in million euro) Effect on equity* Net result31 Dec 2004 2004
Reclassification of leasing contracts (1), (3) and (7) 0.3 -0.5
Goodwill (2) 10.3 10.3
Start-up losses of new offices (3) -0.5 0.6
Capital increase costs (3) -0.3 0.2
Internal development of Solvus trademark (3) -0.3 0.2
Effective interest method on an authorised loan (4) -1.5 -0.3
Deferred taxes (5) -3.8 -1.9
Capitalised publicity costs (6) -0.8 0.4
Other effects -1.1 0.3
Total revisions before minority interests 2.3 9.3
* The effect of the adjustments in the explanatory notes is shown prior to the possible effects of taxation.
2.1 Adjustments to equity on the consolidated balance sheet as at 31 December 2004 and the income
statement for 2004
The most important adjustments to equity as at 31 December 2004 and the 2004 result are:
The revisions are explained in more detail below for each
balance sheet heading:
(1) As a result of reclassifying rights of use as financial
leasing, the residual book value of the tangible assets
was presented on the balance sheet as at
31 December 2004 (2.9 million euro).
(2) In accordance with Belgian valuation rules, conso-
lidation goodwill was amortised over a period of
maximum 40 years. In accordance with IFRS, the
goodwill impairment system was applied, enabling
the recorded amortisation of goodwill to be reduced
(10.3 million euro). The impairment test at the end
of 2004 did not give cause for additional capital
write-off.
(3) The residual book value of the intangible assets
was placed on the balance sheet as a result
of the financial leasing reclassification (0.7 million
euro). The residual book value of the start-up losses
for a number of new offices, costs of capital increa-
se and the internally developed and patented Solvus
trademark (totalling -1.1 million euro, cfr. table
supra) had to be removed from the assets. The
discrepancy with the adjustment to the opening
balance sheet (1 million euro, cfr. table on page 64
and table supra) could be removed from the 2004
result.
(4) In accordance with IAS 39, the loans authorised for
a French government institution should be written
down according to the effective interest method
(effect of -1.5 million euro on the balance sheet as at
31 December 2004 and -0.3 million euro on the
2004 result).
(5) In addition to the deferred tax assets on fiscal
losses carried forward, deferred taxes on temporary
differences between the tax basis for assets and
liabilities and their book value should also be
recorded for financial reports under IFRS (effect of
-3.8 million euro on the balance sheet as at
31 December 2004 and -1.9 million euro on the
2004 result). The greatest effect is related to the
equalisation reserve of the Luxembourg reinsurance
company (effect of -5.1 million euro on the balance
sheet as at 31 December 2004 and -0.9 million euro
on the 2004 result).
(6) Costs for publicity campaigns and promotions had
been capitalised under Belgian GAAP; these have to
be acknowledged directly as cost in accordance with
IAS 38 (effect of -0.8 million euro on the balance
sheet as at 31 December 2004 and 0.4 million euro
on the 2004 result).
(7) The adjustment to financial debts, both long-term
and short-term, is explained by the reclassification of
a number of rights of use as financial leasing.
Therefore, the financial leasing reclassifica-tion has
had a total positive impact of 0.3 million euro on
Solvus’ equity, but has had a negative effect on
2004’s result before tax of -0.5 million euro.

70 F INANCIAL OVERVIEW IFRS
In addition to the effects already mentioned, a further
number of smaller effects were included in the opening
balance sheet, including the collective provision for bad
debts, actuarial calculations for pension commitments
and revaluations of interest rate swaps. The cost of the
issued option and warrant plans is also contained in these
other effects on the net result; this has not had any impact
on equity (0.2 million euro).
2.2 Classification changes due to application of IFRS
The following effects on the balance sheet are explained
by differences in classification between IFRS and Belgian
valuation rules:
A A number of bank guarantees had to be reclassified
from cash and cash equivalents to other financial
assets, given that these cannot be applied freely
(effect of 2.2 million euro). Moreover, investments in
associates and investments in subsidiaries have to be
presented separately under IFRS (effect of -0.2 million
euro).
B Under Belgian valuation rules, discounted bills were
deducted from outstanding trade receivables, while
these should be presented on the balance sheet as
short-term financial debts under IFRS (25.5 million
euro).
C In accordance with Belgian valuation rules, own sha-
res were presented as investments. According to IFRS,
these should be deducted from equity (-2.4 million
euro). Moreover, a number of bank guarantees were
reclassified from cash and cash equivalents to other
financial assets, given that these may not be applied
freely (-2.2 million euro).
D In accordance with Belgian valuation rules, the costs
of capital increase were included in the reserves by
means of depreciations, while they should be deduc-
ted from collected capital under IFRS (5.0 million
euro). In addition, own shares in the portfolio were
deducted from the reserves (-2.4 million euro). As a
result of all IFRS adjustments, part of the adjusted
reserves is to be attributed to third parties (-0.4 mil-
lion euro).
2.3 Explanation of the 2004 cash flow statement
The cash flow statement according to Belgian valuation
rules - as included in the annual report - has already been
put into the new IFRS layout above. The principal changes
are explained on the one hand by advances in current
accounts, which according to IFRS should be presented as
cash and cash equivalents, and on the other hand by own
shares, which are no longer included in the cash and cash
equivalents.
In addition to layout changes, the IFRS adjustments also
affect the cash flows:
• Net cash from operating activities has been increased
principally by the reclassification of leasing contracts.
The payments to leasing companies are considered in
this instance as debt repayments.
• Net cash from investing activities is explained
principally by the fall in received interest, which is
due to the revaluation of SWAPs at market value.
• Net cash from financing activities was affected on the
one hand by the reclassification of leasing contracts
and, on the other hand, by the reclassification of
guarantees from cash and cash equivalents to other
financial assets.

F INANCIAL OVERVIEW IFRS 71
IFRSAuditor's Report
To the management of Solvus NV
We have audited the accompanying preliminary IFRS con-
solidated balance sheet of Solvus NV as at 31 December
2004 and the related consolidated statements of income
and cash flows for the year then ended (thereon referred
to as “preliminary IFRS financial information”). The prelim-
inary IFRS financial information is the responsibility of the
company's directors. They have been prepared as part of
the company's conversion to International Financial
Reporting Standards (IFRS). Our responsibility is to express
an opinion on the preliminary IFRS financial information
based on our audit.
We conducted our audit in accordance with IAS standards
(International Standards on Auditing). Those standards
require that we plan and perform the audit to obtain rea-
sonable assurance about whether the preliminary IFRS
financial information is free of material misstatement. An
audit includes examining, on a test basis, evidence sup-
porting the amounts and disclosures in the preliminary
financial statements. An audit also includes assessing the
accounting principles used and significant estimates made
by management, as well as evaluating the overall presen-
tation of the preliminary IFRS financial information. We
believe that our audit provides a reasonable basis for our
opinion.
In our opinion, the preliminary IFRS financial information
as at 31 December 2004 and for the year then ended
have been prepared, in all material respects, in accordance
with the basis set out in page 62, which describes how
IFRS have been applied under IFRS 1, including the
assumptions management has made about the standards
and interpretations expected to be effective, and the poli-
cies expected to be adopted, when management prepares
its first complete set of IFRS financial statements as at 31
December 2005 as further described below.
Without qualifying our opinion, we draw attention to the
fact that page 72 explains why there is a possibility that
the preliminary IFRS financial information may require
adjustment before constituting the final IFRS financial sta-
tements. Moreover, we draw attention to the fact that,
under IFRS, only a complete set of financial statements
with comparative financial information and explanatory
notes can provide a fair presentation of the company's
financial position, results of operations and cash flows in
accordance with IFRS.
Antwerpen, 25 March 2005
Ernst & Young Bedrijfsrevisoren BCV
Certified auditor
Represented by
Boudewijn Van Ussel
Partner
SPECIAL PURPOSE AUDITOR’S REPORT ON THE 31 DECEMBER 2004 PRELIMINARY IFRS FINANCIAL INFORMATION

72 F INANCIAL OVERVIEW IFRS
IFRSValuation rules
BASIS OF FINANCIAL STATEMENTS
The consolidated financial statements of Solvus have been
prepared in accordance with International Financial Reporting
Standards (IFRS), which comprise standards and interpreta-
tions approved by the IASB, and International Accounting
Standards and Standing Interpretations Committee inter-
pretations approved by the IASC, that remain in effect.*
The consolidated financial statements have been prepared
on an historical cost basis, except for derivative financial
instruments that are measured at fair value. The carrying
values of recognised assets and liabilities that are hedged
are adjusted to record changes in the fair values attributa-
ble to the risks that are being hedged.
BASIS OF CONSOLIDATION
The consolidated financial statements comprise the
financial statements of Solvus NV and its subsidiaries.
Subsidiaries are consolidated from the date on which control
is transferred to the group and cease to be consolidated from
the date on which control is transferred out of the group.
Minority interests represent the interests in subsidies that
are not held by the group.
FOREIGN CURRENCY TRANSLATION
Transactions in foreign currencies are recorded in the
functional currency at the spot rate of exchange ruling at
the date of the transaction. Monetary assets and liabilities
denominated in foreign currencies are retranslated at the
spot rate of exchange ruling at the balance sheet date.
All differences are taken to the income statement.
For foreign operations with a functional currency other
than the euro, assets, liabilities and equity items other
than those resulting from income and expenses recogni-
sed in the period, are translated to the euro at the rate of
exchange ruling as at the balance sheet date. Income and
expenses recognised in the period are translated at
weighted average exchange rates for the year. All resul-
ting exchange differences are recognised as a separate
component of equity. On disposal of a foreign operation,
the accumulated exchange differences are recognised in
the income statement as a component of the gain or loss
on disposal.
Goodwill and fair value adjustments arising on the
acquisition of a foreign operation are treated as assets
and liabilities of the foreign operation and translated at
the closing rate accordingly.
REVENUE
Revenue is recognised to the extent that it is probable that
the economic benefits will flow to the group and the
revenue can be reliably measured. Revenue of the group
primarily results from rendering of services. The following
specific recognition criteria apply:
• Fees charged for temp-agency services are recognised
as revenue as the services are provided.
• Fees charged for IT and engineering secondment on a
‘time & material’ basis are recognised as revenue as the
services are provided.
• Fees charged for IT and engineering projects on a
fixed price basis are recognised as revenue by refe-
rence to the stage of completion of the contract. The
stage of completion is determined by the survey of
work performed as documented in the project admi-
nistration. When it is probable that total contract costs
will exceed total contract revenue, the expected loss is
recognised as an expense immediately. Where the
contract outcome cannot be measured reliably, reve-
nue is recognised only to the extent of the expenses
recognised that are recoverable.
• Fees charged for recruitment & selection on a ‘no cure,
no pay’ basis are recognised as revenue at the moment
the assignment is successfully completed.
* With reservation of possible changes to the standards and interpretations by the IASB or the European Commission.
F INANCIAL OVERVIEW IFRS 73
• Fees charged for recruitment & selection on a split
contract basis are recognised as revenue on the basis
of the contractual billing terms, which is generally one
third upon signing of the contract, one third upon
presentation of a number of possible recruits to the
client, and one third upon successful completion of
the assignment.
• Fees charged for fixed price individualised outplace-
ment contracts are recognised as revenue on a
straight-line basis over the period of consultancy
services rendered. The period of consultancy is
determined on the basis of a semi-annually updated
twelve months’ rolling average of historical data.
In case of significant changes in market conditions,
the management committee of the group will consider
such conditions in determining the average period of
consultancy.
• Fees charged for consultancy services on a ‘time &
material’ basis (outplacement, training, testing,
assessment and all other consultancy services) are
recognised as revenue as the services are provided.
Revenue from the sale of goods in respect of IT and engin-
eering projects (“box moving”) is recognised when the
significant risk and rewards of ownership of the goods
have passed to the buyer.
Revenue from the sale of IT licences is recognised when
the user key is handed over to the client.
Interest income is recognised as the interest accrues.
Dividend income is recognised when the shareholders’
right to receive the payment is established.
Revenue is measured at the nominal value of cash recei-
ved or receivable. Value added taxes are excluded from
revenues.
GOVERNMENT GRANTS
Government grants are recognised at their fair value where
there is reasonable assurance that the grant will be recei-
ved and all attaching conditions will be complied with.
When the grant relates to an expense item, it is
recognised as a deduction of such expense item over the
periods necessary to match the grant on a systematic basis
to the expense item that it is intended to compensate.
Where the grant relates to an asset, the fair value is
credited to a deferred income account and is released to
other income, pro-rata the depreciation or amortisation
charge of the relevant asset.
INCOME TAXES
Deferred income tax is provided on all temporary
differences as at the balance sheet date between the tax
bases of assets and liabilities and their carrying amounts
for financial reporting purposes.
Deferred income tax liabilities are recognised for all
taxable temporary differences except where the deferred
income tax liability arises from the initial recognition of
goodwill.
Deferred income tax assets are recognised for deductible
temporary differences and carry-forward of unused tax
credits and tax losses, to the extent that it is probable that
taxable profit will be available in the foreseeable future
against which the deductible temporary differences and
carry-forward of unused tax credits and unused tax losses
can be utilised. Concerning foreseeable future a term of 4
years is adopted. The carrying amount of deferred income
tax assets is reviewed at each balance sheet date and
reduced to the extent that it is no longer probable that
sufficient taxable profit will be available to allow all or part
of the deferred income tax to be utilised. Deferred income
tax assets and liabilities are measured at the tax rates that
are expected to apply to the period when the asset is
realised or the liability is settled, based on tax rates and
tax laws that have been enacted or substantially enacted
at the balance sheet date.
BORROWING COSTS
Borrowing costs are recognised as an expense in the
period in which they are incurred.

74 F INANCIAL OVERVIEW IFRS
TANGIBLE ASSETS
An item of land, buildings, leasehold improvements, office
equipment and vehicles is recognised as a tangible asset
when:
(i) it is probable that future economic benefits
associated with the asset will flow to the group,
and
(ii) the cost of the asset can be measured reliably.
Upon recognition a tangible asset is measured at cost.
The cost of a tangible asset comprises its purchase price
or production/construction cost, including import duties
and non-refundable purchase taxes, and any directly
attributable costs of bringing the asset to working
condition for its intended use. Borrowing costs that are
directly attributable to the acquisition, construction or
production of a tangible fixed asset, are capitalised as part
of the cost of that item. For items that have been revalued
to fair value prior to 1 January 2004, date of transition to
IFRS, the revalued amounts are considered as cost.
Subsequent to initial recognition as an asset, the tangible
assets are carried at their cost less any accumulated depre-
ciation and any accumulated impairment losses.
Depreciation is accounted for as an expense on a straight-
line basis over the estimated useful lives of the tangible
assets. Land is not depreciated. The estimated useful lives
of the other items are as follows:
Class Lifetime (number of years)
Buildings 20 to 33 years
Leasehold The shorter of 5 years
improvements and the remaining period
up to the end of the lease
contract
Office equipment:
- Computer, fax,
copier, etc. 5 years
- Furniture 10 years
Vehicles 5 years
The depreciable amount is calculated at cost less residual
value. The residual value of the items of tangible assets of
Solvus is considered to be insignificant and therefore not
taken into account in the calculation of the depreciable
amount.
The carrying values of tangible assets are reviewed for
impairment when events or changes in circumstances
indicate that the carrying value may not be recoverable.
If any such indication exists and where the carrying values
exceed the estimated recoverable amount, the assets are
written down to their recoverable amount. The recovera-
ble amount of tangible assets is the greater of fair value
less costs to sell and value in use. In assessing value in use,
the estimated future cash flows are discounted to their
present value using a pre-tax discount rate that reflects
current market assessments of the time value of money
and the risks specific to the asset. Impairment losses are
recognised as an expense in the income statement.
A reversal of an impairment loss is recognised as income
in the income statement. The increased carrying amount
of the asset due to a reversal of an impairment loss cannot
exceed the carrying amount that would have been
determined (net of depreciation) had no impairment loss
been recognised. After the recognition of an impairment
loss or a reversal of an impairment loss, the depreciation
charge for the asset is adjusted in future periods to allo-
cate the asset’s revised carrying amount on a systematic
basis over its remaining useful life.
GOODWILL
Goodwill is stated at cost less any accumulated
impairment losses. The cost basis at 1 January 2004
of goodwill purchased prior to 1 January 2004, date
of transition to IFRS, is determined as the carrying
amount under Belgian GAAP at 1 January 2004,
adjusted for impairment.
The cost basis of goodwill purchased subsequent to
1 January 2004, date of transition to IFRS, represents the
excess of the cost of the acquisition over the acquired
interest in the net fair value of identifiable assets, liabilities
and contingent liabilities of the acquiree at the date of
acquisition.
When the acquisition agreement provides for an
adjustment to the purchase consideration contingent
on one or more future events (earn-out arrangements),
the amount of the adjustment is included in the cost
basis of the goodwill and a provision is recognised if the
adjustment is probable and the amount can be measured
reliably. When a contingency affecting the amount of the
F INANCIAL OVERVIEW IFRS 75
purchase consideration is resolved subsequent to the date of
the acquisition, so that payment of the amount is probable
and a reliable estimate of the amount can be made, the cost
basis of goodwill is adjusted and a provision recognised.
Goodwill is allocated to cash generating units, which
represent the lowest level at which management monitors
the return on investment in assets that include the good-
will. A cash-generating unit can in no way be larger than a
business segment. A cash-generating unit to which good-
will has been allocated is tested for impairment annually,
and whenever there is an indication that it may be impai-
red (i.e. triggering event), by comparing its carrying
amount, including the goodwill, with its recoverable
amount. The recoverable amount of a cash-generating
unit is the higher of its net selling price and value in use.
The net selling price is defined as the amount obtainable
from the sale of the cash-generating unit in an arm’s
length transaction between knowledgeable, willing par-
ties, after deducting any direct disposal costs. The value in
use is the present value of estimated future cash flows
(discounted cash flows) expected to arise from continuing
use of the cash-generating unit and from its disposal at
the end of its useful life. If the recoverable amount of the
unit exceeds its carrying amount, the unit and the good-
will allocated to that unit are regarded as not impaired. If
the carrying amount of the unit exceeds its recoverable
amount, it is determined whether the goodwill allocated
to that unit is impaired, by comparing the implied value of
the goodwill with its carrying amount. The implied value
of goodwill is the excess of the recoverable amount of the
cash-generating unit to which the goodwill has been
allocated over the net fair value of the identifiable assets,
liabilities and contingent liabilities that would be recogni-
sed if that cash-generating unit would have been acquired
in a business combination at the date of the impairment
test. Any excess of the carrying amount of goodwill over
its implied value is recognised immediately in the income
statement as an impairment loss. Any remaining excess of
the carrying amount of the unit over its recoverable
amount is recognised in the income statement as an
impairment loss to be allocated to the other assets of the
unit on a pro-rata basis based on the carrying amount of
each asset in the unit. An impairment loss recognised for
goodwill cannot be reversed in a subsequent period.
INTANGIBLE ASSETS
Intangible assets (primarily computer software) are
recognised if, and only if:
(i) the asset is identifiable;
(ii) the group controls the assets;
(iii) it is probable that future economic benefits that are
attributable to the asset will flow to the entity;
(iv) the cost of the asset can be measured reliably.
Intangible assets are stated at cost less any accumulated
amortisation and any accumulated impairment losses.
Intangible assets acquired separately from a business are
capitalised at cost. Intangible assets acquired as part of
an acquisition of a business are capitalised separately
from goodwill if the fair value can be measured reliably
on initial recognition.
The cost of internally generated software for internal use
will only be capitalised to the extent it arises from the
development phase of an internal project and all of the
following can be demonstrated:
(i) the technical feasibility of completing the project,
(ii) the intention to complete the project and to use
the asset,
(iii) the ability to use the asset,
(iv) how the asset will generate probable future
economic benefits,
(v) the availability of adequate technical, financial and
other resources to complete the development and to
use the asset, and
(vi) the ability to measure the expenditure attributable to
the asset during its development reliably.
The cost of internally generated software for internal use
includes, if applicable:
(i) expenditure on materials and services used or
consumed in generating the asset,
(ii) the salaries, wages and other employment-related
costs of personnel directly engaged in generating
the asset,
(iii) any expenditure that is directly attributable to
generating the asset.
Intangible assets with a finite useful life are amortised
on a straight-line basis over their useful economic life,

76 F INANCIAL OVERVIEW IFRS
which is determined at 4 years for software. Amortisation
starts when the asset is available for use. The amortisation
period is reviewed at each financial year-end.
The carrying values of intangible assets are reviewed for
impairment when events or changes in circumstances indi-
cate that the carrying value may not be recoverable.
Intangible assets with an indefinite useful life must be
reviewed for impairment at every year-end. When the
carrying values exceed the estimated recoverable
amount, the assets are written down to their recoverable
amount. The recoverable amount of intangible assets is
the greater of net selling price and value in use.
In assessing value in use, the estimated future cash
flows are discounted to their present value using a
pre-tax discount rate that reflects current market
assessments of the time value of money and the risks
specific to the asset. Impairment losses are recognised
as an expense in the income statement. A reversal of an
impairment loss is recognised as income in the income
statement. The increased carrying amount of the asset
due to a reversal of an impairment loss cannot exceed
the carrying amount that would have been determined
(net of amortisation) had no impairment loss been
recognised. After the recognition of an impairment
loss, the amortisation charge for the asset is adjusted
in future periods to allocate the asset’s revised carrying
amount on a systematic basis over its remaining useful life.
NON-CURRENT FINANCIAL ASSETS
Non-current financial assets (primarily lease guarantees
and leasing rights) that do not have a fixed maturity
are measured at cost. Those that do have a fixed matu-
rity are measured at amortised cost using the effective
interest rate method. In case of guarantees in connec-
tion with rental agreements, any discount will be
deferred and charged to income as rental expense
over the term of the rental agreement. Non-current
financial assets are subject to review for impairment.
If it is probable that not all amounts due (principal
and interest) will be collected according to the contrac-
tual terms, an impairment loss is recognised and inclu-
ded in the net result for the period. The amount of the
loss is the difference between the asset’s carrying
amount and its recoverable amount, being the present
value of expected future cash flows discounted at
the asset’s original effective interest rate. At each
balance sheet date it is assessed whether there is any
objective evidence that a financial asset may be impai-
red. If any such evidence exists, the recoverable amount
is estimated.
INVENTORIES
Inventories are valued at the lower of cost and net
realisable value. Cost is calculated using the weighted
average method. Net realisable value represents the
estimated selling price.
TRADE AND OTHER RECEIVABLES
Trade receivables are recognised and carried at original invoice
amount less an allowance for any uncollectable amounts.
Individual allowances for uncollectable amounts are recor-
ded based on an aging analysis:
• first 6 months overdue: no write-offs, unless bankruptcy
is involved or a credit note has to be drawn up;
• between 6 and 12 months overdue: write-offs have to
be evaluated on an individualised basis;
• overdue by more than 12 months: 100% has to be
written off.
Payments made after the end of the reporting date up
to and including the time of audit should be taken into
account when setting up these write-offs. Exceptions with
respect to this valuation rule can occur only in cases with
extremely specific documentation.
The part for which no individual write-off has been asses-
sed is subject to a collective impairment, based on histori-
cal data over the last 3 years.
CASH AND CASH EQUIVALENTS
Cash and cash equivalents comprise cash at bank and in
hand and short-term deposits with an original maturity of
three months or less.
DEBTS
All debts are initially recorded at cost, being the fair
value of the consideration received net of issue costs
associated with the debt. After initial recognition, debts
are subsequently measured at amortised cost using the
F INANCIAL OVERVIEW IFRS 77
effective interest rate method. Amortised cost is calculated
by taking into account any issue costs, and any discount,
premium or settlement. Gains and losses are recognised in
net profit or loss when the liabilities are derecognised or
impaired, as well as through the amortisation process.
PROVISIONS
Provisions are recognised when (i) the group has a present
obligation (legal or constructive) as a result of a past
event, (ii) it is probable that an outflow of resources
embodying economic benefits will be required to settle
the obligation, and (iii) a reliable estimate can be made of
the amount of the obligation.
PENSION BENEFITS
The group operates several defined contributions and
defined benefit pension schemes.
For a defined contribution plan, the contribution payable
to a plan in exchange for services rendered by eligible
employees during a period is recognised as a period
expense as the services are rendered.
The cost of providing benefits under a defined benefit
plan is determined separately for each plan using the
projected unit credit actuarial valuation method. Actuarial
gains and losses are recognised as income or expense
when the cumulative unrecognised actuarial gains or
losses for each individual plan exceed 10% of the higher
of the defined benefit obligation and the fair value of plan
assets. These gains or losses are recognised over the
expected average remaining working lives of the
employees participating in the plans.
EMPLOYEE SHARE INCENTIVE PLANS
The group has employee warrant and share option plans.
The employee services received are measured at the fair
value of the warrants and share options granted and
recognised as an expense in the income statement when
they are rendered during the vesting period.
LEASES
Leases where the lessor retains substantially all the risks
and benefits of ownership of the asset are classified as
operating leases. Operating lease payments are recogni-
sed as an expense in the income statement on a straight-
line basis over the lease term.
Finance leases, which transfer to the group all the risks
and benefits incidental to ownership of the leased item,
are capitalised at the inception of the lease at the fair
value of the leased property or, if lower, at the present
value of the minimum lease payments. Lease payments
are apportioned between the finance charges and
reduction of the lease liability so as to achieve a constant
rate of interest on the remaining balance of the liability.
Finance charges are charged directly against income.
Capitalised leased assets are depreciated over the shorter
of the estimated useful life of the asset or the lease term.
The group enters into sale and leaseback transactions
involving the sale of office buildings and IT equipment and
the leasing back of the same assets. When these lease-
backs are operating leases, any profit or loss arising from
these transactions is recognised immediately in the
income statement. When these leasebacks are finance
leases, any profit or loss arising from these transactions is
deferred and amortised over the lease term.
DERIVATIVE FINANCIAL INSTRUMENTS
The group uses interest rate swaps to hedge its risks
associated with interest rate fluctuations on its debt.
Such interest rate swaps are stated at fair value. For the
purposes of hedge accounting, hedges are classified as
either fair value hedges where they hedge the exposure to
changes in the fair value of fixed rate debt, or cash flow
hedges where they hedge exposure to variability in cash
flows associated with floating rate debt.
In relation to fair value hedges that meet the conditions
for special hedge accounting, any gain or loss from
remeasuring the swap at fair value is recognised
immediately in the income statement. Any gain or loss on
the hedged debt attributable to the hedged interest rate
risk is adjusted against the carrying amount of the debt
and recognised in the income statement. In relation to
cash flow hedges that meet the conditions for special
hedge accounting, the portion of the gain or loss on the
swap that is determined to be an effective hedge is
recognised directly in equity. These gains and losses
recognised in equity are transferred to the income
78 F INANCIAL OVERVIEW IFRS
statement over the lifetime of the debt pro-rata the
amortisation of the swap. The ineffective portion of the
hedge is recognised immediately in profit or loss. Hedge
accounting is discontinued when the swap expires or is
sold or terminated, or when the hedge no longer meets
the criteria for qualification for hedge accounting. In the
case of a fair value hedge, the remaining adjustment to
the carrying amount of the debt is amortised to the
income statement over the remaining lifetime of the debt.
In the case of a cash flow hedge, the remaining cumula-
tive gain or loss on the swap recognised in equity is
transferred to the income statement over the remaining
lifetime of the debt.
For derivatives that do not qualify for special hedge
accounting, any gains or losses arising from changes in
fair value are taken directly to net profit or loss for the
period.
SHAREHOLDERS’ EQUITY
The net proceeds from the issue of equity shares are
credited to shareholders’ equity. The net proceeds are
defined as the fair value of the consideration received,
net of the incremental external costs directly attributable
to the equity transaction. Own shares are deducted from
equity.

79

80 F INANCIAL OVERVIEW
StatutoryCondensed statutory annual accounts
The Certified Auditor has given full approval to the statutory annual accounts for the financial year 2004. The integral
annual accounts, including the Board of Directors’ report on the financial year of 2004 and the Auditor’s Report, will
be deposited at the National Bank of Belgium and are available on request at the company’s registered office or via the
website www.solvus.com.
BALANCE SHEET AFTER PROFIT DISTRIBUTION
Assets
In euro x 1,000 2004 2003 2002
Fixed assets 407,783 351,906 372,786
I. Formation costs 263 527 1,332
II. Intangible assets 337 511 684
III. Tangible assets 157 391 373
IV. Financial assets 407,026 350,477 370,397
A. Affiliated companies 407,026 350,477 370,397
1. Shares 362,757 296,477 320,397
2. Amounts receivable 44,269 54,000 50,000
Current assets 14,516 49,899 20,546
V. Amounts receivable after one year - - -
VII. Amounts receivable within one year 12,004 47,199 13,417
VIII. Investments 2,388 518 363
A. Own shares 2,388 518 363
IX. Cash at bank and in hand 106 260 6,623
X. Deferred charges and accrued income 18 1,922 144
Total assets 422,299 401,805 393,332
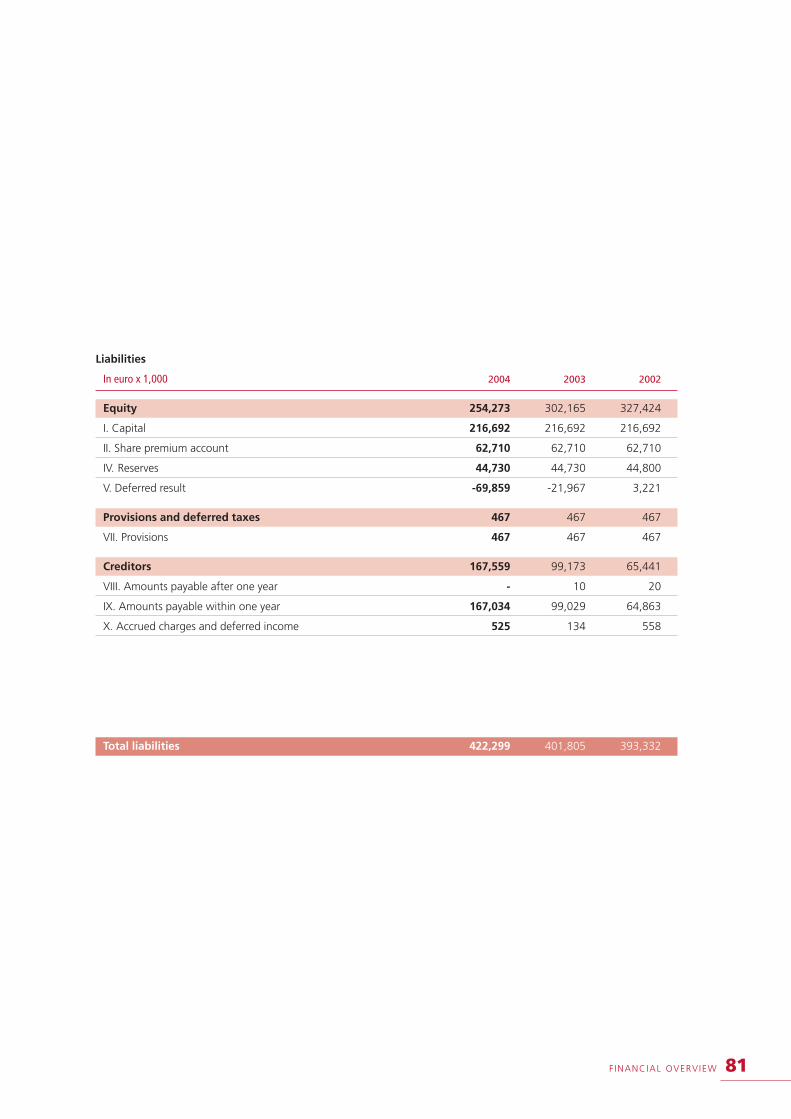
F INANCIAL OVERVIEW 81
Liabilities
In euro x 1,000 2004 2003 2002
Equity 254,273 302,165 327,424
I. Capital 216,692 216,692 216,692
II. Share premium account 62,710 62,710 62,710
IV. Reserves 44,730 44,730 44,800
V. Deferred result -69,859 -21,967 3,221
Provisions and deferred taxes 467 467 467
VII. Provisions 467 467 467
Creditors 167,559 99,173 65,441
VIII. Amounts payable after one year - 10 20
IX. Amounts payable within one year 167,034 99,029 64,863
X. Accrued charges and deferred income 525 134 558
Total liabilities 422,299 401,805 393,332

82 F INANCIAL OVERVIEW
ISSUES OF THE GROUP UNDER GUARANTEE
OF SOLVUS NV
Within the context of the takeover of 94.15% of the
shares in Bureau van Dijk Computer Services NV, Solvus
International NV issued a debenture loan to the value of
68.9 million euro with a coupon of 6% and for a duration
of 5 years. The global certificate represents a bearer global
certificate of 2,704,144 debentures with a nominal value
of 25.5 euro each. Solvus NV guarantees this debenture
loan unconditionally and irrevocably.
In addition, Solvus NV, Solvus International NV and Creyf's NV
can collect jointly a maximum of 94 million euro under their
commercial paper programme. The total debt collected under
this programme also comes under the unconditional and irre-
vocable guarantee of Solvus NV. Within the context of the
commercial paper programme, the aforementioned companies
can appeal to a number of back-up lines at the issuing banks
(in the event that not enough commercial paper was placed)
up to a maximum sum of 50 million euro. The total debt inclu-
ded within the context of this back-up line also comes under
the unconditional and irrevocable guarantee of Solvus NV.
INCOME STATEMENT
In euro x 1,000 2004 2003 2002
I. Operating income 6,480 6,333 6,546
II. Operating charges -5,209 -6,190 -6,644
III. Operating result 1,271 143 -98
IV. Financial income 16,722 15,170 9,742
V. Financial charges -4,498 -4,925 -5,070
VI. Result on ordinary activities before taxes 13,495 10,388 4,573
VII. Extraordinary income - 4 48,104
VIII. Extraordinary charges -61,388 -35,641 -35,653
IX. Result for financial period before taxes -47,893 -25,249 17,025
X. Income taxes 1 -9 -2
XI. Result for financial period -47,892 -25,258 17,023
XIII. Result for financial period to be distributed -47,892 -25,258 17,023
EXPLANATORY NOTES ON EXTRAORDINARY CHARGES AND INCOME
In euro x 1,000
Extraordinary charges -61,388
Breakdown of the most important sums:
Cancellation of debt Solvus Nederland BV -50,000
Impairment of financial fixed assets - Bureau van Dijk Computer Services NV -10,840

F INANCIAL OVERVIEW 83
VIII. STATEMENT OF CAPITAL
Amount (in euro x 1,000) Number of shares
A. Capital
1. Issued capital
At the end of the preceding period 216,692 25,180,691
At the end of the period 216,692 25,180,691
2. Structure of the capital
2.1. Share categories
• Ordinary shares 88,744 10,312,500
• VVPR shares 2,577 299,440
• Ordinary shares with VVPR strip sheet 125,371 14,568,751
2.2. Registered and bearer shares
• Registered 10,520,504
• Bearer 14,660,187
C. Own shares 2,388 185,129
E. Non-issued authorised capital 215,866
XVIII. RELATIONS WITH AFFILIATED COMPANIES AND COMPANIES WITH WHICH A PARTICIPATION
RELATIONSHIP EXISTS
In euro x 1,000 2004 2003
Receivables: • Subordinated - -
• Others 44,269 54,000
This relates to a loan granted to Beaver ITServices (37.2 million euro), to Creyf's Trabajo Temporal ETT SA
(6.5 million euro) and to Creyf's AG (0.6 million euro).

84 F INANCIAL OVERVIEW
SUMMARY OF THE VALUATION RULES
Formation expenses
Costs that correspond to the definition given to formation
expenses in the Royal Decree of 30 January 2001 are
capitalised at purchase price in such cases as they arise.
They are written off for depreciation on a straight-line
basis over a five-year period.
Intangible assets
Costs for research and development, franchises, patents,
licences, goodwill, certificates, trademarks and other
items, acquired from third parties, are recorded as assets
at their purchase cost, including the costs associated with
them. They are written off on a straight-line basis over a
five-year period.
Tangible assets
Tangible fixed assets are valued at purchase cost.
Depreciation is entered annually as follows:
Administrative or commercial buildings 3%
Installations, machines and equipment 20%
Computer equipment 20%
Vehicles and rolling stock 20%
Office furniture 10%
Machines subject to leasing contracts 20%
Leased vehicles and rolling stock 20%
Illuminated signs 20%
Improvements to rented premises 20%
The rate of depreciation is applied on a straight-line basis.
The first depreciation is not adjusted on a pro rata tempo-
ris basis. The Board of Directors may proceed to revalue
certain asset components if this concerns assured and
lasting increased value compared to the purchase cost.
Capital gains recorded as a result of such decisions are
entered directly under the relevant item on the liabilities
side as revaluation surplus.
There was no revaluation of tangible fixed assets during
the course of the financial year.
Financial assets
SHARE
The financial fixed assets are valued at purchase cost or
contribution value. Associated costs are capitalised.
At the end of the financial year all participating interests
are valued individually taking into account their nature
and characteristics.
The Board of Directors relies on the following principles
for the valuation of participating interests:
• stock market value: where listed companies are
concerned;
• equity value: net assets or intrinsic value;
• return value: value expressed as a factor of
the net return;
• open market value of recently sold securities or
contribution value.
In principle, carrying values are not adjusted when estima-
ted values are higher. However, in accordance with the
Royal Decree of 30 January 2001, a revaluation can be
recorded if the Board of Directors regards the capital gain
as assured and lasting. If a lasting loss in value is establis-
hed for a participating interest, a write-off will be recor-
ded for the amount of the loss in value.
The lasting nature of the loss in value is assessed as
follows:
• for listed securities: if the security stands at over
30% less at the close of the financial year;
• unlisted securities: if the value is lower than the book
value and if no improvement can be expected in the
short term.
Write-back of amounts written off is recorded for
the sum of the write-offs previously recorded when
the valuation at the end of the financial year exceeds
the previous valuation and when it is considered to be
lasting in nature.
F INANCIAL OVERVIEW 85
RECEIVABLES
Receivables from affiliated companies at more than one
year, and intended to make a lasting contribution to the
development of the company concerned, are recorded at
their nominal value or purchase cost. The same
valuation rules are applied to increases or losses in value
as are applied to the underlying participating interests.
GUARANTEES
Guarantees and cash secureties are recorded at their
nominal value.
Receivables at more than one year
These receivables are valued at their nominal value.
The assets contain no long-term receivables yielding no
interest or abnormally low interest. The same valuation
rules are applied to these as to the receivables from
affiliated companies.
Receivables within one year
These receivables are valued at their nominal value.
Write-offs are applied to them in the following cases:
• the first 6 months overdue: no write-offs, unless bank-
ruptcy is involved or a credit note has to be drawn up;
• between 6 and 12 months overdue: write-offs on an
individualised basis;
• overdue by more than 12 months: 100% write-off.
Payments made after the end-of-year up to and including
the time of audit should be taken into account when
arranging these write-offs. Departures from the new rules
can occur only through a decision made at group level
and in cases with very specific documentation.
Investments
Investments are valued at their nominal value or, in the
case of listed stock, at market price if this is lower.
Cash at bank and in hand
Valuation is made at nominal value. Foreign currencies are
valued at the rate applicable on the balance sheet date.
Write-downs are recorded if the open market value on
the balance sheet date is lower than the purchase cost.
Deferred charges and accrued incomeAmounts recorded in these accounts relating to the
closure of the financial year are valued at nominal value.
Provisions for liabilities and charges
These are expressed at nominal value. At the end of each
financial year the Board of Directors will examine the
provisions that must be set up to cover the risk of possible
losses that arose during the course of the financial year.
The provisions relating to previous financial years are
regularly reviewed.
Amounts payable after one year
The amounts payable are valued at nominal value.
The liabilities do not contain any long-term debts not
accruing interest or with abnormally low interest.
Amounts payable within one year
The debts are valued at nominal value. Where necessary
provisions have been created for those debts relating to
taxation, remuneration and social security charges.
Accrued charges and deferred income
Amounts recorded in these accounts relate to the closure
of the financial year and are valued at nominal value.
Income statement
Both income and charges are recorded at nominal value.
Results arising from the conversion of foreign currency
and exchange operations are recorded as financial income
or charges, unless these are specifically associated with
another item in the income statement.

86
AddressesAddresses of the main operating companies
Solvus Resource Group
Frankrijklei 101
2000 Antwerpen
Belgium
+ 32 3 220 78 94
International Account
Management
Ann Cappoen
Frankrijklei 101
2000 Antwerpen
Belgium
+ 32 3 220 78 85
Solvus International
(coördinatiecentrum,
recognition until 2010)
Frankrijklei 101
2000 Antwerpen
Belgium
+ 32 3 220 78 45
AUSTRIA
Accea
Marc Frustié
Mariahilferstrasse 88a
1070 Wien
+ 43 1 524 55 010
Creyf’s
Marc Frustié
Mariahilferstrasse 88a
1070 Wien
+ 43 1 524 55 010
BELGIUM
ABI Interim
Vincianne Delvigne
Mireille Vidal
Brouckèreplein 9-13
1000 Brussel
+ 32 2 511 07 72
Accea
Luc Tavernier
Frankrijklei 101
2000 Antwerpen
+ 32 3 287 60 60
Beaver ITServices
Filip Vanderbeken
Franklin Rooseveltplaats
12/10
2060 Antwerpen
+ 32 3 231 94 84
Bureau van Dijk
Computer Services
Filip Vanderbeken
Terhulpsesteenweg 187
1170 Brussel
+ 32 2 661 04 00
Bureau van Dijk
Hosting Services
Bernard Ypersiel
Frankrijklei 101
2000 Antwerpen
+ 32 3 220 79 60
Carela
Geert Meesschaert
Leuvensesteenweg 775
1140 Brussel
+ 32 2 705 22 08
Creyf’s
Johan Crijns
Frankrijklei 101
2000 Antwerpen
+ 32 3 220 78 11
Express Medical
Tom Van de Woestijne
Boulevard de France 7
1420 Braine-l’Alleud
+ 32 2 386 01 60
Financial Forces
Steve Rousseau
Brouckèreplein 9-13
1000 Brussel
+ 32 2 217 71 41
HR Forces
Vera Meersman
Frankrijklei 101
2000 Antwerpen
+ 32 3 220 79 79
Innotiv
Marc Boriau
Rijnkaai 37
2000 Antwerpen
+ 32 3 234 13 24
Legal Forces
Dieter Honoré
Frankrijklei 101
2000 Antwerpen
+ 32 496 43 72 30
Receptel
Vincianne Delvigne
Mireille Vidal
Brouckèreplein 9-13
1000 Brussel
+ 32 2 514 15 40
FRANCE
Accea
Marc Frustié
114, rue Galliéni
92100 Boulogne-
Billancourt
+ 33 1 46 99 60 11
Carela
Geert Meesschaert
114, rue Galliéni
92100 Boulogne-
Billancourt
+ 33 1 46 99 14 14
Creyf’s
Marc Frustié
114, rue Galliéni
92100 Boulogne-
Billancourt
+ 33 1 46 99 14 00
GERMANY
Creyf’s
Peter Möllersmann
Landsberger strasse 312
80689 München
+ 49 89 56827-135

87
ITALY
Creyf’s
Salvatore Mangione
Via G. Murat 23
20159 Milano
+ 39 02 69 77 60 01
LUXEMBOURG
Accea
Daniel Oudrar
62, Rue Charles Martel
2134 Luxembourg
+ 352 26 97 64 94 20
Bureau van Dijk
Computer Services
Filip Vanderbeken
65, Avenue de la Gare
1611 Luxembourg
+ 352 29 56 57
Carela
Geert Meesschaert
62, Rue Charles Martel
2134 Luxembourg
+ 32 478 29 39 84
Creyf's
Daniel Oudrar
51-53, Rue de Merl
2146 Luxembourg
+ 352 97 64 94 20
THE NETHERLANDS
Accea
Marnix Lamberts
Strawinskylaan 1533
1077 XX Amsterdam
+ 31 20 697 09 17
Beaver ITServices
Filip Vanderbeken
Overschiestraat 184
1062 XK Amsterdam
+ 31 20 388 03 13
Carela
Ramses Serno
Adriaen van Ostadelaan
140
3583 AM Utrecht
+ 31 30 254 37 11
Content
Mirjam Sijmons
Bezuidenhoutseweg 273
2594 AN Den Haag
+ 31 70 349 16 19
Creyf's
Bram van der Wal
Rompertsebaan 50
5231 GT ’s Hertogenbosch
+ 31 73 646 02 60
Financial Forces
Marnix Lamberts
Bezuidenhoutseweg 273
2594 AN Den Haag
+31 70 349 17 02
Innotiv
Han Huisman
Het Rond 18
2711 BW Zoetermeer
+ 31 79 343 83 03
StarJob
Dorothé Schiks
Reaal 5-c
2353 TK Leiderdorp
+ 31 71 541 42 41
POLAND
Accea
Maurice Delbar
Ul. Grzybowska 77
00-844 Warszawa
+ 48 22 661 50 05
Creyf’s
Maurice Delbar
Michal Lasocki
Ul. Grzybowska 77
00-844 Warszawa
+ 48 22 661 50 05
SPAIN
Accea
Antonio Arroyo i
Planaguma
Carretera de Sant Joan de
les Abadesses 100
17800 Olot (Girona)
+ 34 972 271 016
Branca
Josep Velategui
Carretera de Sant Joan de
les Abadesses 100
17800 Olot (Girona)
+ 34 972 271 016
Creyf’s
Antonio Arroyo i
Planaguma
Carretera de Sant Joan de
les Abadesses 100
17800 Olot (Girona)
+ 34 972 271 016
SWITZERLAND
Accea
Louis Dittli
Rue du Mont Blanc 7
1211 Genève
+ 41 22 715 48 70
Creyf’s
Louis Dittli
Rue du Mont Blanc 7
1211 Genève
+ 41 22 715 48 70
88
Het jaarverslag is eveneens beschikbaar in het Nederlands.
Le rapport annuel est également disponible en français.
The annual report can be downloaded from the website
www.solvus.com with versions available in Dutch, French
and English. You can register on the website to receive
press releases by e-mail and to have the annual report
mailed to you.
The agreement between the Dutch and French version,
which are the official versions in Belgium, is verified by
Solvus Resource Group, which declares to be responsible
for this. The English version is a translation of the Dutch
and French versions.
Solvus Resource Group - Annual Report 2004
Design, layout and production:
Minale Design Strategy, Edison
Photo credits: Katrien Verbeke
Image banks: Zefa, Photonica, Corbis, Getty Images,
Photo Alto
Translation: E-globalcom.net
Printed in Belgium: Baillien-Maris
Responsible publisher: Véronique Hellemans, Solvus
Resource Group, Frankrijklei 101, 2000 Antwerpen,
Belgium
www.solvus.com


DEFINITIONS
Cash flow please refer to the cash flow statement onpage 48 for the component parts
Current assets total assets - fixed assets - amounts receivable > 1 year
EBIT operating result - amortisation of positiveconsolidation differences
EBITA operating result
EBITDA operating result before ordinary deprecia-tion and amortisation
EBTA result on ordinary activities before amorti-sation of positive consolidation differencesand before tax
EPS net result (part of the group) per share
Fractional capital / number of sharesvalue per share
Gearing net financial debt / equity
Gross margin total operating income - direct costs
Idle time freely available project staff who are notactively employed for a client
IFRS International Financial Reporting Standards
Intrinsic value equity / number of shares
Net financial financial costs + amortisation on positive costs consolidation differences – financial
income
Net financial long-term financial debt + short-term debt financial debt - investments - cash at bank
and in hand
Organic excluding the activities of Bureau van Dijk Computer Services (1-6/2004) and Schoevers (1/2004)
Price / earnings share price at 31 December / result onratio ordinary activities per share
ROCE EBITA / total assets - short-term operatingdebt
ROE EBITA / equity
SG&A indirect costs
Working capital limited current assets (current assets –amounts payable at more than one year)less the accrued charges and deferred income and the amounts payable withinone year

FOR MORE INFORMATION, CONTACT
Véronique Hellemans
VP Corporate Communication & Marketing
Tel.: + 32 3 220 79 06
Fax: + 32 3 213 33 39
Katrien Verbeke
Corporate Communication & Marketing Assistant
Tel.: + 32 3 220 78 60
Fax: + 32 3 213 33 39

Frankrijklei 101 BE 2000 Antwerpen Tel. +32 3 220 78 94 Fax +32 3 220 78 80 www.solvus.com