human factor analysis inside a peculiar job environment at the gran ... · the scl-90-r evaluates a...
TRANSCRIPT

F. Borghini, et al., Int. J. of Safety and Security Eng., Vol. 8, No. 3 (2018) 390–405
© 2018 WIT Press, www.witpress.comISSN: 2041-9031 (paper format), ISSN: 2041-904X (online), http://www.witpress.com/journalsDOI: 10.2495/SAFE-V8-N3-390-405
HUMAN FACTOR ANALYSIS INSIDE A PECULIAR JOB ENVIRONMENT AT THE GRAN SASSO MOUNTAIN
UNDERGROUND LABORATORY OF ITALIAN NATIONAL INSTITUTE FOR NUCLEAR PHYSICS
F. BORGHINI1, F. GARZIA1,2,3, M. LOMBARDI1, M. METE1, R. PERRUZZA4 & R. TARTAGLIA4
1SSEG – Safety and Security Engineering Group – DICMA, SAPIENZA – University of Rome, Italy.2Wessex Institute of Technology, UK.
3European Academy of Sciences and Arts, Austria.4PPS Department, Gran Sasso National Laboratory, National Institute for Nuclear Physics, Italy.
ABSTRACTDue to the high social, economic and image costs associated with every single incident, the first in-depth studies on the importance of the Human Factor (HF) have been carried out since the 70s in the field of aviation, both military and civilian, and in the nuclear field. To date there are several method-ologies by which it is possible to estimate the human error probability. However, all these techniques have the disadvantage of not being able to analyse the unconscious component involved. Therefore, the aim of this research is to integrate into the analysis of the human factor some psychodynamic inves-tigation techniques, capable, indeed, to stress the unconscious component of potential sub-threshold disorders and further assess what does it mean to work in a particular working environment such as the Gran Sasso mountain underground laboratories (LNGS or Gran Sasso National Laboratory) of Italian National Institute for Nuclear Physics (INFN).Keywords: dream activity, emergency management, human factor, occupational safety and security engineering, psychodynamic, underground laboratory, work related stress.
1 INTRODUCTIONInterventions for reducing risks and improving the reliability of the plants have certainly led to a significant evolution of the health and safety of the workplace [1–4].
The technical nature of these improvements does not allow the effect acting on the primary cause of accidents: human error [5–9]. This is the reason why a greater focus on aspects con-cerning the human factor (Human Factor – HF) is now needed [10], laying the foundation for an evolution in the evaluation and management of risks. However, this evolution presents various problems:
• sometimes, the industry approach focuses more on the behavior of operators, human error and compliance procedures, neglecting the real human contribution and limiting the study of the root causes but are yet essential;
• companies are often marked by a strong technical background and rarely have expertise in organizational and human factors;
• there is still little referenced documentation designed to promote the transferring of scien-tific knowledge acquired to those who deal with safety (industrial, trade unionists, super-visory authorities, etc.).
Therefore, integrating human and organizational factors [11, 12] in the policies and activities of industrial safety requires the ability of using new knowledge belonging to social sciences (ergonomics, psychology, sociology, etc.).This knowledge must still be connected to opera-tional problems, in the particular case of our research, they included the emergency response

F. Borghini, et al., Int. J. of Safety and Security Eng., Vol. 8, No. 3 (2018) 391
of security guards (GPG) operating the security service within the Gran Sasso mountain underground laboratory of the Italian Institute for Nuclear Physics (LNGS- INFN).
In particular, it is important to point out the peculiarity of this service: the GPG in question, even during the night, is served in the underground with shifts envisaged by their national collective bargaining agreement: in this context, these activities are included in the list of assets classified as ‘particularly arduous’ by Italian law [13]. For this reason, it is of greater interest to assess what entails working in a so peculiar underground work environment, trying to propose management measures to improve the mental and physical health of workers.
The Gran Sasso National Laboratories (LNGS) are one of the experimental research centers belonging to the Italian National Institute for Nuclear Physics (INFN). A scheme of the LNGS is shown in Figs 1 and 2. The LNGS facility is made up of two main areas:
• external Operations Centre in Assergi, L’Aquila (Italy);
• underground Laboratories inside the Gran Sasso mountain.
Both of the areas are located in the heart of Gran Sasso and ‘Monti della Laga’ National Park. The underground laboratories, housing about 20 international experiments, are located under
Figure 1: Scheme of the Gran Sasso mountain underground laboratory of the Italian Institute for Nuclear Physics (LNGS- INFN).

392 F. Borghini, et al., Int. J. of Safety and Security Eng., Vol. 8, No. 3 (2018)
a rock layer of about 1,400 m of thickness, acting as a shield against cosmic radiation. The underground cavity is just in the middle of the Gran Sasso highway tunnels (a double-tunnel 10,500 meters long gallery). Moreover, LNGS are surrounded by a huge water reservoir. The research areas in which the laboratories operate or plan to operate are: the study of rare nuclear phenomena, the study of the most penetrating components of cosmic rays, neutrino physics and dark matter. LNGS consist of three experimental halls of about 100x20x20 m3 each: Hall A, Hall B, Hall C. The connection among the halls is achieved by other smaller galleries: Car tunnel, Truck tunnel, connecting tunnels.
Besides Health & Safety regulation in the workplace, LNGS are subjected to the European Directive Seveso III (2012/18/UE) (briefly Seveso in the following): they are classified as major accident hazard plants because of the presence of experiments using and storing sub-stantial amounts of substances classified as dangerous for the environment. In compliance with Seveso, LNGS have adopted a Safety Management System (SGS) implemented through 16 Procedures and Operating Instructions. Furthermore, LNGS have a specific Internal Emer-gency Plan (PEI) and a General Emergency Plan (including the emergency aspects connected to the complex surrounding environment).
Within the Gran Sasso National Laboratories, for the security and management of major accidents, an armed security service and firefighting service operate within.
The surveillance service requires the presence of 4 special security guards 24 hours per day and a guard on duty 12 hours on 24, for a total of 5 seats distributed among the Operations Centre in Assergi and the underground laboratories. Each GPG is in connection via radio and/or phone with the other employees of the security service and the staff of the LNGS. Further-more, GPG are all trained on safety and firefighting.
The firefighting service operates exclusively in the underground laboratories and involves checking and daily management of the technological and safety systems.
2 MATERIAL AND METHOD
2.1 The analysis of the human factor performed at LNGS
The attention was focused on the GPG serving in the laboratories. For the valence of the analysis carried out, a comparative sample has also been created. For this reason, in addition
Figure 2: Geographic localization of LNGS in Italy (left) and schematic view of LNGS (right).
F. Borghini, et al., Int. J. of Safety and Security Eng., Vol. 8, No. 3 (2018) 393
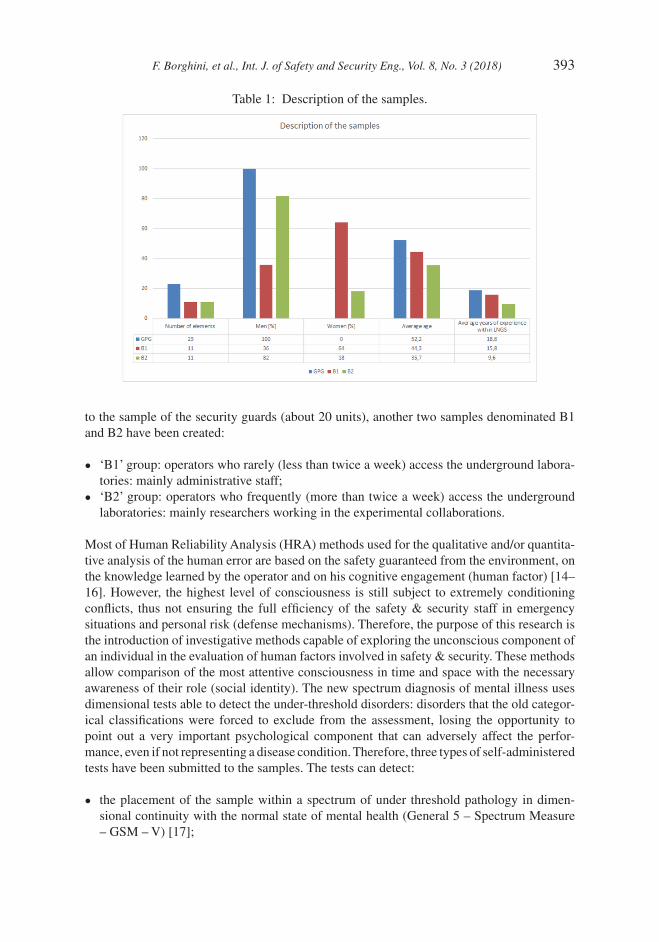
to the sample of the security guards (about 20 units), another two samples denominated B1 and B2 have been created:
• ‘B1’ group: operators who rarely (less than twice a week) access the underground labora-tories: mainly administrative staff;
• ‘B2’ group: operators who frequently (more than twice a week) access the underground laboratories: mainly researchers working in the experimental collaborations.
Most of Human Reliability Analysis (HRA) methods used for the qualitative and/or quantita-tive analysis of the human error are based on the safety guaranteed from the environment, on the knowledge learned by the operator and on his cognitive engagement (human factor) [14–16]. However, the highest level of consciousness is still subject to extremely conditioning conflicts, thus not ensuring the full efficiency of the safety & security staff in emergency situations and personal risk (defense mechanisms). Therefore, the purpose of this research is the introduction of investigative methods capable of exploring the unconscious component of an individual in the evaluation of human factors involved in safety & security. These methods allow comparison of the most attentive consciousness in time and space with the necessary awareness of their role (social identity). The new spectrum diagnosis of mental illness uses dimensional tests able to detect the under-threshold disorders: disorders that the old categor-ical classifications were forced to exclude from the assessment, losing the opportunity to point out a very important psychological component that can adversely affect the perfor-mance, even if not representing a disease condition. Therefore, three types of self-administered tests have been submitted to the samples. The tests can detect:
• the placement of the sample within a spectrum of under threshold pathology in dimen-sional continuity with the normal state of mental health (General 5 – Spectrum Measure – GSM – V) [17];
Table 1: Description of the samples.
394 F. Borghini, et al., Int. J. of Safety and Security Eng., Vol. 8, No. 3 (2018)
• original test which assesses the oneiric stress (Oneiric Stress Test - TSO), a window on the unconscious closely correlated to actual work experience [18]. TSO has already been applied providing useful and interesting results [19]. Some operators have not filled the TSO correctly answering questions that, for their case, were still not relevant. The results were nevertheless considered (TSO ‘wrong’) and compared with the correct question-naires (TSO ‘right’) omitting the additional responses;
• the presence of complexly differentiated symptoms (Symptom Check List), with a focus on sleep disorders. The SCL-90-R evaluates a wide range of psychological problems and psychopathological symptoms, by measuring both the internalizing (depression, somatiza-tion, anxiety) as the externalizing (aggression, hostility, impulsivity) symptoms of psychi-atric patients and nonclinical subjects [20].
2.2 Processing and data analysis
After the phase of administration of the questionnaires, the results were entered into a spread-sheet to allow subsequent processing with Excel®, MATLAB® and IBM® Statistical Package for Social Science® (SPSS®).
Univariate analysis A first important moment of the data analysis is represented by the descriptive statistics (uni-variate) which, using one or more positions and variability indices (eg. mean, mode and relative frequencies), giving the possibility to synthesize all variables (also called ‘characters’) taken individually. Descriptive statistics offer an initial representation of the primary features of each variable and allow to identify more specific statistical techniques to be used for a later and deeper data analysis. Descriptive statistics have been performed using the SPSS®’s func-tion called ‘Descriptive’ from the menu ‘Analyze’, giving the possibility to calculate and report to a pre-set output the characteristics of each variable. Finally, using the values of kurtosis and skewness, the normality of each indices has been tested with the z-test [21].
Bivariate analysisThe identification and analysis of possible relations between the different variables was essential for the aim of this research. For this reason, a bivariate analysis has been required. The bivariate correlation and the simple linear regression are part of this type of analysis: with the first one, it is possible to analyze whether there is a relationship between two varia-bles (how and how much two variables vary together), while the second one can analyze the shape of the relationship between the two characters.
For the pairs of variables with both having a normal distribution, the Pearson product-mo-ment correlation coefficient has been calculated, but in cases where the normality was not met, the Spearman’s rho method has been preferred. The latter index has also the advantage of being less affected by the outliers and can also be used for limited size samples (7–30 pairs of values). The Spearman’s rho, however, requires the fulfillment of two conditions that are: monotonicity and qualitative or quantitative ordinal character type [22–24].
To determine the possible monotonicity in the relationship between two variables, scatter plots have been produced with MATLAB®. With these plots, two characters can be graphed, one in respect to the other, and it is possible to visually check whether or not monotonicity is present.
Both the correlation analysis and the simple linear regression have been performed with SPSS®. With SPSS® the two-tailed statistical for computing the statistical significance of

F. Borghini, et al., Int. J. of Safety and Security Eng., Vol. 8, No. 3 (2018) 395
the correlation coefficient or the Spearman’s rho have been also performed. The statistical significance of a result is the probability that the observed relation (between variables) or difference (between means) in a sample would occur by pure chance if no such relationship or differences existed in the population from which the sample was drawn. Significance is expressed as a decimal. A significant result is usually considered to exist where the p-value (or probability) is <0.05, meaning that the results obtained would occur by chance alone less than 5% or the time [25].
The index identified by a double star (**) have obtained a p-value less than 0.01, then there is a probability less of 1% that the results obtained are due to a chance. For variables marked by a single star (*), the p-value is less than 0.05.
The output of SPSS®, as further confirmation of the obtained values, has been compared with the same produced with MATLAB® using the command: [RHO, PVAL] = corr (X, Y, ‘name’, value).
The questionnaire is characterized by having all indices independent to each other, there-fore, to evaluate the relationship between the different characters, the simple linear regression was chosen: the only variable beyond which they may depend consists in the years of service inside the LNGS (‘Year LNGS’). Even for the linear regression analysis, the results obtained with SPSS® (coefficient β associated with the independent variable and the R-square) were compared with those obtained with MATLAB® thanks to the ‘Basic Fitting Tool’ and the procedure for calculating the R-square in the manual ‘MATLAB® - Data Analysis’. With SPSS® the ANOVA table has also been calculated to determine the statistical significance (using an F-test) of the method and, by means of the ‘adjusted R-square’, it was possible to estimate the Effect Size (ES) according to Cohen’s classification [25, 26]. The ES is used to measure a treatment’s effect. Unlike significance tests, this index is independent of sample size.
As a final check of the satisfactory fitting of the model to the actual data, we chose to use the Durbin-Watson test (D-W test) [27]. With this test, it’s possible to test the null hypothesis that the residuals from an ordinary least-squares regression are not auto correlated. The Durbin-Watson statistic ranges in value from 0 to 4. A value near 2 indicates non-autocorre-lation; a value tending to 0 indicates positive autocorrelation; a value tending to 4 indicates negative autocorrelation.
In parallel with the uni and bivariate analysis, both the t-test for independent samples and the one-way ANOVA (Analysis of Variance) have been performed.
The t-test is used to determine if there is a difference between the means of two groups with respect to a dependent variable of the continuous type (all the three questionnaires indi-ces are of this type). More specifically, the test helps in determining how likely this difference is also reflected in the entire population and not just between the observed samples (statisti-cally significance) [25]. Via the ANOVA analysis, it is then possible to extend the comparison of means to more than two groups.
Both tests have been conducted using the appropriate function of the statistical software SPSS®. The output produced by the program shows the difference between the means, the result of the confidence interval and the value of statistical significance (p-value).
3 RESULTSThe univariate analysis results for the three compared samples are presented. As it is possible to see from Table 2, in general the results obtained from all three groups are below the max-imum values (MAX column) and, except for a single index, all the values of those who work

396 F. Borghini, et al., Int. J. of Safety and Security Eng., Vol. 8, No. 3 (2018)
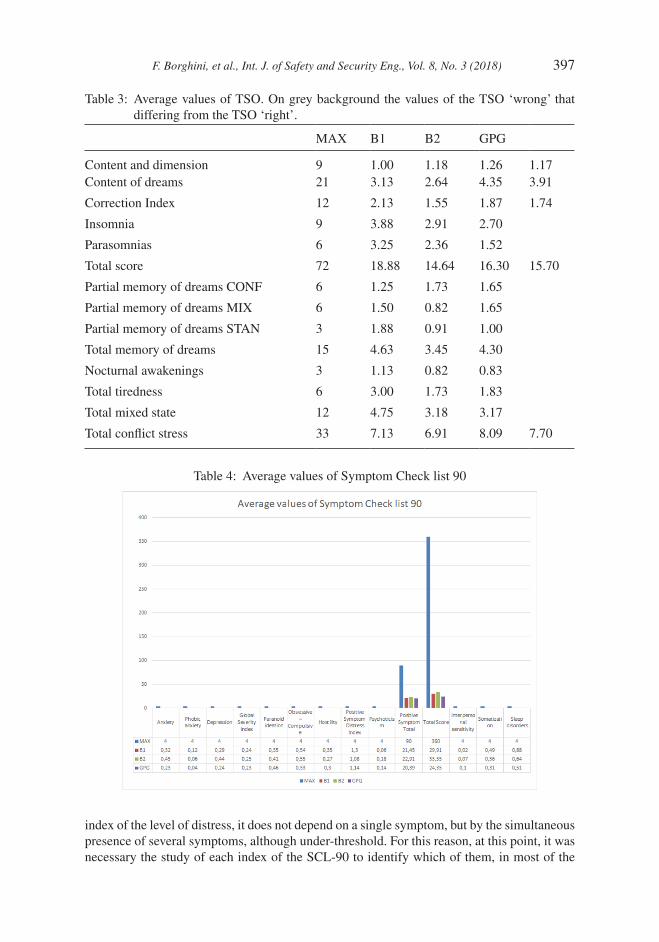
more frequently underground are minor compared to those who rarely access the under-ground laboratories.Predictably, some items of the TSO ‘wrong’ have a slightly higher value than the same TSO ‘right’ (Table 3). Subsequent analyses, however, have not been affected by these differences. Regarding the three global indices (Total tiredness, Total mixed state and Total Conflict Stress), the scores obtained from the sample B1, are often (2 cases out of 3) the highest.
The results of the SCL 90 (Table 4) show how the average values, for all the psychopathological symptoms, stand below the threshold of interest, which is generally set equal to 1. It is also interesting to observe how the GPG, for most of the indices, have the lowest average value.
These first descriptive statistics highlight that for many indices of all three questionnaires, the average values are lower for the security guards than the ones of the operators who belong to the two comparison groups (B1 and B2). More generally, the values for the two groups that most frequently work in underground (GPG and B2) are lower with respect to those who work predominantly outside (B1).
For each index, the correlation coefficient has been calculated and the analysis of normal-ity for the frequency distributions has been performed.
Since the independent variable (years of service in the Gran Sasso National Laboratories – Year LNGS) was normally distributed, for the indexes that obtained positive results in the normality tests, the Pearson correlation coefficient could be considered. For the remaining ones, the study of the scatter plots has been necessary to verify the presence or not of a monotonous trend and thus be able to decide if to use the Spearman’s Rho.
It is noteworthy as the correlation indices for Insomnia character of the TSO, for the GPG and for the ‘B2’ sample, have an opposite sign (Table 5). The correlation analysis also shows that for GPG there is a positive and significant correlation between the Positive Symptom Distress Index (PSDI) and years of service within the laboratories. Since the PSDI is a global
Table 2: Average values of GSM-V.
F. Borghini, et al., Int. J. of Safety and Security Eng., Vol. 8, No. 3 (2018) 397
Table 3: Average values of TSO. On grey background the values of the TSO ‘wrong’ that differing from the TSO ‘right’.
MAX B1 B2 GPG
Content and dimension 9 1.00 1.18 1.26 1.17Content of dreams 21 3.13 2.64 4.35 3.91
Correction Index 12 2.13 1.55 1.87 1.74
Insomnia 9 3.88 2.91 2.70
Parasomnias 6 3.25 2.36 1.52
Total score 72 18.88 14.64 16.30 15.70
Partial memory of dreams CONF 6 1.25 1.73 1.65
Partial memory of dreams MIX 6 1.50 0.82 1.65
Partial memory of dreams STAN 3 1.88 0.91 1.00
Total memory of dreams 15 4.63 3.45 4.30
Nocturnal awakenings 3 1.13 0.82 0.83
Total tiredness 6 3.00 1.73 1.83
Total mixed state 12 4.75 3.18 3.17
Total conflict stress 33 7.13 6.91 8.09 7.70
Table 4: Average values of Symptom Check list 90
index of the level of distress, it does not depend on a single symptom, but by the simultaneous presence of several symptoms, although under-threshold. For this reason, at this point, it was necessary the study of each index of the SCL-90 to identify which of them, in most of the

398 F. Borghini, et al., Int. J. of Safety and Security Eng., Vol. 8, No. 3 (2018)
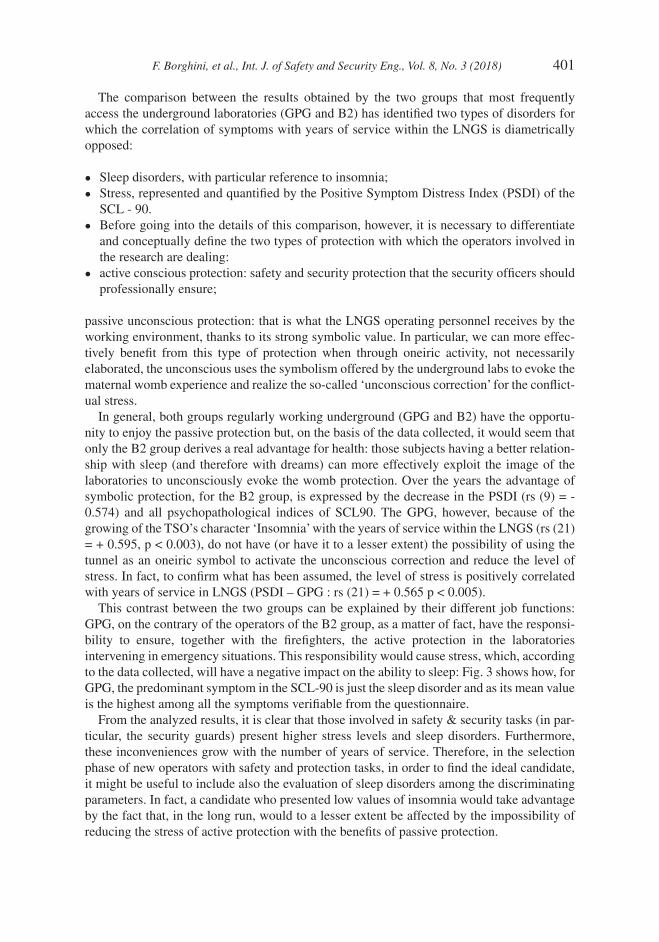
respondents, has had a greater influence on the stress level. Figure 3 shows all the symptoms encountered by the SCL-90 and, for each of them, indicates the number of times in which the result is among the first three with the highest value.
From Fig. 3 it is possible to see that the sleep disorders index for GPG is the one that more frequently got a high value (while remaining sub-threshold). This result also confirms the findings of the TSO, where, again for GPG, the Insomnia character is positively and signifi-cantly correlated with years of service within the Gran Sasso National Laboratories (‘Years LNGS’).
Always from the analysis of correlation, it is possible to note that, especially for the Spear-man’s rho, for sample ‘B2’ many of the indices of the questionnaires show a negative correlation with the variable ‘Years LNGS’. Apparently, many mental illnesses seem to decrease over time passed underground. The next simple linear regression analysis phase,
Figure 3: SCL90 - For each symptom is reported the frequency with which, for each GPG, is among the three higher value indices.
Table 5: Pearson (r) and Spearman’s (r) correlation indexes.
GPG B1 B2
r r r R r r
Ipomaniacal mood -0.5* -0.438* 0.027 -0.160 -0.359 -0.447Insomnia 0.595** 0.522* -0.068 -0.025 -0.676* -0.545
PSDI 0.565** 0.367 0.034 0.118 -0.574 -0.375
Sleep Disorders 0.412 0.194 -0.326 -0.168 -0.74** -0.653*

F. Borghini, et al., Int. J. of Safety and Security Eng., Vol. 8, No. 3 (2018) 399
useful for understanding how the independent variable will affect the variables considered as dependent, only covered the two groups that frequently access to the underground laborato-ries (GPG and B2).
The linear regression has been developed only for variables that got a significant two tailed tests for their correlation indexes. The results are available in the Tables 7 and 8. For both tables, the column ‘F’ indicates the value obtained of the Fisher distribution (F - test), while, the D-W column indicates the value obtained by the Durbin-Watson test.
For GPG, the models for the Hypomanic Humor (GSM - V) and the Insomnia (TSO) con-firm, statistically significant (p-value < 0.05), the correlation analysis results: there is a quite strong relationship between the years of service within the LNGS and these two indices.
Focusing on the R2 and ‘Adjusted R2’ values, it’s possible to note that the model calculated for the Insomnia index fits adequately the collected data, showing a high-level Effect Size (ES), while the PSDI and the Hypomanic mood’s ES is low-level and medium respectively. Finally, since all three indices have gotten a D-W test value close to 2 is not necessary to include other variables in the regression models.
Table 6: Test for normalcy.
GPG B1 B2
Ipomaniacal mood Yes Yes YesInsomnia NO Yes Yes
PSDI NO Yes Yes
Sleep disorders NO Yes Yes
Table 7: GPG – Simple linear regression results

400 F. Borghini, et al., Int. J. of Safety and Security Eng., Vol. 8, No. 3 (2018)
Regression analysis for sample B2 has produced models that fit well enough to real data since their respective adjusted R2 values are often higher than 0.2, which indicate an ES between the average and the highest level [28]. The Durbin-Watson test values indicate that for both models, the only independent variable (Year LNGS) is sufficient to explain the vari-ance of the actual data.
4 DISCUSSIONThe analysis of the results indicates that working underground in the Gran Sasso National Laboratories produces positive effects for health. This unexpected feature may be justified by the strong symbolic value by which this enclosed space, surrounded and saturated with water, is able to evoke the ancestral place where every human being has experienced the maximum perception of protection and personal safety: the womb.
Moreover, it is of particular interest to note that the symptom ‘Hypomanic humor’ (GSM-V questionnaire), in the two groups who work more frequently underground (GPG and B2), presents a negative correlation with respect to the variable ‘Years LNGS’ (GPG: rs(21) = - 0.5, p<0.015; B2: r(9) = - 0.447). This correlation confirms, albeit to an extent not statistically significant for the sample B2, that the hypomanic instability, notoriously influenced by bio-rhythms [29] (day-night, sleep-wake), tends to decrease in these two groups (especially in B2) due to environmental working conditions (light, humidity and temperature) kept constant underground during the whole year.
Based on the above considerations, as part of a project for the improvement of the health conditions for the workers represented by our sample, it could be considered the idea of increasing visits to the underground labs for those who rarely access it (sample B1). This advice, theoretically, would ensure the same benefits found in the subjects of the group B2 also for the personnel working outside, thanks to a permanence in the underground laboratory of at least an hour, twice a week: timing compatible with that usually considered effective for a psychodynamic psychological therapy.
Table 8: Sample ‘B2’ – Simple linear regression results
F. Borghini, et al., Int. J. of Safety and Security Eng., Vol. 8, No. 3 (2018) 401
The comparison between the results obtained by the two groups that most frequently access the underground laboratories (GPG and B2) has identified two types of disorders for which the correlation of symptoms with years of service within the LNGS is diametrically opposed:
• Sleep disorders, with particular reference to insomnia;
• Stress, represented and quantified by the Positive Symptom Distress Index (PSDI) of the SCL - 90.
• Before going into the details of this comparison, however, it is necessary to differentiate and conceptually define the two types of protection with which the operators involved in the research are dealing:
• active conscious protection: safety and security protection that the security officers should professionally ensure;
passive unconscious protection: that is what the LNGS operating personnel receives by the working environment, thanks to its strong symbolic value. In particular, we can more effec-tively benefit from this type of protection when through oneiric activity, not necessarily elaborated, the unconscious uses the symbolism offered by the underground labs to evoke the maternal womb experience and realize the so-called ‘unconscious correction’ for the conflict-ual stress.
In general, both groups regularly working underground (GPG and B2) have the opportu-nity to enjoy the passive protection but, on the basis of the data collected, it would seem that only the B2 group derives a real advantage for health: those subjects having a better relation-ship with sleep (and therefore with dreams) can more effectively exploit the image of the laboratories to unconsciously evoke the womb protection. Over the years the advantage of symbolic protection, for the B2 group, is expressed by the decrease in the PSDI (rs (9) = - 0.574) and all psychopathological indices of SCL90. The GPG, however, because of the growing of the TSO’s character ‘Insomnia’ with the years of service within the LNGS (rs (21) = + 0.595, p < 0.003), do not have (or have it to a lesser extent) the possibility of using the tunnel as an oneiric symbol to activate the unconscious correction and reduce the level of stress. In fact, to confirm what has been assumed, the level of stress is positively correlated with years of service in LNGS (PSDI – GPG : rs (21) = + 0.565 p < 0.005).
This contrast between the two groups can be explained by their different job functions: GPG, on the contrary of the operators of the B2 group, as a matter of fact, have the responsi-bility to ensure, together with the firefighters, the active protection in the laboratories intervening in emergency situations. This responsibility would cause stress, which, according to the data collected, will have a negative impact on the ability to sleep: Fig. 3 shows how, for GPG, the predominant symptom in the SCL-90 is just the sleep disorder and as its mean value is the highest among all the symptoms verifiable from the questionnaire.
From the analyzed results, it is clear that those involved in safety & security tasks (in par-ticular, the security guards) present higher stress levels and sleep disorders. Furthermore, these inconveniences grow with the number of years of service. Therefore, in the selection phase of new operators with safety and protection tasks, in order to find the ideal candidate, it might be useful to include also the evaluation of sleep disorders among the discriminating parameters. In fact, a candidate who presented low values of insomnia would take advantage by the fact that, in the long run, would to a lesser extent be affected by the impossibility of reducing the stress of active protection with the benefits of passive protection.
402 F. Borghini, et al., Int. J. of Safety and Security Eng., Vol. 8, No. 3 (2018)
The emergency intervention can be divided into four distinct phases [30]. Each of them are interested by specific reactions of the rescuer (GPG in our case), sometimes very marked, but which should nevertheless be considered as normal reactions due to abnormal situations. Since they are already in a condition of attentional distress during normal professional activ-ity, GPG may be further affected by its overload in an emergency and react inadequately. All the flaws of the cognitive process that characterize the different emergency phases would be amplified, indeed. For this reason, the GPG are regularly involved in the simulation of critical situations to be able to adapt better to the unexpected and catastrophic event. This periodic training for the unexpected event adaptation is definitely important since it reduces the level of stress which GPG would face during a real emergency situation. However, in order to further improve the performance, it is needed to emphasize that this preventive strategy of not promoting the unconscious passive protection will lose its potential benefits. Therefore, spe-cific exercises for the activation of cognitive processes involved in the elaboration of images with a symbolic value could be very useful. During these activities, security guards should get in touch (even virtually) with images able to evoke the passive protection, but absolutely neutral with respect to the work they do in an underground environment that, for them, is an usual source of distress.
As in art, both ancient and modern, the symbolism of the womb is strongly present, some sessions of art therapy could be envisaged for the operators [31], intended as: the set of ther-apeutic treatments that use, as main tool, the artistic expression in order to promote health and healing. The art therapy is proposed as a technique with multiple application contexts, ranging from therapy, rehabilitation and improvement of quality of life. The archetypal sym-bol of the womb, with art therapy, can be evoked directly by means of images (eidetic symbolism) depicting hollow objects, houses, ships and all types of containers or, indirectly, by evocating elements that characterize the synchronized relationship between mother and child (functional symbolism). The art therapy activities, therefore, could be of two typologies depending on the symbolism that characterizes them. In the case of symbolic activation images, a proposal can be pottery workshops or simply guided tours (including virtual ones) in museums and art galleries. Through them workers employed in the active protection might activate the unconscious archetypal images, rework them and, in case, turn them into a fin-ished product. Since these are of mainly individualistic activities, they could not allow the aggregation between the various members of the group. For this reason, it might be useful to do laboratories of art therapy based on functional symbolism like dancing: in this discipline, it is fundamental the synchronized interaction with the partner or with the group, favoring the operators’ aggregation. A practical action that is very similar to the resynchronization obtained for the cerebral hemispheres with the psychodynamic development of dreams and with cognitive behavioral techniques such as EMDR actual gold standard therapy for the psychological treatment of post-traumatic stress disorders [32].
5 CONCLUSIONSThe present research has demonstrated the importance of integrating into the analysis of the human factor some psychodynamic investigation techniques, capable, indeed, to stress the unconscious component of potential sub-threshold disorders, further assessing the influence of particular working environments such as the Gran Sasso mountain underground laboratories.
The analysis of the results has revealed that working in this peculiar environment produces positive effects with respect to health. This unexpected feature may be justified by the strong

F. Borghini, et al., Int. J. of Safety and Security Eng., Vol. 8, No. 3 (2018) 403
symbolic value by which this enclosed space, surrounded and saturated with water, is able to evoke the ancestral place where every human being has experienced the maximum perception of protection and personal safety: the womb.
The present study has also proven the importance of introducing investigative methods capable of exploring the unconscious component of an individual in the evaluation of human factors involved in safety & security.
In addition to the impressive results produced, it is important to consider at least two fundamental limitations that have emerged from this investigation.
A first aspect is represented by the gender difference among the three groups under com-parison. While the sample of GPG consists entirely of male operators, in the other two groups workers of both sexes are represented. This limit certainly does not allow a proper compari-son between GPG and operators who rarely go underground. It must be said, however, that about the B2, even if it is composed of individuals of both sexes, the percentage of males in the group is (almost 90%, see Table 1). This means that the results obtained can still be con-sidered for a comparison with the group of security guards.
The second limit has emerged after performing the ‘t-test’ and the ANOVA analysis. For these tests, in fact, the p-value for the various comparisons stood, in almost all cases, well beyond the significance threshold (0.05). Probably, the cause of this result is attributable to the poor numerical consistency of the three samples compared. Although the two tests are not statistically significant, this does not affect the concluding remarks on the operators working within the LNGS, but prevents its extension to a wider population.
REFERENCES [1] Chandler, F.T., Chang, Y.J., Mosleh, A., Marble, J.L., Boring R.L. & Gertman, D.I.,
Human Reliability Analysis Method - Selection Guidance for NASA, NASA/OSMA, Washington DC (USA), 2006.
[2] Kirwan, B., Kennedy, R., Taylor-Adams S. & Lambert, B., The validation of three Human Reliability Quantification techniques - THERP, HEART and JHEDI: part II - Results of validation exercise. Applied Ergonomics, 28(1), pp. 17–25, 1997.https://doi.org/10.1016/s0003-6870(96)00045-2
[3] Spurgin, A.J., Human Reliability Assessment: Theory and Practice. CRC Press, Boca Raton, FL, 2009.
[4] Swain, A. & Guttman, H., Handbook of Human Reliability Analysis with Emphasis on Nuclear Power Plant Applications, Sandia Laboratories, Albuquerque (NM, USA), 1983.
[5] Mackieh, A. & Cilingir, C., Effects of performance shaping factors on human error. International Journal of Industrial Ergonomics, 22(4–5), pp. 285–292, 1998.https://doi.org/10.1016/s0169-8141(97)00079-6
[6] Reason, J., Human Error, 1st ed., Cambridge University Press, New York, NY, 1990. [7] Reer, B. & Dang, V.N., The Commission Errors Search and Assessment (CESA)
Method, Paul Scherrer Institut - Laboratory for Energy Systems Analysis (LEA), 7(3), 2007.
[8] Senders, J.W. & Moray, N.P., Human Error: Cause, Prediction and Reduction. Law-rence Erlbaum Associates, Hillsdale, NJ, 1991.
[9] Williams, J.C., HEART - A Proposed Method for Assessing and Reducing Human Error. 9th Advances in Reliability Technology Symposium, Bradford (UK), 1986.

404 F. Borghini, et al., Int. J. of Safety and Security Eng., Vol. 8, No. 3 (2018)
[10] Sanders, M. & McCormick, E., Human Factors in Engineering, 7th ed. McGraw-Hill Education, Columbus, OH, 1993.
[11] Hollnagel, E., Cognitive Reliability and Error Analysis Method (CREAM), 1st ed., Elsevier Science Ltd, Oxford, pp. 234–261, 1998.
[12] Karwowski, W. and Marras, W.S. Occupational Ergonomics: Principles of Work Design, I ed., Boca Raton (FL, USA): CRC Press, 2003.
[13] Stellman, J.M., Encyclopaedia of Occupational Health and Safety, IV ed., International Labour Office, Geneva, 1998.
[14] Guarascio, M., Lombardi, M., Rossi, G. & Sciarra, G., Risk analysis and acceptability criteria, WIT Transactions on the Built Environment, 94, 2007.
[15] Lombardi, M., Guarascio, M. & Rossi, G. The management of uncertainty: model for evaluation of human error probability in railway system. American Journal of Applied Sciences, 11(3), pp. 381–390, 2014.https://doi.org/10.3844/ajassp.2014.381.390
[16] Lombardi, M. & Rossi, G., Cluster analysis of fatal accidents series in the INFOR.MO database: analysis, evidence and research perspectives. International Journal of Safety and Security Engineering, 3(4), pp. 317–331, 2013.https://doi.org/10.2495/safe-v3-n4-317-331
[17] Rucci, P., Frank, E., Fagiolini, A., Kupfer, D.J., Shear, K., Dell’Osso, L., Banti, S., Mauri, M., Grochocinski, V.J., Maser, J.D., Endicott, J. & Cassano, G.B., Development and preliminary testing of the General 5-Spectrum Measure (GSM-V). Depression and Anxiety, 18(3), pp. 109–117, 2003.https://doi.org/10.1002/da.10123
[18] Borghini, F., Garzia, F., Borghini, G. & Borghini, A., The Psychology of Security, Emer-gency and Risk, WIT Press (UK and USA), 2016.
[19] Accettura, A., Aufiero, M., Anghileri, A., Briccola, A., Canevaro, G., Catelli, N., Caval-leri, M., Cusani, R., De Lucia, E., Borghini, F., Garzia, F., Lombardi, M., Luraschi, P., Paddeu, M. & Rossi, G., Oneiric Stress and Safety and Security at Work: The Discovery of a New Universal Symbol, Safety and Security Engineering VI, WIT Press (UK and USA), pp. 299–308, 2015.
[20] Holi, M., Assessment of psychiatric symptoms using the SCL-90, Helsinki University Printing House, Helsinki (FIN), 2003.
[21] Kim, H.-Y., Statistical notes for clinical researchers: Assessing normal distribution (2) using skewness and kurtosis. Restorative Dentistry & Endodontics, 38(1), pp. 52–54, 2013.https://doi.org/10.5395/rde.2013.38.1.52
[22] Kendall, M. & Gibbons, J.D., Rank Correlation Methods, V ed., Oxford University Press, Cary, NC, 1990.
[23] Xu, W., Hou, Y., Hung, Y.S. & Zou, Y., A comparative analysis of Spearman’s rho and Kendall’s tau in normal and contaminated normal models. Signal Processing, 93(1), pp. 261–276, 2013.https://doi.org/10.1016/j.sigpro.2012.08.005
[24] Cohen, J., Statistical Power Analysis for the Behavioral Sciences, II ed. Lawrence Erlbaum Associates, Hillsdale, NJ, 1988.
[25] Siegel, S. & Castellan, J.N.J., Nonparametric Statistics for the Behavioral Sciences, II ed., McGraw-Hill, New York, NY, 1998.

F. Borghini, et al., Int. J. of Safety and Security Eng., Vol. 8, No. 3 (2018) 405
[26] Cohen, J., Statistical power analysis. Current Directions in Psychological Science, 1, pp. 98–101, 1992.https://doi.org/10.1111/1467-8721.ep10768783
[27] Draper, N.R. & Smith, H., Applied Regression Analysis, III ed., John Wiley & Sons, Inc., New York, NY, 1998.
[28] Dunst, C.J., Dunst, H.D.W. & Dunst, T.C.M., Guidelines for calculatin effect sizes for practice-based research syntheses. Centerscope, 3(1), pp. 1–10, 2004.
[29] American Psychiatric Association - APA, Diagnostic and Statistical Manual of Mental Disorders - TR, VI ed., 2000.
[30] Hartsough, D.M. & Myers, D.G., Disaster work and mental health: Prevention and control of stress among workers. National Institute of Mental Health, Rockville, MD, 1985.
[31] Case, C. & Dalley, T., The Handbook of Art Therapy, III ed., Routledge, New York, NY, 2014.
[32] Shapiro, F. & Maxfield, L., Eye Movement Desensitization and Reprocessing (EMDR): information processing in the treatment of trauma. Journal of Clinical Psychology, 58(8), pp. 933–946, 2002.https://doi.org/10.1002/jclp.10068