human development research paper 2010/02 human...
TRANSCRIPT

Human DevelopmentResearch Paper
2010/02Human Development
Trends since 1970:A Social Convergence Story
George Gray Molinaand Mark Purser

United Nations Development ProgrammeHuman Development ReportsResearch Paper
June 2010
Human DevelopmentResearch Paper
2010/02Human Development
Trends since 1970:A Social Convergence Story
George Gray Molinaand Mark Purser
United Nations Development Programme Human Development Reports
Research Paper 2010/02June 2010
Human Development Trends since 1970: A Social Convergence Story
George Gray MolinaMark Purser
George Gray Molina is an Oxford-Princeton Global Leaders Fellow, Niehaus Center for Globalization and Governance, Princeton University. E-mail: [email protected].
Mark Purser is a research consultant at the Human Development Report Office
Comments should be addressed by email to the author(s).

Abstract This paper uses a unique data set of the Human Development Index to describe long-run human development t rends f or 111 c ountries, f rom 197 0 t o 2005. T he first pa rt of t he p aper s hows trends by region, period and index subcomponent. We find that 110 of the 111 c ountries show progress i n t heir H DI l evels ove r a 35 -year p eriod. H DI growth i s fa stest fo r l ow-HDI a nd middle-HDI countries in the pre-1990 period. The life-expectancy and education subcomponents grow faster than income. The assessment of HDI progress is sensitive to choice of measurement. The s econd pa rt of t he pa per f ocuses on t he differences be tween i ncome a nd non -income determinants of hum an de velopment. First, H DI growth c onverges, both a bsolutely and conditionally, when running HDI growth rates on initial levels of HD. Second, we find that the income and non-income components of HDI change have a near-zero correlation. Third, we look at de terminants o f t he non-income c omponents of t he H DI. W e find that i ncome i s not a significant d eterminant of H DI ch ange o nce we i nclude u rbanization, f ertility an d f emale schooling. Fourth, we test the effects of institutions, geography and gender on HDI growth. We find that the most robust predictors of HDI growth are fertility and female schooling. We check this result using years of women’s suffrage as an instrument for changes in gender relations, and find that it is a significant predictor of HDI progress for the whole sample.
Keywords: human development, education, health and demographic trends, cross-country comparisons, measurement and analysis of poverty
JEL Classification: O15, N30, O50, I32
The H uman D evelopment R esearch P aper ( HDRP) S eries i s a m edium f or s haring recent research c ommissioned t o i nform t he g lobal H uman D evelopment R eport, which i s publ ished annually, and further research in the field of human development. The HDRP Series is a q uick-disseminating, informal publication whose titles could subsequently be revised for publication as articles in professional journals or chapters in books. The authors include leading academics and practitioners from around the world, as well as UNDP researchers. The findings, interpretations and conclusions a re s trictly t hose of t he authors and do not necessarily represent t he v iews o f UNDP or U nited N ations M ember S tates. M oreover, t he da ta m ay not be c onsistent w ith t hat presented in Human Development Reports.
1
INTRODUCTION1
The world has witnessed significant improvements in human well-being over the past decades.
Since 1970, l ife e xpectancy increased by 9 years, av erage literacy increased b y 20 poi nts and
income per capita increased by US $3,800.
2
The paper uses a unique data set on the Human Development Index for 111 countries, in f ive-
year intervals, from 1970 to 2005. The HDI, introduced in 1990, measures changes in leading a
healthy and long life, acquiring knowledge, and attaining a decent standard of living. The index
has s purred a l arge l iterature s ince i ts i nception (Fukuda-Parr an d Kumar 2003; D eneulin a nd
Shahani 2009 ). It w as conceived as an ex panded m easure o f w ell-being, alternative to th e
economic growth m easures popul ar i n the de velopment l iterature ( ul H aq 2005) . Despite its
impact, t he i ndex has al so at tracted a s ubstantial a mount of criticism for its analytical an d
empirical unde rpinnings (see S rinivasan 1994 ; R aworth a nd S tewart 2002; R anis, S tewart a nd
Samman 2005 ). We focus our a nalysis on t he r elatively l ess know n story o f how changes in
human de velopment have pr oduced present-day levels of hum an de velopment achievement
While global improvements have been impressive,
they have also been highly uneven. The differences in human development achievement within
developing c ountries are s imilar t o t he d ifferences between low a nd high i ncome countries
(Grimm e t a l. 2009; Grimm e t a l. 2008) . This unevenness is a key characteristic o f long-term
development, but is also a matter of controversy in the literature. Is human development different
from i ncome as an i ndicator o f w ell-being? Part of t he di scussion arises fro m what is be ing
measured (e.g. income, child mortality), and part, from how best to measure changes over time
and a cross c ountries (e.g. rate o f ch ange f rom s tart-point, performance r elative to s imilar
countries). This paper engages this discussion, by describing trends in human development—as
measured by changes in the Human Development Index (HDI)—from 1970 to 2005. We present
trends by region, period and sub-components of the HDI, and test a number of hypotheses to help
explain the patterns of change observed over the past thirty-five years.
1 The authors would like to thank Francisco Rodriguez, Frances Stewart, Gustav Ranis, Jose Pineda and Ricardo Fuentes for valuable comments to a draft version of this paper. All errors and omissions are our own. 2 These estimates are global population-weighted averages that use the 111 country data-set assembled for this paper. See data section for more details on the expanded data set.

2
across the globe. We find that human development trends fit into a larger story of demographic
change s ince the 1950s, driven by initial levels of human development and changes in fertility
and female s chooling. While our da ta c onstrain us t o na tional a verages, t he pa tterns of H DI
change ar e clear: hum an de velopment contrast w ith e conomic g rowth in its convergence pa th
and in the determinants of this convergence.
Describing internationally comparable indicators of human development poses a significant data
challenge. M issing in formation, inter-temporal data comparability p roblems, a nd inter-country
comparability p roblems, m ake the t ask o f as sembling trends especially d ifficult. A s ubstantial
part of the background research for this paper focused on issues of data assembly, validity and
comparability. However, the analysis of trends yields three sets of findings which are the main
focus of the paper: the first concerns the rate of HDI progress across countries, which shows that
the poorest countries are achieving improvements in human development at a much quicker pace
than the richest countries of the world. Over a thirty-five year period, only one country sees a
reversal in its human development level while 22 countries see reversals in GDP per capita. We
believe t his t o be a significant p attern which w e examine using a lternative m easurements o f
change. We contrast t hese results with the f ine-tuned convergence di scussion of the economic
growth literature. Surprisingly, the correlation between the income and non-income components
of HDI change is close to zero. The second issue is heterogeneity in HDI trends, by region of the
world, period of reference and sub-component of the index. A simple decomposition of the index
into i ts subcomponents shows that s ixty countries i n our s ample experienced i mprovements i n
HDI primarily b y increases in life-expectancy, fi fty-five by improvements in literacy, and f ive
countries by improvements in income per capita. Achievements are faster for the pre-1990 period
than for the post-1990 period, and are faster in Asia and the Middle East throughout the whole
period. These r esults c ontrast w ith t he c onventional por trait of de velopment pr ogress, largely
drawn from the economic g rowth lite rature. Third, we f ocus on determinants of human
development c hange, a nd f ind t hat changes i n g ender roles ( literacy, f ertility and l abor
participation) are a robust dr iver of hum an de velopment a chievements ove r t ime, after
controlling for a number of s tandard explanatory variables. We check this result correcting for
endogeneity and using alternative model specifications. We use female suffrage as an instrument
for changes in gender roles.
3
The pa per i s s tructured in f our parts. S ection 1 explores some of t he ke y controversies i n t he
literature on social and economic trends. Section 2 briefly discusses data issues, particularly the
assembly of a series of comparable data from 1970 to 2005. Section 3 describes trends in human
development and di fferent w ays of m easuring pe rformance. W e de scribe t rends b y region,
subcomponent a nd pe riod. S ection 4 analyzes d eterminants o f convergence, t ests al ternative
specifications and applies robustness checks to the analysis of both levels and changes in human
development a cross c ountries. We c onclude w ith s ome t houghts on how hum an de velopment
trends relate to broader demographic trends driving social and economic change.
1 THE LITERATURE ON TRENDS
The 1990 Human Development Report spurred a vast literature on alternative measures of well-
being (see Fukuda-Parr and Kumar 2003) . A number of analytical and methodological criteria
guided the construction of the first index and set the stage for much of the praise and critique that
followed. M ahbub ul H aq, t he f irst c oordinator of t he r eport, s ingled out t hree features o f t he
new i ndex (ul H aq 1995 ). F irst, t he HDI would m easure i ndicators of well-being --other t han
income—“to en large p eople’s choices” (p. 1 27). Inspired b y Amartya S en’s capabilities
approach, the i ndex ai ms at ex panding t he m easurement o f well-being b eyond the pr imacy of
economic m easures. S econd, t he ne w i ndex w as de signed a s a composite m easure t hat w ould
jointly cover both social a nd e conomic di mensions of w ell-being. In ul H aq’s a ssessment, t he
contrived separation of dimensions of welfare, such as alternative GDP measures or the physical
quality of life index (PQLI) “misses the synergy between social and economic progress” (p.128).
While the inclusion of income in the HDI has attracted criticism, the joint analysis of economic
and social progress, has been at the core of the HDI brand and has driven a holistic approach to
policy analysis for two decades. The third f eature of the index “was to keep the coverage and
methodology of HDI (estimation) quite flexible” (p. 128). This has attracted a large literature that
probes alternative me asurements a nd s pecifications o f a measure o f m ulti-dimensional w ell-
being. It ha s a lso l eft t he door ope n f or bot h e xpansions of r edefinitions of t he H DI i n s uch
expanded m easures as t he hum an pove rty i ndex ( HPI-1 a nd H PI-2), a nd t he gender r elated
development index (GDI), among others.
4
Behind ul Haq’s three features lies an enduring challenge to represent the capabilities approach
in r elatively s imple, r eplicable an d co mparable cross-country and w ithin-country m easures o f
human development (Comim, Qizilbash and Alkire 2008; Alkire 2007). This has been a highly
contentious issue in the literature and frames our evaluation of the HDI over time. In this section
we consider three issues. The first has to do w ith what is being measured. What is gained and
what is lost by unpacking the HDI by subcomponent or assessing the HDI in aggregate form over
a th irty-five year time span? There is substantial d isagreement over the limitations of the HDI
with respect to income and other indicators of social progress. We review part of this discussion
and set out some problems that can be tested empirically. The second issue has to do with how to
model human development trends. Can we describe human development progress with the same
underlying assumptions and specifications used for economic growth? We turn to a comparative
assessment of the i ncome and h ealth l iteratures to he lp us formulate a m odeling s trategy. The
third issue is whether what we describe for the 1970-2005 period is specific to this period, or is
part of a longer underlying process of social and economic change. We turn to the literature on
population and demography to provide some background on how this period f its into a longer
time s pan o f d emographic ch ange s tarting i n the pos t-war pe riod, and forecasting forward t o
2050. We a rgue t hat t he hum an de velopment t rends pr esented here s hould be a ssessed i n t his
century-wide span.
The f irst i ssue r elates t o m easurement. The hu man de velopment i ndex i s m ade up of fo ur
indicators with different weights: literacy rates (22% weight), gross enrolment rates (11%), life
expectancy r ates ( 33%) and G DP pe r c apita ( 33%). T he i ndex r uns f rom 0 ( low) t o 1 ( high
human development), and thus standardizes comparisons across dimensions by constructing sub-
indices. T he de gree of correlation be tween i ndicators ha s b een a m atter of di scussion i n t he
literature. R anis, S tewart a nd S amman ( 2005) f ind t hat unde r-five child m ortality ha s bot h a
high c orrelation w ith H DI ranking ( 0.87), but a lso s ubstitutes well f or H DI when t easing out
uncorrelated indicators for eleven dimensions of human development not included in the index.
Wolfers (2009) finds, in contrast, that income per capita is highly correlated with HDI ranking
(0.95) a nd claims th at i t adds l ittle t o al ternative m easures o f w ell-being. In bot h c ases, t he
comparison i s on H DI rankings rather t han the i ndex i tself w hich, a s argued b y R odriguez
(2009), might be useful for seeing who’s up a nd who’s down at one point in t ime, but is l ess
5
useful for evaluating what is driving change in well-being over time. Rodriguez finds that rates
of change in HDI and GDP per capita, between 1990 and 2006, show a relatively low level of
correlation ( 0.43) and t hat g rowth r ate of t he non -income por tion of t he H DI s hows a n e ven
lower c orrelation ( 0.03) w ith t he g rowth r ate of i ncome. D ifferent i ssues w ould a ppear t o b e
driving changes in education/life-expectancy and changes in income. This is one issue that can
be further tested by contrasting the determinants of changes over time for the HDI and GDP per
capita (we present this test in section 5).
A similar critique has been made of the correlation between the full set of indicators of the HDI
(Srinivasan 1994). Srinivasan reports the overall correlation between indicators for the first three
HDI indices (between 0.73 and 0.87), and finds that an equally weighted linear combination of
the indicators accounts for 0.88 of the generalized variance among them. Given the high level of
correlation, w hat i s t o be ga ined b y a ggregating t hem i nto a s ingle index? B ehrman a nd
Rosenzweig (1994) add to this critique by emphasizing the weakness of the data for each of the
subcomponents. They find, for example, that for 19 of 145 countries in 1994, there are no adult
literacy figures since 1970, and that for 41 c ountries more, the latest data are from 1970-1979.
Both critiques can be addressed with the new set of data (which we report in section 3). The most
important que stion i n b oth c ases i s w hether t here i s s omething gained f rom unpa cking t he
subcomponents, or running them together as a joint measure of well-being. We test both uses in
this paper and f ind that each is useful fo r a di fferent purpose –unpacking for di scussing long-
term trends, and aggregating when discussing convergence across countries over time.
The second i ssue r elates t o m odeling s ocial a nd e conomic t rends ove r t he l ong r un. Charles
Kenny (2005) shows evidence of long term convergence of education, health and infrastructure
measures, using historical series from India, the United Kingdom, the United States and selected
cases. Given t he r elatively s parse attention g iven t o mo deling th e H DI tr end its elf (with th e
exceptions of Noorbakhsh (2007) and Craft (1997)), we focus here on two sets of literatures—on
life-expectancy and GDP growth—to provide an analytical contrast over what is driving social
and economic change over time. The GDP growth literature is extensive and provides a number
of insights for evaluating long term change. The starting point for much of the recent discussion
is R obert B arro’s an alysis o f cr oss-country convergence ove r t ime (Barro a nd S ala-i-Martin
1992; Barro 1991). Barro finds evidence of “conditional convergence” between poorer and richer

6
countries ove r t ime, a ccounting f or i nitial l evel of G DP pe r c apita. Conditional c onvergence
conveys the idea that poorer countries grow faster than richer countries, conditional on particular
structural f eatures of a c ountry. The lite rature i s d ivided o n th is is sue. P ritchett ( 1997), f or
example, finds large divergence when comparing countries unweighted by population over time.
Quah (1996), on the other hand, finds evidence of “club convergence” with weak convergence or
divergence between s tructurally di fferent countries. Bourguignon, Levin and Rosenblatt (2004)
find t hat i ncome c onverges conditionally across c ountries w hen w eighting b y popul ation and
diverges when data are unweighted. They argue that both measures are useful but imply different
policy preferences.
In c ontract t o t he gr owth l iterature, t he l iterature on pr ogress i n l ife e xpectancy a nd h ealth
outcomes tends t o f ocus both on income a nd n on-income de terminants of l ong t erm c hange.
Most i nternational he alth c omparisons f ocus s pecifically on de terminants of c hild mortality
rather that life-expectancy, because o f comparability problems for countries with high rates of
infant and child mortality rates and those without them (Deaton 2003 and Deaton 2006). Cutler,
Deaton and Lleras-Muney (2005) review a large literature on the determinants of life expectancy
and child mortality. They find that, although life-expectancy has increased by about 30 years in
the pa st c entury, i ncreases ha ve be en une qually di stributed i n t he developed a nd de veloping
world, with a gap of also 30 years between the richest and poorest countries. They argue that the
key determinants to improved child mortality, after controlling for income, are related to science
and technological progress, including changes in water and sanitation conditions, as well as the
emergence o f low-cost tr eatments f or in fectious a nd r espiratory diseases in poor er c ountries.
They highlight the importance of a health gradient to explain both the rate of progress, but also
the unequal distribution of health progress over time. The idea of a gradient is that rich and poor
adopt different health technologies at different speeds, thus leading to rising health averages, but
also t o gr owing gaps be tween t he rich and poor until lo w-cost an d easy-access t echnologies
become av ailable. Deaton ( 2003) pur sues the l inkages be tween he alth out comes a nd i ncome,
beyond t he t echnological a doption h ypothesis. H e f inds t hat i ncome d oes n ot ex plain h ealth
outcomes—for aggregate level analysis—but does explain individual level health outcomes. He
hypothesizes t hat pe rhaps something e lse is a t w ork in t he i ncentive s et t hat af fects h ealth
behavior over time. In this view, income works through education, wealth, control, rank or other

7
more p roximate causes o f h ealth s tatus, r ather t han independently. In a m ore r ecent pa per,
Deaton ( 2006) suggests t hat “ factors s uch as good governance a nd e ducation, pa rticularly
women’s education, are likely candidates for further investigation” (p.1). While acknowledging
the i mportance of i ncome an d t echnology, Deaton em phasizes t hat i t i s t he s ocial factors t hat
make effective delivery of health possible. In this paper, we test Deaton’s hypothesis by focusing
specifically on female schooling and fertility levels as determinants of child mortality trends. On
the larger issue of modeling human development trends on economic convergence models or on
its own terms, we test both in section 4.
The third issue concerns how recent trends fit into the larger picture of demographic change. The
most recent United Nations revision of population projections sheds some light on how to frame
the 1970 -2005 pe riod ove r t he l ong r un ( UNDESA 2009) . In t he r etrospective pi cture, t wo
empirical is sues a re imp ortant. F irst, 1970 -2005 is a pe riod of e xplosive popul ation g rowth.
Global popul ation i ncreased b y 2.9 bi llion pe ople (from 3.6 bi llion i n 1970 t o 6.5 billion in
2005). A lthough t he f astest r ates of popul ation growth w ere ach ieved i n t he m id-1960s, t he
highest l evel o f year-to-year popul ation gr owth was a chieved i n t he mid 1980s . Population
growth did not occur without significant consequences over other important features that affect
human de velopment ove r t he l ong run, i ncluding r apid ur banization, i ncreased dom estic a nd
international m igration, a nd de clines i n f ertility r ates i n bot h t he de veloping a nd d eveloped
worlds. Although the pace of demographic transition was heterogeneous for different regions and
countries throughout the half-century, declining fertility rates and declining mortality rates meant
higher lif e-expectancy t han i n t he pa st. A ccording t o t he r evised U N database, global l ife-
expectancy rate increased from 58 to 66 years, since 1970, and from 46 years in 1950 (UNDESA
2009). T he hum an de velopment t rends pr esented i n t his pa per r eflect a l onger t erm t rend o f
steeper imp rovements in lif e-expectancy s ince 1950. S econd, t here i s a ne w de mographic
transition underway concerning ageing and the gradual r ise of the economic dependency ratio:
the ( older) e conomically inactive popul ation r ises a s a s hare of t he ( younger) e conomically
active popul ation ( Gladstone 2010) . T he dr op i n t he de pendency ratio w as de emed a
demographic window of opportunity in the last half century (Bloom and Canning 2003; Bloom
and W illiamson 1998; B loom a nd Friedman 1997), w ith mu ltiple e ffects o ver p roximate
determinants of hum an de velopment ove r t ime. Among t hese, l inks between r ising f emale

8
schooling, dr ops i n f ertility r ates a nd increased f emale labor participation a re mo st imp ortant
(Bloom et al. 2007). A large literature on structural transformation addressed this linkage in the
1960s and 197 0s (Chenery 1960 ; Chenery an d Syrquin 1975; T immer and A kkus 2008 ). W e
revisit these hypotheses in Section 4 of the paper, which focuses on gender determinants of long
term human development, controlling for demographic transition variables reviewed above.
A f inal i ssue of concern i s whether human development t rends a re s ensitive t o changes i n t he
HDI measure itself. As we take stock of historical trends in well-being, it is useful to think of a
counter-factual measure that broadens the HDI beyond income, education and l ife-expectancy.
Would t rends c hange much i f w e a dded, s ay pol itical o r e nvironmental di mensions, t o t he
traditional HDI? Recent research suggests the answer is yes and no, de pending on t he variables
and w eights c onsidered. First, t here i s the remarkable hom ogeneity i n t he non -income
component of t he H DI ( mostly i ncreasing over time ) w hich c ontrasts to th e r elatively
heterogeneous pattern of the income component (increasing, accelerating, s tagnating, declining
and collapsing). Changes t o t he H DI t hat a ffect or qu alify economic g rowth –such as
environmental s ustainability— are likely to a mplify th e in come-component heterogeneity;
changes that affect social development –such as multi-dimensional poverty measures—are likely
to af fect t he o verall non-income trend onl y m arginally. Second, e xisting r esearch on m ulti-
dimensional pove rty m easures s uggests t hat t he underlying p attern o f alternative m easures for
political capabilities, such as “the ability to go about without shame” is likely to be very different
from, say, the “political freedoms” indices gathered by Freedom House (Zavaleta 2007; Alkire
2009). Some measures of political capabilities are contingent to time and place; others are less
affected b y ch anges ac ross co untries an d acr oss t ime p eriods (Whitehead a nd G ray M olina
2003). Third, is the question of heuristic usefulness. While a multi-variable index that captures
ever-expanding dimensions of well-being is more feasible now than it was fifty years ago, there
is t he que stion of descriptive a nd e xplanatory leverage. H ow m uch is g ained b y a dding
additional va riables, w eights and di mensions t o t he c lassical f ormulation of t he H DI? The
strength –and pr esumed weakness—of th e H DI i s its normative and empirical simplicity. T he
indicators t hat m ake up t he H DI a re standardized, relatively easy t o g ather an d w idely
understood across the world. HDI levels, and changes in levels, are easy to grasp and provide a
template for long run policy action.

9
2 THE DATA
Official t rend d ata f or the H uman D evelopment Index ( HDI) b egins i n 1980 a nd onl y 8 2
countries have data that spans the entire sample. Our dataset is constructed to expand HDI data
across both years and countries. It draws from several data sources to create trend data for HDI
and i ts f our c omponents: G DP pe r c apita, l iteracy, gross e nrolment r atio, a nd l ife e xpectancy.
The d ata s et spans f rom 1970 t o 2005 in 5 -year i ntervals f or 111 c ountries w ith da ta i n a ll
periods (see annex for details).
3 TAKING STOCK: THE HDI AND HUMAN DEVELOPMENT TRENDS
The f irst pa rt of t his s ection di scusses what the HDI as a m easurement t ool can convey about
how human development has been changing over time. The second part of this section presents a
detailed de scriptive a nalysis of H DI t rends. A fter pr esenting f our w ays of e xamining H DI
performance i n s ection 3.1.1, w e an alyze changes in H DI b y r egion a nd f ive-year i ntervals,
compare the countries with the fastest and slowest growth, and consider the population sizes of
high and low performers.
A diverse set of s tories emerges that vary both within and between regions and across the 35-
years of our sample. We find evidence that the HDIs of developed and developing countries are
converging as the poorest countries t end to have the fastest growth, but we qualify our results
with the fact that there may be elements of HD improvement that the HDI cannot capture.
3.1 Measurement
In this section we focus on two questions of measurement: (1) What is the most appropriate way
to e valuate how countries pe rform compared t o one another, a nd (2) d oes t he HDI t ell us
anything more than simply looking at income?
3.1.1 Measuring Performance
One o f th e limita tions of th e HDI is th at th e HDI its elf a nd s everal of its c omponents are
bounded. T hat i s, while one c an c onceive o f i ncome a s be ing vi rtually unbounde d as
10
technological advances allow the wealthy to enjoy increasingly comfortable lives at lower costs,
literacy and g ross en rolment r ates can not ex ceed 1 by c onstruction. Life ex pectancy m ay al so
have a natural bound. While healthy people in developed countries increasingly live past the age
of 80, to l ive to 100-years-old remains a relatively uncommon feat. Thus, evidence suggesting
that poor and rich countries are converging in terms of HD may simply be a consequence of the
fact that rich countries have reached an upper bound of a particular dimension.
Nonetheless, suppose that rich countries have achieved life expectancies of 75 and make no more
advances i n h ealth. If p oor c ountries t hen h ave positive g rowth a nd a re on t rack to achieve a
similar level of life expectancy, one could still call this ‘convergence’, as all countries come to
reach a common level of life expectancy. However, many rich countries that have achieved high
life expectancies continue to make improvements in health. Thus, while developed countries may
no longer see increases i n l ife expectancy, they might instead increase years of healthy living.
Such an improvement would not be captured in a simple measure of life expectancy. Similarly,
countries that already achieve at or near the maximum of literacy and enrolment might continue
to improve in quality-adjusted years of schooling. If this is the case, an analysis of the HDI and
its components might suggest a convergence in health or education while developed countries
may actually be maintaining or expanding the achievement gap.
While we acknowledge that the rudimentary nature of the HDI presents limitations as to what we
can learn about global HD trends, the discussion above does not address the normative issue of
valuing di fferent t ypes of H D i mprovements. M ore s pecifically, basic i mprovements i n a
particular H D di mension m ay b e m ore i mportant a nd valued m ore h ighly t han advanced
improvements. That is, an individual might realize a greater improvement in well-being by going
from illiterate to literate status, than from literate to well-read.
There is value in knowing whether poor and rich countries are indeed converging according to
the s imple measures of the HDI. We present four methods to analyze this convergence, which
are summarized in Table 1. Method (1) is the simple difference between the starting and ending
values f or a p articular country. T his m easure i ndicates at t he m ost b asic l evel h ow m uch a
country has pr ogressed and a llows us t o c ompare t he absolute m agnitude of c hanges b etween
countries. Method (2) is another commonly used way of looking at how a particular measure has

11
changed: the growth rate. This measure is simply the percentage change between the beginning
and end of the period. The advantage of this measure is that it rewards relative HD performance.
For example, a country that doubles its literacy from 10% to 20% has a higher growth rate than a
country that increases its literacy from 80% to 90%. However, this measure does not capture the
additional e ffort th at mi ght b e n ecessary t o increase H DI at h igher l evels. T hat i s, i ncreasing
literacy f rom 80% t o 90 % m ight be m ore di fficult t han i ncreasing from 10% t o 20% be cause
once a population has a literacy rate in the upper range, the remaining illiterate elements of the
population may be those that are most difficult to reach.
We a ttempt to c apture t his p ossibility w ith me asures (3) and ( 4). M easure ( 3) i s t he average
annual growth rate of the ‘unbounded log-transformation’, which is a calculation commonly used
in t he analysis o f p robabilities lik e th e logit r egression. B y c onstruction, th is me asure is
unbounded both above and below. Thus, it gives additional weight to initial values that are either
near the top or bottom of the index. While we could apply this method to the income index, it is
not necessary to do so because we use the log-transformation as a solution to naturally bounded
variables. Measure (4) calculates a ‘ typical’ level of growth given a particular initial level and
then compares a co untry’s actual performance to what might be expected. To do t his, we run a
bivariate regression of the average annual growth rate (measure (2)) on the initial level. We then
calculate t he f itted values o f t his r egression, which i ndicate an ‘ expected’ g rowth r ate given a
particular initial level. Measure (4) is the residual, that is, the difference between the actual and
fitted growth rates.
Each o f t hese m easures provides different w ays of l ooking a t how t he H DI h as c hanged ove r
time. In s ection 3.2.2, w e present a d etailed e xamination o f w hat t hese d ifferent ap proaches
reveal in the data.
3.1.2 Do HDI and Income Measure the Same Thing?
Some detractors of the HDI claim the index simply follows income and any examination of the
HDI yields the same results as, say, GDP per capita. While the entire 1996 Human Development
Report seeks to dispel this claim, this criticism persists (Wolfers 2009). Our dataset allows us to
examine t his q uestion f or a l arger s ample t han p ast ef forts, an d w e find f urther ev idence t hat

12
refutes t he as sertion t hat H DI an d i ncome a re i nterchangeable. Instead, w e s ee t hat t he n on-
income c omponents of HDI pr ovide va luable i nsights in unde rstanding how H D ha s c hanged
over time that a look at income alone would not reveal.
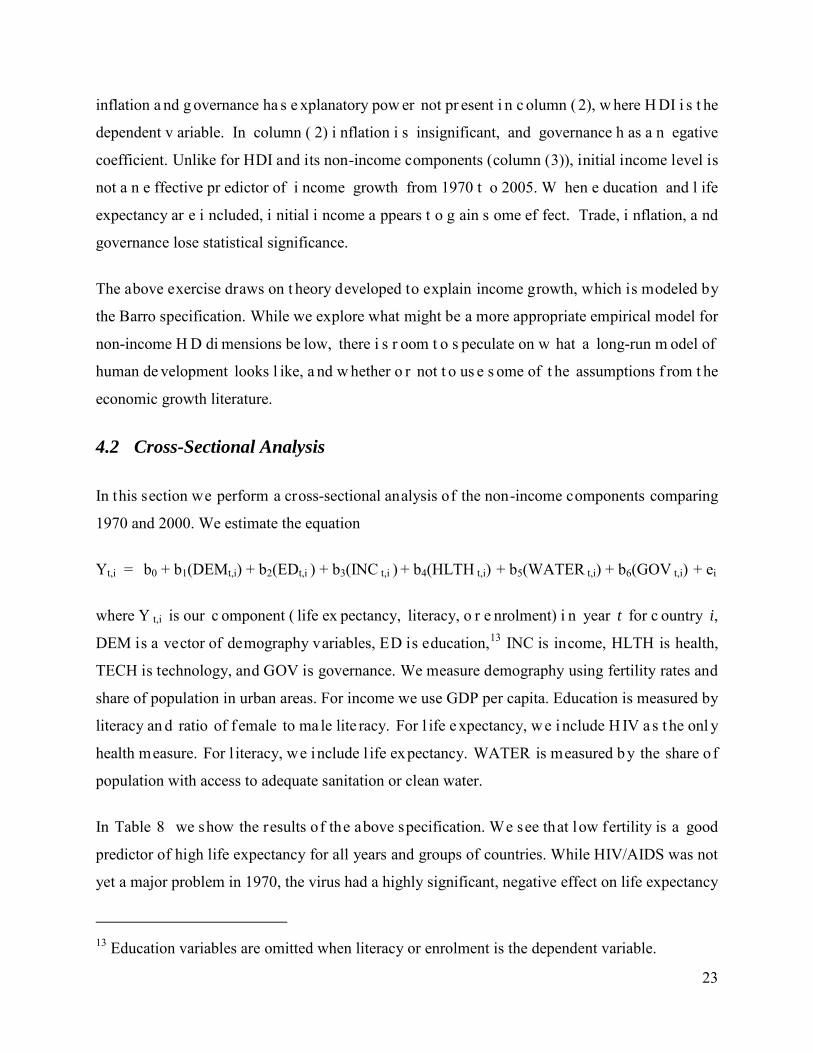
The first panel of Figure 1 shows what critics often point out in demonstrating how closely HDI
and income are related. This figure shows HDI and income index levels in 2005, which do in fact
have a 95% correlation. Panel B plots the income index against the average of the education and
health i ndexes a nd s hows t hat t he r elationship be gins t o w eaken. W hile s till hi gh, t hese t wo
variables have only an 88% correlation. However, in panel C the relationship nearly breaks down
altogether. This graph shows the absolute difference from 1970 to 2005 for HDI and the income
index. While the fitted line is still upward sloping, there is substantial variation among the 111
countries in the sample. The positive relationship disappears in Panel D, which shows the annual
growth r ate of t he a verage of t he non -income c omponents. I n this gr aph, the non -income
components tend to have a negative relationship with income growth. While we do not claim that
the relationship between the income and non-income components i s inherently a negative one ,
these f igures cl early i llustrate t hat ad vances i n cer tain H D d imensions d o n ot n ecessarily
translate into advances in others.
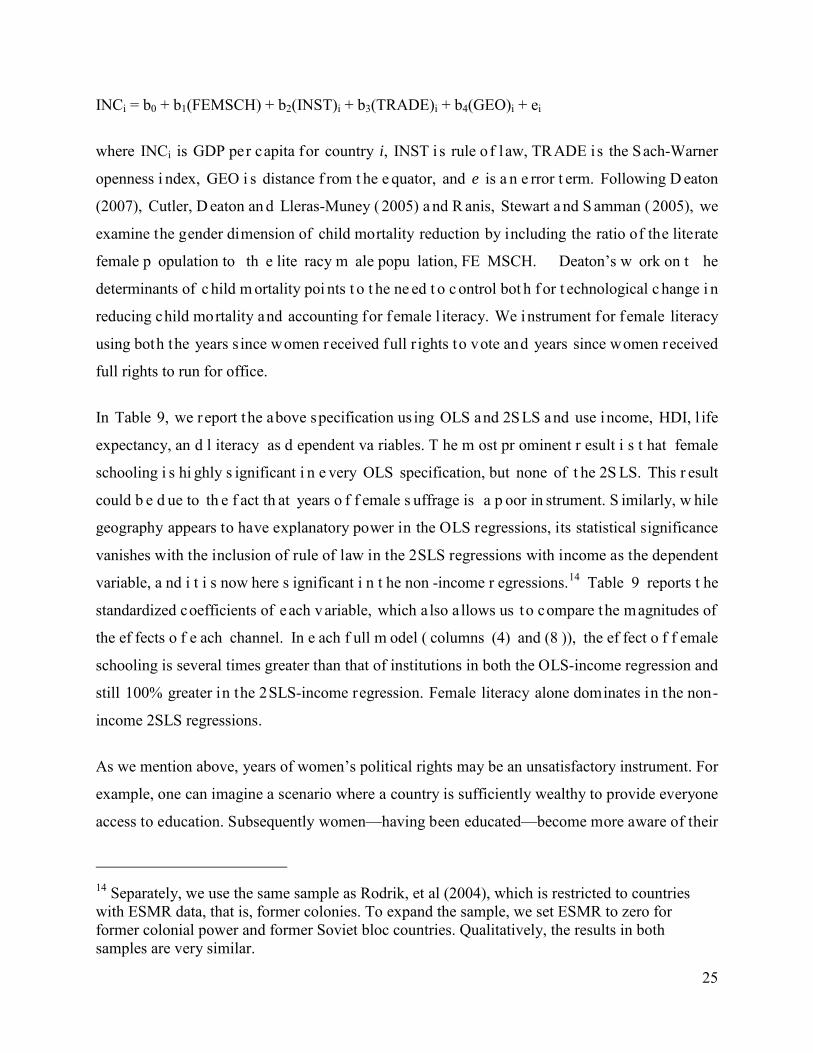
A regional analysis of HDI and income further suggests that the dynamics between the income
and non-income components vary both by place and time. Figure 2 shows a scatter plot of HDI
and the income index by year and region from 1970 to 2005.3 A diagonal line segment indicates
that HDI and income have moved together between two periods.4
3 Note that in most places in this paper when we refer to ‘Europe’ as a region, we are typically referring to developing European countries (mostly eastern European) and not all of Europe. Most of Western Europe is categorized in the ‘very high’ HDI or ‘developed’ country group.
For the world as a whole and
for m any re gions—including de veloped c ountries a nd C hina—HDI a nd GDP t end t o i ncrease
together. H owever, t here ar e s everal n otable exceptions. A frica h as h ad s everal i nstances o f
falling income, but HDI continued to rise in each of these periods. Similarly, a fall in income in
4 To enhance readability, we omit Oceania from these figures. Moreover, the Oceania regional average is based on only three developing nations with HDI data and may not be representative of the entire region. Due to its large population, China and India have been graphed separately. Developed nations have also been graphed as a separate group and are excluded from the other regional averages. Thus, the trend for Europe consists primarily of Eastern European countries.

13
Latin A merica an d the C aribbean (LAC) in t he 1980s w as not r eflected i n t he HDI. Figure 3
shows t he s ame plot w ith t he e ducation a nd i ncome i ndexes. H ere w e s ee t hat t he e ducation
index doubled from 1970 t o 2005 f or Africa, while income growth remained stagnant. In LAC,
the i ncome i ndex i ncreased b y 0.09 poi nts (14%) from 0.65 t o 0.74. On t he ot her ha nd, t he
education i ndex i ncreased b y 0.22 poi nts ( 33%) f rom 0.66 t o 0.88. In de veloping E uropean
countries, erratic income growth and decline was accompanied by a steady increase in education.
A similar pattern unfolds with life expectancy in Figure 4. Despite a n oticeable slowdown that
occurs du ring t he 1990s w ith t he ons et of t he AIDS pa ndemic, A frica has a n i ncrease i n l ife
expectancy i n ev ery p eriod. Developing Europe’s v olatile in come c oincides w ith a r elatively
unchanging health index, which actually decreased 0.01 points over the period.
The d ata indicate t hat w hile a s napshot o f H DI and i ts c omponents c an suggest t hat t hey a re
highly correlated, an examination of their growth rates shows that they do not necessarily move
together ove r t ime. Thus, t he H DI a s a c omposite m easure of t hree b road H D di mensions
provides information that is not apparent in measures of income alone. If one seeks to understand
the dr ivers of H D, an income-only analysis w ill not pr ovide a c omplete p icture o f how a
population’s well-being is evolving over time.
3.2 Examining Trends in HDI and its Components
In t his s ection w e p resent hum an de velopment t rends. In 3.2.1 we s ummarize population-
weighted regional H DI trends, w hile s howing China a nd India s eparately s ince t hey tend t o
dominate regional averages. In Section 3.2.3, we discuss population-unweighted averages using
the standard regional classifications as established by the Human Development Report Office.
3.2.1 An Overview: Trends and Summary Statistics
As Table 2 shows, over the 35 years of our sample only one country (Zambia) ended with an
HDI in 2005 that was lower than in 1970, despite 15 countries experiencing a fall in HDI in the
1990-1995 period. No countries had a fall in literacy, but 22 ( 14%) fell in GDP per capita over
the period. More countries had a decrease in income between 1980 a nd 1985 than in any other
period. The biggest fall in life expectancy occurred among 26 countries between 1990 and 1995.
Relatively few countries had a fall in literacy during any period, but during the 1980s a quarter of
14
countries had falling e nrolment r ates. O verall, th e v ast ma jority of countries e xperienced
increases in each dimension and period.
The average (population-unweighted) global HDI increased f rom 0.58 i n 1970 t o 0.73 i n 2005
(27%), as shown in Table 3. However, there is a notable difference between each HDI group.5
Figure 5
After 35 years, e ach group onl y b egins t o a pproach t he l evel a t w hich t he ne xt hi ghest g roup
began. For example, developed countries began the period with an average HDI of 0.80. In 2005
High HDI countries only barely surpass this level at 0.83. Similarly, Low HDI countries in 2005
are still below where Medium HDI countries began in 1970. This pattern is most pronounced in
the income dimension where Low HDI countries actually experienced a 7% drop. Medium and
High HDI countries had a nearly 20% increase of the income index and developed countries a
16% i ncrease. T his t rend i s i n c ontrast t o t he ot her di mensions w here Low HDI countries
improved t heir e ducation i ndex b y ne arly 130% a nd t heir h ealth i ndex b y ov er 50% . As w e
discuss in more detail below, poorer countries appeared to grow faster than rich countries in the
health and education dimensions.
shows how population-weighted regional average HDI and its components have moved
since 1970. 6
LAC has the second highest levels of HDI among developing regions. While the region has had
only modest income growth, life expectancy and education have increased steadily. African life
expectancy was increasing from 1970 to 1990, but growth slowed as AIDS began to take its toll
in the r egion. A nd w hile i ncome growth r emained l ow, e ducation ha s grown qui ckly and ha s
The m ost c onsistent pa ttern i s t hat de veloped c ountries ha ve ha d s teady upw ard
growth i n a ll di mensions t hroughout t he pe riod. D eveloping E uropean countries ( which a re
primarily eastern European countries) nearly match the growth and levels of developed countries
in the education index, but life expectancy has remained mostly level since the beginning of the
period and in 2005 i s below that of China and LAC. After faltering in the early 1990s with the
fall of the Soviet Union, GDP growth has resumed a positive trend.
5 HDI groups are categorized according to their official 2007 HDI as published by the HDRO in the 2009 HDR. That is, the group of countries that comprise ‘Very high HDI’ countries in 1970 is the same as in 2005. 6 Figure 4 and Figure 5 depict developed countries, China, and India separately.

15
nearly reached the same level as Asia (excluding China and India) in 2005. Developing Asian
countries (excluding China) began at roughly the same level of HDI as Africa in 1970 but have
risen slightly higher since. While Africa has closed the gap in education, Asia has grown faster in
both the health and income dimensions. China’s rapid rise in income is well-known and apparent
in Figure 4. A fter be ginning w ith a n i ncome i ndex be low t hat of A frica i n 1970, i t ha s now
surpassed both Africa and Asia and is on pace to reach similar levels as LAC and Europe. While
China’s income growth has been most striking, the country has also had significant growth in the
other two dimensions. The education index is nearly at the same level as Europe and developed
countries, and the health index is about even with that of LAC and is second only to developed
countries.
Figure 6 illustrates how developing regions are performing relative to developed countries. The
graphs show the ratio of the indexes of the indicated developing regions to developed countries.7
3.2.2 Convergence
One not able r esult of t his f igure i s t hat a ll r egions a ppear t o be c losing t he e ducation g ap,
although A frica a nd A sia s till l ag f ar be hind C hina, E urope, a nd LAC. India h as s een
acceleration in closing the education gap since around 1995. The life expectancy gap in Europe
has been progressively widening, but income is improving since falling behind in the 1990s. The
African income gap has been increasing until about 2000 w hen i t began to level. Again, AIDS
caused reductions in life expectancy after 1990.
In t his s ection, w e ex amine each m easure o f growth d iscussed in 3.1.1 to s ee i f w e r each
different conclusions depending on how we define performance. Since we want to focus on how
boundedness can affect our conclusions, we discuss the HDI components in terms of their actual
data rather than as indexes.
7 For example, a value of 1 indicates that a region has the same value in a particular index as that of developed countries. A value of 0.5 indicates the index is half that of developed countries.
16
In Figures 7 to 11, we plot the initial levels of HDI and its components against each of the four
growth measures by region.8
At first glance, the first two panels of
The first panel shows the simple difference in levels between 2005
and 1970. The second panel shows the average annual growth rate from 1970 to 2005. The third
panel shows the log transform. And the fourth panel shows the deviation from the fitted line of a
bivariate regression of annual growth on initial levels.
Figure 7 seem to indicate that methods (1) and (2) yield a
pattern of convergence. However, method (3)—the log t ransformation—is upward s loping and
appears t o s how di vergence. T hat i s, c ountries w ith l ower ( higher) i nitial l evels of H DI ha ve
lower (higher) growth rates over the 35-year period. Method (4) is flat. Finding divergence in the
third panel is an unexpected result, so we look further at the sub-components to see what might
be driving this outcome.
We do not calculate a l og transform for GDP, but Figure 8 does show that income shows little
sign of convergence in the other three measures. While method (1) appears to be an inappropriate
measure of income convergence due to the large variability among countries, methods (2) and
(4) in dicate th at a country’s in itial in come level in 1 970 h ad litt le b earing o n its g rowth r ates
over the next 35 years. On the other hand, l iteracy, l ife expectancy, and gross enrolment each
show strong convergence in the first two panels. In Figure 11, it is evident that Africa’s low life
expectancy growth is reducing the slope of the trend line for the whole, so we include a second
trend l ine t hat ex cludes Africa. O mitting Africa from th e s ample yields a more r obust he alth
convergence for t he other r egions i n each of t he four measures. These results suggest that the
divergence de picted i n panel 3 of Figure 7 is likely a ttributable to the l ack o f co nvergence i n
income. Many r ich c ountries a re a mong th e f astest g rowers o f in come. T heir f ast g rowth is
magnified by the log transform calculation and disproportionately affects the trend line.
By our measures, we conclude that there has been convergence in the non-income components of
the H DI from 1970 t o 2005. In S ection 5 w e di scuss s everal pot ential dr ivers of t his
convergence. But f irst w e pr ovide a m ore de tailed de scriptive a nalysis of H DI t rends. For
8 As discussed above, we do not calculate a log transform for GDP per capita.
17
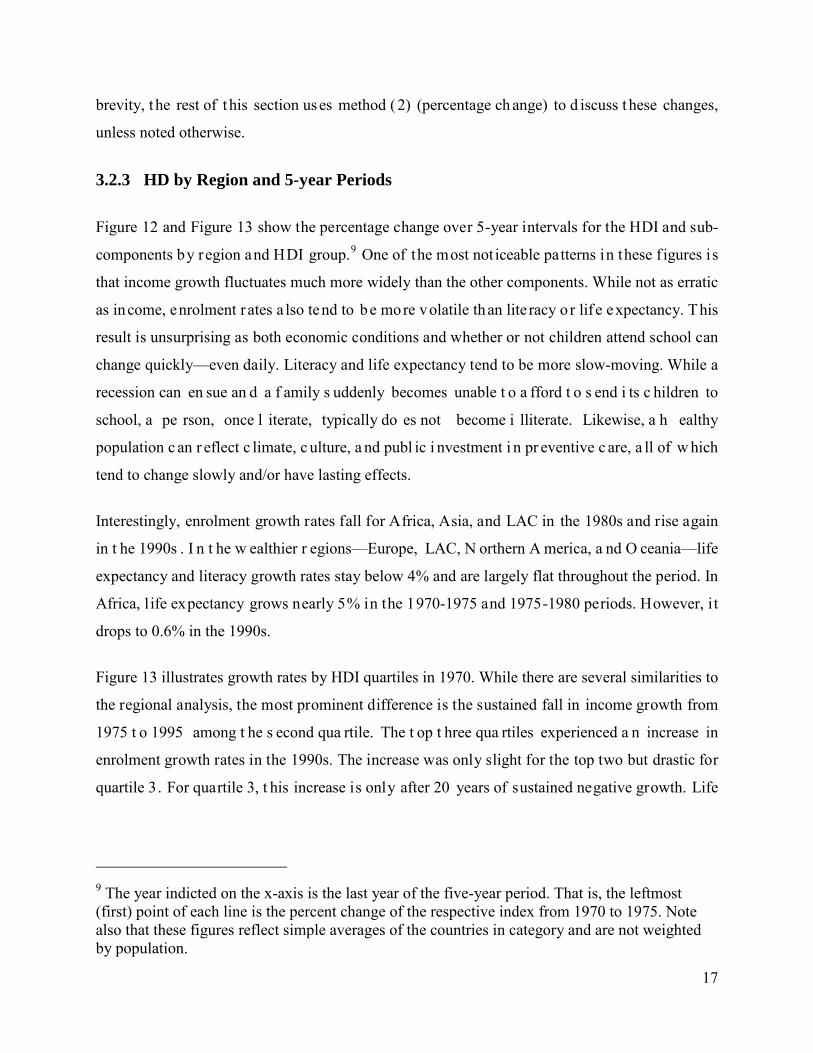
brevity, t he rest of t his section uses method (2) (percentage ch ange) to d iscuss t hese changes,
unless noted otherwise.
3.2.3 HD by Region and 5-year Periods
Figure 12 and Figure 13 show the percentage change over 5-year intervals for the HDI and sub-
components by region and HDI group.9
Interestingly, enrolment growth rates fall for Africa, Asia, and LAC in the 1980s and rise again
in t he 1990s . I n t he w ealthier r egions—Europe, LAC, N orthern A merica, a nd O ceania—life
expectancy and literacy growth rates stay below 4% and are largely flat throughout the period. In
Africa, l ife expectancy grows nearly 5% in the 1970-1975 and 1975-1980 periods. However, it
drops to 0.6% in the 1990s.
One of the most not iceable patterns in these f igures is
that income growth fluctuates much more widely than the other components. While not as erratic
as income, enrolment rates a lso tend to be more volatile than lite racy o r lif e expectancy. This
result is unsurprising as both economic conditions and whether or not children attend school can
change quickly—even daily. Literacy and life expectancy tend to be more slow-moving. While a
recession can en sue an d a f amily s uddenly becomes unable t o a fford t o s end i ts c hildren to
school, a pe rson, once l iterate, typically do es not become i lliterate. Likewise, a h ealthy
population c an r eflect c limate, c ulture, a nd publ ic i nvestment i n pr eventive c are, a ll of w hich
tend to change slowly and/or have lasting effects.
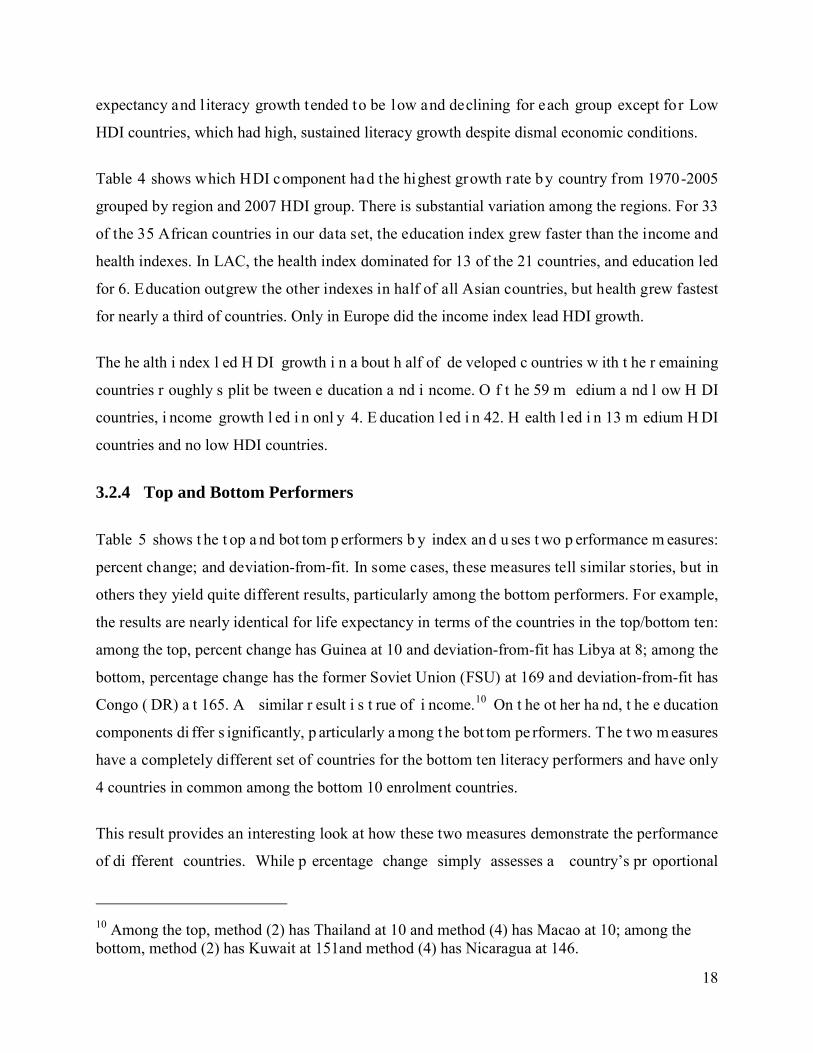
Figure 13 illustrates growth rates by HDI quartiles in 1970. While there are several similarities to
the regional analysis, the most prominent difference is the sustained fall in income growth from
1975 t o 1995 among t he s econd qua rtile. The t op t hree qua rtiles experienced a n increase in
enrolment growth rates in the 1990s. The increase was only slight for the top two but drastic for
quartile 3. For quartile 3, t his increase is only after 20 years of sustained negative growth. Life
9 The year indicted on the x-axis is the last year of the five-year period. That is, the leftmost (first) point of each line is the percent change of the respective index from 1970 to 1975. Note also that these figures reflect simple averages of the countries in category and are not weighted by population.
18
expectancy and l iteracy growth tended to be low and declining for each group except for Low
HDI countries, which had high, sustained literacy growth despite dismal economic conditions.
Table 4 shows which HDI component had the highest growth rate by country from 1970-2005
grouped by region and 2007 HDI group. There is substantial variation among the regions. For 33
of the 35 African countries in our data set, the education index grew faster than the income and
health indexes. In LAC, the health index dominated for 13 of the 21 countries, and education led
for 6. Education outgrew the other indexes in half of all Asian countries, but health grew fastest
for nearly a third of countries. Only in Europe did the income index lead HDI growth.
The he alth i ndex l ed H DI growth i n a bout h alf of de veloped c ountries w ith t he r emaining
countries r oughly s plit be tween e ducation a nd i ncome. O f t he 59 m edium a nd l ow H DI
countries, i ncome growth l ed i n onl y 4. E ducation l ed i n 42. H ealth l ed i n 13 m edium H DI
countries and no low HDI countries.
3.2.4 Top and Bottom Performers
Table 5 shows t he t op a nd bot tom p erformers b y index an d u ses t wo p erformance m easures:
percent change; and deviation-from-fit. In some cases, these measures tell similar stories, but in
others they yield quite different results, particularly among the bottom performers. For example,
the results are nearly identical for life expectancy in terms of the countries in the top/bottom ten:
among the top, percent change has Guinea at 10 and deviation-from-fit has Libya at 8; among the
bottom, percentage change has the former Soviet Union (FSU) at 169 and deviation-from-fit has
Congo ( DR) a t 165. A similar r esult i s t rue of i ncome.10
This result provides an interesting look at how these two measures demonstrate the performance
of di fferent countries. While p ercentage change simply assesses a country’s pr oportional
On t he ot her ha nd, t he e ducation
components di ffer s ignificantly, p articularly a mong t he bot tom pe rformers. T he t wo m easures
have a completely different set of countries for the bottom ten literacy performers and have only
4 countries in common among the bottom 10 enrolment countries.
10 Among the top, method (2) has Thailand at 10 and method (4) has Macao at 10; among the bottom, method (2) has Kuwait at 151and method (4) has Nicaragua at 146.

19
improvement r elative to its in itial le vel, deviation-from-fit co mpares each country t o ot her
countries that began at a similar position. Deviation-from-fit also yields favorable results for the
High a nd V ery High H DI countries th at f all a mong th e b ottom te n f or lite racy b y percentage
change. Instead, the deviation-from-fit method results in many of the poorest countries showing
the g reatest under-performance. Regardless o f m easurement, t here are m any d ifferences i n t he
top/bottom pe rformers w hen c omparing a cross t he H DI and i ts s ubcomponents. The t op l ife
expectancy performers fall into three, rough geographic clusters: Bhutan, Nepal, and Bangladesh
are i n s outhern A sia, be tween India a nd t he H imalayas; Y emen, Oman, W estern S ahara, an d
Libya are predominantly Arab north Africa/Middle Eastern countries; and Viet Nam, Indonesia,
and T imor-Leste ar e i n Southeast Asia. The bottom t en ar e al l s ub-Saharan African countries,
many of which have for years struggled with AIDS and/or violent conflict.
An i nteresting group of countries c omprise t he t op g ross e nrolments ra te p erformers, namely,
Australia, New Zealand, and Denmark. These countries had high enrolment rates even among the
wealthiest c ountries in 1970, ranging from 0.71 t o 0.75 a nd r anking s econd, t hird, a nd ni nth,
respectively. B y 2005 they ha d t he first, s econd, a nd f ourth hi ghest e nrolments r ates of a ll
countries with enrolment rates exceeding 1. Nepal and Bhutan also make this list along with Viet
Nam’s n eighbor, C ambodia. T he r emaining f our c ountries a re t he s ub-Saharan c ountries of
Liberia, E thiopia, Burkina Faso, and Mali. As with l ife expectancy, the bot tom ten performers
are all sub-Saharan African countries. This is a surprising result since—as Figure 12 shows and
section 3.2.3 discusses—Africa on average ha d hi gher enrolment growth r ates t han a ny ot her
region. Indeed, t he bot tom pe rformers a ccording t o m ethod ( 2) s how half as m any A frican
countries. However, the regional discussion above included North African countries in the Africa
average. These countries—along with the four sub-Saharan countries in the top group—may be
driving the regional average. By method (2), six of the top ten are sub-Saharan countries.
The top literacy performers are also dominated by sub-Saharan countries, which comprise seven
of the top ten. The other three are Yemen and Oman—neighbors on the Arabian peninsula—and
Nepal, which makes the top ten list for every index except income by both method (2) and (4).
The bot tom ten is a diverse mix of countries including the island nation of Comoros (between
Mozambique a nd M adagascar), Iraq, t wo LAC c ountries ( Nicaragua a nd Belize), t hree
20
south/southeast A sian c ountries ( Bangladesh, C ambodia, a nd P apua New G uinea), a nd t hree
African countries (Zambia, Mozambique, and Mauritania).
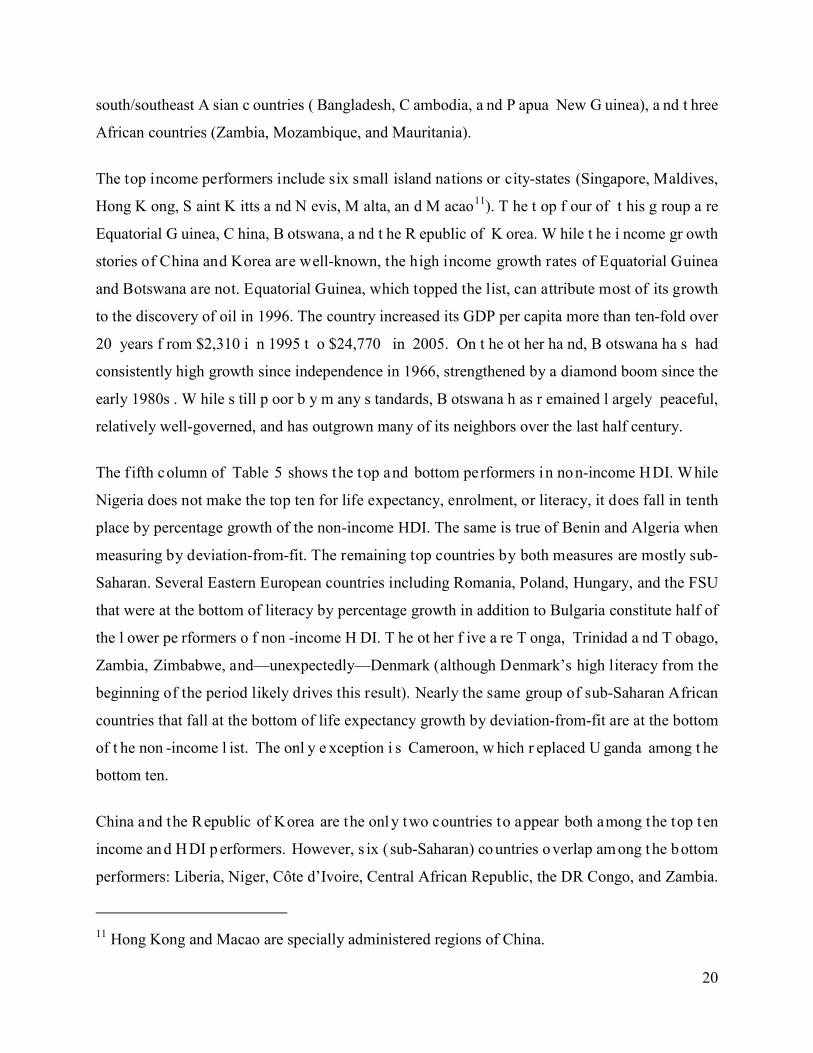
The top income performers include six small island nations or city-states (Singapore, Maldives,
Hong K ong, S aint K itts a nd N evis, M alta, an d M acao11
The f ifth column of
). T he t op f our of t his g roup a re
Equatorial G uinea, C hina, B otswana, a nd t he R epublic of K orea. W hile t he i ncome gr owth
stories of China and Korea are well-known, the high income growth rates of Equatorial Guinea
and Botswana are not. Equatorial Guinea, which topped the list, can attribute most of its growth
to the discovery of oil in 1996. The country increased its GDP per capita more than ten-fold over
20 years f rom $2,310 i n 1995 t o $24,770 in 2005. On t he ot her ha nd, B otswana ha s had
consistently high growth since independence in 1966, strengthened by a diamond boom since the
early 1980s . W hile s till p oor b y m any s tandards, B otswana h as r emained l argely peaceful,
relatively well-governed, and has outgrown many of its neighbors over the last half century.
Table 5 shows the top and bottom performers in non-income HDI. While
Nigeria does not make the top ten for life expectancy, enrolment, or literacy, it does fall in tenth
place by percentage growth of the non-income HDI. The same is true of Benin and Algeria when
measuring by deviation-from-fit. The remaining top countries by both measures are mostly sub-
Saharan. Several Eastern European countries including Romania, Poland, Hungary, and the FSU
that were at the bottom of literacy by percentage growth in addition to Bulgaria constitute half of
the l ower pe rformers o f non -income H DI. T he ot her f ive a re T onga, Trinidad a nd T obago,
Zambia, Zimbabwe, and—unexpectedly—Denmark (although Denmark’s high literacy from the
beginning of the period likely drives this result). Nearly the same group of sub-Saharan African
countries that fall at the bottom of life expectancy growth by deviation-from-fit are at the bottom
of t he non -income l ist. The onl y e xception i s Cameroon, w hich r eplaced U ganda among t he
bottom ten.
China and the Republic of Korea are the only two countries to appear both among the top ten
income and HDI p erformers. However, s ix ( sub-Saharan) countries overlap am ong t he bottom
performers: Liberia, Niger, Côte d’Ivoire, Central African Republic, the DR Congo, and Zambia.
11 Hong Kong and Macao are specially administered regions of China.

21
A l ongstanding i ssue in t he l iterature i s w hether e conomic growth pr ecedes, happens
simultaneously, or follows social ach ievements. R anis and S tewart (2007) look a t HD and the
rate of economic growth in terms of virtuous and vicious cycles over a forty year period (1960-
2001). A ‘virtuous’ cycle is one where high economic growth reinforces high HDI or high HDI
reinforces economic g rowth. ‘Vicious’ cycles are the oppos ite. Ranis an d S tewart (2007) find
that H DI a nd economic g rowth a re reinforcing, but t hat t here a re ve ry f ew c ases of vi rtuous
growth. T he few ex amples i nclude Korea a nd S ingapore over the entire 40-year p eriod, a nd
China, Malaysia, Viet Nam and Chile over shorter spans. The few instances of virtuous cycles
provide some explanation why there is little overlap among the top education/health performers
and the top i ncome p erformers. Similarly, t he p revalence o f v icious cycles can ex plain why a
similar group of countries makes up the bottom performers in both income and HDI.
3.2.5 Considering Population
In t he pr evious t wo s ections, w e c onsider c ountries a s e qual uni ts w ithout taking i nto
consideration their s ize. When we include population, we see that a small handful of countries
tend to dominate the picture. As Figure 14 shows, developed countries comprise 15% of global
population and the FSU, 4%. This portion is roughly equivalent to China, which is itself a fifth of
the global population. India is slightly larger than all developed countries combined at 17%. The
next five biggest countries—Indonesia, Brazil, Pakistan, Bangladesh, and Nigeria—comprise an
additional 13%. The remaining 31% of the world’s people a re in one o f 138 other developing
countries, mostly in Africa and Asia.
In Table 4, w e s ee H DI and i ts s ubcomponents b y population group i n 2005. 12
12 All numbers in
Developed
countries a re 0.10 H DI poi nts a bove t he ne xt highest group, developing E urope. A ll of t he
world’s l argest c ountries ( about 70 % of w orld p opulation) c an be categorized i n t he M edium
HDI group or hi gher. D eveloped c ountries, FSU, C hina, Indonesia, and Brazil ( 46% of w orld
population) ha ve H DIs above 0.70. T he s ame group of c ountries a lso ha s literacy r ates ab ove
89%.
Table 4 are population-weighted.
22
The de scriptive t rends reported in th is s ection f it in to a lo nger te rm s tory of p rogress i n l ife
expectancy, education and income. We now turn to the income and non-income determinants of
HDI pr ogress, and z oom i nto the i ndividual a nd hous ehold l evel f actors t hat e xplain
improvements in life-expectancy and l iteracy over t ime. The focus on de terminants also draws
our attention to the way income relates to other dimensions of well-being.
4 DETERMINANTS OF HUMAN DEVELOPMENT TRENDS
In this section we address determinants of HDI change. We start by testing whether changes in
human d evelopment e xhibit a bsolute or c onditional c onvergence in t he s ense d escribed b y
Robert Barro for economic growth across countries (Barro 1991; Barro and Sala-i-Martin 1992).
We discuss some of the methodological differences between the economic growth literature and
our f indings. We t hen perform a cr oss-sectional r egression an alysis c omparing years at t he
beginning a nd e nd of o ur s ample. F inally, w e examine w hether “ institutions r ule” H DI as
Rodrik, Subramanian, and Trebbi (2004) have found they do for income.
4.1 HDI and the Barro Growth Model
In this section we test the explanatory power of a s imple ‘Barro-style’ growth model for HDI.
We begin by comparing a classic economic growth convergence estimate for income, HDI, and
the non-income components of HDI. We begin by estimating the following regression:
ln(INC2005,i / INC1970,i) = b0 + b1(INC1970,i) + b2(FEMSCH1970,i ) + b3(LE1970,i ) + b4(TRADEi)
+ b5(INFLi) + b6(GOVi) + ei
Where INCt,i is.GDP per capita in year t and country i, FEMSCH is the ratio of female literacy to
male literacy, LE i s l ife expectancy, TRADE i s average merchandise t rade as a s hare o f GDP
from 1970 to 2005, INFL is average inflation from 1970 to 2005, GOV is the average Polity IV
index over the same period, and e is an iid error term.
In Table 7, we begin by running the above specification on i ncome in columns (1) and (4). We
find that in the more typical Barro model in column (1) (omitting education and life expectancy)
23
inflation a nd g overnance ha s e xplanatory pow er not pr esent i n c olumn ( 2), w here H DI i s t he
dependent v ariable. In column ( 2) i nflation i s insignificant, and governance h as a n egative
coefficient. Unlike for HDI and its non-income components (column (3)), initial income level is
not a n e ffective pr edictor of i ncome growth from 1970 t o 2005. W hen e ducation and l ife
expectancy ar e i ncluded, i nitial i ncome a ppears t o g ain s ome ef fect. Trade, i nflation, a nd
governance lose statistical significance.
The above exercise draws on t heory developed to explain income growth, which is modeled by
the Barro specification. While we explore what might be a more appropriate empirical model for
non-income H D di mensions be low, there i s r oom t o s peculate on w hat a long-run m odel of
human de velopment looks l ike, a nd w hether o r not t o us e s ome of t he assumptions f rom t he
economic growth literature.
4.2 Cross-Sectional Analysis
In this section we perform a cross-sectional analysis of the non-income components comparing
1970 and 2000. We estimate the equation
Yt,i = b0 + b1(DEMt,i) + b2(EDt,i ) + b3(INC t,i ) + b4(HLTH t,i) + b5(WATER t,i) + b6(GOV t,i) + ei
where Y t,i is our c omponent ( life ex pectancy, literacy, o r e nrolment) i n year t for c ountry i,
DEM is a vector of demography variables, ED is education,13
In
INC is income, HLTH is health,
TECH is technology, and GOV is governance. We measure demography using fertility rates and
share of population in urban areas. For income we use GDP per capita. Education is measured by
literacy an d ratio of f emale to ma le lite racy. For l ife e xpectancy, w e i nclude H IV a s t he onl y
health measure. For l iteracy, we include l ife expectancy. WATER is measured by the share o f
population with access to adequate sanitation or clean water.
Table 8 we show the results of the above specification. We see that low fertility is a good
predictor of high life expectancy for all years and groups of countries. While HIV/AIDS was not
yet a major problem in 1970, the virus had a highly significant, negative effect on life expectancy
13 Education variables are omitted when literacy or enrolment is the dependent variable.

24
in 2000. Water and income were important factors for all countries in both 1970 and 2000. When
the popul ation of literate w omen was cl oser to or e xceeded t hat of m ales, c ountries t ended t o
have higher life expectancy in 1970. However, this relationship disappears in 2000.
More ur ban c ountries ha d hi gher l iteracy i n 19 70, but t his c orrelation vanishes in 2000. For
enrolment, ur banization i s pos itive a nd s tatistically s ignificant onl y i n 2 000. Oddly, acc ess t o
water ha d a n egative e ffect on l iteracy i n de veloping c ountries i n 1970 a nd 2000. A ccess t o
adequate sanitation has a positive, significant effect for both groups of countries in 2000. Water
and s anitation b oth a re s tatistically in significant f or e nrolment. G overnance h as a s tatistically
significant and positive effect for developing countries in 2000.
Our analysis shows the general pattern that what is true for developing countries tends to be true
for all countries. However, we are constrained by our sample size in this respect, as we have only
seven developed countries in our life expectancy regressions and nine in literacy. While income
is jointly significant with water and sanitation for life expectancy and for developing countries in
2000, now here i s i t i ndependently s ignificant a nd i ts j oint s ignificance may be dr iven b y t he
water and s anitation variables. We a lso f ind th at female l iteracy had a greater i mpact o n life
expectancy in 1970 than 2000.
4.3 Do Institutions Rule HDI?
In t his s ection w e t est f our h ypotheses on h uman de velopment p rogress, c orrecting f or
endogeneity. The first three hypotheses emerge from the larger economic development literature.
Following R odrik, S ubramanian, a nd T rebbi ( 2004), w e t est w hether geography, t rade and
institutions h ave a s tatistically s ignificant effect on human de velopment. A s i s c ommon w hen
attempting to identify causal relationships, income regressions tend to be rife with endogeneity.
In or der t o ove rcome t his pr oblem, R odrik, e t al e mploy an i nstrumental va riables approach.
They instrument the three variables with measures of rule of law, distance from the equator and
the Sachs-Warner openness index, respectively. While distance is clearly exogenous, European
settler mo rtality rates ( ESMR) a nd th e g eography-based F rankel-Romer i ndex ar e u sed as
instruments f or in stitutions a nd tr ade. We ad d the r atio o f female literacy to t heir m odel, a nd
using OLS, we estimate the following empirical specification:
25
INCi = b0 + b1(FEMSCH) + b2(INST)i + b3(TRADE)i + b4(GEO)i + ei
where INCi is GDP per capita for country i, INST i s rule o f l aw, TRADE i s the Sach-Warner
openness i ndex, GEO i s distance f rom t he e quator, and e is a n e rror t erm. Following D eaton
(2007), Cutler, D eaton an d Lleras-Muney ( 2005) a nd R anis, Stewart a nd S amman ( 2005), we
examine the gender dimension of child mortality reduction by including the ratio of the literate
female p opulation to th e lite racy m ale popu lation, FE MSCH. Deaton’s w ork on t he
determinants of c hild m ortality poi nts t o t he ne ed t o c ontrol bot h f or t echnological c hange i n
reducing child mortality and accounting for f emale l iteracy. We instrument for f emale literacy
using both the years s ince women received full r ights to vote and years since women received
full rights to run for office.
In Table 9, we report the above specification us ing OLS and 2SLS and use income, HDI, l ife
expectancy, an d l iteracy as d ependent va riables. T he m ost pr ominent r esult i s t hat female
schooling i s hi ghly s ignificant i n e very OLS specification, but none of t he 2S LS. This r esult
could b e d ue to th e f act th at years o f f emale s uffrage is a p oor in strument. S imilarly, w hile
geography appears to have explanatory power in the OLS regressions, its statistical significance
vanishes with the inclusion of rule of law in the 2SLS regressions with income as the dependent
variable, a nd i t i s now here s ignificant i n t he non -income r egressions.14 Table 9 reports t he
standardized coefficients of each variable, which a lso a llows us to compare the magnitudes of
the ef fects o f e ach channel. In e ach f ull m odel ( columns (4) and (8 )), the ef fect o f f emale
schooling is several times greater than that of institutions in both the OLS-income regression and
still 100% greater in the 2SLS-income regression. Female literacy alone dominates in the non-
income 2SLS regressions.
As we mention above, years of women’s political rights may be an unsatisfactory instrument. For
example, one can imagine a scenario where a country is sufficiently wealthy to provide everyone
access to education. Subsequently women—having been educated—become more aware of their
14 Separately, we use the same sample as Rodrik, et al (2004), which is restricted to countries with ESMR data, that is, former colonies. To expand the sample, we set ESMR to zero for former colonial power and former Soviet bloc countries. Qualitatively, the results in both samples are very similar.

26
political deprivation and empowered to lobby for their rights. In this case, wealth drives gender
equality. However, the in ability to c onstruct a ppropriate time -varying i nstruments pr events us
from drawing firm conclusions on what drives these movements.
5 CONCLUSIONS
This pa per r eviews t rends i n hum an de velopment s ince 1970, as m easured by t he H uman
Development Index (a composite index of income per capita, literacy, school enrolment and life
expectancy). We co nsider whether trends i n hum an de velopment ar e d ifferent fro m trends i n
economic growth, a nd whether de terminants of c hange are specific t o a hum an de velopment
model of growth. To answer these questions, we assemble a 111 country data set from 1970 t o
2005 that m akes H DI changes comparable bot h w ithin a nd b etween co untries. We f ind t hree
main results f rom the descriptive part of the paper. First, there i s evidence of poorer countries
catching-up with r ich countries, pa rticularly with r espect t o t he l ife-expectancy and l iteracy
dimensions. In addition, we find that the income and non-income components of HDI change are
uncorrelated, thus unde rmining t he c ommon vi ew t hat t hey oc cur j ointly. Second, a nd be hind
these av erages, w e f ind a great deal o f heterogeneity b y region, sub-component and p eriod of
reference. In our sample, only one country experiences a reversal in its human development level
over the 35-year period; 110 countries experience advances. Achievements are faster for the pre-
1990 period, and are faster in Asia and the Middle East throughout the whole period. Progress on
HDI achievements tends to be l iteracy-led, while progress in Asia tends to be l ife-expectancy-
led. Improvements in Latin America and Eastern Europe are mixed. These results contrast with
the c onventional po rtrait of de velopment pr ogress, largely inferred f rom the e conomic growth
literature. H uman d evelopment pr ogress is une ven within c ountries a nd f or different sub-
components of the index (see Grimm et al. 2009).
Third, w e f ind t hat t he s tory of out liers (high a nd l ow a chievers) i s s ensitive to alternative
measures of HDI progress. W e p resent top/bottom te n lis ts f or two measures o f ch ange: the
annualized rate of HDI change and deviations from a global HDI long-run trend. HDI progress is
fastest in Nepal, Bangladesh and Lao PDR. When measured by deviations from a long term HDI
trend, N epal, Indonesia and T unisia are t he s trongest p erformers. We a lso c ontrast t he t op 10
performers in HDI with the top 10 pe rformers for GDP per capita. The exercise h ighlights the

27
differences between growth-led and HDI-led development. The most rapid improvements in life-
expectancy and l iteracy are not occurring in the fastest growing economies of the world. They
are o ccurring i n a s ubset of l ower a nd m iddle i ncome c ountries i n A sia, t he M iddle E ast a nd
northern Africa. Closer work on t he high and low achievers is needed on a country-by-country
basis.
Three results emerge from the second part of the paper, focusing on determinants of HDI trends.
First, w e find e vidence of absolute and conditional c onvergence of hum an de velopment ove r
time. We borrow from the cross-country economic growth l iterature to test for convergence on
different specifications o f HDI progress. The exercise yields some in teresting insights into the
dynamics of hum an development ch ange. W e te st a lternative specifications of hum an
development progress in the remainder of the paper.
Does “income matter” as a driver of human development? We run a cross section regression on
the non-income components of the HDI (literacy and l ife-expectancy). We f ind that income is
not a s ignificant pr edictor of life ex pectancy --once w e a ccount f or urbanization, f ertility a nd
female s chooling. While cr oss-sectional a nalyses s ometimes s uggest th at le vels o f lif e
expectancy and literacy are really representing levels of income, our results indicate that drivers
of improvements in health and education differ from the forces that lead to income growth.
Finally, we test whether “gender matters” as a driver of human development, controlling both for
endogeneity a nd other de terminants of s tructural c hange. Here w e u se instruments for
institutions, geography, t rade and changes in gender relations. We find that neither institutions
(settler mortality rates, Acemoglu, Johnson and Robinson 2001) nor geography (distance f rom
Equator, Sachs an d Warner 1996 ), i s consistently statistically s ignificant f or d ifferent
specifications of HDI, life-expectancy and literacy progress.
Our birds-eye vi ew of human de velopment suggests that s ocial convergence i s s ignificant.
Human development trends from 1970 t o 2005 fit into a longer term trend of demographic and
population c hange. D emographic t ransitions, ur banization a nd d eclining f ertility rates have
accelerated life-expectancy an d literacy a chievements o ver th e p ast h alf-century ( UNDESA
2009). W e be lieve the underlying dr ivers of t hese ch anges are linked t o individual and

28
household-level decisions concerning fertility and female schooling. Although correlated, we do
not f ind e vidence t o s uggest t hat hum an de velopment t rends c an b e e xplained b y factors
associated with economic growth. Holding income constant, social factors seem to be driving the
aggregate hum an de velopment s tory. T wo i ssues r emain une xplored in t his pa per. T he f irst is
inequality (see F oster, Lopez-Calva and Szekely 2003 and Seth 2009). Further r esearch might
explore the regional and sub-dimension inequality observed in the descriptive trends, or focus on
the additional effects of inequality over overall HDI progress. The second issue is public policy.
Although we did not find policy variables to be significant in this paper, our focus on the long-
run doe s not pr eclude testing pol icy dr ivers a nd s hock f or shorter time r-intervals and f or
alternative subsets o f countries (see Ranis and S tewart 2007; Ocampo, Jomo and Khan 2007).
The story of successful and f ailed policy interventions i s likely t o be an important pa rt of t he
overall story of human development trends over time.
6 REFERENCES
Acemoglu, Daron, Simon Johnson, and James A. Robinson, 2001, "The Colonial Origins of
Comparative Development: An Empirical Investigation," American Economic Review,
91, 5, December 2001.
Alkire, Sabina, 2007, “The Missing Dimensions of Poverty Data: Introduction to the Special
Issue, Oxford Development Studies, Volume 35, Number 4, pp. 347-359. Barro, Robert,
1991, "Economic Growth in a Cross Section of Countries," Quarterly Joumal of
EconomicsMay 1991, 106, 407-43.
--- 2008, “Choosing Dimensions: The Capability Approach and Multidimensional Poverty,” in
Kakwani, Nanak and Jaques Silber (eds), The Many Dimensions of Poverty, p 89-119.
Basingstoke: Palgrave-MacMillan.
Barro, Robert, and Xavier Sala-i-Martin, 1992 "Convergence," Joumal of Political
Economy,April 1992, 100, 223-51.
Behrman, Jere and Rosenzweig, Mark. "Cross-Country Data on Education and the Labor Force."
Journal of Development Economics, Volume44, Number 1, 1994.

29
Bloom, D. E. and J. G. Williamson, 1998, "Demographic transitions and economic miracles in
emerging Asia." World Bank Economic Review 12(3): 419-455.
Bloom, D. E. and R. B. Freeman, 1987, "Population Growth, Labor Supply, and Employment in
Developing Countries." NBER Working Paper No. 1837, Cambridge, MA; NBER.
Bloom, D. E., D. Canning, et al., 2003, "The Demographic Dividend: A New Perspective on the
Economic Consequences of Population Change." RAND Monograph Report.
Bloom, David, David Canning, Gunther Frank and Jocelyn Finlay, 2007, “Fertility, Female
Labor Force Participation and the Demographic Dividend”, NBER Working Paper No.
13583, Cambridge, MA: NBER.
Chenery, Hollis B. 1960. “Patterns of Industrial Growth,” American Economic Review, Vol. 50,
no. 2, pp. 624-654.
Chenery, Hollis B. and Moshe Syrquin. 1975. Patterns of Development, 1950-1970. London:
Oxford University Press.
Comim, Flavio, Mozaffar Qizilbash and Sabina Alkire, 2008, The Capability Approach:
Concepts, Measures and Applications, Cambridge: Cambridge University Press.
Crafts, Nick, 1997, “The Human Development Index and changes in standards of living: some
historical perspectives”. European Review of Economic History, I, pp. 299–322.
Cutler, David, Angus Deaton and Adriana Lleras-Muney, 2006, “The Determinants of
Mortality”, Journal of Economic Perspectives, Volume 20, Number 3, pp. 97-120.
Deaton, Angus, 2007, “Global Patterns of Income and Health: Facts, Interpretations and
Policies”, WIDER Annual Lecture 10, Helsinki: UN-WIDER.
___, 2003, “Health, Inequality, and Economic Development,” Journal of Economic Literature,
41, 113-158.

30
___1998, “The Human Development Index: Some Technical Issues and Alternative Indices”,
Journal of International Development, 10: 589-605.
Deneulin, Severine and Lina Shahani, 2009, An Introduction to the Human Development and
Capability Approach: Freedom and Agency, London: Earthscan Publication
E. Foster, F.L. Lopez-Calva and M. Szekely, 2003, “Measuring the distribution of human
development: Methodology and application to Mexico”, UNDP, New York.
Fukuda-Parr, Sakiko and A.K. Shiva Kumar, 2003, Readings in Human Development: Concepts,
Measures and Policies for a Development Paradigm, Oxford: Oxford University Press.
Gladstone, Jack, 2010, “The New Population Bomb”, Foreign Affairs (Jan/Feb 2010). New
York: Council on Foreign Relations.
Grimm, M., Harttgen, K., Klasen, S., & Misselhorn, M., 2008, “A Human Development Index
by Income Groups”, World Development, 36(12), 2527–2546
Grimm, M., Harttgen, K., Klasen, S., & Misselhorn, M., T. Munzi, T. Smeeding, 2009,
“Inequality in Human Development: An Empirical Assessment of 32 Countries”, Soc
Indic Res DOI 10.1007/s11205-009-9497-7.
Kenny, Charles, 2005, “Why Are We Worried About Income? Nearly Everything that Matters is
Converging”, World Development Vol. 33, No. 1, pp. 1–19.
Noorbakhsh, Farhad, 2007, “International Convergence or Higher Inequality in Human
Development? Evidence for 1975-2002”, in George Mavrotas and Anthony Shorrocks,
2007, Advancing Development: Core Themes in Global Economics, London: Palgrave
Macmillan.
Ocampo, Jose Antonio, K.S. Jomo and Sarbuland Khan, 2007, Policy Matters: Economic and
Social Policies to Sustain Equitable Development, New York: Orient Longman, Zed
Books and Third World Network.

31
Preston, Samuel H, 1975, “The Changing Relation Between Mortality and Level of Economic
Development”, Population Studies, 29(2), July 1975, 231-248.
Pritchett, Lant, 1997, “Divergence, Big Time”, Journal of Economic Literature, Volume 11,
Number 3, pp. 3-17.
Quah, Danny, 1996, “Twin Peaks: Growth and Convergence in Models of Distribution
Dynamics”, The Economic Journal, Volume 106, Number 437, pp. 1045-1055.
Ranis, Gustav and Frances Stewart, 2007, “Dynamic Links Between the Economy and Human
Development”, in Jose Antonio Ocampo, K.S. Jomo and Sarbuland Khan, 2007, Policy
Matters: Economic and Social Policies to Sustain Equitable Development, New York:
Orient Longman, Zed Books and Third World Network.
Ranis, Gustav, Frances Stewart and Emma Samman, 2005, “Human Development: Beyond the
HDI”, Economic Growth Center Paper No. 916, New Haven: Yale University.
Raworth, Kate and David Stewart, 2002, “Critiques of the Human Development Index: A
Review”, in Fukuda-Parr, Sakiko and A.K. Shiva Kumar, 2003, Readings in Human
Development: Concepts, Measures and Policies for a Development Paradigm, Oxford:
Oxford University Press.
Rodriguez, Francisco, 2009, “What Does the Human Development Index Really Measure?”,
Freakonomics Blog, http://freakonomics.blogs.nytimes.com/2009/06/01/another-
perspective-on-the-human-development-index/#more-12489.
Sachs, Jeffrey and Andrew Warner, 1995, “Economic Reform and the Process of Global
Integration,” Brookings Papers on Economic Activity, 1995:1, 1-118.
Seth, Suman, 2009, “Inequality, Interactions, and Human Development”. Journal of Human
Development, Vol. 10, No. 3, 375-396.
Srinivasan, T. N., 1994, “Human Development: A New Paradigm or Reinvention of the Wheel?”
American Economic Review, Volume 84, Number 2: pp. 238-243.

32
Timmer, Peter and Selvin Akkus, 2008, “The Structural Transformation as a Way Out of
Poverty: Analytics, Empirics and Politics”, Center for Global Development Working
Paper No. 150, Washington, DC: CGD.
Ul Haq, Mahbub, 1995, “The Birth of the Human Development Index”, in Fukuda-Parr, Sakiko
and A.K. Shiva Kumar, 2003, Readings in Human Development: Concepts, Measures
and Policies for a Development Paradigm, Oxford: Oxford University Press.
UNDESA, 2009, World Population Prospects: The 2008 Revision, New York: United Nations
Department of Social and Economic Affairs.
Whitehead, Laurence and Gray Molina, George, 2003, “Political Capabilities over the Long
Run” in Peter Houtzager and Mick Moore (editors), Changing Paths: International
Development and the New Politics of Inclusion, Ann Arbor: University of Michigan
Press.
Wolfers, Justin, 2009, “What does the Human Development Index Measure?” Freakonomics
Blog, http://freakonomics.blogs.nytimes.com/2009/05/22/what-does-the-human-
development-index-measure/.
Zavaleta, Diego, 2007, “The ability to go about without shame: a proposal for international
comparable indicators on shame and humiliation”. Oxford Development Studies, Volume
35, Issue 4 (2007).
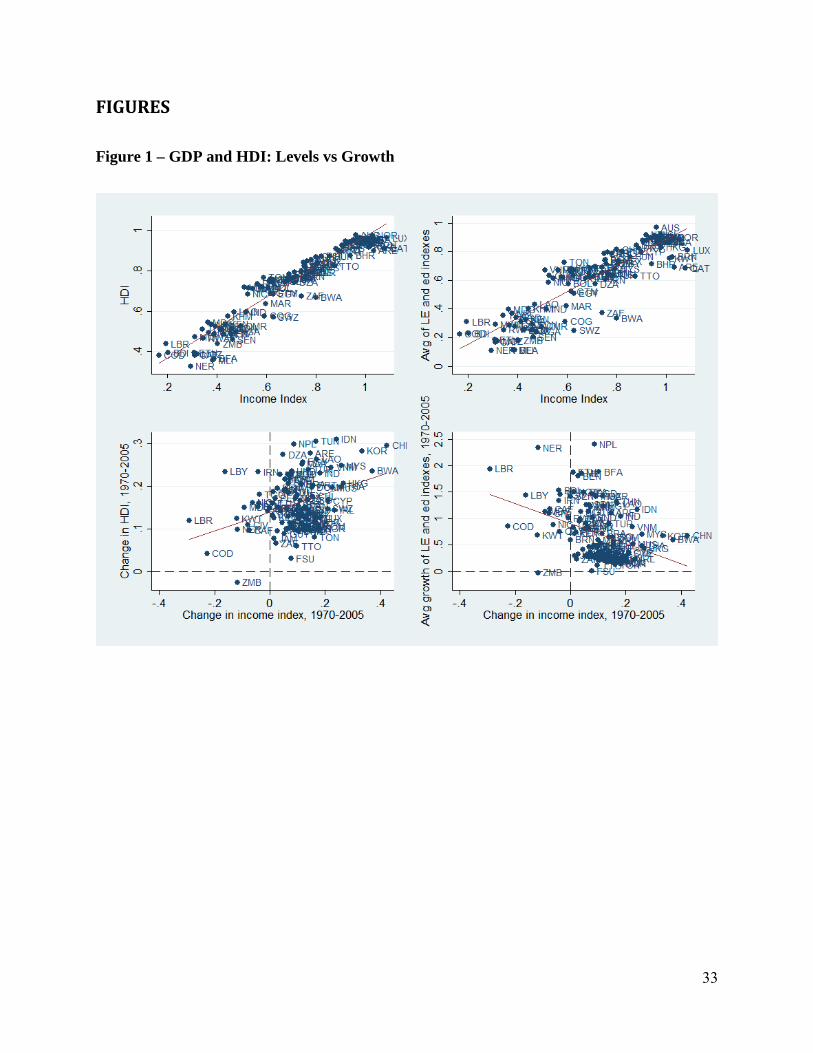
33
FIGURES
Figure 1 – GDP and HDI: Levels vs Growth
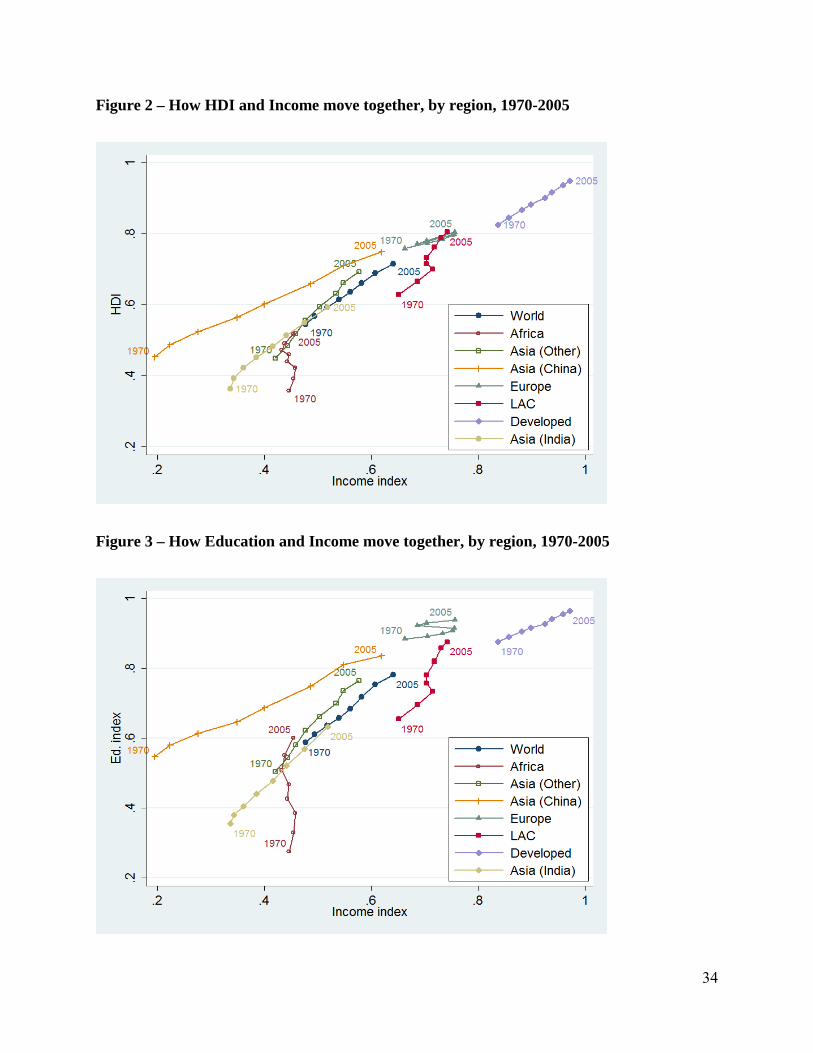
34
Figure 2 – How HDI and Income move together, by region, 1970-2005
Figure 3 – How Education and Income move together, by region, 1970-2005
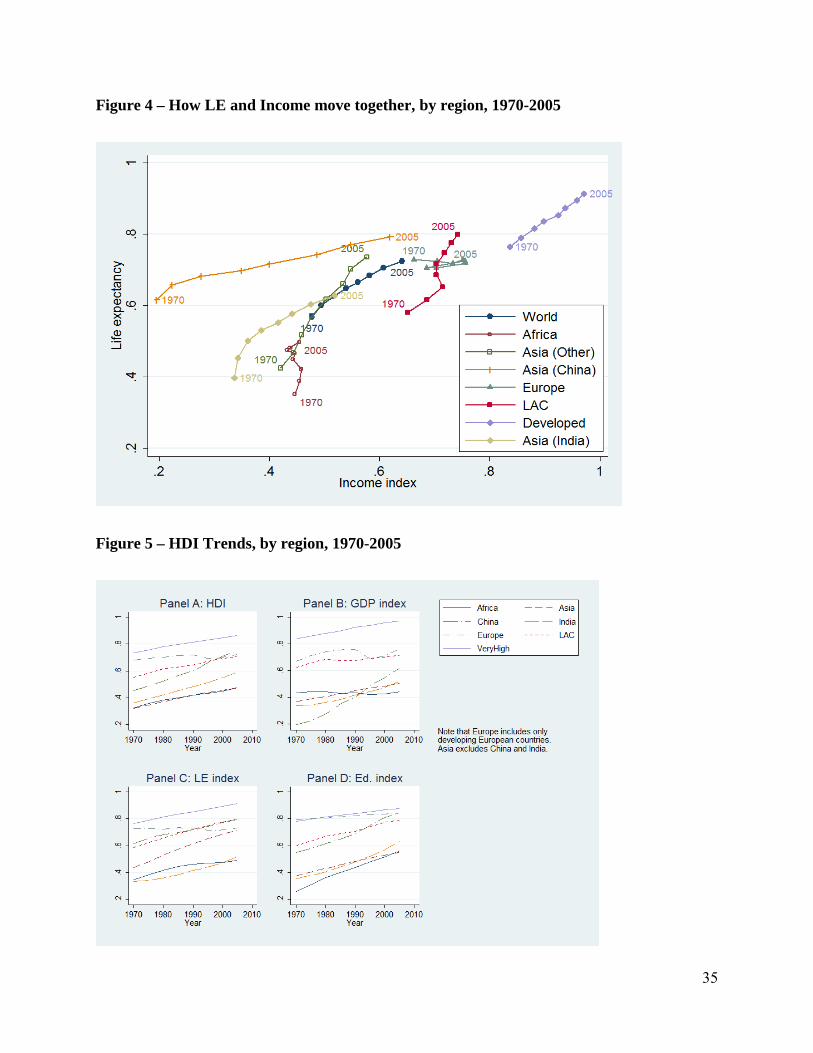
35
Figure 4 – How LE and Income move together, by region, 1970-2005
Figure 5 – HDI Trends, by region, 1970-2005

36
Figure 6 – Developed vs Developing Achievement Ratios, by region, 1970-2005
Figure 7 – HDI by Performance measure, by region, 1970-2005
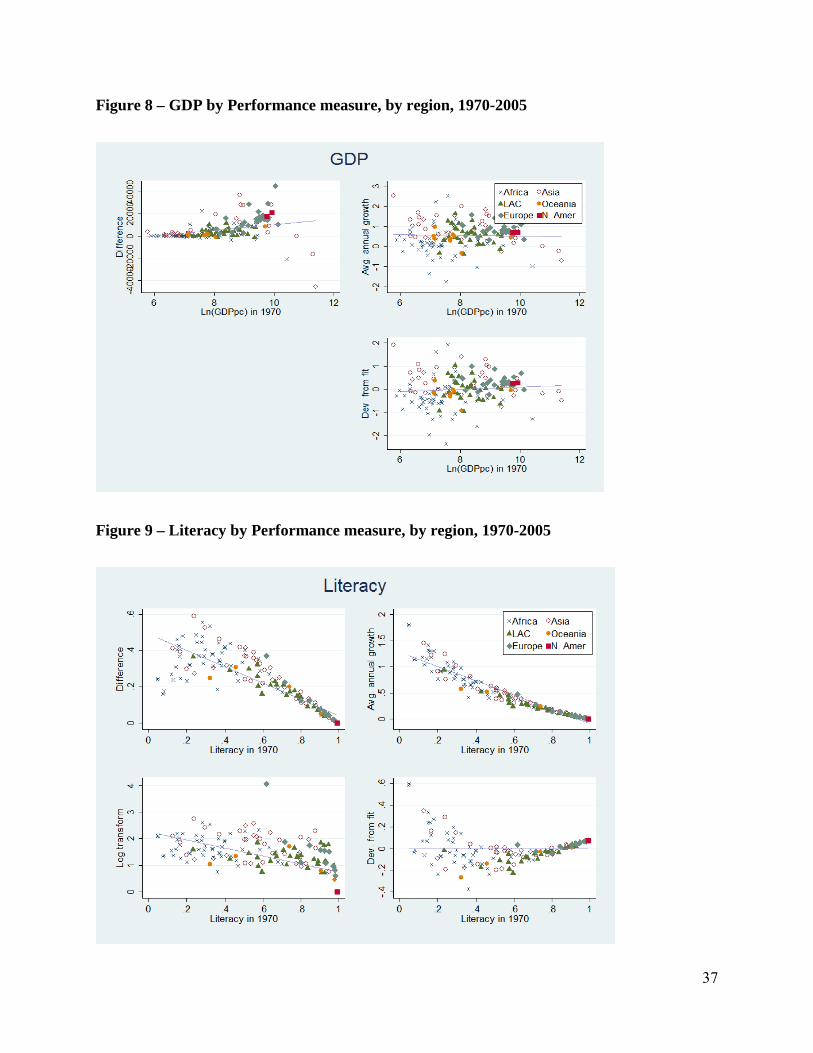
37
Figure 8 – GDP by Performance measure, by region, 1970-2005
Figure 9 – Literacy by Performance measure, by region, 1970-2005

38
Figure 10 – Enrolment by Performance measure, by region, 1970-2005

39
Figure 11 – Life Expectancy by Performance measure, by region, 1970-2005
Without Africa
With Africa

40
Figure 12 – HDI and component growth rates, by region, 1970-2005
-8%
-4%
0%
4%
8%
12%
16%
20%
1975 1980 1985 1990 1995 2000 2005
Africa
LE GER Literacy
GDP pc HDI
-8%
-4%
0%
4%
8%
12%
16%
20%
1975 1980 1985 1990 1995 2000 2005
Asia
LE GER Literacy
GDP pc HDI
-8%
-4%
0%
4%
8%
12%
16%
20%
1975 1980 1985 1990 1995 2000 2005
Europe
LE GER Literacy
GDP pc HDI
-8%
-4%
0%
4%
8%
12%
16%
20%
1975 1980 1985 1990 1995 2000 2005
LAC
LE GER Literacy
GDP pc HDI
-8%
-4%
0%
4%
8%
12%
16%
20%
1975 1980 1985 1990 1995 2000 2005
Northern Am.
LE GER Literacy
GDP pc HDI
-8%
-4%
0%
4%
8%
12%
16%
20%
1975 1980 1985 1990 1995 2000 2005
Oceania
LE GER Literacy
GDP pc HDI

41
Figure 13 – HDI and component growth rates, by HDI Group, 1970-2005
-16%
-12%
-8%
-4%
0%
4%
8%
12%
16%
20%
24%
28%
32%
1975 1980 1985 1990 1995 2000 2005
Top Quartile
LE GER Literacy
GDP pc HDI
-16%
-12%
-8%
-4%
0%
4%
8%
12%
16%
20%
24%
28%
32%
1975 1980 1985 1990 1995 2000 2005
Second Quartile
LE GER Literacy
GDP pc HDI
-16%
-12%
-8%
-4%
0%
4%
8%
12%
16%
20%
24%
28%
32%
1975 1980 1985 1990 1995 2000 2005
Third Quartile
LE GER Literacy
GDP pc HDI
-16%
-12%
-8%
-4%
0%
4%
8%
12%
16%
20%
24%
28%
32%
1975 1980 1985 1990 1995 2000 2005
Bottom Quartile
LE GER Literacy
GDP pc HDI
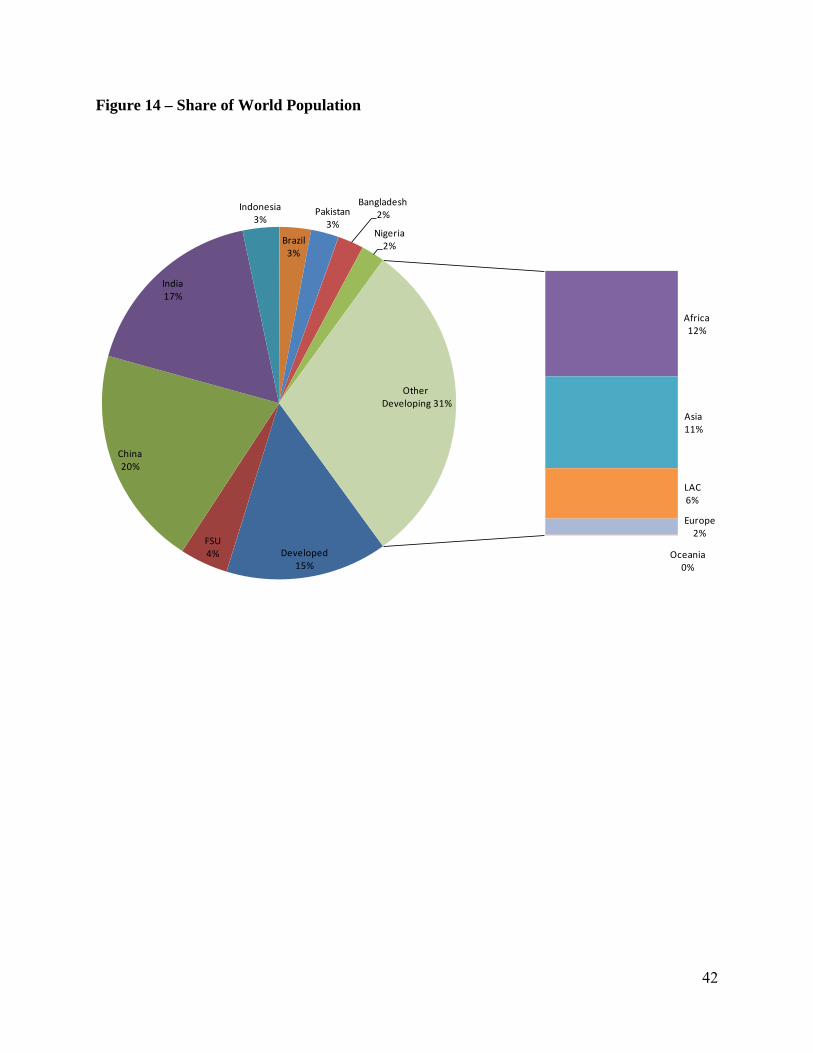
42
Figure 14 – Share of World Population
Developed15%
FSU4%
China20%
India17%
Indonesia3%
Brazil3%
Pakistan3%
Bangladesh2%
Nigeria2%
Africa12%
Asia11%
LAC6%
Europe2%
Oceania0%
OtherDeveloping 31%
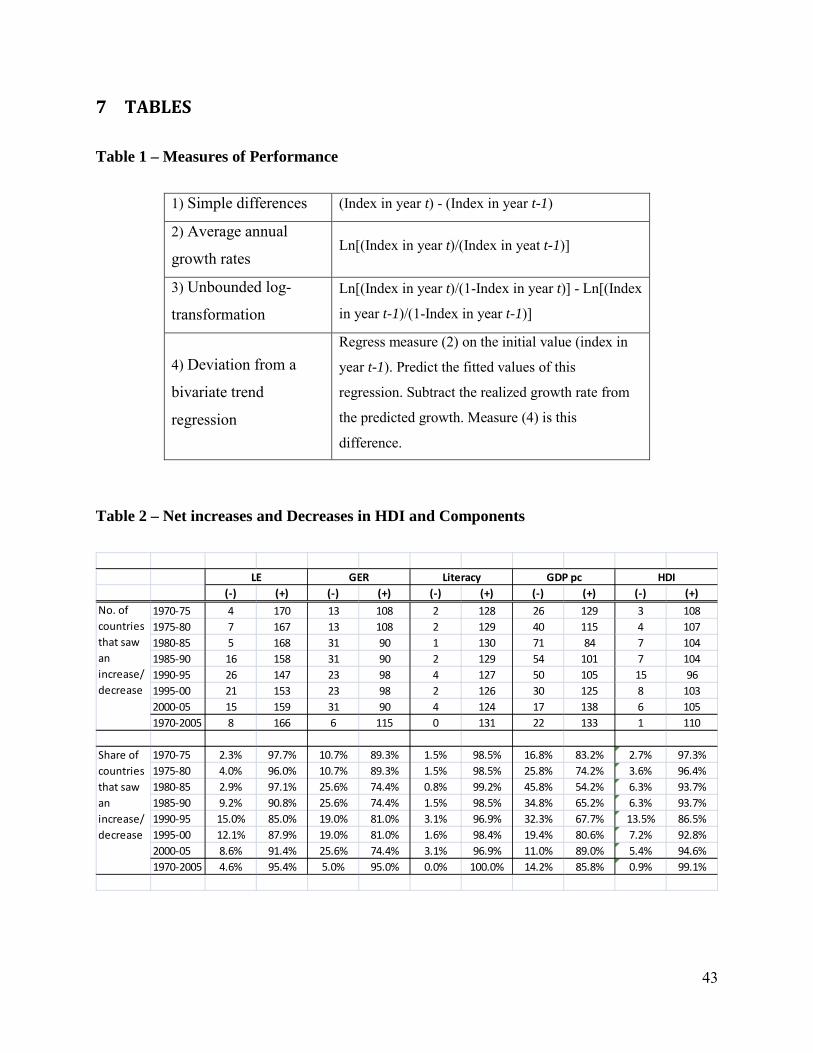
43
7 TABLES
Table 1 – Measures of Performance
1) Simple differences (Index in year t) - (Index in year t-1)
2) Average annual
growth rates Ln[(Index in year t)/(Index in yeat t-1)]
3) Unbounded log-
transformation
Ln[(Index in year t)/(1-Index in year t)] - Ln[(Index
in year t-1)/(1-Index in year t-1)]
4) Deviation from a
bivariate trend
regression
Regress measure (2) on the initial value (index in
year t-1). Predict the fitted values of this
regression. Subtract the realized growth rate from
the predicted growth. Measure (4) is this
difference.
Table 2 – Net increases and Decreases in HDI and Components
(-) (+) (-) (+) (-) (+) (-) (+) (-) (+)
1970-75 4 170 13 108 2 128 26 129 3 1081975-80 7 167 13 108 2 129 40 115 4 1071980-85 5 168 31 90 1 130 71 84 7 1041985-90 16 158 31 90 2 129 54 101 7 1041990-95 26 147 23 98 4 127 50 105 15 961995-00 21 153 23 98 2 126 30 125 8 1032000-05 15 159 31 90 4 124 17 138 6 1051970-2005 8 166 6 115 0 131 22 133 1 110
1970-75 2.3% 97.7% 10.7% 89.3% 1.5% 98.5% 16.8% 83.2% 2.7% 97.3%1975-80 4.0% 96.0% 10.7% 89.3% 1.5% 98.5% 25.8% 74.2% 3.6% 96.4%1980-85 2.9% 97.1% 25.6% 74.4% 0.8% 99.2% 45.8% 54.2% 6.3% 93.7%1985-90 9.2% 90.8% 25.6% 74.4% 1.5% 98.5% 34.8% 65.2% 6.3% 93.7%1990-95 15.0% 85.0% 19.0% 81.0% 3.1% 96.9% 32.3% 67.7% 13.5% 86.5%1995-00 12.1% 87.9% 19.0% 81.0% 1.6% 98.4% 19.4% 80.6% 7.2% 92.8%2000-05 8.6% 91.4% 25.6% 74.4% 3.1% 96.9% 11.0% 89.0% 5.4% 94.6%1970-2005 4.6% 95.4% 5.0% 95.0% 0.0% 100.0% 14.2% 85.8% 0.9% 99.1%
HDI
No. of countries that saw an increase/decrease
Share of countries that saw an increase/decrease
LE GER Literacy GDP pc
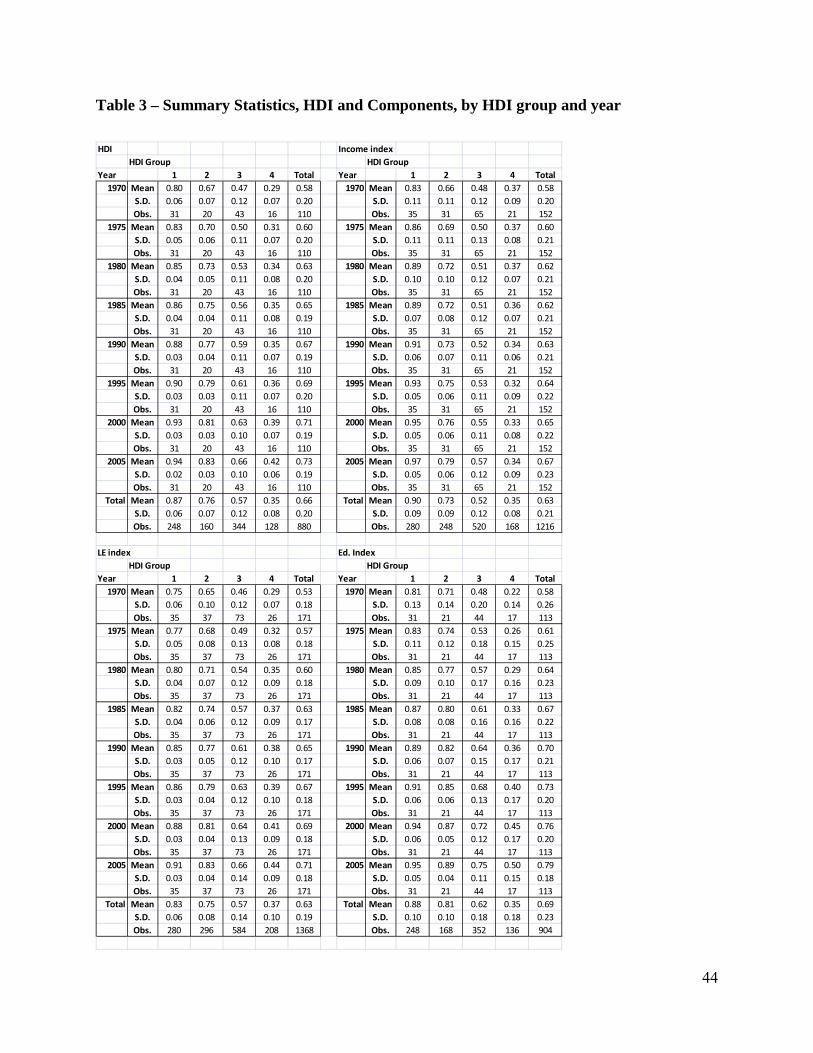
44
Table 3 – Summary Statistics, HDI and Components, by HDI group and year
HDI Income indexHDI Group HDI Group
Year 1 2 3 4 Total Year 1 2 3 4 Total1970 Mean 0.80 0.67 0.47 0.29 0.58 1970 Mean 0.83 0.66 0.48 0.37 0.58
S.D. 0.06 0.07 0.12 0.07 0.20 S.D. 0.11 0.11 0.12 0.09 0.20Obs. 31 20 43 16 110 Obs. 35 31 65 21 152
1975 Mean 0.83 0.70 0.50 0.31 0.60 1975 Mean 0.86 0.69 0.50 0.37 0.60S.D. 0.05 0.06 0.11 0.07 0.20 S.D. 0.11 0.11 0.13 0.08 0.21Obs. 31 20 43 16 110 Obs. 35 31 65 21 152
1980 Mean 0.85 0.73 0.53 0.34 0.63 1980 Mean 0.89 0.72 0.51 0.37 0.62S.D. 0.04 0.05 0.11 0.08 0.20 S.D. 0.10 0.10 0.12 0.07 0.21Obs. 31 20 43 16 110 Obs. 35 31 65 21 152
1985 Mean 0.86 0.75 0.56 0.35 0.65 1985 Mean 0.89 0.72 0.51 0.36 0.62S.D. 0.04 0.04 0.11 0.08 0.19 S.D. 0.07 0.08 0.12 0.07 0.21Obs. 31 20 43 16 110 Obs. 35 31 65 21 152
1990 Mean 0.88 0.77 0.59 0.35 0.67 1990 Mean 0.91 0.73 0.52 0.34 0.63S.D. 0.03 0.04 0.11 0.07 0.19 S.D. 0.06 0.07 0.11 0.06 0.21Obs. 31 20 43 16 110 Obs. 35 31 65 21 152
1995 Mean 0.90 0.79 0.61 0.36 0.69 1995 Mean 0.93 0.75 0.53 0.32 0.64S.D. 0.03 0.03 0.11 0.07 0.20 S.D. 0.05 0.06 0.11 0.09 0.22Obs. 31 20 43 16 110 Obs. 35 31 65 21 152
2000 Mean 0.93 0.81 0.63 0.39 0.71 2000 Mean 0.95 0.76 0.55 0.33 0.65S.D. 0.03 0.03 0.10 0.07 0.19 S.D. 0.05 0.06 0.11 0.08 0.22Obs. 31 20 43 16 110 Obs. 35 31 65 21 152
2005 Mean 0.94 0.83 0.66 0.42 0.73 2005 Mean 0.97 0.79 0.57 0.34 0.67S.D. 0.02 0.03 0.10 0.06 0.19 S.D. 0.05 0.06 0.12 0.09 0.23Obs. 31 20 43 16 110 Obs. 35 31 65 21 152
Total Mean 0.87 0.76 0.57 0.35 0.66 Total Mean 0.90 0.73 0.52 0.35 0.63S.D. 0.06 0.07 0.12 0.08 0.20 S.D. 0.09 0.09 0.12 0.08 0.21Obs. 248 160 344 128 880 Obs. 280 248 520 168 1216
LE index Ed. IndexHDI Group HDI Group
Year 1 2 3 4 Total Year 1 2 3 4 Total1970 Mean 0.75 0.65 0.46 0.29 0.53 1970 Mean 0.81 0.71 0.48 0.22 0.58
S.D. 0.06 0.10 0.12 0.07 0.18 S.D. 0.13 0.14 0.20 0.14 0.26Obs. 35 37 73 26 171 Obs. 31 21 44 17 113
1975 Mean 0.77 0.68 0.49 0.32 0.57 1975 Mean 0.83 0.74 0.53 0.26 0.61S.D. 0.05 0.08 0.13 0.08 0.18 S.D. 0.11 0.12 0.18 0.15 0.25Obs. 35 37 73 26 171 Obs. 31 21 44 17 113
1980 Mean 0.80 0.71 0.54 0.35 0.60 1980 Mean 0.85 0.77 0.57 0.29 0.64S.D. 0.04 0.07 0.12 0.09 0.18 S.D. 0.09 0.10 0.17 0.16 0.23Obs. 35 37 73 26 171 Obs. 31 21 44 17 113
1985 Mean 0.82 0.74 0.57 0.37 0.63 1985 Mean 0.87 0.80 0.61 0.33 0.67S.D. 0.04 0.06 0.12 0.09 0.17 S.D. 0.08 0.08 0.16 0.16 0.22Obs. 35 37 73 26 171 Obs. 31 21 44 17 113
1990 Mean 0.85 0.77 0.61 0.38 0.65 1990 Mean 0.89 0.82 0.64 0.36 0.70S.D. 0.03 0.05 0.12 0.10 0.17 S.D. 0.06 0.07 0.15 0.17 0.21Obs. 35 37 73 26 171 Obs. 31 21 44 17 113
1995 Mean 0.86 0.79 0.63 0.39 0.67 1995 Mean 0.91 0.85 0.68 0.40 0.73S.D. 0.03 0.04 0.12 0.10 0.18 S.D. 0.06 0.06 0.13 0.17 0.20Obs. 35 37 73 26 171 Obs. 31 21 44 17 113
2000 Mean 0.88 0.81 0.64 0.41 0.69 2000 Mean 0.94 0.87 0.72 0.45 0.76S.D. 0.03 0.04 0.13 0.09 0.18 S.D. 0.06 0.05 0.12 0.17 0.20Obs. 35 37 73 26 171 Obs. 31 21 44 17 113
2005 Mean 0.91 0.83 0.66 0.44 0.71 2005 Mean 0.95 0.89 0.75 0.50 0.79S.D. 0.03 0.04 0.14 0.09 0.18 S.D. 0.05 0.04 0.11 0.15 0.18Obs. 35 37 73 26 171 Obs. 31 21 44 17 113
Total Mean 0.83 0.75 0.57 0.37 0.63 Total Mean 0.88 0.81 0.62 0.35 0.69S.D. 0.06 0.08 0.14 0.10 0.19 S.D. 0.10 0.10 0.18 0.18 0.23Obs. 280 296 584 208 1368 Obs. 248 168 352 136 904
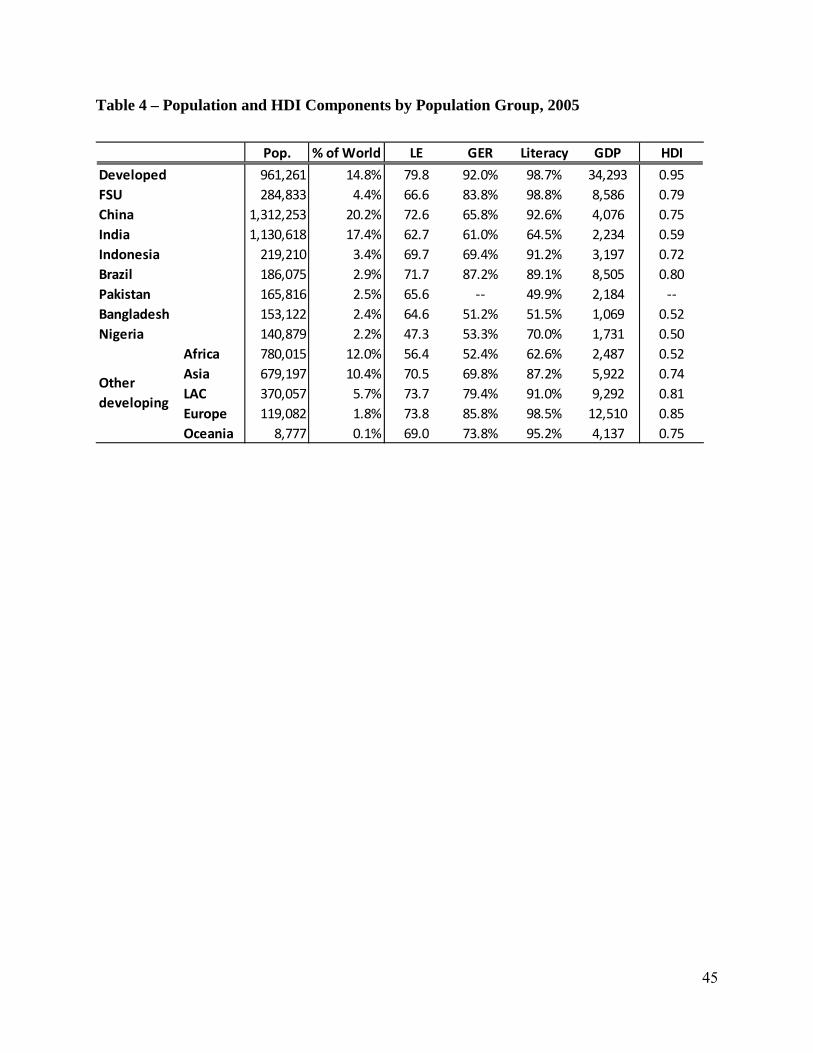
45
Table 4 – Population and HDI Components by Population Group, 2005
Pop. % of World LE GER Literacy GDP HDI
961,261 14.8% 79.8 92.0% 98.7% 34,293 0.95284,833 4.4% 66.6 83.8% 98.8% 8,586 0.79
1,312,253 20.2% 72.6 65.8% 92.6% 4,076 0.751,130,618 17.4% 62.7 61.0% 64.5% 2,234 0.59
219,210 3.4% 69.7 69.4% 91.2% 3,197 0.72186,075 2.9% 71.7 87.2% 89.1% 8,505 0.80165,816 2.5% 65.6 -- 49.9% 2,184 --153,122 2.4% 64.6 51.2% 51.5% 1,069 0.52140,879 2.2% 47.3 53.3% 70.0% 1,731 0.50
Africa 780,015 12.0% 56.4 52.4% 62.6% 2,487 0.52Asia 679,197 10.4% 70.5 69.8% 87.2% 5,922 0.74LAC 370,057 5.7% 73.7 79.4% 91.0% 9,292 0.81Europe 119,082 1.8% 73.8 85.8% 98.5% 12,510 0.85Oceania 8,777 0.1% 69.0 73.8% 95.2% 4,137 0.75
Other developing
DevelopedFSUChinaIndiaIndonesiaBrazilPakistanBangladeshNigeria

46
Table 5 - Top and bottom performers by HDI component
RankCountry
%
growth,
70-05Rank
Country%
grow
th, 70-05
RankCountry
%
growth,
70-05Rank
Country%
grow
th, 70-05
RankCountry
%
growth,
70-05Rank
Country%
grow
th, 70-05
1Yem
en47.6%
1Liberia
188.8%1
Chad181.4%
1China
254.3%1
Nepal
240.1%1
Nepal
82.7%2
Bhutan46.8%
2N
epal184.2%
2N
iger180.1%
2Equatorial G
uinea253.6%
2N
iger233.6%
2Bangladesh
57.5%3
Western Sahara
43.5%3
Ethiopia175.3%
3N
epal145.9%
3Botsw
ana222.0%
3Liberia
193.8%3
Lao PDR
57.5%4
Nepal
42.6%4
Burkina Faso167.6%
4G
uinea-Bissau141.3%
4Korea (Republic of)
199.5%4
Burkina Faso187.6%
4M
ozambique
57.3%5
Om
an41.6%
5Bhutan
162.1%5
Central African Rep.
131.7%5
Singapore184.2%
5Ethiopia
187.1%5
Indonesia56.5%
6V
iet Nam
41.4%6
Mali
131.6%6
Burundi130.8%
6M
aldives169.1%
6M
ali185.5%
6Burkina Faso
55.2%7
Timor-Leste
41.2%7
Cambodia
131.1%7
Togo130.3%
7Saint Kitts and N
evis163.3%
7Benin
180.1%7
Malaw
i52.1%
8Bangladesh
38.3%8
Afghanistan
123.8%8
Om
an124.4%
8H
ong Kong, China (SA160.0%
8A
fghanistan154.1%
8Benin
50.7%9
Indonesia38.2%
9Benin
118.4%9
Yemen
121.9%9
Malta
156.8%9
Burundi152.9%
9Ethiopia
50.7%10
Guinea
36.1%10
Uganda
115.9%10
Benin118.7%
10Thailand
154.9%10
Nigeria
150.0%10
Tunisia50.7%
165U
ganda0.8%
112Philippines
8.2%121
Cuba4.8%
146Central A
frican Repub-44.4%
106D
enmark
19.8%102
Tonga11.1%
166Kenya
0.6%113
Gabon
6.6%122
Romania
4.7%147
Côte d'Ivoire-46.8%
107Poland
19.4%103
Netherlands
11.0%167
South Africa
-1.9%114
Belize3.8%
123Italy
4.2%148
Madagascar
-55.4%108
Hungary
18.7%104
Sweden
10.8%168
Congo-2.1%
115China
2.3%124
Netherlands A
ntilles3.9%
149Zam
bia-70.0%
109Rom
ania17.7%
105D
enmark
10.5%169
Former Soviet U
nion-2.7%
116A
ngola-4.5%
125M
ongolia2.8%
150N
iger-70.0%
110Bulgaria
14.1%106
Jamaica
10.4%170
Swaziland
-6.5%117
Trinidad and Tobago-5.8%
126Form
er Soviet Union
1.9%151
Kuwait
-71.7%111
Tonga12.0%
107South A
frica10.2%
171Botsw
ana-6.9%
118Tonga
-9.8%127
Barbados1.7%
152Libyan A
rab Jamahiriy
-97.4%112
Trinidad and Tobago11.0%
108Congo (D
R)9.4%
172Lesotho
-8.9%119
Zambia
-14.1%128
Poland1.3%
153D
jibouti-103.2%
113Form
er Soviet Union
0.5%109
Trinidad and Tobago7.6%
173Zam
bia-13.3%
120Congo (D
R)-25.9%
129H
ungary0.9%
154Congo (D
R)-136.0%
114Zam
bia-2.6%
110Form
er Soviet Union
3.9%174
Zimbabw
e-27.5%
121Congo
-37.2%130
Samoa
0.8%155
Liberia-174.9%
115Zim
babwe
-21.1%111
Zambia
-6.3%
RankCountry
Dev.
From
Fit, 70-05
RankCountry
Dev.
From
Fit, 70-05
RankCountry
Dev.
From
Fit, 70-05
RankCountry
Dev.
From
Fit, 70-05
RankCountry
Dev.
From
Fit, 70-05
RankCountry
Dev.
From
Fit, 70-05
1Bhutan
20.6%1
Liberia81.7%
1Chad
59.9%1
Equatorial Guinea
193.8%1
Nepal
105.5%1
Nepal
33.9%2
Yemen
20.2%2
Nepal
75.1%2
Niger
58.5%2
China192.9%
2N
iger94.7%
2Indonesia
18.7%3
Om
an20.0%
3Ethiopia
63.6%3
Nepal
34.9%3
Botswana
161.7%3
Liberia61.3%
3Tunisia
15.8%4
Viet N
am19.5%
4Bhutan
55.6%4
Guinea-Bissau
33.5%4
Korea (Republic of)140.8%
4Ethiopia
51.6%4
Lao PDR
15.1%5
Western Sahara
18.1%5
Burkina Faso52.4%
5O
man
29.0%5
Singapore129.1%
5Burkina Faso
50.0%5
China14.9%
6N
epal17.4%
6A
ustralia35.9%
6Burundi
27.1%6
Maldives
108.1%6
Mali
47.9%6
Korea (Republic of)13.1%
7Indonesia
15.6%7
Cambodia
33.3%7
Togo24.0%
7H
ong Kong, China (SA105.2%
7Benin
47.3%7
Bangladesh12.6%
8Libyan A
rab Jamahiriy
15.1%8
New
Zealand27.3%
8Central A
frican Rep.23.8%
8Saint Kitts and N
evis104.1%
8Libyan A
rab Jamahiriy
34.9%8
United A
rab Emirates
12.2%9
Timor-Leste
14.4%9
Mali
25.6%9
Lesotho19.7%
9M
alta99.3%
9A
lgeria32.9%
9M
orocco11.2%
10Bangladesh
13.9%10
Denm
ark24.8%
10Yem
en16.3%
10M
acao, China (SAR)
98.2%10
Australia
24.0%10
Algeria
11.1%
165Congo (D
R)-16.2%
112Tanzania
-30.5%121
Comoros
-18.6%146
Nicaragua
-95.6%106
Cameroon
-33.9%102
Liberia-11.7%
166Kenya
-19.6%113
Cameroon
-33.3%122
Iraq-18.6%
147Central A
frican Repub-105.1%
107Congo (D
R)-37.5%
103Kenya
-11.8%167
Uganda
-20.5%114
Ghana
-38.0%123
Nicaragua
-19.0%148
Côte d'Ivoire-106.1%
108Kenya
-39.2%104
Former Soviet U
nion-12.0%
168Congo
-21.1%115
Sudan-43.1%
124Bangladesh
-19.2%149
Madagascar
-115.5%109
Botswana
-46.4%105
Niger
-14.1%169
South Africa
-21.8%116
Côte d'Ivoire-50.3%
125Cam
bodia-19.7%
150Libyan A
rab Jamahiriy
-127.5%110
Lesotho-51.1%
106Congo
-14.5%170
Botswana
-25.8%117
Zambia
-60.6%126
Belize-22.8%
151Zam
bia-129.5%
111Congo
-58.5%107
South Africa
-15.2%171
Swaziland
-28.8%118
Central African Repub
-65.4%127
Zambia
-23.7%152
Niger
-130.5%112
South Africa
-62.1%108
Côte d'Ivoire-15.3%
172Lesotho
-30.7%119
Congo-76.2%
128M
ozambique
-23.8%153
Djibouti
-159.9%113
Swaziland
-73.5%109
Central African Rep.
-17.3%173
Zambia
-35.1%120
Congo (DR)
-81.5%129
Papua New
Guinea
-27.0%154
Congo (DR)
-196.6%114
Zambia
-108.3%110
Congo (DR)
-32.4%174
Zimbabw
e-46.2%
121A
ngola-90.1%
130M
auritania-37.4%
155Liberia
-234.7%115
Zimbabw
e-111.0%
111Zam
bia-40.6%
Top Ten
Bottom
Ten
Top Ten
Bottom
Ten
Life ExpectancyG
ross Enrolment Rate
LiteracyG
DP per capita
HD
IN
on-income H
DI
Life ExpectancyG
ross Enrolment Rate
LiteracyG
DP per capita
HD
IN
on-income H
DI
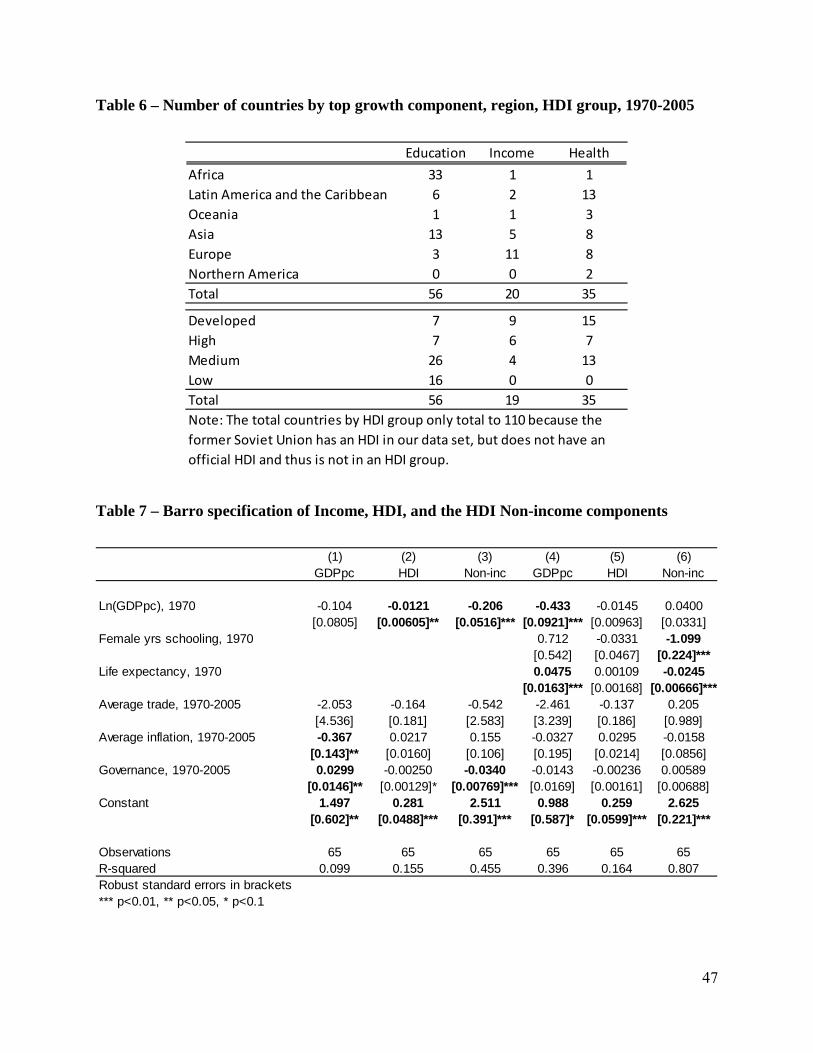
47
Table 6 – Number of countries by top growth component, region, HDI group, 1970-2005
Education Income Health
Africa 33 1 1Latin America and the Caribbean 6 2 13Oceania 1 1 3Asia 13 5 8Europe 3 11 8Northern America 0 0 2Total 56 20 35
Developed 7 9 15High 7 6 7Medium 26 4 13Low 16 0 0Total 56 19 35Note: The total countries by HDI group only total to 110 because the former Soviet Union has an HDI in our data set, but does not have an official HDI and thus is not in an HDI group.
Table 7 – Barro specification of Income, HDI, and the HDI Non-income components
(1) (2) (3) (4) (5) (6)GDPpc HDI Non-inc GDPpc HDI Non-inc
Ln(GDPpc), 1970 -0.104 -0.0121 -0.206 -0.433 -0.0145 0.0400[0.0805] [0.00605]** [0.0516]*** [0.0921]*** [0.00963] [0.0331]
Female yrs schooling, 1970 0.712 -0.0331 -1.099[0.542] [0.0467] [0.224]***
Life expectancy, 1970 0.0475 0.00109 -0.0245[0.0163]*** [0.00168] [0.00666]***
Average trade, 1970-2005 -2.053 -0.164 -0.542 -2.461 -0.137 0.205[4.536] [0.181] [2.583] [3.239] [0.186] [0.989]
Average inflation, 1970-2005 -0.367 0.0217 0.155 -0.0327 0.0295 -0.0158[0.143]** [0.0160] [0.106] [0.195] [0.0214] [0.0856]
Governance, 1970-2005 0.0299 -0.00250 -0.0340 -0.0143 -0.00236 0.00589[0.0146]** [0.00129]* [0.00769]*** [0.0169] [0.00161] [0.00688]
Constant 1.497 0.281 2.511 0.988 0.259 2.625[0.602]** [0.0488]*** [0.391]*** [0.587]* [0.0599]*** [0.221]***
Observations 65 65 65 65 65 65R-squared 0.099 0.155 0.455 0.396 0.164 0.807Robust standard errors in brackets*** p<0.01, ** p<0.05, * p<0.1
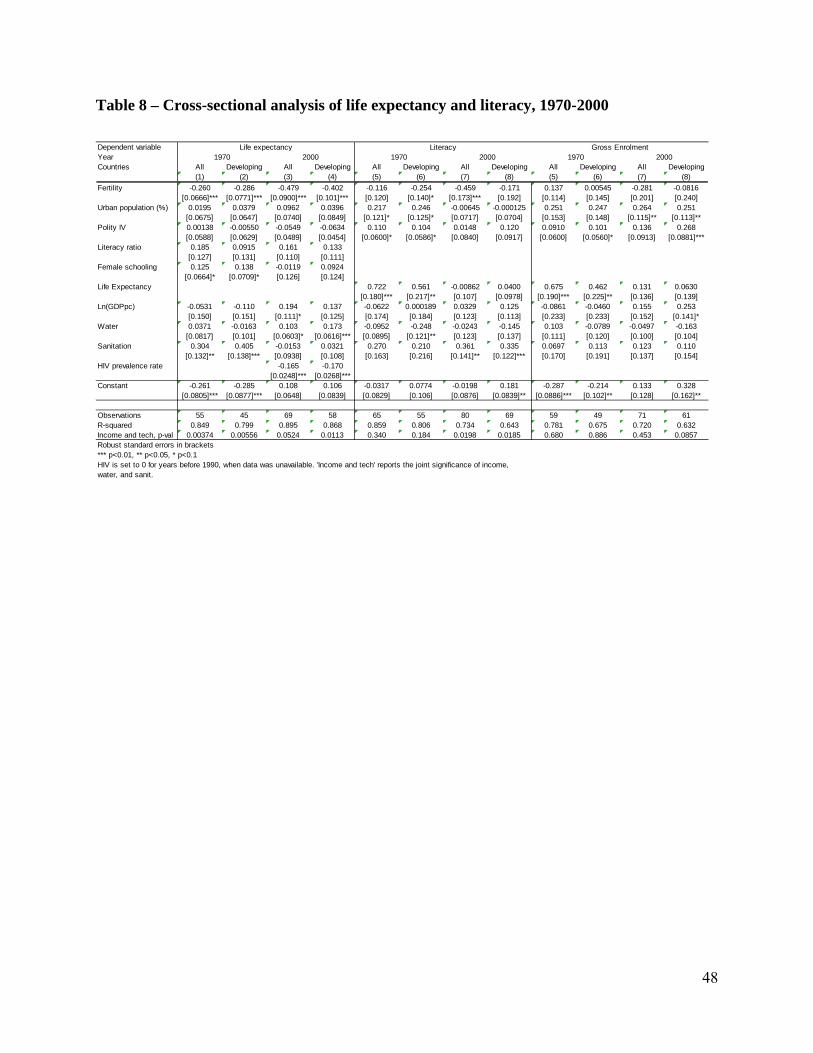
48
Table 8 – Cross-sectional analysis of life expectancy and literacy, 1970-2000
Dependent variableYearCountries All Developing All Developing All Developing All Developing All Developing All Developing
(1) (2) (3) (4) (5) (6) (7) (8) (5) (6) (7) (8)Fertility -0.260 -0.286 -0.479 -0.402 -0.116 -0.254 -0.459 -0.171 0.137 0.00545 -0.281 -0.0816
[0.0666]*** [0.0771]*** [0.0900]*** [0.101]*** [0.120] [0.140]* [0.173]*** [0.192] [0.114] [0.145] [0.201] [0.240]Urban population (%) 0.0195 0.0379 0.0962 0.0396 0.217 0.246 -0.00645 -0.000125 0.251 0.247 0.264 0.251
[0.0675] [0.0647] [0.0740] [0.0849] [0.121]* [0.125]* [0.0717] [0.0704] [0.153] [0.148] [0.115]** [0.113]**Polity IV 0.00138 -0.00550 -0.0549 -0.0634 0.110 0.104 0.0148 0.120 0.0910 0.101 0.136 0.268
[0.0588] [0.0629] [0.0489] [0.0454] [0.0600]* [0.0586]* [0.0840] [0.0917] [0.0600] [0.0560]* [0.0913] [0.0881]***Literacy ratio 0.185 0.0915 0.161 0.133
[0.127] [0.131] [0.110] [0.111]Female schooling 0.125 0.138 -0.0119 0.0924
[0.0664]* [0.0709]* [0.126] [0.124]Life Expectancy 0.722 0.561 -0.00862 0.0400 0.675 0.462 0.131 0.0630
[0.180]*** [0.217]** [0.107] [0.0978] [0.190]*** [0.225]** [0.136] [0.139]Ln(GDPpc) -0.0531 -0.110 0.194 0.137 -0.0622 0.000189 0.0329 0.125 -0.0861 -0.0460 0.155 0.253
[0.150] [0.151] [0.111]* [0.125] [0.174] [0.184] [0.123] [0.113] [0.233] [0.233] [0.152] [0.141]*Water 0.0371 -0.0163 0.103 0.173 -0.0952 -0.248 -0.0243 -0.145 0.103 -0.0789 -0.0497 -0.163
[0.0817] [0.101] [0.0603]* [0.0616]*** [0.0895] [0.121]** [0.123] [0.137] [0.111] [0.120] [0.100] [0.104]Sanitation 0.304 0.405 -0.0153 0.0321 0.270 0.210 0.361 0.335 0.0697 0.113 0.123 0.110
[0.132]** [0.138]*** [0.0938] [0.108] [0.163] [0.216] [0.141]** [0.122]*** [0.170] [0.191] [0.137] [0.154]HIV prevalence rate -0.165 -0.170
[0.0248]*** [0.0268]***Constant -0.261 -0.285 0.108 0.106 -0.0317 0.0774 -0.0198 0.181 -0.287 -0.214 0.133 0.328
[0.0805]*** [0.0877]*** [0.0648] [0.0839] [0.0829] [0.106] [0.0876] [0.0839]** [0.0886]*** [0.102]** [0.128] [0.162]**
Observations 55 45 69 58 65 55 80 69 59 49 71 61R-squared 0.849 0.799 0.895 0.868 0.859 0.806 0.734 0.643 0.781 0.675 0.720 0.632Income and tech, p-val 0.00374 0.00556 0.0524 0.0113 0.340 0.184 0.0198 0.0185 0.680 0.886 0.453 0.0857Robust standard errors in brackets*** p<0.01, ** p<0.05, * p<0.1HIV is set to 0 for years before 1990, when data was unavailable. 'Income and tech' reports the joint significance of income, water, and sanit.
Gross Enrolment1970 20001970 2000 1970 2000
Life expectancy Literacy

49
Table 9 – Cross-sectional analysis of HDI and institutions
(1)(2)
(3)(4)
(5)(6)
(7)(8)
(9)(10)
(11)(12)
(13)(14)
(15)(16)
Female schooling
3.6703.182
2.9192.456
5.5724.197
4.1872.437
4.2893.671
3.5263.300
6.6655.009
5.0624.195
[0.342]***[0.307]***
[0.292]***[0.289]***
[0.934]***[0.872]***
[0.881]***[4.955]
[0.293]***[0.256]***
[0.259]***[0.246]***
[1.360]***[1.506]***
[1.534]***[4.687]
Distance from
Eq.
0.4060.450
0.2630.355
0.376-0.0179
0.3910.414
0.2810.307
0.3110.185
[0.0780]***[0.0709]***[0.0788]***[0.0920]***[0.0841]***
[0.864][0.0586]***[0.0624]***[0.0749]***
[0.117]**[0.121]**
[0.899]Trade openness
0.1870.0634
0.126-0.156
0.09590.0419
0.0510-0.0295
[0.0851]**[0.0629]
[0.0834][0.673]
[0.0542]*[0.0538]
[0.0802][0.539]
Rule of Law
0.4551.047
0.2760.335
[0.0927]***[2.405]
[0.0724]***[2.196]
Constant
-3.241-2.739
-2.467-2.024
-4.821-3.594
-3.551-1.956
-3.624-3.026
-2.865-2.652
-5.622-4.167
-4.193-3.434
[0.288]***[0.246]***
[0.238]***[0.250]***
[0.791]***[0.732]***
[0.736]***[4.454]
[0.260]***[0.215]***
[0.221]***[0.218]***
[1.161]***[1.292]***
[1.325]***[4.118]
Observations
8080
8080
8080
8080
6666
6666
6666
6666
R-squared
0.5110.650
0.6850.776
0.3740.613
0.6320.610
0.6990.830
0.8380.869
0.4840.769
0.7630.840
(17)(18)
(19)(20)
(21)(22)
(23)(24)
(25)(26)
(27)(28)
(29)(30)
(31)(32)
Female schooling
3.7293.203
3.0042.689
7.2186.150
6.1787.370
4.3844.222
4.1814.148
5.1744.793
4.8002.970
[0.359]***[0.326]***
[0.336]***[0.351]***
[1.659]***[1.921]***
[1.943]***[8.992]
[0.261]***[0.265]***
[0.266]***[0.283]***
[0.812]***[0.823]***
[0.821]***[6.280]
Distance from
Eq.
0.4350.467
0.3400.282
0.2900.642
0.1340.141
0.1280.104
0.104-0.345
[0.0839]***[0.0843]***[0.0923]***[0.154]*
[0.153]*[1.749]
[0.0341]***[0.0351]***[0.0526]**
[0.0422]**[0.0450]**
[1.234]Trade openness
0.1450.0583
0.06190.318
0.03030.0214
0.00104-0.334
[0.0665]**[0.0547]
[0.1000][1.391]
[0.0417][0.0449]
[0.0668][0.960]
Rule of Law
0.306-0.880
0.03151.156
[0.0826]***[4.723]
[0.0791][3.205]
Constant
-2.984-2.444
-2.234-1.936
-5.893-4.936
-4.942-6.040
-3.568-3.402
-3.358-3.327
-4.227-3.884
-3.890-2.224
[0.328]***[0.277]***
[0.291]***[0.306]***
[1.418]***[1.655]***
[1.675]***[8.108]
[0.228]***[0.232]***
[0.235]***[0.248]***
[0.683]***[0.698]***
[0.701]***[5.625]
Observations
8282
8282
8282
8282
8282
8282
8282
8282
R-squared
0.5030.653
0.6740.713
0.0630.358
0.3500.817
0.8330.834
0.8350.790
0.8200.820
0.213
(33)(34)
(35)(36)
(37)(38)
(39)(40)
Female schooling
0.8750.760
0.7560.727
1.2560.928
0.9151.175
[0.0696]***[0.0641]***[0.0705]***[0.0701]***[0.238]***
[0.276]***[0.263]***
[1.154]D
istance from E
q.0.0728
0.07350.0567
0.06230.0615
0.0921[0.0141]***[0.0154]***[0.0203]***
[0.0252]**[0.0257]**
[0.225]Trade openness
0.00302-0.00384
-0.01100.00923
[0.0156][0.0165]
[0.0214][0.135]
Rule of Law
0.0350-0.0872
[0.0208]*[0.545]
Constant
-0.112-0.000765
0.004270.0313
-0.433-0.144
-0.137-0.364
[0.0625]*[0.0565]
[0.0639][0.0647]
[0.203]**[0.237]
[0.229][1.015]
Observations
6666
6666
6666
6666
R-squared
0.6420.743
0.7430.754
0.5200.722
0.7250.536
Gross Enrolm
ent
Robust standard errors in brackets
*** p<0.01, ** p<0.05, * p<0.1
Income
HDI
Life ExpectancyLiteracy
OLS
2SLS
OLS
2SLS