human costs of drug use v29
TRANSCRIPT

8/14/2019 Human Costs of Drug Use v29
http://slidepdf.com/reader/full/human-costs-of-drug-use-v29 1/27
Measuring the human costs of drug use for friends and family of drug
users. The results from a survey in four Nordic capitals
Hans Olav Melberg, Pekka Hakkarainen, Esben Houborg, Marke Jaaskelainen, Astrid
Skretting, Mats Ramstedt, Pia Rosenqvist
Abstract
This paper presents the results from a Nordic survey that explores different approaches to
quantify the human costs related to drug use. The results show that in most Nordic capitals
more than half of the respondents at some time have known and worried about the drug use of
somebody they know personally. Moreover, while the average reported harm was about 2 on
a scale from 0 to 10, a significant minority (10%) of those knowing drug users indicated that
the harm was quite high, with females scoring higher than males. The results can be used to
give a more accurate estimate of the overall cost of drugs and its distribution which in turn is
important in the debate about how large priority the drug sector should be given and how the
money should be spent.
1

8/14/2019 Human Costs of Drug Use v29
http://slidepdf.com/reader/full/human-costs-of-drug-use-v29 2/27
Measuring the human costs of drug use for friends and family of drug
users? The results from a survey in four Nordic capitals
Introduction
Drug use is costly. It is costly for the state, for the users themselves, for friends and family
and for society in general. While costs that are covered by the state and society in general
have received much attention and attempted quantification, relatively little has been done on
the human costs of friends and family of drug users. This study explores how population
surveys could be used to fill this gap and reports on one such large survey in the Nordic
capitals.
The quantification of human costs is important in itself, but it also has important policy
implications. The immediate consequence of leaving out human costs is to underestimate the
cost of drugs use. Often studies of the social cost of drugs quantify costs born by society at
large – health costs, crime costs, lost income - but not the human consequences felt by those
who are close to the user (See, for instance, French and Martin, 1996, Single et al., 1998,
Culyer et al., 2002). This underestimation may in turn lead to under-prioritization of the drug
area as a whole. Moreover, if the success of a policy is measured by its ability to reduce the
costs associated with drugs, then leaving out important cost categories will lead to skewed
policies. We will get policies aimed at indicators that happen to be easily available, instead of
policies that focus on the overall problem. For both these reasons, to avoid under-
prioritization and misguided policy aims, it is important to get a better understanding of the
human costs associated with drug use.
Although important, the problem of measuring human costs could be viewed as both
redundant and impossible. Redundant in the sense that existing policy goals and indicators
2
8/14/2019 Human Costs of Drug Use v29
http://slidepdf.com/reader/full/human-costs-of-drug-use-v29 3/27
indirectly take human costs into account. Impossible in the sense that human costs are
believed to be beyond quantification. We will deal with each argument in turn.
The redundancy argument centers on the assumption that commonly used measures of the size
the drug problem – like prevalence and social cost - are so strongly correlated with human
costs that there is no need to measure it separately. Although human costs are related to
prevalence, Caulkins and Reuter (1997) have pointed out that use-reduction is not perfectly
correlated with harm-reduction. There are policies, such as needle-exchange programs, which
do not reduce drug use, but make it safer and hence reduce the harm associated with drug use
(e.g. the risk of being infected with Hepatitis B). Because of the imperfect relationship
between prevalence and harm it is important to avoid focusing only on prevalence goals.
More generally, it illustrates that there is a need to work on alternative indicators of the size of
the drug problem.
Another often used indicator of the size of the drug problem is the social cost of drugs, but
this approach has both empirical and conceptual problems. Empirically it is very difficult to
get precise estimates of the various cost categories. For instance, drug related health costs are
based both on imprecise estimates of the costs of treating various diseases and the fraction of
these costs that can be attributed to drug use. Even if precise estimates were available, there is
conceptual disagreement on what kind of costs that should be included. For instance, prison
costs could be viewed as an external cost that drug users impose on society, but it might also
be viewed as a control cost which society itself has chosen to incur by making drugs illegal.
Including prison costs could also create problems if policy success is judged by the degree to
which it reduces the social cost of drugs. This could create a self-reinforcing policy
justification in which the high cost of drugs is used to justify tougher interventions and longer
3

8/14/2019 Human Costs of Drug Use v29
http://slidepdf.com/reader/full/human-costs-of-drug-use-v29 4/27
prison terms, which in turn might increase the estimated cost of drugs even more thus leading
to calls for an even tougher policy. Other cost categories are equally controversial: lost
income because of drug use (early death and or unemployment) is not an external cost, but a
cost born by the drug users themselves. The cost of the drug itself is sometimes included, but
often excluded. The value of stolen goods is sometimes argued to be a transfer, and other
times it treated as a social cost. Altogether these empirical and conceptual problems raise
doubts about the reliability and validity of the cost-of-illness approach to measure the social
cost of drugs (see also Reuter, 1999; or Moore and Caulkins 2006 for more on the problems
with the cost of illness approach and suggestions on how to improve it).
In recognition of the problems associated with the use of cost of illnesss estimates and
prevalence to measure the extent of the drug problem and to quantify the effects of
intervention, there has been an increasing interest in measuring harm and using harm
reduction as a policy goal. This, in turn, has stimulated several attempts to create a harm index
such as the UK Drug Harm Index, the Australian Harm Index and New Zeeland Drug harm
Index (See, for instance, Ritter 2007; MacDonald et al, 2005; McFadden, 2006). To some
extent these indices are exempt from the criticisms above since they try to quantify some of
the human costs associated with drugs. However, they do not include the suffering of family
and friends of drug users. One of the reasons for the failure to include human costs when
measuring the drug problem is that it has been considered very difficult to quantify. For
instance, the authors behind the UK Drug Harm Index explicitly stated that “it does not
capture all the harms that illegal drug use generates, but rather a subset of harms for which
robust data (or information) are available” (MacDonald et al 2005). This leaves the research
community with a challenge: Is it possible to develop methods to measure human costs
related to drug use?
4
8/14/2019 Human Costs of Drug Use v29
http://slidepdf.com/reader/full/human-costs-of-drug-use-v29 5/27
Previous research on the human costs of drug use is very sparse. In one of the few references
to the issue, Kleinman (1999) has suggested that that including human costs could increase
the estimated cost of drugs by more than 80% if we assume that each drug user know 10
individuals who are willing to pay 1000 USD to help the drug user. However, Kleinman’s
suggestion that willingness to pay could be used to estimate human costs has not been
investigated empirically. We do not know how many persons are affected or how much they
are willing to pay.
In another study, Zarkin et al (2000) presents a pilot survey that quantifies society’s
willingness to pay for treatment of drug users. On average people indicate that they were
willing to pay 37 USD for a program that successfully treated 100 drug addicts. They also
found that the willingness to pay for treatment did not change when the number of
successfully treated addicts in the proposed program increased from 100 to 500. This reveals a
common problem facing such studies. Many people have not thought about the problem and
when asked to put a monetary value on something, they tend to give answers that reflect an
underlying opinion more than a true quantification (“Drug treatment is a good thing, I will
support it”) or an answer that is largely influenced by random factors. This points to problems
with measuring human costs in money, but it does not imply that quantification impossible.
By noting the problems, one may try to explore ways of quantification that reduce the
difficulties. We have explored several such methods described in the next section.
Design and method
In order to quantify the human costs of friends and relatives of drug users, it is necessary,
first, to determine how many are affected. Second, we need to know in what ways they are
harmed. The third and most difficult challenge is to convert the various harms into one unit so
5

8/14/2019 Human Costs of Drug Use v29
http://slidepdf.com/reader/full/human-costs-of-drug-use-v29 6/27
it can be aggregated and give us an indication of total harm. This may, but need not, be in the
form of harm measured in money.
The results in this paper are based on a representative survey of 3092 individuals above 18
years old in four Nordic capitals (Copenhagen, Helsinki, Oslo, and Stockholm. Reykjavik in
Iceland was not included). The survey consisted of 34 questions and was conducted by the
opinion research company Synovate (See Appendix 1). They have a panel with a
representative sample of the population and the members of this panel received an e-mail
invitation to participate in the survey. The respondents filled in their answers anonymously
using in a web-based interface. A choice was made to sample only the capitals and not the
population of the whole country because this would have required many more respondents.
Because the prevalence of drug use is higher in the Nordic capitals than in other parts of the
countries, it was supposed that we could reach a sufficient number of respondents influenced
by somebody's drug use in our sample. However, it should be noted that the population in the
capitals is not representative of the whole country, so one should be careful to limit the
generalizations from the sample to the capitals only and not the whole country.
Table 1. The gender composition, average age and the education of the sample compared to
the general population*
Country Percentage female Average age Percentage with education
above high school
(university or polytechnic)
Sample Capital Country Sample Capital** Country Sample Country
Denmark 54 51 51 40 n/a 40 63 47
Finland 52 53 51 44 40 41 53 44
Norway 51 50 50 44 45 39 62 45
Sweden 50 50 49 44 43 41 53 54* Sources: Organization for Economic Cooperation and Development (OECD) and The Nordic national
statistical databases. Information about educational level in the capital was available for the sample and the
country, not the capitals.** In Norway and Sweden the average age in the capital relates to the population above 18 only.
6

8/14/2019 Human Costs of Drug Use v29
http://slidepdf.com/reader/full/human-costs-of-drug-use-v29 7/27
As seen in Table 1 the figures for sample differ from the figures for the whole country or
capitals especially in the level of education of the population. More than half of our
respondents had completed a university degree. Men and women seem however to be
accurately represented and the average age is also close to the average considering that the
survey aimed only at the population above 18 years and older.
Although the participants were recruited from a representative panel, there is still the quite
likely possibility that those who agreed to participate were more interested in the topic of
drugs than the average panel member. However, more than 50% of those who were invited
accepted and responded. This means that although there may be some selection effects, the
survey did not only get answers from a small minority of the representative panel.
The questions were designed to test several different ways of measuring suffering. Given the
problems associated with direct monetary questions, we decided not to focus exclusively on
measuring harm in monetary values but also to explore three different quantifications of
harms. First, after determining how many people who were affected we asked about the
prevalence of specific types of harm such as fear of violence, having to call the police and
seeking professional help. Second, moving one step closer to measuring aggregate harm, we
also asked the respondents to indicate how much they had been affected on a scale from 0 (no
negative impact) to 10 (my life has been destroyed). In these questions the respondents gave
answers both in terms of life experiences as well as the past 12 months.
7

8/14/2019 Human Costs of Drug Use v29
http://slidepdf.com/reader/full/human-costs-of-drug-use-v29 8/27
In order to better interpret the reported harm we asked the respondents to compare drug
addiction to several other illnesses or events such as being paralyzed, becoming blind, or
suffering a severe burn injury. Third, and finally, we also asked about monetary valuation. In
these questions we distinguished between willingness to pay in general and willingness to pay
for a friend or a relative. In this way the survey was designed to explore different methods, to
compare the consistency of the answers and to explore which method that seemed to give the
most valid and reliable answers.
Before completing the survey each respondent was informed about the aim of the study as
well as the definition of key phrases. Of special importance is the phrase “a drug user you
personally know.” This was explicitly defined in the instructions as “a person who is close to
you, a relative or a friend, or a person you at least know the name of and have talked to.” The
aim of this design was to avoid exaggerating the share of the populations that was affected as
well as making sure that the respondents interpreted the question in the same way.
The answers were analyzed using SPSS. In addition to standard cross-tables and figures, we
used regression to analyse to what extent gender, age, education, and nationality could explain
the observed differences in some of the answers. During the early stages of the analysis it was
discovered that the responses contained a few answers that seemed to reflect
misunderstandings or unwillingness to confront the difficult choices presented in the
questions. For instance, some respondents reported a willingness to pay that was above 999
millions. Although logically possible, this is empirically unlikely but the survey format was
such that they had to give an answer to go on to the next question. Because of this it seems
that these respondents filled in a very large sum in order to indicate either a refusal to answer,
or more likely, to express an infinite value – that no amount of money would be too high.
Including these numbers when calculating averages was difficult since it implied that some
8

8/14/2019 Human Costs of Drug Use v29
http://slidepdf.com/reader/full/human-costs-of-drug-use-v29 9/27
very large observations would influence the results greatly. This problem was dealt with by
focusing on median values in the questions discussing monetary values.
How many are affected?
In Copenhagen, Oslo and Stockholm more than half of the respondents had at some point in
their lives been worried about drug use for somebody they knew personally (see Table 2). In
Helsinki their share remained a little below a half (45%). Consequently the share of worried
respondents within the past 12 months was over 20% for Copenhagen, Oslo and Stockholm,
and 13 % for Helsinki. A large share of the population, a majority in Stockholm and more
than one third in other capital cities, personally knew somebody who had been treated for
addiction to illegal drugs. For more than 10% this had taken place within the past 12 months.
Table 2. “Have you ever felt worried about the drug use of a person you know personally?”
and “Do you personally know somebody who has been treated for addiction to illegal
drugs?”
Yes, know & worried Yes, know treated
L ife 12 life 12
Copenhagen 67 27 38 10
Helsinki 45 13 38 14
Oslo 61 22 49 14
Stockholm 56 28 54 18
These numbers indicate, first of all, that drug problems are not isolated to a small minority. In
most capitals more than half of the respondents had personally known and been worried about
somebody with a drug problem. This is perhaps a better and more easily understood measure
of how large the problem is than an abstract and inaccurate monetary estimate of the social
cost of drugs. However before accepting the numbers as reliable and valid, one must examine
the numbers more closely with particular attention to the numbers from Finland.
9
8/14/2019 Human Costs of Drug Use v29
http://slidepdf.com/reader/full/human-costs-of-drug-use-v29 10/27
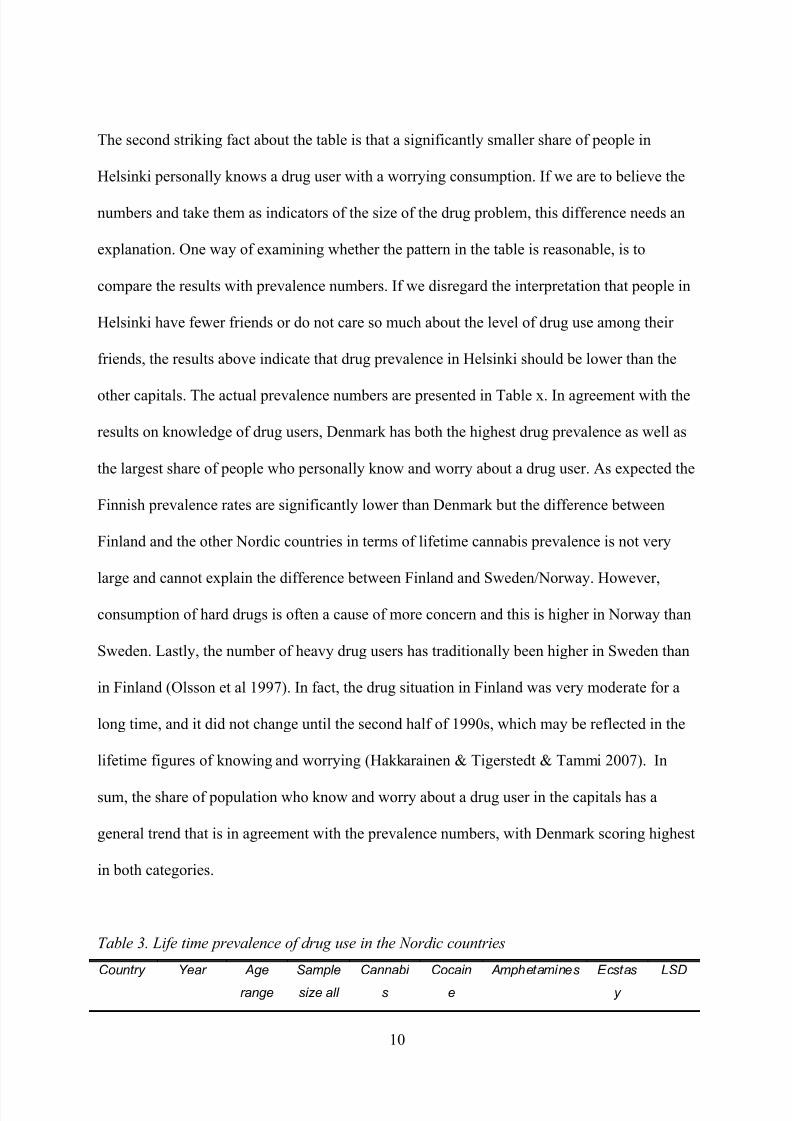
The second striking fact about the table is that a significantly smaller share of people in
Helsinki personally knows a drug user with a worrying consumption. If we are to believe the
numbers and take them as indicators of the size of the drug problem, this difference needs an
explanation. One way of examining whether the pattern in the table is reasonable, is to
compare the results with prevalence numbers. If we disregard the interpretation that people in
Helsinki have fewer friends or do not care so much about the level of drug use among their
friends, the results above indicate that drug prevalence in Helsinki should be lower than the
other capitals. The actual prevalence numbers are presented in Table x. In agreement with the
results on knowledge of drug users, Denmark has both the highest drug prevalence as well as
the largest share of people who personally know and worry about a drug user. As expected the
Finnish prevalence rates are significantly lower than Denmark but the difference between
Finland and the other Nordic countries in terms of lifetime cannabis prevalence is not very
large and cannot explain the difference between Finland and Sweden/Norway. However,
consumption of hard drugs is often a cause of more concern and this is higher in Norway than
Sweden. Lastly, the number of heavy drug users has traditionally been higher in Sweden than
in Finland (Olsson et al 1997). In fact, the drug situation in Finland was very moderate for a
long time, and it did not change until the second half of 1990s, which may be reflected in the
lifetime figures of knowing and worrying (Hakkarainen & Tigerstedt & Tammi 2007). In
sum, the share of population who know and worry about a drug user in the capitals has a
general trend that is in agreement with the prevalence numbers, with Denmark scoring highest
in both categories.
Table 3. Life time prevalence of drug use in the Nordic countries
Country Year Age
range
Sample
size all
Cannabi
s
Cocain
e
Amphetamines Ecstas
y
LSD
10

8/14/2019 Human Costs of Drug Use v29
http://slidepdf.com/reader/full/human-costs-of-drug-use-v29 11/27
all
adults
adults
Denmark 2005 16–64 13310 36.5 4.0 6.9 1.8 1.7
Finland 2006 15–64 2802 14.3 1.1 2.2 1.6 1.1
Norway 2004 15–64 2669 16.2 2.7 3.6 1.8 1.1
Sweden 2000 16–64 1750 12.5 0.7 1.9 0.2 0.3
Source: EMCDDA (http://www.emcdda.europa.eu/stats08/gpstab1a)
Affected in what way?
In all the capitals more than 20% of the respondents answered that they had experienced fear
of violence from a drug user they knew personally in their lifetime, with between 5% and 9%
having experienced this during the past 12 months (see Table 4).. Roughly 10% had sought
professional help for themselves as a result of their relationship with the drug user, and 3%
had done so during the last year. With the exception of Finland few had called the police
because of the illegal drug use of somebody they knew personally – between 3 % and 11 %
had ever done so and between 1% and 3% had done so during the last year.
Table4: Have you ever feared violence/sough professional help/called the police because of
the use of drugs among somebody you know personally?”
Feared violence Sought professional help Called policeLife Last 12
months
Life Last 12
months
Life Last 12
months
Copenhagen 21 5 8 2 3 1
Helsinki 30 9 12 4 11 3
Oslo 20 5 10 4 4 1
Stockholm 23 7 13 3 6 1
One of the interesting facts about the results in Table 4, is that despite having the lowest
prevalence and lowest share of people who know and worry about a drug user, Helsinki ranks
11

8/14/2019 Human Costs of Drug Use v29
http://slidepdf.com/reader/full/human-costs-of-drug-use-v29 12/27
highest on several indicators of how badly affected those who know drug users are. In
Helsinki those who know drug users have a higher fear of violence and a much higher history
of calling the police. One possible explanation for this could be that the rarer drug use is, the
more frightening it is for those who are close to a drug user. Denmark, for instance, has
traditionally de-mystified drug use and although the prevalence numbers are high, they score
low in term of how badly people are affected. On the other hand, until to the end of 1990s
drug policy in Finland was based mainly on police control, and it is possible that people still
put reliance on police authorities as their first reaction (Tammi 2007). However, it is also
possible that the measured categories do not capture all the main dimensions of harm to others
and for this reason a broader question was necessary. This brings us over to the next question
which made the respondents reflect on the overall impact they had experiences as a result of
knowing a drug user.
When those who knew drug users were asked to what extent the drug use had affected them
on a scale from 0 (no harm) to 10 (“it has ruined my life”), the average answer was between 2
and 2.6 in a life perspective and slightly higher than 1 during the past year in all the capitals
(see Table 5).. This time the respondents in Helsinki reported the lowest average, thus
indicating that this question captured the many different dimensions of harm better than the
previous one-dimensional questions about fear of violence, calling police and seeking
professional help.
Table 5: If you know somebody who use drugs regularly, how would you say it has it affected
you on a scale from 0 to 10 (0 is “no negative effect” and 10 is “it has ruined my life”)
Life
perspective
Last 12
months
Expected (if friend
started to use)
Copenhagen 2.6 1.2 3.9
Helsinki 2.0 1.1 5.7Oslo 2.6 1.4 6.1
12

8/14/2019 Human Costs of Drug Use v29
http://slidepdf.com/reader/full/human-costs-of-drug-use-v29 13/27
Stockholm 2.5 1.2 6.2
A total score of 1 or 2 may not seem like a large harm on a scale of 10, but the average
conceals a minority who are significantly negatively affected. This is visualized in Figure 1
which shows the share of respondents who report a harm of 5 or higher. In Copenhagen and
Oslo more than 20% of those knowing drug users reported a harm of 5 or higher as a result of
knowing drug users during their lifetimes. In Stockholm it was close to 20%, while in
Helsinki it was about 15%. Even limiting the period to the past year, almost 10% reported to
have been seriously negatively affected. This gives some indication that although the average
impact may be low and most people knowing drug users are only moderately affected, there is
a significant minority – about 10% of those who know drug users – who suffer greatly.
The answers about harm also contain a significant gender imbalance. As illustrated in Figure
2, females reported much higher negative harm as a result of knowing drug users as compared
with males. The tendency was the same in all the capitals and it shows a gender dimension of
human costs that estimates of social costs often overlook. When using reported harm as an
indicator of drug problems, it is easy to identify groups that suffer more than others and to
quantify exactly how much more they are affected.
Finally, the nature of the relationship to the drug user is of great importance. As expected,
those who know someone in their close family who are drug users, report the highest
sufferings on average while the other relationships – friends, neighbours, colleagues and so on
– report significantly less harm (Table 6).
13

8/14/2019 Human Costs of Drug Use v29
http://slidepdf.com/reader/full/human-costs-of-drug-use-v29 14/27
Figure 1. “How has it affected you during the last 12 months?” Percentage responding with
5 or more on a scale where 0 is no negative effect and 10 is “it has ruined my life”
0,0
5,0
10,0
15,0
20,0
25,0
Co enha en Helsinki Oslo Stockholm
Whole life
Last 12 mo
14

8/14/2019 Human Costs of Drug Use v29
http://slidepdf.com/reader/full/human-costs-of-drug-use-v29 15/27
Figure 2. Gender differences in harm. If you know somebody who use drugs regularly, how
would you say it has it affected you on a scale from 0 to 10 (0 is no negative consequences
and 10 is “it has ruined my life”)
0,00
0,50
1,00
1,50
2,00
2,50
3,00
3,50
Male Female Male Female Male Female Male Female Male FemCo enha en Helsinki Oslo Stockholm Total
Table 6. If you know somebody who use drugs regularly, how would you say it has it affected
you on a scale from 0 to 10 (0 is no negative consequences and 10 is “it has ruined my life”)
Life perspective Last 12 monthsClose family
member
Other
relations
Close family
member
Other
relations
Copenhagen 3,7 2,3 2,3 1,0
Helsinki 2,0 1,0 4,2 1,8
Oslo 3,6 2,4 2,4 1,2
Stockholm 3,8 2,2 2,2 1,0
To measure the relative contribution of the various factors that could influence the suffering
when they were all considered together, we also did a linear multiple regression analysis. The
15

8/14/2019 Human Costs of Drug Use v29
http://slidepdf.com/reader/full/human-costs-of-drug-use-v29 16/27
dependent variable was the reported suffering (0-10) and as shown in Table 7, being female
on average increased the suffering by 0,7 and being in close family with the drug user
increase it by further 1,1. Age and having a university education was less important. The
differences between the countries are also evident in the regression results, with “Living in
Helsinki” leading to a score that is on average lower by 1,3 on the subjective suffering index
compared to the benchmark country (Sweden). The regression results confirm that the
patterns found when examining one factor at a time also holds when we consider many factors
at the same time.
Table 7. Linear regression of reported suffering (scale 0-10) on some variables
Coefficient Std. Error
Constant 1,30* 0,24
Female 0,76* 0,12
Age 0,01* 0,004
Tertiary education 0,05 0,12
How many drug users they know 0,06* 0,01
Is the drug user a family member? 1,13* 0,16
Live in Oslo 0,14 0,16
Live in Copenhagen 0,06* 0,16
Live in Helsinki -1,29* 0,17* Statistically significant at the 5% level. R-squared is 0,14
In order to better understand the harms reported on the harm scale the respondents were also
asked to rank some other illnesses and situations on a scale from 0 to 10 (Figure 3). In this
way one may find a reference point for how bad a harm of 2 or 5 is interpreted to be. For
instance, the respondents indicated that for a young adult becoming addicted to drugs was
about as bad as becoming blind with a harm score of about 7.5. Becoming paralyzed or
getting lymph cancer was ranked as slightly worse than drug addiction while having diabetes
or asthma was given a value of about half that of becoming a drug addict.
16

8/14/2019 Human Costs of Drug Use v29
http://slidepdf.com/reader/full/human-costs-of-drug-use-v29 17/27
Although the numbers are interesting, one needs to be careful when interpreting these results.
In addition to the unavoidable problem of how different people interpret “becoming addicted
to drugs”, “cancer” and so on, there is a problem of determining the validity of the scores.
People who have not experienced something themselves often have wrong conceptions of
how bad or good something is. This means that one should not to simply use the results to
argue that “becoming addicted to drugs is about as bad as becoming blind.” Or that “people
reporting 4 on the harm scale when asked about how they have been affected by drug use
among friends means that they suffer a harm equivalent to getting diabetes.”
The problem is well illustrated by comparing answers about experienced level of harm among
those who know drug users to expected level of harm among those who do not know drug
users (Table 5). Those who do not personally know a drug user believe they would experience
very high levels of harm if they had had a friend who used drugs. The expected harm was
more than twice as large as the experienced harm reported among those who actually knew a
drug user. This shows that it is difficult to use expected harm to assess the actual level of
harm. It also suggests that an important part of the harm of drugs is related to fear and that the
fear itself is not well founded.
The fact that there are several problems with the ability of people to give answers to the
question of how much harm they believe drug addiction or illnesses would cause does not
imply that the answers have no meaning at all. If the answers were random, we would not
expect the pattern to vary systematically. In fact figure illustrates that the answers about harm
from various illnesses and situations are remarkable similar across countries. This is
consistent with the interpretations that the question captures a stable perception and that the
17

8/14/2019 Human Costs of Drug Use v29
http://slidepdf.com/reader/full/human-costs-of-drug-use-v29 18/27
question of experienced harm between 0 and 10 is meaningful and useful, especially when we
only use the answers from those who have actually experienced the harm.
Figure 3: On a scale from 0 to 10, how bad is the following for a young adult …
0,00
1,00
2,00
3,00
4,00
5,00
6,00
7,00
8,00
9,00
10,00
B l i n d
P a r a l
y z e d
D i a b
e t e s
D e a t h
C a
n c e r
D r u g a
d d i c t
A s t h m
a
l c o h
o l a d d i c t
S e v e r e
b u r n
Copenha
Helsinki
Oslo
Stockhol
Harm measured in money?Social costs are often measured in money. The question then becomes whether it is possible to
quantify the harm suffered by friends and family in monetary terms in order to include it in
the overall measure of the social cost of drugs? One way of doing so would be to explore
individuals’ willingness to pay in order to treat drug addicts. The problem is that it is difficult
to know whether the answers reveal a true willingness or if the answer is influenced by the
wording of the question and other well known mechanisms that may distort the answer. In
18
8/14/2019 Human Costs of Drug Use v29
http://slidepdf.com/reader/full/human-costs-of-drug-use-v29 19/27
order to examine this, we asked several questions. Firstly, we asked about willingness to pay
for a friend. Secondly, we asked about willingness to pay for treatment for a drug addict in
general by way of increasing taxes. Thirdly, we asked more open ended questions in which
the respondents could state the amount of money they were willing to pay in order to pay for
the treatment of their children, their spouses, and their friends.
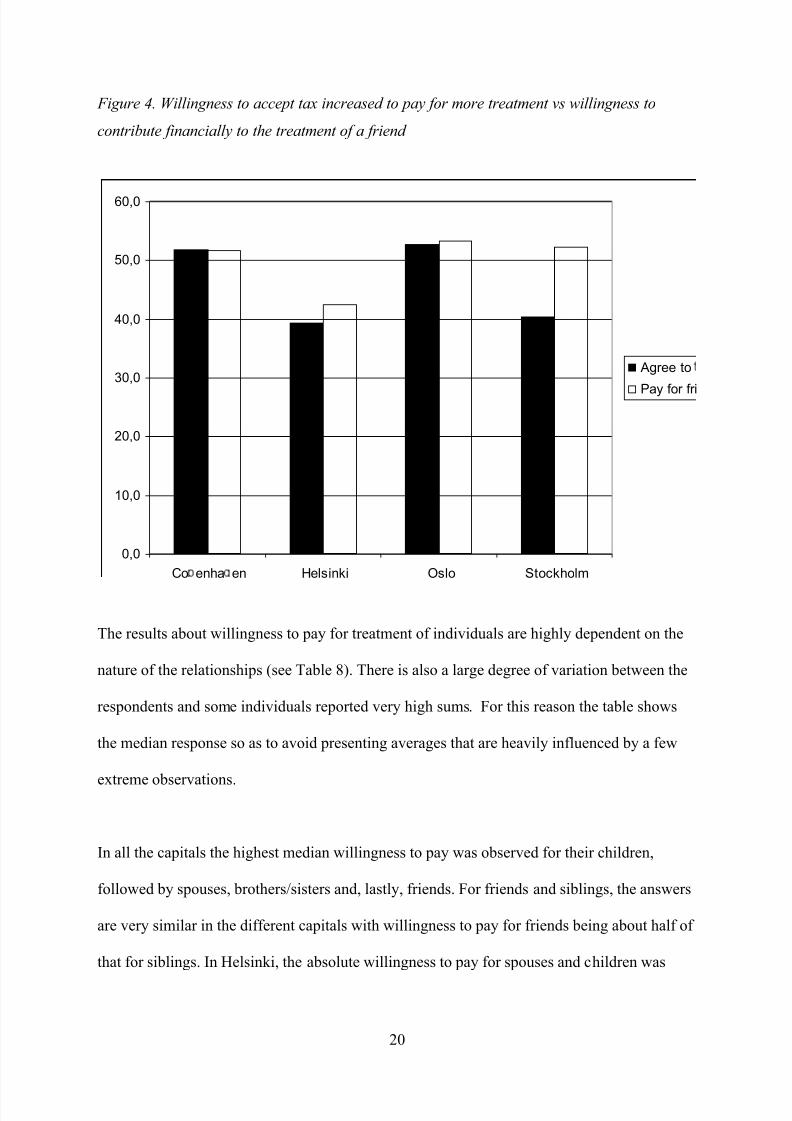
The results in Figure 4, show that in Norway and Denmark there was a slight majority in
favour of a tax increase of about 100 Euro for each tax-payer to finance the treatment of 800
more addicts each year, while in Sweden and Finland about 40% agreed. When asked whether
they would contribute about 500 EURO to help finance treatment for a friend, the respondents
gave slightly more positive answers in all countries, with the exception of Sweden where
asking about a contribution to a friend gave a significantly higher positive response (an
increase of 12 percentage points to 52%) than a tax-increase for more treatment.
19
8/14/2019 Human Costs of Drug Use v29
http://slidepdf.com/reader/full/human-costs-of-drug-use-v29 20/27
Figure 4. Willingness to accept tax increased to pay for more treatment vs willingness to
contribute financially to the treatment of a friend
0,0
10,0
20,0
30,0
40,0
50,0
60,0
Co enha en Helsinki Oslo Stockholm
Agree to
Pay for fri
The results about willingness to pay for treatment of individuals are highly dependent on the
nature of the relationships (see Table 8). There is also a large degree of variation between the
respondents and some individuals reported very high sums. For this reason the table shows
the median response so as to avoid presenting averages that are heavily influenced by a few
extreme observations.
In all the capitals the highest median willingness to pay was observed for their children,
followed by spouses, brothers/sisters and, lastly, friends. For friends and siblings, the answers
are very similar in the different capitals with willingness to pay for friends being about half of
that for siblings. In Helsinki, the absolute willingness to pay for spouses and children was
20

8/14/2019 Human Costs of Drug Use v29
http://slidepdf.com/reader/full/human-costs-of-drug-use-v29 21/27
substantially smaller than in the other countries, but the relative willingness to pay for
children compared to spouses was highest in Helsinki.
Table 8. “About how much of your own money do you think you would be willing to pay for
the treatment of your own …” (median answers converted to EURO)
Friend Brother/siste
r
Child Spouse
Copenhagen 678 1 356 13 563 6 782
Helsinki 500 1 000 5 000 2 000
Oslo 575 1 149 11 494 5 747
Stockholm 505 1 009 7 569 5 046
Human costs as a cost compared to other cost categories
By combining the information in the various questions it is possible to get an idea about
importance of human harm of drug use for friends and family of drug users comparet to the
other costs commonly associated with drug use. Using Kleinman’s (1999) suggestion about
measuring human costs by the willingness of friends to pay for treatment, we first examine
the number of respondents who have drug using friends and are willing to pay at least 450
Euros to pay for the treatment of a friend. For instance, in Oslo 14% of the respondents
fulfilled these two conditions. If 14% of the adult population in Norway are willing to pay at
least 450 Euro, this implies that human costs associated with drugs is at least 29 million Euro
or about 52 Euros per capita. As a comparison, about 30% of jail inmates in Norway are
convicted of drug offences which imply an average prison cost of about 17 Euro per capita.
This illustrates that human costs represent a large component of the social cost of drugs and
that ignoring it would produce very misleading estimates.
One might argue that reported willingness to pay is often higher than actual willingness. This
is likely, but it should also be noted that the estimate above is conservative for several
reasons: Some of the respondents reported that they were willing to pay much more than the
21

8/14/2019 Human Costs of Drug Use v29
http://slidepdf.com/reader/full/human-costs-of-drug-use-v29 22/27
sum listed in the question and used in the calculation (450 Euros), some have more than one
friend whom they would be willing to pay for, the estimate does not include the much higher
willingness to pay for spouses and children, and as shown by the tax question many are
willing to pay for treatment even when they do not personally know people who use drugs.
Taking into account all of these factors would produce a much larger sum. However, to
establish the importance of human costs compared to other cost categories, it is not necessary
to make more complicated calculations. Even when it is conservatively estimated human costs
in monetary units is larger than prison costs which is one of the other major cost components
in traditional analysis of social costs of drugs.
The experience with using question about money was mixed. While the medians and averages
seemed to be quite stable and similar in different countries, some respondents were clearly
unfamiliar and uncomfortable with these kinds of questions. About ten Norwegian
respondents were very negative to these questions in the open comments they filled in after
doing the survey. This provides an important lesson for how one should go about measuring
human costs in the future. Direct monetary questions about valuation may give some results
that are useful on average or as a conservative estimate using the most reliable answers, but
question about harm on a scale from 0 to 10 do not create similar emotional reactions provide
more stable answers that are even more easily interpreted.
Conclusions
Our results show that it is important to include human costs to get a more accurate picture of
the overall cost of drugs in society. Even very conservatively measured the cost of human
costs among relatives outweighs other large costs that are often included when estimating the
cost of drugs, such as the prison cost for drug offences. Ignoring human costs could lead to
under-estimation which in turn could result to under-prioritization of the area as a whole. The
22

8/14/2019 Human Costs of Drug Use v29
http://slidepdf.com/reader/full/human-costs-of-drug-use-v29 23/27
survey also indicate that it may be more stable and useful to measure suffering not in terms of
money since respondents often have difficulties answering these questions. Instead, simple
questions about knowledge and suffering on a 0-10 scale seemed to give more meaningful
answers. These results show that every year about 25% of the population of the capital cities
know and worry about a drug users and that about 10% of those knowing drug users report a
harm of more than 5. Finally, the results highlight the unequal distribution of the costs. The
main costs were not born by the state or society at large, but the females who were close to
the drug user. Although this is not surprising, the extent and size of the difference between
suffering reported by males and friends on the one hand, and female and relatives on the
other, was very large.
We know that a net survey method has some uncontrollable methodological problems in
regard to representativeness of the data. As we have seen, those completed a university degree
were overrepresented in our data. It is also possible that the subject of the study has tempted
those knowing and worrying to answer the questionnaire. On the other hand, because there are
no other similar studies done so far it is hard to evaluate how reliable the prevalence figures
for knowing and worrying really are. However, as we have seen, data from four different
cities behave in quite a reasonable and consistent way. So, even if the study is a pioneering
and explorative work, it also illustrates that it is possible to make some progress on the
quantification of human harm among friends and family of drug users.
23
8/14/2019 Human Costs of Drug Use v29
http://slidepdf.com/reader/full/human-costs-of-drug-use-v29 24/27
References
CAULKINS, J., AND REUTER , P (1997) Setting Goals for Drug Policy: Harm Reduction or
Use Reduction? Addiction, 97 (9), 1143-1150
CULYER, A., EATON, G., GODFREY, C., KOUSTOLIOUTSOS, H. & MCDOUGALL, C.
(2002) Economics & Social cost of substance misuse in the United Kingdom: Review
of the methodological and empirical studies of the economic and social costs of illicit
drugs. York, University of York, Centre for Criminal Justice, Economics, and
Psychology.
FRENCH, M. T. P. & MARTIN, R. B. B. (1996) The Costs of Drugs Abuse Consequences: A
summary of Reasearch Findings. Journal of Substance Abuse Treatment, 13, 453-466.
HAKKARAINEN, P., TIGERSTEDT, C. & TAMMI, T. (2007) Dual-track drug policy:
Normalization of the drug problem in Finland. Drugs: education, prevention and
policy, 14, 543–558.
KLEINMAN, MARK A. R. (1999) “Economic cost’ measurements, damage minimization
and drug abuse control policy“, Addiction 94(5):638-641.
McFADDEN, M. (2006) The Australian Federal Police drug harm index: A new methodologyfor quantifying success in combating drug use. Australian Journal of Public
Administration, 65:68–81.
MacDONALD, Z; Tinsley, L; Collingwood, J; Jamieson, P; Pudney, S. (2005) Measuring the
harm from illegal drugs using the drug harm index. United Kingdom Home Office.
Available: http://www.homeoffice.gov.uk/rds/pdfs05/rdsolr2405.pdf
MOORE TJ, CAULKINS JP. (2006) How cost-of-illness studies can be made more useful for
illicit drug policy analysis. Applied Health Economics and Health Policy, 5(2):75-85.
OLSSON, B., STYMME, A., HAKKARAINEN, P., SCHMIDT, D., SKRETTING, A. &
VALSSON K. (1997) The Nordic drug scene in the 1990s – Recent trends. Nordisk
alcohol- & narkotikatidskrift, 14 (English Supplement), 64–82.
RITTER, A. (2007) Comparing Alcohol Policies Between Countries: Science or Silliness?PLoS Medicine 4(4): e153. doi:10.1371/journal.pmed.0040153
REUTER, P. (1999) Are calculations of the economic costs of drug abuse either possible or
useful? Addiction, 94, 635-638.
SINGLE, E., ROBSON, L., XIE, X. & REHM, J. (1998) The Economic costs of alcohol,
tobacco, and illicit drugs in Canada, 1992. Addiction, 93, 991-1006.
TAMMI, T. (2007) Medicalising prohibition. Harm reduction in Finnish and international
drug policy. Helsinki: Stakes.
ZARKIN G A; CATES S C; BALA M V (2000) Estimating the willingness to pay for drug
abuse treatment: a pilot study. Journal of substance abuse treatment 2000;18(2):149-
59.
24
8/14/2019 Human Costs of Drug Use v29
http://slidepdf.com/reader/full/human-costs-of-drug-use-v29 25/27
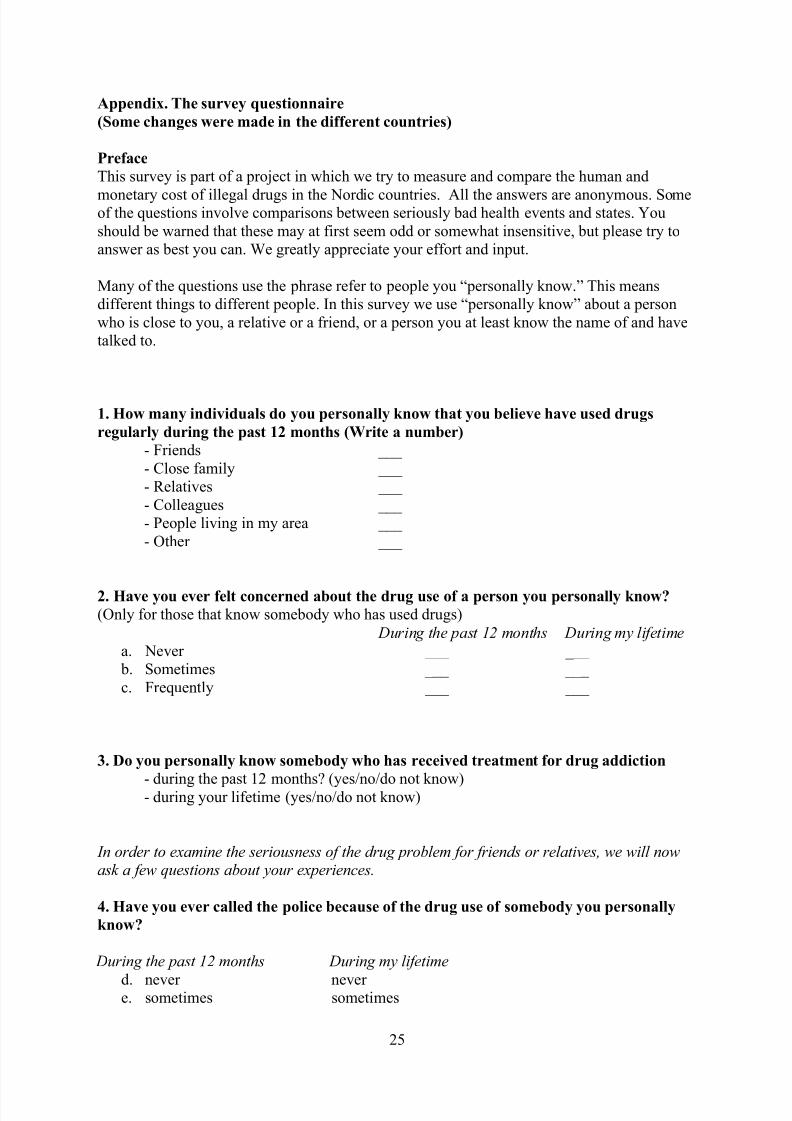
Appendix. The survey questionnaire
(Some changes were made in the different countries)
Preface
This survey is part of a project in which we try to measure and compare the human and
monetary cost of illegal drugs in the Nordic countries. All the answers are anonymous. Someof the questions involve comparisons between seriously bad health events and states. You
should be warned that these may at first seem odd or somewhat insensitive, but please try to
answer as best you can. We greatly appreciate your effort and input.
Many of the questions use the phrase refer to people you “personally know.” This means
different things to different people. In this survey we use “personally know” about a person
who is close to you, a relative or a friend, or a person you at least know the name of and have
talked to.
1. How many individuals do you personally know that you believe have used drugs
regularly during the past 12 months (Write a number)
- Friends ___
- Close family ___
- Relatives ___
- Colleagues ___
- People living in my area ___
- Other ___
2. Have you ever felt concerned about the drug use of a person you personally know?
(Only for those that know somebody who has used drugs)
During the past 12 months During my lifetimea. Never ___ ___
b. Sometimes ___ ___
c. Frequently ___ ___
3. Do you personally know somebody who has received treatment for drug addiction
- during the past 12 months? (yes/no/do not know)- during your lifetime (yes/no/do not know)
In order to examine the seriousness of the drug problem for friends or relatives, we will nowask a few questions about your experiences.
4. Have you ever called the police because of the drug use of somebody you personally
know?
During the past 12 months During my lifetime
d. never never e. sometimes sometimes
25

8/14/2019 Human Costs of Drug Use v29
http://slidepdf.com/reader/full/human-costs-of-drug-use-v29 26/27
f. frequently frequently
5. Have you sought help for yourself from a doctor, a social worker or some other
professional because of the drug use of somebody you personally know?
During the past 12 months During my lifetimeg. never never
h. sometimes sometimes
i. frequently frequently
6. Have you ever felt a fear of violence because of the drug use of somebody you
personally know?
During the past 12 months During my lifetime j. never never
k. sometimes sometimes
l. frequently frequently
Preface to the next section: In order to say something about the human costs caused by drug
use we would like to ask you some questions that tries to reveal this, both on its own and bycomparing addiction to other events and people’s willingness to pay to avoid this.
7a. If you personally know somebody who use or have used illegal drugs on a regular
basis, how much would you say you have you been affected by this on a scale from 0 (no
negative impact) to 10 (it has ruined my own life)?
- During the past 12 months ___ - During my lifetime ___
7b. If you personally do not know somebody who use or have used illegal drugs on a
regular basis, how much do you believe you would have affected if a friend started to use
illegal drugs on a regular basis, on a scale from 0 (no negative impact) to 10 (it would
ruined my own life)?- During the past 12 months ___
- During my lifetime ___
8. On a scale from 0-10 where 10 is the worst possible that could happen to a young
adult, how would you rank the following events or states. Please assign each option a
number between 0 and 10 (It is possible to give different events the same number)
- Blind
- Paralyzed
- Diabetes
- Death- Lymph cancer
26

8/14/2019 Human Costs of Drug Use v29
http://slidepdf.com/reader/full/human-costs-of-drug-use-v29 27/27
- Drug addiction
- Asthma
- Alcohol addiction
- Very severe burn injury
9. Assume a tax increase of 100 EURO per tax-payer per year could finance a drugtreatment program that could treat 800 drug addicts. Would you support such a tax
increase?
a. Yes
b. No, I cannot afford or do not want any tax increase
c. No, if there is a tax increase I´d prefer it to be spent on other things
d. I do not know
10a. Imagine that one of your friends is addicted to drugs. Would you be willing to
spend 500 EURO of your own money to help pay for treatment?
(yes, no, do not know)
10b About how much of your own money do you think you would be willing to pay for
the treatment of …
- your friend
- your brother/sister
- your child
- your wife/husband/partner
(state sum. If you do not have children or siblings, please imagine a situation in which you
do)