human cities lesson 5 green map curriculum map curriculum human cities lesson 5 justice objectives...
TRANSCRIPT

115
By Joel Tolman
SUBJECTSScienceSocial StudiesGeography
Green Map Curriculum
Human Cities Lesson 5
Justice
Objectives
Overview
Materials and Resources
Environmental Justice
Glossary Terms:
At Common Ground High School, social studies and science teachers work together to off er a course titled Environmental Justice. This is one of several team-taught, interdisciplinary block classes at the heart of Common Ground’s curriculum. This set of activities explores some of the key concepts and content from Common Ground’s Environmental Justice course. These activities most likely fi t naturally into a science course, but could also be integrated into a social studies course focused on civics and government. It addresses key skills (developing hypotheses, analyzing data, taking and defending a position) that are relevant in both content areas. For this reason, both science and social studies standards are identifi ed (see standards section at the beginning of the Anthology). Each of the four activities in this mini-unit contains its own overview. The focus here is the city of New Haven, Conn., but it is general enough to be adapted to any city or urban setting.
Students will:1. Develop a deepened understanding of environmental justice.2. Use the inquiry process to complete a scientifi c investigation.3. Develop a hypothesis and collect data to test that hypothesis.4. Use the results of their investigation to communicate ways to eff ect change in their city related to environmental justice.
Internet access
Classroom
Four 60-minute class sessions
Setting
Time Needed
Community& Sustainability
116
Background Information
Urban Relevance
Procedure
“The environmental justice movement addresses a statistical fact: People who live, work and play in America’s most polluted environments are commonly people of color and the poor. Environmental justice advocates have shown that this is no accident. Communities of color, which are often poor, are routinely targeted to host facilities that have negative environmental impacts -- say, a landfill, dirty industrial plant or truck depot. Communities of color, low-income communities, and urban residents have been battling this injustice for decades.” – Natural Resources Defense CouncilMore at http://www.nrdc.org/ej/history/hej.asp
It is also important to take a global perspective on environmental justice. Examples are the waste products that are exported to countries like India and dumped or refined there, or the rare earths (used in cell phones worldwide) that are refined in rural China and cause enormous health and environmental problems. These are important aspects of environmental justice that are not related to the victims being of color.
Although environmental justice problems can occur anywhere, cities are focal points because of the large disparity of available resources from neighborhood to neighborhood and the high populations of low-income residents and people of color. Becoming aware of how we perceive the cities we live in, looking at the realities of environmental inequities, forming opinions and taking action are critical for anyone, but even more so if you are a city-dweller and live with environmental injustice, even if you do not know it.
Activity 1: What is environmental justice?
Overview: This set of activities helps students develop an understanding of environmental justice, learn more about environmental justice issues in their home city and beyond, and form opinions about environmental justice issues in their hometown. In the face of time constraints, the second or third part of this activity can be considered optional enrichment.
Part 1: Concept mapping: What is justice? What is environment? As an opener, ask students to write the words, images and situations they associate with two words: environment and justice. You can prompt them with additional questions:
•Doesjusticehavetomeaneveryoneistreatedequally?•Whatpeopleandorganizationshelptoupholdorcreatejustice?•Whatgetsinthewayofjusticeinourcity?•Istheenvironmentjustfloraandfaunainpristinesettings?Whatabouttheurban
environment – what is that like? Create two concept webs on the board side by side, one for each word. Then ask students to think about how these two concepts connect: What is environmental justice? Organize their ideas as links between the two concept maps.

117
Part 2: Hand out Principles of Environmental Justice, located at http://www.ejrc.cau.edu/princej.html. Ask students to highlight the words or phrases that seem most important to them. Then partners can turn and talk to their neighbors, considering these questions: What are the main ideas of environmental justice? What questions do you have after reading the principles? What does environmental justice have to do with us? Briefly discuss these ideas, adding to the concept map already created on the board.
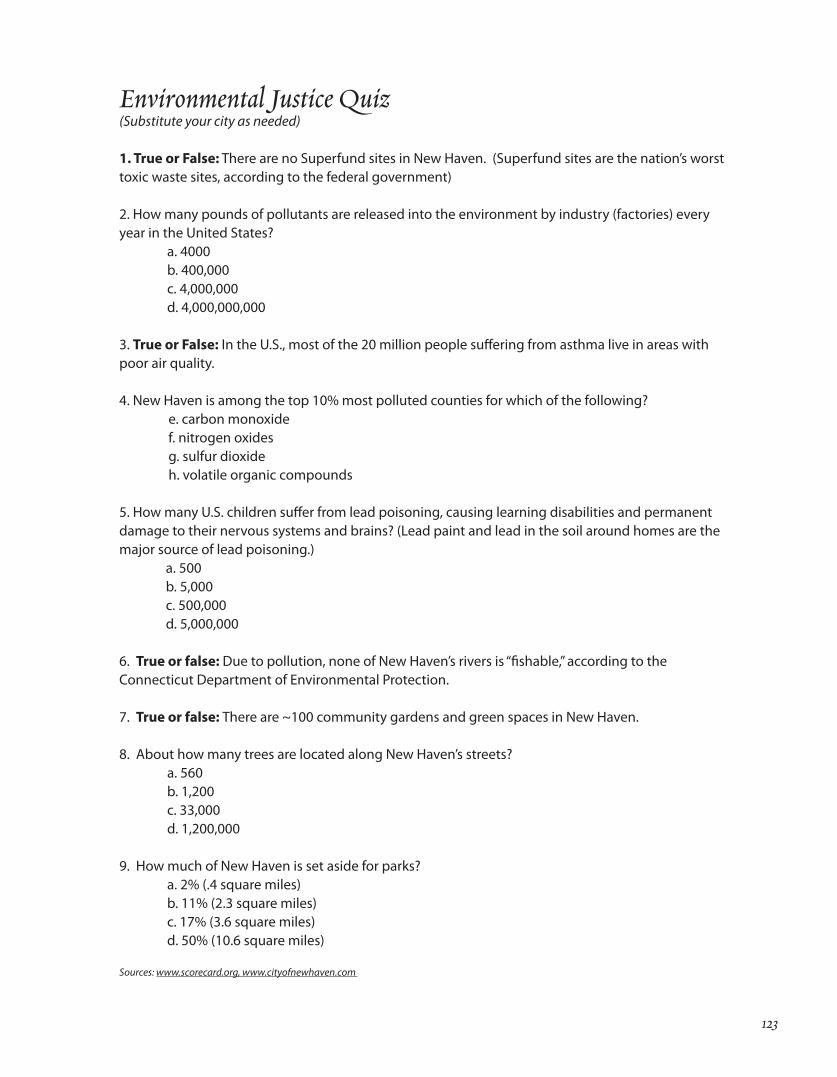
Part 3: Reality Check: environmental justice in our city. Hand out a brief true/false survey about environmental justice issues, focusing on New Haven but addressing broader issues as well (see “Environmental Justice Quiz”). This quiz can be modified to reflect questions specific to other cities. Ask students to do their best to answer the questions; then, share and discuss the correct answers.
Part 4: Forced choice: environmental justice. Give each student a set of Forced Choice cards: strongly agree, agree, disagree, strongly disagree (see attached Forced Choice cards). Ask them to consider a series of statements, all related to their home city and environmental justice. The teacher reads each statement, and students raise the forced choice card that corresponds to their feeling on this topic. Students then discuss their opinions; the teacher encourages them to support every statement with specific evidence. Sample Forced Choice statements (substitute the name of your students’ home city):
• New Haven is a dirty, polluted city.• New Haven residents don’t care about their environment. • New Haven is rich in environmental resources.• People who are Black or Latino are more likely to live in polluted neighborhoods and less likely to
have access to environmental resources like parks, gardens and clean water. • Some New Haven neighborhoods are full of environmental resources; others are full of
environmental problems.
Activity 2: Mapping environmental resources
Overview: This activity is organized as a scientific/social scientific investigation, answering a core question: Are environmental resources and hazards distributed evenly across the city? In other words, are certain parts of the city victims of environmental injustice, with few resources and many hazards? The activity builds on students’ understanding of environmental justice issues, developed in the previous lesson.
As a scientific investigation, this activity follows the steps of the inquiry process: asking questions, developing hypotheses, testing hypotheses, analyzing results and reporting conclusions.
© U
Mic
hael
Doo
little
, Com
mon
Gro
und
Common Ground students water testing in New Haven.

118
Part 1: Ask questions, develop hypotheses. Return to students’ final Forced Choice question from the previous day:
• Are some parts of the city full of environmental resources, while other parts are empty?
Explain that this is the essential question that the class will be exploring over the next several days. Then, ask students to develop guesses, or hypotheses, about how environmental resources are distributed in the city. Which parts of the city have lots of resources? Which have relatively few? Generate a list of hypotheses on the board. It is students’ responsibility to write their own hypothesis as part of their “lab report” for the project.
What is the Green Map? What if my city doesn’t have one?
Green Maps are locally created environmentally themed maps that use a universal symbol set and mapmaking resources provided by the nonprofit Green Map System. A Green Map plots the locations of a community’s natural, cultural and sustainable resources such as recycling centers, heritage sites, community gardens, toxic waste sites and socially conscious businesses. The purpose of a Green Map is to serve as a guide for sustainable living and to help everyone get involved with their community’s natural and human-made environment.
Recognizing that cities are home to environmental resources as well as environmental justice challenges, New Haven’s City Plan Department and the Yale Urban Resources Initiative came together to map the “green city.” The map that resulted shares information about green spaces, renewable and alternative resource generating locations, green economic development opportunities and more. The map is online at http://www.cityofnewhaven.com/cityplan/EnvironmentalInitiatives.asp
Students and teachers who live in a city that has not published a green map or something like it can still analyze the distribution of environmental resources in their community. Google Earth and Google Maps, for instance, locate many kinds of environmental resources, including parks, environmental organizations, playgrounds, green spaces, public access to water and hiking trails. Students can also work with a standard city map and overlay information about environmental resources in their cities, based on their knowledge of their neighborhoods, or based on a field trip in which they survey transects or research plots in search of environmental resources like these.
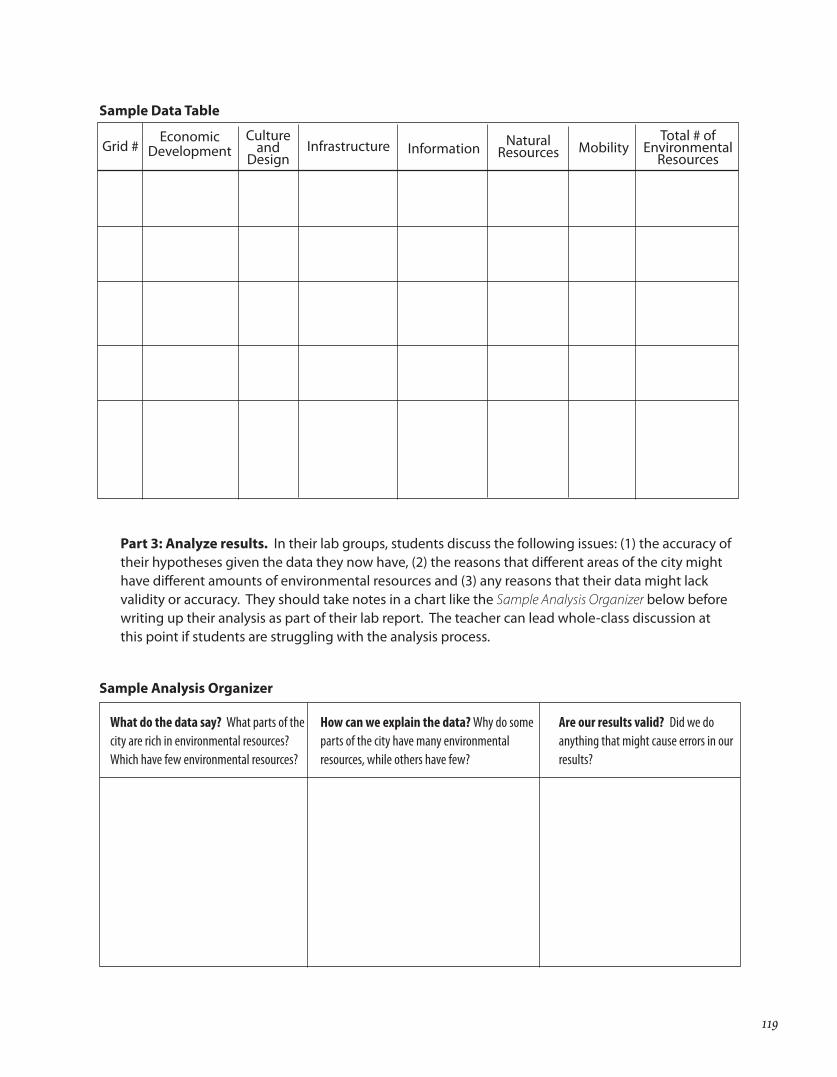
Part 2: Test hypotheses. In groups of two or three, students work with a copy of the Green Map to test their hypotheses. Each group picks, or is assigned, several different areas of the city based on the grid system used on the Green Map, ensuring that all parts of the city are covered. For each of these areas, students collect data on the number and types of environmental resources available, and record their data in a table. (This table can be provided by the teacher or designed by the students, depending on their knowledge of scientific inquiry. See Sample Data Table.) Students then use data charts and graphs to display the environmental resources present in each grid on the map. Again, if students need specific guidance, teachers can provide a format for these graphs, e.g., a bar chart showing each of the major types of environmental resources included on the Green Map.
This lesson uses the terms “environmental resources” and “environmental hazards” throughout. If your students are learning about other related terms, like “ecosystem services,” these terms can be substituted to reinforce student learning.
119
Part 3: Analyze results. In their lab groups, students discuss the following issues: (1) the accuracy of their hypotheses given the data they now have, (2) the reasons that different areas of the city might have different amounts of environmental resources and (3) any reasons that their data might lack validity or accuracy. They should take notes in a chart like the Sample Analysis Organizer below before writing up their analysis as part of their lab report. The teacher can lead whole-class discussion at this point if students are struggling with the analysis process.
Sample Data Table
Grid #Economic
DevelopmentCulture
and Design
Infrastructure Information Natural Resources Mobility
Total # ofEnvironmental
Resources
Are our results valid? Did we do anything that might cause errors in our results?
Sample Analysis Organizer
What do the data say? What parts of the city are rich in environmental resources? Which have few environmental resources?
How can we explain the data? Why do some parts of the city have many environmental resources, while others have few?
120
Part 4: Share and discuss results. Students are now ready to display, compare and discuss their data and results. They can do this in several ways: (1) Each group presents its graphs, copied onto overhead transparencies or displayed via LCD projector, and discusses what these graphs taught them about distribution of environmental resources in the city. (2) Students record their data on the Green Map itself, using graphs themselves or a color coding system to indicate which parts of the city are richest and poorest in environmental resources. (3) The teacher facilitates a discussion of students’ results, which she/he and students record into a chart like the one below, labeled Sample Analysis Organizer.
Activity 3: Mapping environmental hazards
Overview: This activity pushes students to look at environmental problems and deficits in the same way that the previous activity focused on environmental resources. Like the previous activity, it is a scientific investigation based on the steps of the inquiry process. It involves use of a powerful website, www.scorecard.org, which allows a person to view maps of major polluters anywhere in the country. This Web site requires some practice to navigate and access to computers equipped for Java. Teachers can choose to use printed maps that they generate from the website, or to have students generate and explore maps themselves (See Sample Maps).
Part 1: Ask questions, develop hypotheses. Ask students to brainstorm a list of hypotheses:
• Are environmental hazards and pollution sources distributed evenly over the city? • What areas might have higher concentrations? Why?
Encourage them to draw on what they learned by looking at environmental resources in the previous activity, and to consider their own experiences in the city. Ask them to record their hypotheses and remind them that they will be writing these up as part of their lab report. Part 2: Test hypotheses. Using maps from www.scorecard.org, students map environmental hazards onto their copy of the Green Map (or a standard map of their own city), using colored markers to distinguish different types of environmental hazards. Each group of students then works with several grids, as they did in the previous investigation, recording data on the number and types of environmental hazards present in this site. At this point, students are likely ready to develop their own data tables and determine what graph formats are appropriate. Part 3: Analyze results. In their lab groups, students discuss the following issues:
1. The accuracy of their hypotheses.2. The reasons why different areas of the city might have different amounts of environmental hazards.3. Any reasons that their data might be subject to error.
Students should take notes in a format like the Sample Organizer from the previous activity and write up their analysis as part of their lab report.

121
Part 4: Share and discuss results. Students display, compare, and discuss their data and results, as they did in the previous activity. Following this discussion, students should be ready to complete their final lab report, which can be graded using a science lab rubric aligned with the relevant academic standards for a particular state. Activity 4: Pursuing justice
Overview: This activity pushes students to share and use the results of their scientific investigations. It also provides an opportunity for students to practice their persuasive/argumentative writing skills and to consider how to enact change in the available environmental resources and hazards.
Part 1: Opener: Ask students to consider the following questions, first on their own, then with a neighbor, and finally as a whole class:
• Whose job is it to uphold environmental justice? • Who is responsible for providing access to environmental resources and minimizing
environmental hazards? • Who gets in the way of creating environmental justice?
Part 2: Discussion: A power map of environmental justice. Encourage students to share their answers to the opener question. Create a concept map of their responses on the board, showing the “who” of environmental justice. Ask students to consider who has the most power in upholding environmental justice, and who is most likely to listen to a group of high school students who have some information and opinions to share. As an additional step, you can ask students to consider the arguments or approaches that might convince one of these “power players” to act differently (See Sample Concept Map on next page).
© C
omm
on G
roun
d
Common Ground students investigating sustainability in downtown New Haven.

122
Our children have high rates of
asthma due to
Community members,
neighborhood associations
City government:Mayor and Board of
Aldermen
Who is responsible for environmental
justice?
Polluters:Factory owners, etc.
We elect you to keep our city safe, and
you’re not.
State Department of Environmental
Protection- EPA
Sample Concept Map
Part 3: Persuasive writing task: environmental justice. Explain students’ final task of this project: to share their results and their opinions with someone who has the power to uphold environmental justice. They should pick one of the individuals or groups from the power mapping activity and write a persuasive letter answering the question, Is New Haven an environmentally just city?
Discuss with the students the characteristics of effective persuasive or argumentative writing: 1. Take a clear stand2. Use powerful support3. Develop arguments4. Be well-organized 5. Write clearly and with conviction.
Remind students too of the sources they have to work from: the results of their scientific discussion, the class concept map of environmental justice, the survey results from the first activity and the document on principles of environmental justice. If students need more guidance, help them to brainstorm arguments and evidence they might use, given their audience and point of view. A chart like the Sample Persuasive Essay Organizer may help the process. The letters that result from this essay can be graded using a rubric aligned with Common Core content standards for argumentative writing.
123
Environmental Justice Quiz (Substitute your city as needed)
1. True or False: There are no Superfund sites in New Haven. (Superfund sites are the nation’s worst toxic waste sites, according to the federal government) 2. How many pounds of pollutants are released into the environment by industry (factories) every year in the United States?
a. 4000b. 400,000c. 4,000,000d. 4,000,000,000
3. True or False: In the U.S., most of the 20 million people suffering from asthma live in areas with poor air quality.
4. New Haven is among the top 10% most polluted counties for which of the following?e. carbon monoxidef. nitrogen oxidesg. sulfur dioxideh. volatile organic compounds
5. How many U.S. children suffer from lead poisoning, causing learning disabilities and permanent damage to their nervous systems and brains? (Lead paint and lead in the soil around homes are the major source of lead poisoning.)
a. 500b. 5,000c. 500,000d. 5,000,000
6. True or false: Due to pollution, none of New Haven’s rivers is “fishable,” according to the Connecticut Department of Environmental Protection.
7. True or false: There are ~100 community gardens and green spaces in New Haven.
8. About how many trees are located along New Haven’s streets? a. 560 b. 1,200 c. 33,000 d. 1,200,000
9. How much of New Haven is set aside for parks? a. 2% (.4 square miles) b. 11% (2.3 square miles) c. 17% (3.6 square miles) d. 50% (10.6 square miles)
Sources: www.scorecard.org, www.cityofnewhaven.com
124
Forced Choice Cards(Cut apart with scissors)
STRONGLY AGREE
AGREE
DISAGREE
STRONGLY DISAGREE
125
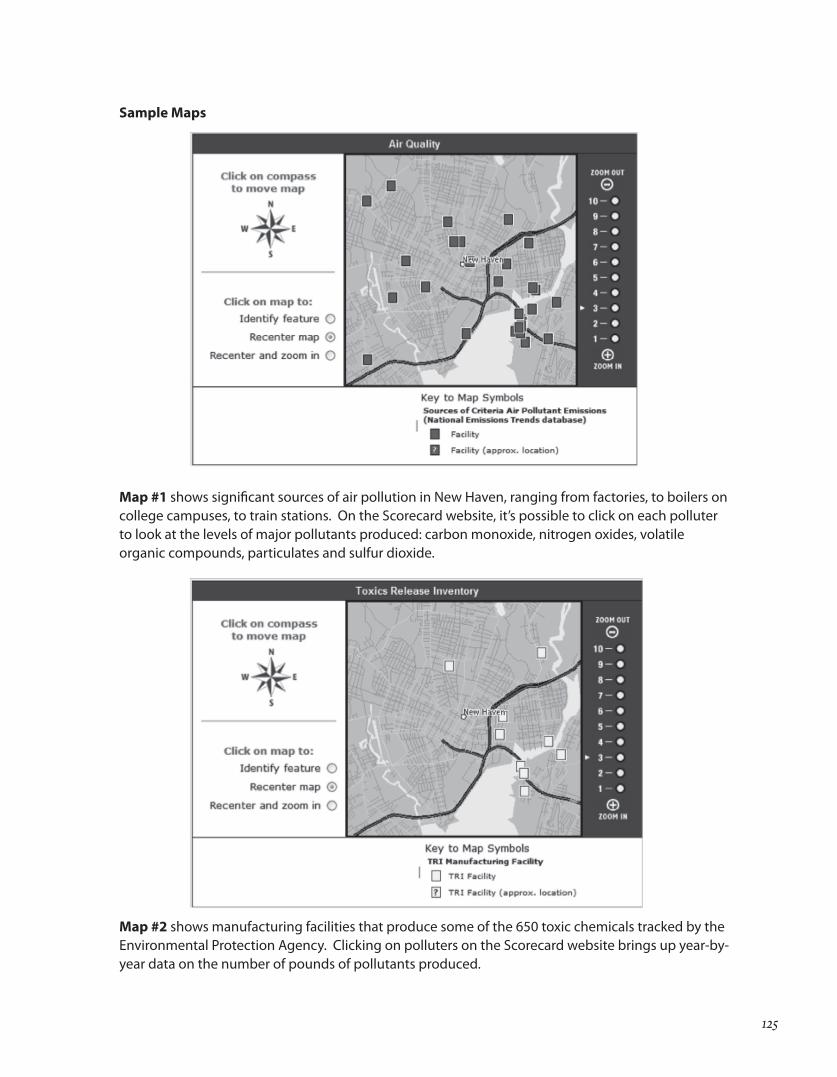
Sample Maps
Map #1 shows significant sources of air pollution in New Haven, ranging from factories, to boilers on college campuses, to train stations. On the Scorecard website, it’s possible to click on each polluter to look at the levels of major pollutants produced: carbon monoxide, nitrogen oxides, volatile organic compounds, particulates and sulfur dioxide.
Map #2 shows manufacturing facilities that produce some of the 650 toxic chemicals tracked by the Environmental Protection Agency. Clicking on polluters on the Scorecard website brings up year-by-year data on the number of pounds of pollutants produced.

126
Map #3 is coded based on the level of cancer risk caused by various hazardous air pollutants (HAPS). From www.scorecard.org: “What is the largest source contributing to added cancer risk from hazardous air pollution in your community? The answer may surprise you. Mobile sources including both on-road vehicles (such as cars, trucks and buses) as well as off-road equipment (such as ships, airplanes, agricultural and construction equipment) contribute significantly to air pollution. Diesel emissions are the predominant source of cancer risk in Scorecard’s assessment of hazardous air pollutants.”
Common Ground students plant trees to help make New Haven greener.
© U
rban
Res
ourc
es In
itiat
ive

127
Sample Persuasive Essay Organizer
In a persuasive letter, your job is to TAKE A STAND, support that stand with SPECIFIC ARGUMENTS, and back up each argument you make with EVIDENCE FROM THE TEXT. Once you have decided which side you are taking, but before you write your letter, use the chart below to organize the arguments and evidence you will use to support this position.
Argument Evidence from Sources
S U B M I T T E D B Y
THE KEYSTONE CENTER
Keystone, Colorado
Founded in 1975, The Keystone Center is an independent nonprofit organization that brings
together public, private and civic sector leaders. It provides mediation and facilitation services that
incorporate innovative decision-making methods. The result: action-oriented, sustainable solutions
to complex energy, environmental and public health issues. As Keystone engages leaders of this
generation, it also educates the next, providing teachers and students with meaningful outdoor
learning experiences that inspire scientific inquiry, leadership development and civic
engagement. The Keystone Center helps leaders in energy, environment, health and education
battle contentious issues with a consensus-based approach, and teaches science and leadership to
students and educators using a non-biased framework.
www.keystone.org