hull scanning measurement guide - orc
TRANSCRIPT

World Leader in Rating Technology
OFFSHORE RACING CONGRESS
Hull scanning measurement guide

2
Introduction
Hull and appendage shapes and geometries is one of the most important factors for predicting a boat's
performance. Not just point measurements as waterline while sailing, but complete information ableto return
displacement, wetted surface, and the volume distribution along the hull. This and appendage shapes and
positions are the basis from which hydrodynamic forces of lift and drag can be calculated can be calculated
through the Lines Processing Program (LPP) that gives all the relevant hydrostatics data used by the Velocity
Prediction Program (VPP) to generate ORC Rating certificates and their polar speeds.
At the beginning of the IMS during the the 1980’s and 1990’s, special hull measurement instruments were
developed to take hundreds of points on the hull organized in the “offset” file, a way to describe the hull
geometry that remains today in use for ORC International and ORC Club certificates as well as recently
introduced in ORC Superyacht and ORC Multihull certificates.
Nowadays, the latest laser technology has introduced new instruments that can be used with sufficient accuracy
and affordability to make the hull scanning measurement in the field much quicker. This guide is intended to
give basic instructions on how to capture the geometry of the hull with its appendages with a 3D scanner and
provide a cloud of points that can be processed by the ORC Technical Staff to generate a hull offset file.
1. Hull offset file
An offset file (.OFF) describes the body plan of the hull together with appendages. It contains points
distributed on consecutive vertical transverse sections along the length of the boat, within the
coordinates system defined as follows:
a) X axis – longitudinal with 0 at stem and positive towards the stern
b) Y axis – transverse with 0 at the centerline and positive outwards
c) Z axis – vertical with 0 at the waterline and positive upwards
Each station is defined by its X, the number of points, a side code and a special code, and is followed
by a sequence of Z, Y coordinates for each point on that station, ordered from the bottom at centreline
up to the sheer at side.

3
2. Cloud of points
The purpose of 3D scanning is to gather a cloud of points for hull and appendages from which the offset
file as described above may be created. The final results of scanning shall be a simple text ASCII file
file containing x, y, z coordinates of all points in the coordinates system as defined above. The process
shall include following steps:
- Preparation
- Marking freeboard points
- Scanning
- Cleanup and data post processing
2.1 Boat preparation
The boat needs to be ashore free of obstructions, in a cradle or supported by jack stands, with the rudder
on center and as little of the boat as possible parts covered by a cradle. The keel and bulb, if any, shall
be visible as much as possible and there should be enough space around the boat to set up the
measurement instrument for the scan. The boat shall not be hanging on the crane as its movement may
cause inaccurate measurements. It is important to have the boat secured firmly without any possible
movement.
2.2 Marking freeboard points
The most important part of the scanning procedure is to mark the freeboard points since it is from these
points that the in-water freeboard measurements are performed and from which displacement, wetted
area and all hydrostatic data is calculated. Having a 3D scan without freeboard points marked will make
the scan useless since it would be almost impossible to connect the scan data with the afloat
measurements needed. Therefore, freeboard points shall be marked and confirmed by an ORC measurer.
Freeboard points are defined in the IMS Rule as follows:
B2.3 The top point at any measurement station shall normally be the lowest point on the topsides of
the hull where a tangent at 45 degrees can be rested on the hull. Where any bulwark is a fair
continuation of the line of the topsides of the yacht, the top point shall be taken on the top of the
bulwark. A bulwark shall be interpreted to mean any part of the topsides extending above the
lowest level of the deck at that station.
B2.4 The freeboard points shall be taken on the freeboard stations as either of:
a) The top point as defined in B2.3; or
b) Any other point that can be clearly identified on the hull and, if needed, described with a photo
or drawing
Various top points
4
Usually there should be four freeboard points with 2 forward and 2 aft at the same station (same x
coordinate) on the port and the starboard sides.
The forward freeboard station shall normally be placed approximately 0.5 m from the stem, but it may
also be placed in another easily recognized distance from the stem (eg, a bobstay fitting, chine, topsides
stripes).
The aft freeboard station shall normally be placed at the aftermost section at which the hull could be
girthed without crossing the transom, but it may also be placed in another easily recognized distance
from the stem (eg, the transom end).
Alternatively two forward or two aft freeboard points may be replaced by one set on the boat’s centerline
when this is possible to clearly identify, such as the bottom of the cockpit at 90 degrees to the transom.
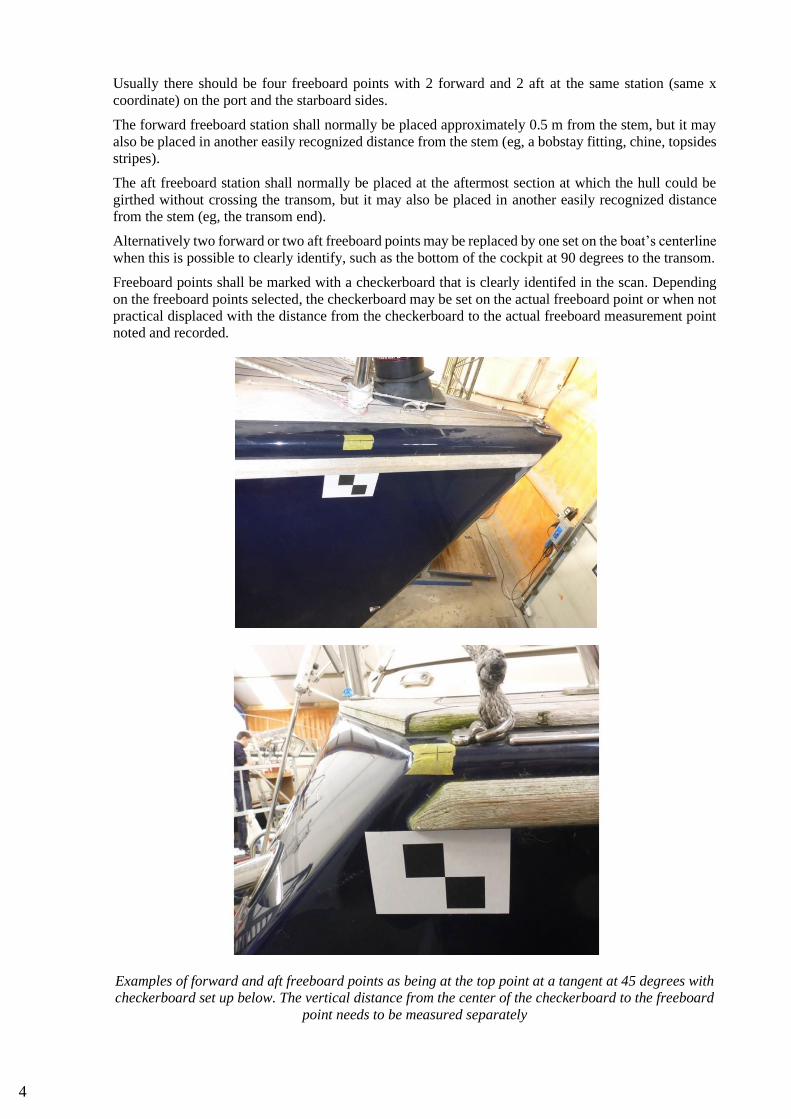
Freeboard points shall be marked with a checkerboard that is clearly identifed in the scan. Depending
on the freeboard points selected, the checkerboard may be set on the actual freeboard point or when not
practical displaced with the distance from the checkerboard to the actual freeboard measurement point
noted and recorded.
Examples of forward and aft freeboard points as being at the top point at a tangent at 45 degrees with
checkerboard set up below. The vertical distance from the center of the checkerboard to the freeboard
point needs to be measured separately
5
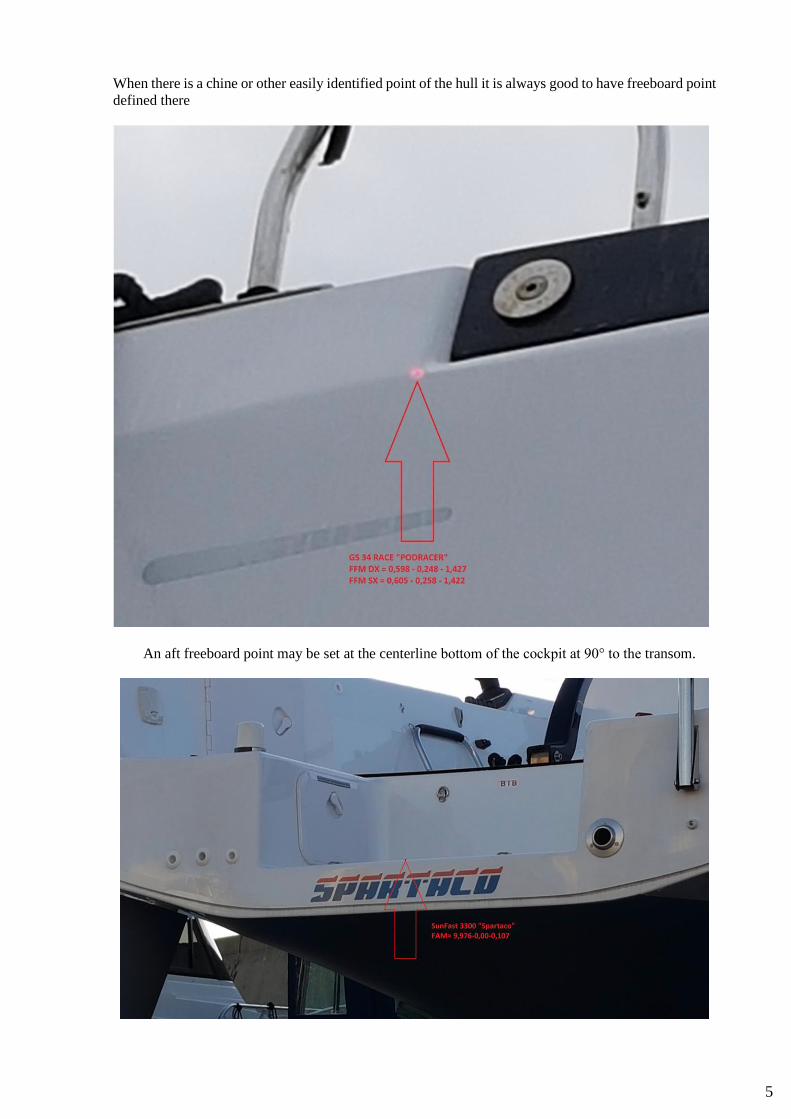
When there is a chine or other easily identified point of the hull it is always good to have freeboard point
defined there
An aft freeboard point may be set at the centerline bottom of the cockpit at 90° to the transom.

6
On larger boats like superyachts freeboard points may also be selected at the hull details that may easily
be identified or at the flotation marks set on the hull.
7
2.3 Scanning
Once the freeboard points are marked the hull may now be scanned. The number of scans around the
boat depends on the instrument used, and the obstructions found, but it is important to take enough scans
to get the complete hull covered, usually 4-5 from each side of the boat and 1–2 in front of the bow and
transom. A few more below the hull are recommended to capture the bottom of the hull and the keel.
The error of registration of different scans shall be kept as small as practicable to achieve continuous
hull and appendage shapes.”
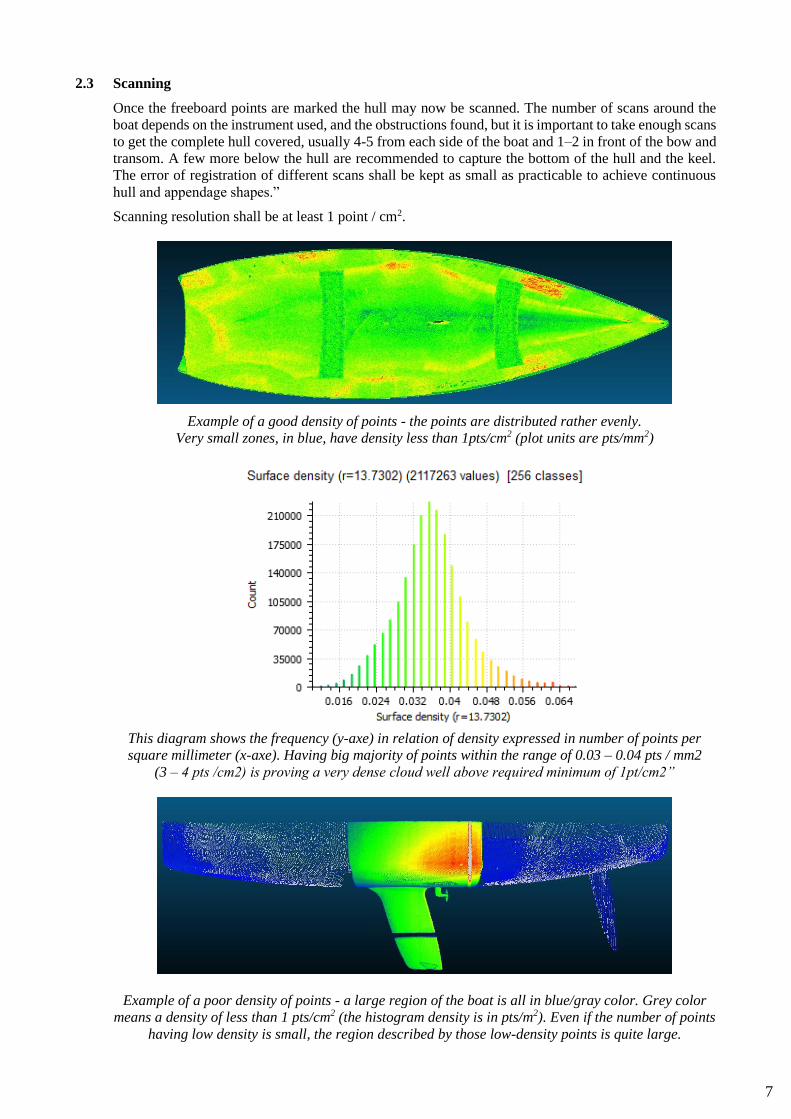
Scanning resolution shall be at least 1 point / cm2.
Example of a good density of points - the points are distributed rather evenly.
Very small zones, in blue, have density less than 1pts/cm2 (plot units are pts/mm2)
This diagram shows the frequency (y-axe) in relation of density expressed in number of points per
square millimeter (x-axe). Having big majority of points within the range of 0.03 – 0.04 pts / mm2
(3 – 4 pts /cm2) is proving a very dense cloud well above required minimum of 1pt/cm2”
Example of a poor density of points - a large region of the boat is all in blue/gray color. Grey color
means a density of less than 1 pts/cm2 (the histogram density is in pts/m2). Even if the number of points
having low density is small, the region described by those low-density points is quite large.

8
Roughness of 90% of the points, defined as the standard deviation of the points lying inside a ball of
assigned radius from the best fit plane, should be in the range of 0.5-1.5 millimeters.
Example of good roughness - The roughness of 95% of points is
less than 0.5 mm (plot roughness is in meters).
Example of poor rougnhess - About 33% of points have a roughness
greater than 2.5 mm, therefore an uncertainty of more than 5 mm.
Note: Examples of point density and roughness are made by freely available Cloud Compare software

9
2.4 Cleanup and data post-processing
The cloud of points has to be cleaned up from all points not belonging to the external surfaces of the
hull and appendages like scaffolding hanging cables and fenders, thru-hull fittings and any obstructions.
The hull should be taken up to the sheerline. Holes in the hull sufraces for the cradle or any part that
could not be scanned should be left as they are without reconstructing with postprocessing software. No
filtering and noise reduction have to be applied. Raw data after registration and simple cleaning has to
be left “As Is”.
Once the cloud is cleaned up, it needs to be centered as close as possible to the coordinating system
a) X axis – longitudinal with 0 at stem and positive towards the stern
b) Y axis – transverse with 0 at the centerline and positive outwards
c) Z axis – vertical with 0 at the waterline and positive upwards
With points of X = 0, Y = 0, Z = 0 as shown
When the cloud is centered the following data should be prepared and send to ORC:
a) text file (in csv, pts, txt, asc or e57 format) containing x, y, z coordinates of all points
b) x, y, z coordinates of freeboard points (checkerboards) and possible offset measurement from the
checkerboard to the actual freeboard points if checkerboards are needed
c) photos of the freeboard points
d) photos of the boat from different views
Copyright © 2020 Offshore Racing Congress.
Version 2020 – 1.00 - 27.04.2020.
Cover picture: Hull scanning measurement
Courtesy: Pablo Ferrer
X = 0, Y = 0, Z = 0