hugo rls final - turquoisehill.com · 2004/05/06 · north and hugo south) now stands at...
TRANSCRIPT
1
May 6, 2004
GOLD AT IVANHOE’S HUGO NORTH DEPOSIT IN MONGOLIA INCREASES BY 84% — TO 7.3 MILLION OUNCES
COPPER AT HUGO NORTH INCREASES BY 37% — TO 21.4 BILLION POUNDS
DISCOVERY OF HUGO WESTERN GOLD ZONE ANNOUNCED
NEW INDEPENDENT GLOBAL RESOURCE ESTIMATE DUE SHORTLY, FOLLOWED BY INTERIM ENGINEERING REPORT
ULAANBAATAR, MONGOLIA — Ivanhoe Mines’ Chairman Robert Friedland and President John Macken announced today that a new, independent estimate prepared by AMEC E&C Services (AMEC) of Canada, indicates that the Hugo North deposit, one of five copper and gold deposits discovered to date at the company’s Oyu Tolgoi (Turquoise Hill) Project in southern Mongolia, now contains:
• inferred resources of 666 million tonnes, grading 1.46% copper and 0.34 grams of gold (g/t) per tonne (a copper equivalent grade of 1.68%), at a 0.60% copper equivalent cut off;
• approximately 21.4 billion pounds (9.7 million tonnes) of copper, an increase of 37% since the previous estimate in November, 2003; and
• 7.3 million ounces of gold, an increase of 84% since last November. The significant increase in the size of the Hugo North Deposit demonstrates the dynamic growth of the Oyu Tolgoi project and its response, in terms of size and grade, to ongoing exploration drilling. Combined Hugo North and Hugo South deposits puts “world-class” scale in perspective
• The total inferred resource at the entire, 2.6-kilometre-long Hugo Dummett Deposit (Hugo North and Hugo South) now stands at 1,159,800,000 (1.16 billion) tonnes grading 1.29% copper and 0.23 grams of gold (g/t) per tonne (a copper equivalent grade of 1.44%) at a 0.60% copper equivalent cut off. The combined resource at Hugo now contains approximately 33 billion pounds of copper and 8.58 million ounces of gold. (See Table 3 and Figure 1 below).
The combined resource delineated to date is comparable in many respects to resources at Chile’s El Teniente and El Salvador mines, the largest block-caving operations in the world, which supply a significant percentage of Chile’s copper production. These large-scale underground mines, producing from deposits with copper grades of just over 1% at cut-off grades below 0.60% copper, operate at up to 125,000 tonnes per day and have direct underground mining costs of approximately US$1 per tonne. Cost and throughput comparison data from the Chilean mines will be incorporated into ongoing studies that will determine the ultimate size and configuration of the future development of the Hugo Deposit. Limited drilling has been conducted in Hugo South since the November, 2003, resource update report. Most of the new holes have been drilled to quantify the block-cave characteristics of the deposit.
2
Hugo North high-grade core also expanded Drilling at the Hugo North Deposit also has significantly expanded the high-grade core of inferred resources greater than 2% copper equivalent, within this larger mineralized envelope, that now contains 178 million tonnes grading 2.89% copper and 0.59 g/t gold (a copper equivalent grade of 3.26%). The tonnage in the high-grade zone is 56% higher than the amount of AMEC’s previous estimate issued last November, and now contains approximately 11.3 billion pounds (5.14 million tonnes) of copper and 3.38 million ounces of gold. This represents an increase of 54% in the amount of copper and a 44% increase in the amount of gold in the high-grade core since the previous estimate in November, 2003. Hole 456D, a near-vertical daughter hole collared 150 metres south of Hole 514 at the northern end of the Hugo Deposit, intersected greater than 3% copper at a depth of 1550 metres and is currently drilling at a depth of 1700 metres in greater than 1% copper. This is approximately 300 metres down-dip from OTD 465B, with 196 metres grading 3.38% copper and 0.42g/t gold. It is approximately 200 metres down-dip of the >2% copper grade shells utilized in the calculation of the new resource estimates and confirms the open-ended nature to depth of the high-grade core of the Hugo North deposit. The intersection extends the high-grade mineralization encountered at the same depth in OTD514C, approximately 200 metres north, which will enhance block-cave development by putting the development level at the same elevation. This mineralization will further add to the deposit’s expanding base of copper and gold. A cross-section indicating the location of this intercept is included below. Drilling upgrading other deposits Elsewhere on the project, resource delineation drilling to the measured and indicated classifications has been completed at Southwest Oyu, Central Oyu and the recently discovered Bridge Zone (between the Southwest and Central zones). Classification upgrading also is well advanced at South Oyu and the adjoining sub-zones, named the Wedge and Gap zones. This infill-drilling program will form the basis for a revised, interim resource estimate for the entire Oyu Tolgoi Project that will include the Hugo North estimates described above. The new estimate will be prepared by AMEC and is scheduled for release within a month. A total of 20 drills now are working 24 hours a day on the Oyu Tolgoi project. Interim Engineering Report underway The new resource estimate will be incorporated into an Interim Engineering Report that is expected to be issued in the second quarter. Work also has begun on a feasibility study of the open-pittable resources at the Southwest and Central zones, and associated satellite deposits, that is scheduled to be completed by year-end. The project engineering team is evaluating milling capacity in the range of 37 to 43 million tonnes of ore throughput per year (90,000-110,000 tonnes per day), given recent technological advances in the throughput capacity of large SAG and ball mills now in use at the Escondida and Collahuasi copper mines in Chile. In light of the increased underground resource and the potential for further increases, the engineering team also is studying the potential of concurrently developing two large block-cave mines, each in the range of 40,000 to 50,000 tonnes per day (14.6 to 18.25 million tonnes each per year), to augment open-pit production. A
3
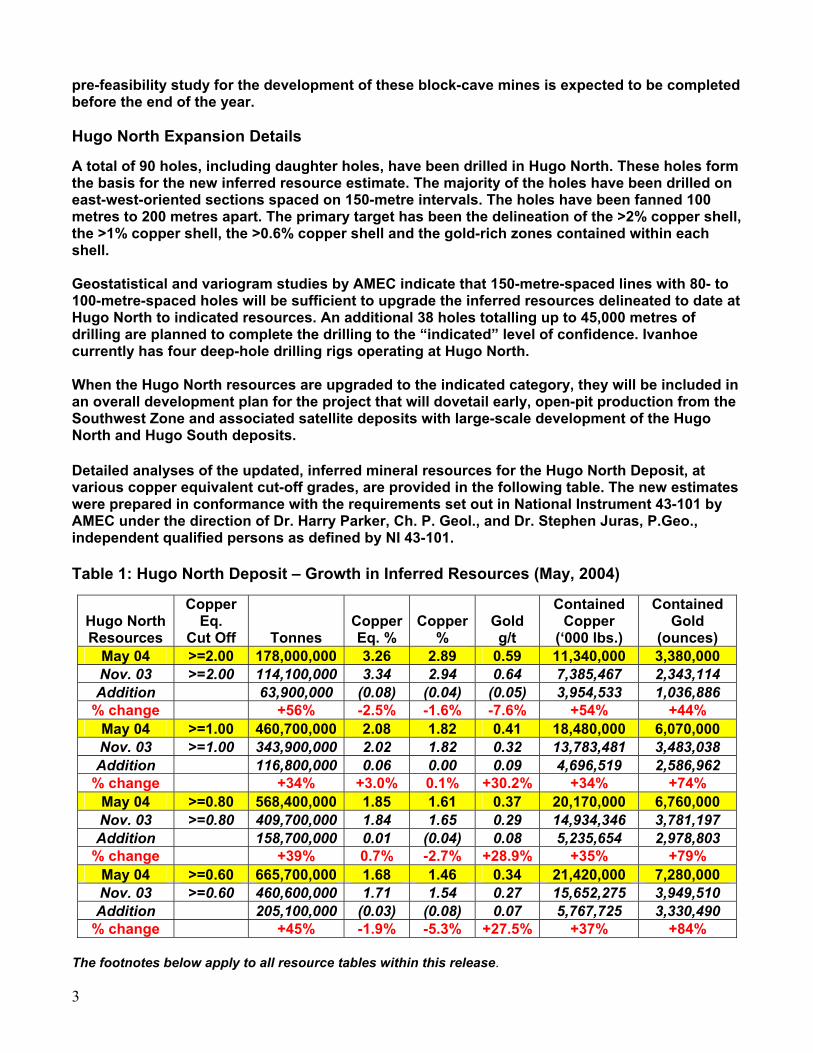
pre-feasibility study for the development of these block-cave mines is expected to be completed before the end of the year. Hugo North Expansion Details A total of 90 holes, including daughter holes, have been drilled in Hugo North. These holes form the basis for the new inferred resource estimate. The majority of the holes have been drilled on east-west-oriented sections spaced on 150-metre intervals. The holes have been fanned 100 metres to 200 metres apart. The primary target has been the delineation of the >2% copper shell, the >1% copper shell, the >0.6% copper shell and the gold-rich zones contained within each shell. Geostatistical and variogram studies by AMEC indicate that 150-metre-spaced lines with 80- to 100-metre-spaced holes will be sufficient to upgrade the inferred resources delineated to date at Hugo North to indicated resources. An additional 38 holes totalling up to 45,000 metres of drilling are planned to complete the drilling to the “indicated” level of confidence. Ivanhoe currently has four deep-hole drilling rigs operating at Hugo North. When the Hugo North resources are upgraded to the indicated category, they will be included in an overall development plan for the project that will dovetail early, open-pit production from the Southwest Zone and associated satellite deposits with large-scale development of the Hugo North and Hugo South deposits. Detailed analyses of the updated, inferred mineral resources for the Hugo North Deposit, at various copper equivalent cut-off grades, are provided in the following table. The new estimates were prepared in conformance with the requirements set out in National Instrument 43-101 by AMEC under the direction of Dr. Harry Parker, Ch. P. Geol., and Dr. Stephen Juras, P.Geo., independent qualified persons as defined by NI 43-101. Table 1: Hugo North Deposit – Growth in Inferred Resources (May, 2004)
Hugo North Resources
Copper Eq.
Cut Off Tonnes Copper Eq. %
Copper%
Gold g/t
Contained Copper
(‘000 lbs.)
Contained Gold
(ounces) May 04 >=2.00 178,000,000 3.26 2.89 0.59 11,340,000 3,380,000 Nov. 03 >=2.00 114,100,000 3.34 2.94 0.64 7,385,467 2,343,114 Addition 63,900,000 (0.08) (0.04) (0.05) 3,954,533 1,036,886
% change +56% -2.5% -1.6% -7.6% +54% +44% May 04 >=1.00 460,700,000 2.08 1.82 0.41 18,480,000 6,070,000 Nov. 03 >=1.00 343,900,000 2.02 1.82 0.32 13,783,481 3,483,038 Addition 116,800,000 0.06 0.00 0.09 4,696,519 2,586,962
% change +34% +3.0% 0.1% +30.2% +34% +74% May 04 >=0.80 568,400,000 1.85 1.61 0.37 20,170,000 6,760,000 Nov. 03 >=0.80 409,700,000 1.84 1.65 0.29 14,934,346 3,781,197 Addition 158,700,000 0.01 (0.04) 0.08 5,235,654 2,978,803
% change +39% 0.7% -2.7% +28.9% +35% +79% May 04 >=0.60 665,700,000 1.68 1.46 0.34 21,420,000 7,280,000 Nov. 03 >=0.60 460,600,000 1.71 1.54 0.27 15,652,275 3,949,510 Addition 205,100,000 (0.03) (0.08) 0.07 5,767,725 3,330,490
% change +45% -1.9% -5.3% +27.5% +37% +84% The footnotes below apply to all resource tables within this release.
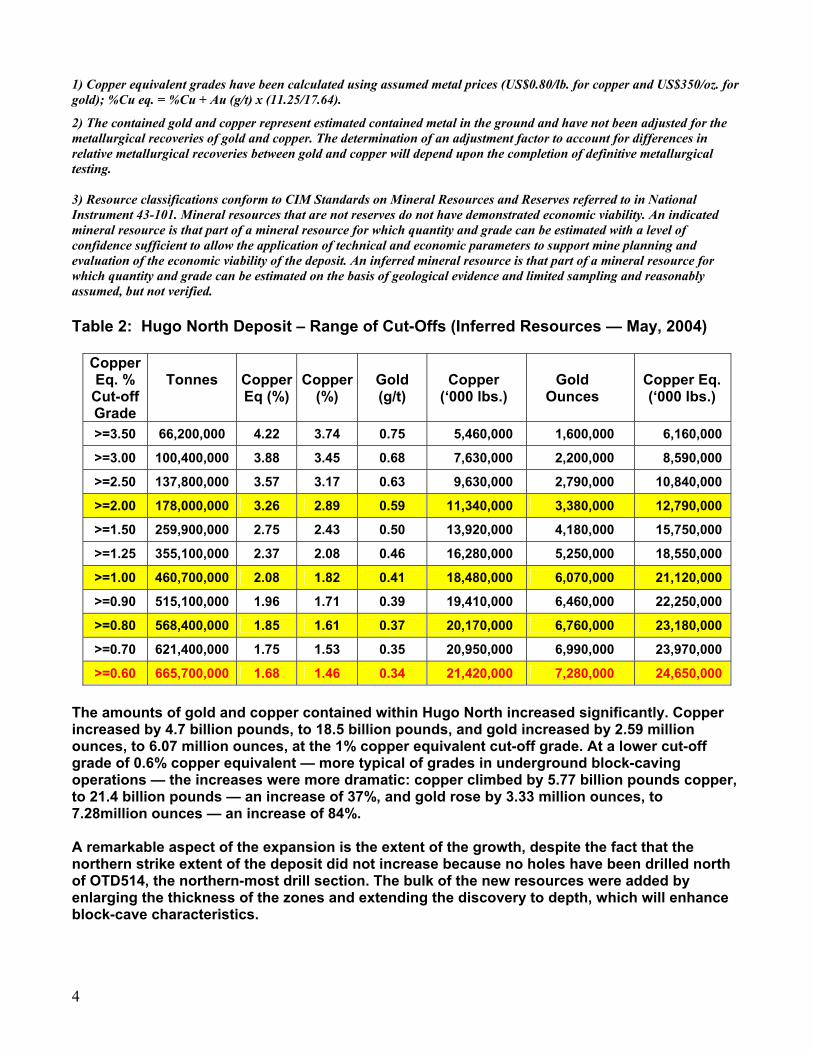
4
1) Copper equivalent grades have been calculated using assumed metal prices (US$0.80/lb. for copper and US$350/oz. for gold); %Cu eq. = %Cu + Au (g/t) x (11.25/17.64). 2) The contained gold and copper represent estimated contained metal in the ground and have not been adjusted for the metallurgical recoveries of gold and copper. The determination of an adjustment factor to account for differences in relative metallurgical recoveries between gold and copper will depend upon the completion of definitive metallurgical testing. 3) Resource classifications conform to CIM Standards on Mineral Resources and Reserves referred to in National Instrument 43-101. Mineral resources that are not reserves do not have demonstrated economic viability. An indicated mineral resource is that part of a mineral resource for which quantity and grade can be estimated with a level of confidence sufficient to allow the application of technical and economic parameters to support mine planning and evaluation of the economic viability of the deposit. An inferred mineral resource is that part of a mineral resource for which quantity and grade can be estimated on the basis of geological evidence and limited sampling and reasonably assumed, but not verified. Table 2: Hugo North Deposit – Range of Cut-Offs (Inferred Resources — May, 2004)
Copper Eq. %
Cut-off Grade
Tonnes
Copper Eq (%)
Copper(%)
Gold (g/t)
Copper (‘000 lbs.)
Gold Ounces
Copper Eq. (‘000 lbs.)
>=3.50 66,200,000 4.22 3.74 0.75 5,460,000 1,600,000 6,160,000 >=3.00 100,400,000 3.88 3.45 0.68 7,630,000 2,200,000 8,590,000 >=2.50 137,800,000 3.57 3.17 0.63 9,630,000 2,790,000 10,840,000 >=2.00 178,000,000 3.26 2.89 0.59 11,340,000 3,380,000 12,790,000 >=1.50 259,900,000 2.75 2.43 0.50 13,920,000 4,180,000 15,750,000 >=1.25 355,100,000 2.37 2.08 0.46 16,280,000 5,250,000 18,550,000 >=1.00 460,700,000 2.08 1.82 0.41 18,480,000 6,070,000 21,120,000 >=0.90 515,100,000 1.96 1.71 0.39 19,410,000 6,460,000 22,250,000 >=0.80 568,400,000 1.85 1.61 0.37 20,170,000 6,760,000 23,180,000 >=0.70 621,400,000 1.75 1.53 0.35 20,950,000 6,990,000 23,970,000 >=0.60 665,700,000 1.68 1.46 0.34 21,420,000 7,280,000 24,650,000
The amounts of gold and copper contained within Hugo North increased significantly. Copper increased by 4.7 billion pounds, to 18.5 billion pounds, and gold increased by 2.59 million ounces, to 6.07 million ounces, at the 1% copper equivalent cut-off grade. At a lower cut-off grade of 0.6% copper equivalent — more typical of grades in underground block-caving operations — the increases were more dramatic: copper climbed by 5.77 billion pounds copper, to 21.4 billion pounds — an increase of 37%, and gold rose by 3.33 million ounces, to 7.28million ounces — an increase of 84%. A remarkable aspect of the expansion is the extent of the growth, despite the fact that the northern strike extent of the deposit did not increase because no holes have been drilled north of OTD514, the northern-most drill section. The bulk of the new resources were added by enlarging the thickness of the zones and extending the discovery to depth, which will enhance block-cave characteristics.
5
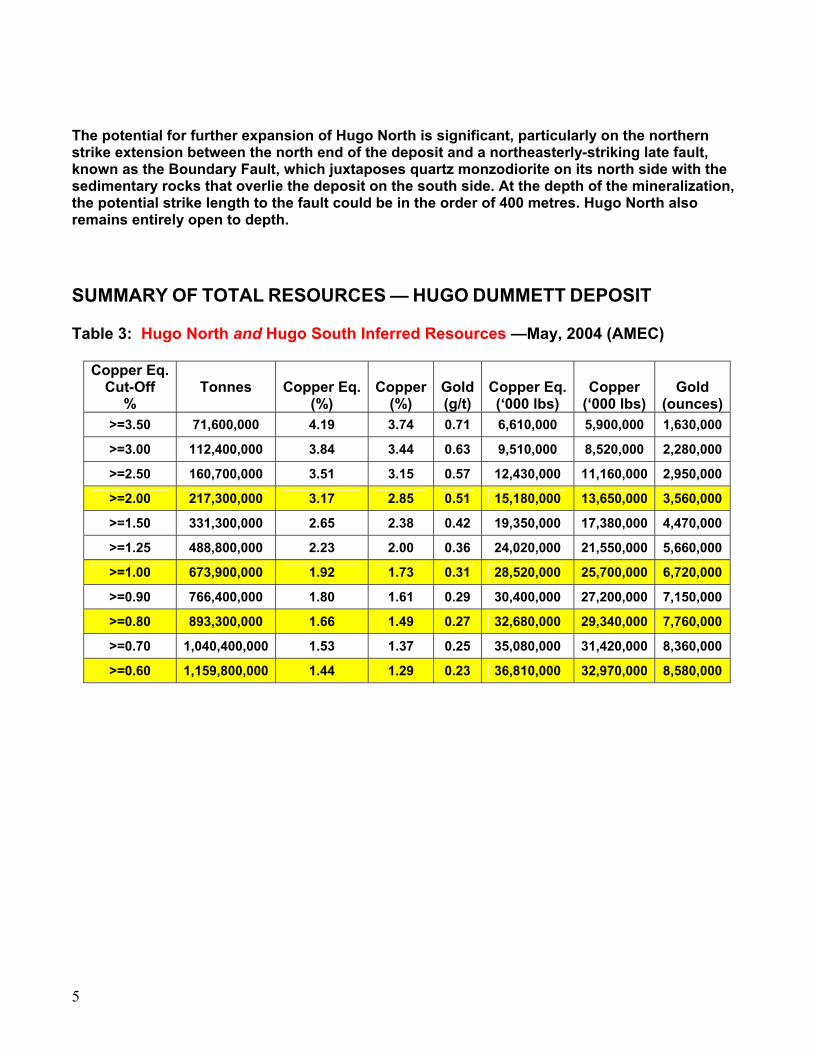
The potential for further expansion of Hugo North is significant, particularly on the northern strike extension between the north end of the deposit and a northeasterly-striking late fault, known as the Boundary Fault, which juxtaposes quartz monzodiorite on its north side with the sedimentary rocks that overlie the deposit on the south side. At the depth of the mineralization, the potential strike length to the fault could be in the order of 400 metres. Hugo North also remains entirely open to depth. SUMMARY OF TOTAL RESOURCES — HUGO DUMMETT DEPOSIT Table 3: Hugo North and Hugo South Inferred Resources —May, 2004 (AMEC)
Copper Eq. Cut-Off
% Tonnes
Copper Eq.
(%) Copper
(%) Gold(g/t)
Copper Eq.(‘000 lbs)
Copper (‘000 lbs)
Gold (ounces)
>=3.50 71,600,000 4.19 3.74 0.71 6,610,000 5,900,000 1,630,000
>=3.00 112,400,000 3.84 3.44 0.63 9,510,000 8,520,000 2,280,000
>=2.50 160,700,000 3.51 3.15 0.57 12,430,000 11,160,000 2,950,000
>=2.00 217,300,000 3.17 2.85 0.51 15,180,000 13,650,000 3,560,000
>=1.50 331,300,000 2.65 2.38 0.42 19,350,000 17,380,000 4,470,000
>=1.25 488,800,000 2.23 2.00 0.36 24,020,000 21,550,000 5,660,000
>=1.00 673,900,000 1.92 1.73 0.31 28,520,000 25,700,000 6,720,000
>=0.90 766,400,000 1.80 1.61 0.29 30,400,000 27,200,000 7,150,000
>=0.80 893,300,000 1.66 1.49 0.27 32,680,000 29,340,000 7,760,000
>=0.70 1,040,400,000 1.53 1.37 0.25 35,080,000 31,420,000 8,360,000
>=0.60 1,159,800,000 1.44 1.29 0.23 36,810,000 32,970,000 8,580,000

6
Figure 1: The Hugo Dummett Deposit. Combined Hugo North and Hugo South Inferred Resources: 1,159,800,000 tonnes @ 1.29% copper & 0.23 g/t gold; 1.44% Cu Eq., containing 33.0 billion pounds of copper and 8.58 million ounces of gold. Strike length of the deposit is 2.6 kilometres. Longitudinal section, looking west, shows the >0.60% copper grade shell.
HUGO NORTH (approx. 1400m) 665.7 million tonnes @ 1.46% copper, 0.34
g/t gold; 1.68% Cu Eq. containing 21.42 billion lbs. copper, 7.28 million ounces gold.
HUGO SOUTH (approx. 1200m) 494.1 million tonnes @ 1.06% copper, 0.08 g/t gold; 1.11% Cu Eq. containing 11.54 billion lbs. copper, 1.27 million ounces gold.
7
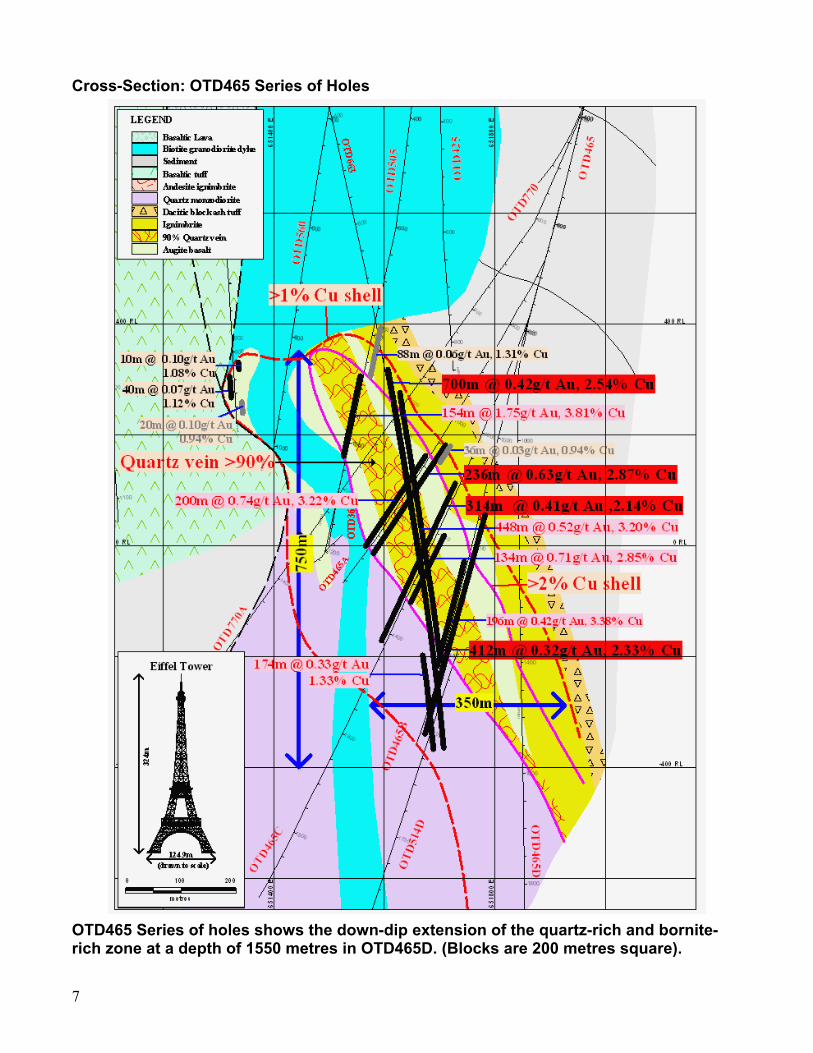
Cross-Section: OTD465 Series of Holes
OTD465 Series of holes shows the down-dip extension of the quartz-rich and bornite-rich zone at a depth of 1550 metres in OTD465D. (Blocks are 200 metres square).
8
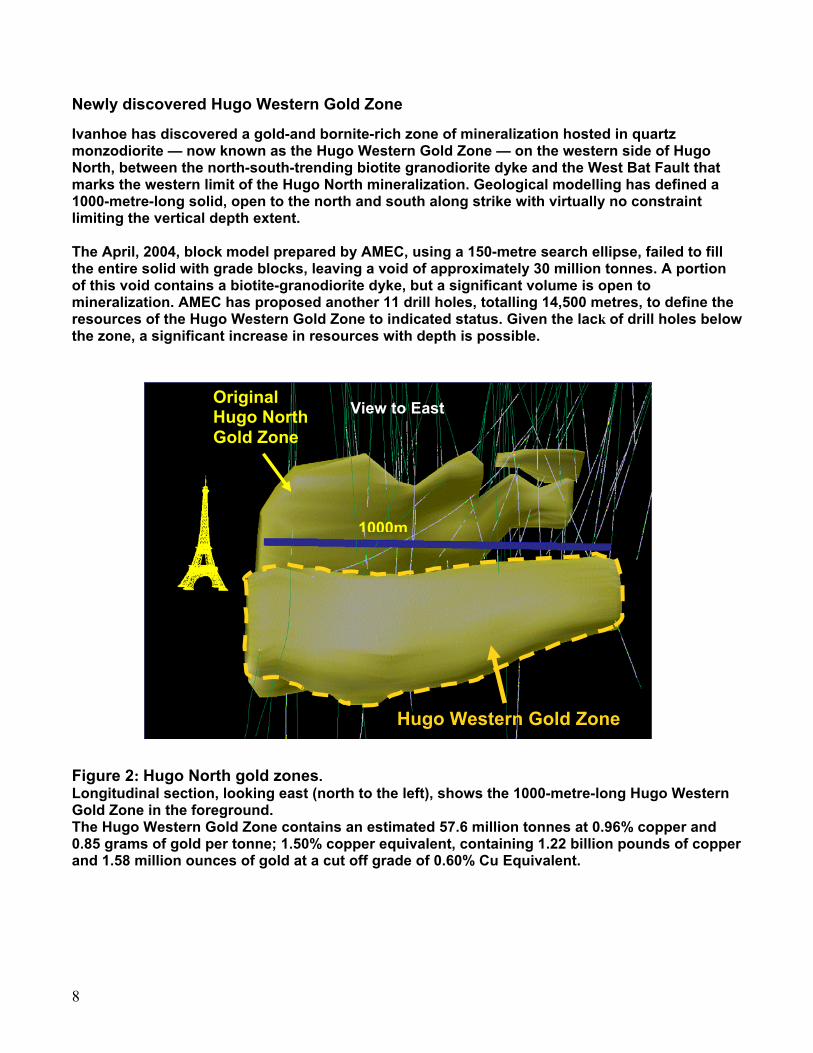
Newly discovered Hugo Western Gold Zone Ivanhoe has discovered a gold-and bornite-rich zone of mineralization hosted in quartz monzodiorite — now known as the Hugo Western Gold Zone — on the western side of Hugo North, between the north-south-trending biotite granodiorite dyke and the West Bat Fault that marks the western limit of the Hugo North mineralization. Geological modelling has defined a 1000-metre-long solid, open to the north and south along strike with virtually no constraint limiting the vertical depth extent. The April, 2004, block model prepared by AMEC, using a 150-metre search ellipse, failed to fill the entire solid with grade blocks, leaving a void of approximately 30 million tonnes. A portion of this void contains a biotite-granodiorite dyke, but a significant volume is open to mineralization. AMEC has proposed another 11 drill holes, totalling 14,500 metres, to define the resources of the Hugo Western Gold Zone to indicated status. Given the lack of drill holes below the zone, a significant increase in resources with depth is possible.
Figure 2: Hugo North gold zones. Longitudinal section, looking east (north to the left), shows the 1000-metre-long Hugo Western Gold Zone in the foreground. The Hugo Western Gold Zone contains an estimated 57.6 million tonnes at 0.96% copper and 0.85 grams of gold per tonne; 1.50% copper equivalent, containing 1.22 billion pounds of copper and 1.58 million ounces of gold at a cut off grade of 0.60% Cu Equivalent.
Hugo Western Gold Zone
1000m
View to EastOriginal Hugo North Gold Zone
9
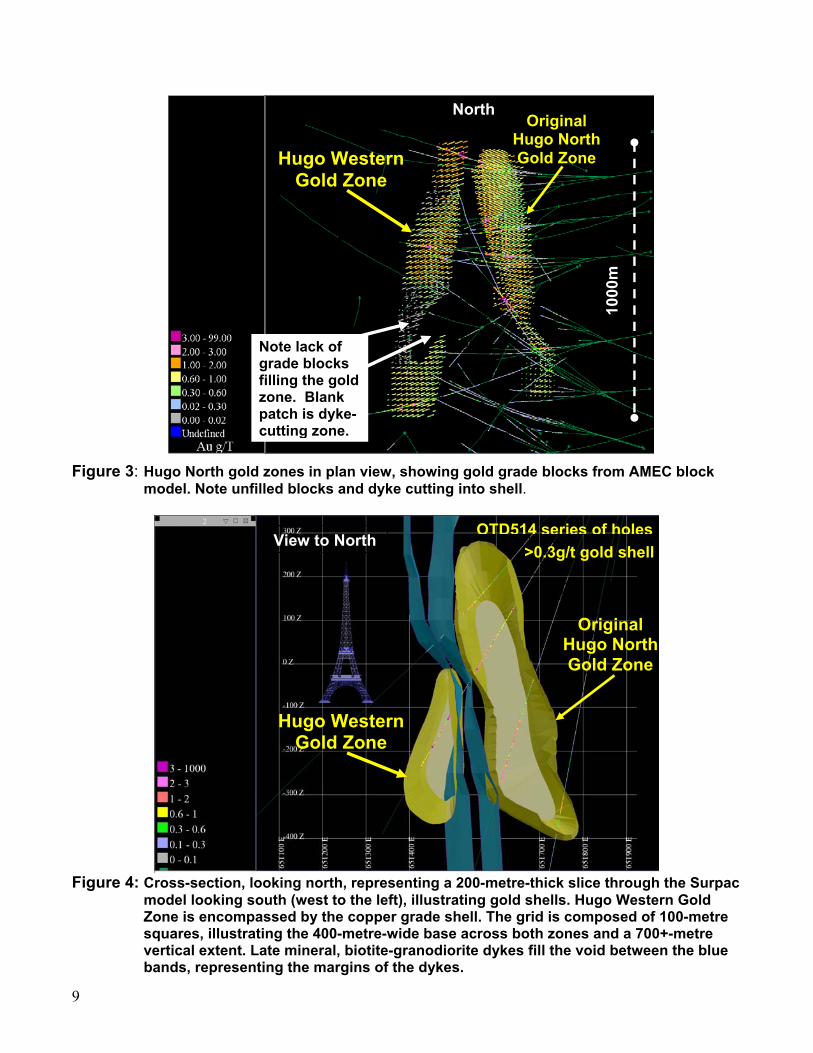
Note lack of grade blocks filling the gold zone. Blank patch is dyke-cutting zone.
1000
m
Figure 3: Hugo North gold zones in plan view, showing gold grade blocks from AMEC block
model. Note unfilled blocks and dyke cutting into shell.
Figure 4: Cross-section, looking north, representing a 200-metre-thick slice through the Surpac
model looking south (west to the left), illustrating gold shells. Hugo Western Gold Zone is encompassed by the copper grade shell. The grid is composed of 100-metre squares, illustrating the 400-metre-wide base across both zones and a 700+-metre vertical extent. Late mineral, biotite-granodiorite dykes fill the void between the blue bands, representing the margins of the dykes.
Hugo Western Gold Zone
OTD514 series of holesView to North>0.3g/t gold shell
Hugo Western Gold Zone
North
Original Hugo North Gold Zone
Original Hugo North Gold Zone
10
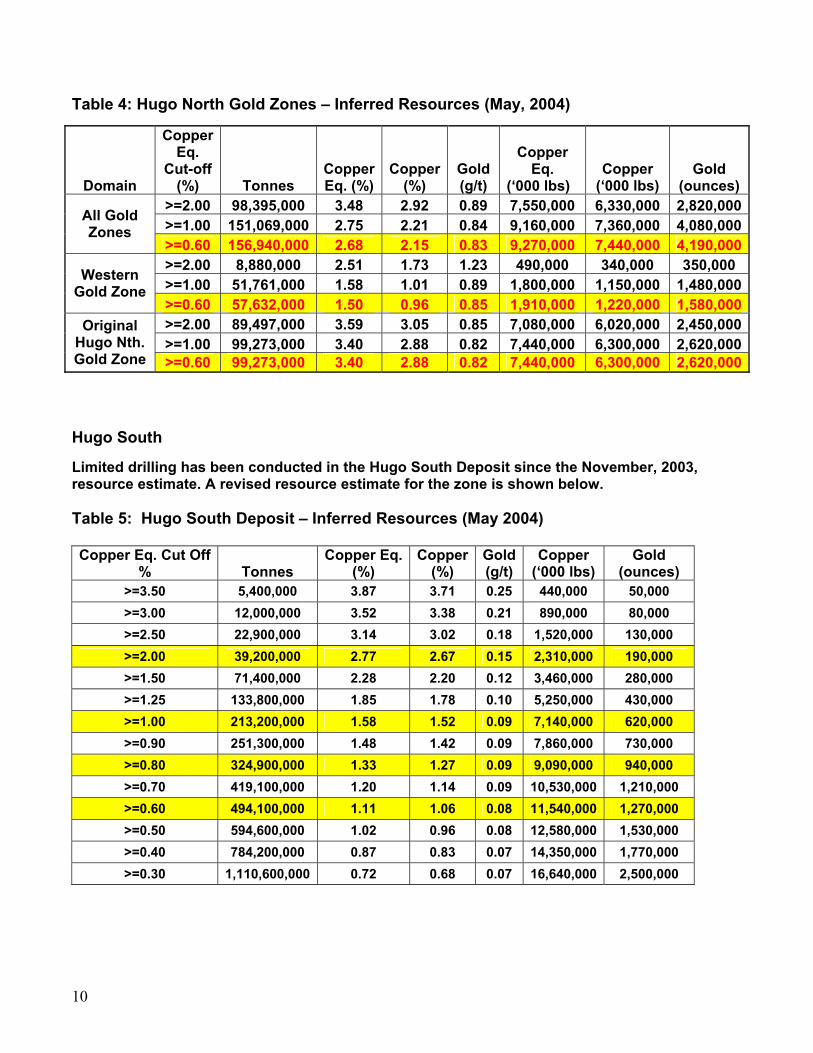
Table 4: Hugo North Gold Zones – Inferred Resources (May, 2004)
Domain
Copper Eq.
Cut-off (%) Tonnes
CopperEq. (%)
Copper (%)
Gold (g/t)
Copper
Eq. (‘000 lbs)
Copper
(‘000 lbs)
Gold (ounces)
>=2.00 98,395,000 3.48 2.92 0.89 7,550,000 6,330,000 2,820,000>=1.00 151,069,000 2.75 2.21 0.84 9,160,000 7,360,000 4,080,000All Gold
Zones >=0.60 156,940,000 2.68 2.15 0.83 9,270,000 7,440,000 4,190,000>=2.00 8,880,000 2.51 1.73 1.23 490,000 340,000 350,000 >=1.00 51,761,000 1.58 1.01 0.89 1,800,000 1,150,000 1,480,000Western
Gold Zone >=0.60 57,632,000 1.50 0.96 0.85 1,910,000 1,220,000 1,580,000>=2.00 89,497,000 3.59 3.05 0.85 7,080,000 6,020,000 2,450,000>=1.00 99,273,000 3.40 2.88 0.82 7,440,000 6,300,000 2,620,000
Original Hugo Nth. Gold Zone >=0.60 99,273,000 3.40 2.88 0.82 7,440,000 6,300,000 2,620,000
Hugo South Limited drilling has been conducted in the Hugo South Deposit since the November, 2003, resource estimate. A revised resource estimate for the zone is shown below. Table 5: Hugo South Deposit – Inferred Resources (May 2004) Copper Eq. Cut Off
% Tonnes Copper Eq.
(%) Copper
(%) Gold (g/t)
Copper (‘000 lbs)
Gold (ounces)
>=3.50 5,400,000 3.87 3.71 0.25 440,000 50,000 >=3.00 12,000,000 3.52 3.38 0.21 890,000 80,000 >=2.50 22,900,000 3.14 3.02 0.18 1,520,000 130,000 >=2.00 39,200,000 2.77 2.67 0.15 2,310,000 190,000 >=1.50 71,400,000 2.28 2.20 0.12 3,460,000 280,000 >=1.25 133,800,000 1.85 1.78 0.10 5,250,000 430,000 >=1.00 213,200,000 1.58 1.52 0.09 7,140,000 620,000 >=0.90 251,300,000 1.48 1.42 0.09 7,860,000 730,000 >=0.80 324,900,000 1.33 1.27 0.09 9,090,000 940,000 >=0.70 419,100,000 1.20 1.14 0.09 10,530,000 1,210,000 >=0.60 494,100,000 1.11 1.06 0.08 11,540,000 1,270,000 >=0.50 594,600,000 1.02 0.96 0.08 12,580,000 1,530,000 >=0.40 784,200,000 0.87 0.83 0.07 14,350,000 1,770,000 >=0.30 1,110,600,000 0.72 0.68 0.07 16,640,000 2,500,000

11
Southern Oyu Tolgoi deposits Extensive drilling has taken place during the past five months to bring all resources in the southern part of the Oyu Tolgoi project to an indicated-resource classification for use in pre-feasibility and feasibility studies. Drilling also was extended into sparsely-drilled areas adjoining the main deposits to determine if additional resources could be delineated that would enhance open-pit strip ratios. This work delineated additional resources between Southwest Oyu and Central Oyu, in a zone referred to as the Bridge Zone, and between Southwest Oyu, Far Southwest Oyu and South Oyu in two new zones referred to as the Wedge and the Gap. AMEC is in the process of finalizing its resource estimates for the Southwest Oyu, Far Southwest Oyu, Central Oyu and the Bridge zones. It is expected that most of the resources within these zones will be upgraded to the indicated category, with the exception of areas around the fringes of the deposits that likely will fall outside the open-pit models. Charles Forster, P.Geo., Ivanhoe Mines’ Turquoise Hill Manager, a qualified person as defined by National Instrument 43-101, supervised the preparation of the information in this release. SGS Analabs Pty. Ltd. prepares the split core at the project site and assays all samples at its facility in Ulaanbaatar, Mongolia. Ivanhoe’s QA/QC program is monitored by independent consultant Dr Barry Smee, P.Geo., and managed on site by Dale Sketchley, M.Sc., P.Geo. Prepared standards and blanks are inserted at the sample preparation lab on the project site to monitor the quality control of the assay data. Ivanhoe has a 100% interest in the Oyu Tolgoi gold and copper project in Mongolia and owns or controls exploration rights covering approximately 111,000 square kilometres in central and southern Mongolia, where additional copper and gold discoveries have been made. Ivanhoe produces LME grade A copper from its Monywa joint venture in Myanmar and iron ore products from ABM Mining’s Savage River mine in Australia. Ivanhoe shares are listed on the Toronto and Australian stock exchanges under the symbol IVN and on the NASDAQ National Market under the symbol HUGO. Information contacts in North America Investors: Bill Trenaman: +1.604.688.5755 Media: Bob Williamson: +1.604.688.5755 Forward-Looking Statements: Statements in this release that are forward-looking statements are subject to various risks and uncertainties concerning the specific factors disclosed under the heading “Risk Factors” and elsewhere in the corporation’s periodic filings with Canadian and Australian securities regulators. When used in this document, the words such as "could,” “plan,” "estimate," "expect," "intend," "may," "potential," "should," and similar expressions are forward-looking statements. The risk factors that could cause actual results to differ from these forward-looking statements include, but are not restricted to, and the planned updated resource estimate and revised scoping study at the Oyu Tolgoi project, operational risk, environmental risk, financial risk, geo-political risk, commodity risk, currency risk and other statements that are not historical facts as disclosed under the heading “Risk Factors” and elsewhere in the corporation’s periodic filings with securities regulators in Canada, Australia and the United States.