hudson river salt-front project - ny water ... river salt-front report april 1 through september 30,...
TRANSCRIPT

HUDSON RIVER SALT-FRONT REPORT
April 1 through September 30, 2007 By Timothy F. Hoffman
Data were collected for water-surface elevation, water temperature, and specific
conductance1 from April 1 through September 30, 2007, at three United States Geological Survey (USGS) monitoring stations on the Hudson River: Hudson River below Poughkeepsie (01372058); Hudson River at South Dock at West Point (01374019); and Hudson River south of Hastings-on-Hudson (01376304) (fig. 1). Specific-conductance data were used to estimate the upstream location of the salt front in the lower Hudson River estuary during this period. These data are provisional and subject to revision pending final publication in the USGS New York Water Science Center annual data report for Water Year 2007. The data report is no longer published in paper form but will be available on-line in 2008. Near real-time provisional data from these sites are available on the worldwide web at: http://ny.water.usgs.gov/htmls/pub/projects.html. Discharge Conditions in the Hudson River basin
Daily discharges of three streams in the Hudson River basin—Hudson River above Lock 1 near Waterford (01335754, representing the Upper Hudson River basin), Mohawk River at Cohoes (01357500, representing the Mohawk River basin), and Wappinger Creek near Wappingers Falls (01372500, representing the Lower Hudson River basin)—are presented to summarize discharge conditions across the entire basin from April 1 through September 30, 2007 (figs. 2-4)2. Daily discharges across the entire Hudson River basin were above average 12 percent of the time, average 57 percent of the time, and below average 31 percent of the time during this period (table 1). Most of the above-average discharges occurred during April across all three basins, whereas most of the below-average discharges occurred in August and September in the Upper Hudson River basin, June and September in the Mohawk River basin and in May and June in the Lower Hudson River basin (table 2). Daily discharges during this 183-day monitoring period were mostly average in all three basins. Maximum daily discharges, in cubic feet per second (ft3/s), occurred on April 24 at Waterford (about 33,800 ft3/s), April 17 at Cohoes (75,300 ft3/s), and April 16 at Wappingers Falls (7,640 ft3/s). Minimum daily discharges occurred on August 22 at Waterford (2,080 ft3/s), September 8 at Cohoes (304 ft3/s), and on September 30 at Wappingers Falls (13 ft3/s). Minimum discharges at Waterford and Cohoes were affected by regulation.
1 Boldface terms are explained in Glossary. 2 The 25th, 50th, and 75th percentiles as shown in figures 2 – 4 indicate periods when discharges were below average, average, and above average, respectively. Percentiles are based on 25 years of data at Hudson River above Lock 1 near Waterford, and 49 years of data at both Mohawk River at Cohoes and Wappinger Creek near Wappingers Falls.
Page 1

Data Summaries Water-Surface Elevation
Daily mean, daily high, and daily low water-surface elevations at Poughkeepsie, West Point, and Hastings-on-Hudson are shown for April 1 through September 30, 2007, in figures 5 - 6.3 Maximum and minimum water-surface elevations for this period are listed in table 3. Data for June 12 through 14 are partially unavailable at Poughkeepsie as a result of an instrument malfunction.
Maximum water-surface elevations, in feet (ft), were recorded on April 16 at Poughkeepsie (6.08 ft), West Point (5.80 ft), and Hastings-on-Hudson (5.91 ft). Minimum water-surface elevations were recorded on April 9 at Poughkeepsie (-1.60 ft), West Point (-1.60 ft), and Hastings-on-Hudson (-1.77 ft). It is unlikely that the maximum or minimum water-surface elevations during April 1 through September 30 at Poughkeepsie occurred during periods of unavailable data. Water Temperature
Daily mean, daily maximum, and daily minimum water temperatures at Poughkeepsie, West Point, and Hastings-on-Hudson are shown for April 1 through September 30, 2007, in figures 7 - 8. Maximum and minimum water temperatures for this period are listed in table 3. Data for June 12 through 14 are partially unavailable at Poughkeepsie as a result of an instrument malfunction.
Maximum water temperatures, in degrees Celsius (ºC), were recorded on August 8, 9, and 13 at Poughkeepsie (27.5ºC); on August 8 at West Point (28.0ºC); and on August 7, 8, and 9 at Hastings-on-Hudson (28.0ºC). Minimum water temperatures were recorded on April 17 and 18 at Poughkeepsie (4.0 ºC); April 1, 2, 3, 17, 18, 19, and 20 at West Point (4.5 ºC); and April 1, 2, 8, and 9 at Hastings-on-Hudson (4.5 ºC). It is unlikely that the maximum or minimum water temperatures during April 1 through September 30 at Poughkeepsie occurred during periods of unavailable data.
Specific Conductance
Daily mean, daily maximum, and daily minimum specific conductance at Poughkeepsie, West Point, and Hastings-on-Hudson are shown from April 1 through September 30, 2007, in figures 9 - 10. Maximum and minimum specific conductances for this period are listed in table 3. Data for June 12 through 14 are partially unavailable at Poughkeepsie as a result of an instrument malfunction.
Maximum specific conductance, in microsiemens per centimeter at 25°C (µS/cm at 25ºC), was recorded on September 30 at Poughkeepsie (1,770 µS/cm at 25°C); on September 24 and 25 at West Point (12,400 µS/cm at 25°C); and on June 4 at Hastings-on-Hudson (27,200 µS/cm at 25°C). Minimum specific conductance was recorded on May 2, 3, and 4 at Poughkeepsie (145 µS/cm at 25°C ); on May 9, 25, and 26 at West Point (160 µS/cm at 25°C ); and April 24 at Hastings-on-Hudson (219 µS/cm at 25°C). It is unlikely that the maximum or minimum specific conductance during April 1 through September 30 at Poughkeepsie occurred during periods of unavailable data. 3 Water-surface elevations are relative to mean sea level (National Geodetic Vertical Datum of 1929).
Page 2

Salt-Front Delineations The salt front is the saltwater/freshwater interface, defined in this report as the location
where specific conductance equals 500 μS/cm at 25°C (or 100 milligrams per liter chloride concentration). Three high-slack-tide delineations were made during the summer of 2007 to verify the location of the salt front estimated by regression. The regression estimates the upstream location of the salt front based on daily mean specific conductance at each salt monitoring station. Low-slack-tide delineations were made immediately before or after the high-slack-tide delineations to determine the distance the salt front moved during the tidal cycle. Salt-front delineations are shown in figure 11; the locations of the salt front found during these delineations and the corresponding regression-estimated locations are listed in table 4. Water depth and specific conductance, measured at 58 cross-sections during these delineations, are listed in table 5. The location of the salt front is measured in river miles (RM) above the Battery, NY.
On July 17, a high-slack-tide delineation located the salt front at RM 67.2, 0.6 river miles upstream of the regression-estimated river mile of 66.6. A corresponding low-slack-tide delineation located the salt front at RM 63.4. The longitudinal movement of the salt front during this tidal cycle was 3.8 river miles. A second high-slack-tide delineation made on August 1 located the salt front at RM 72.2, 1.2 river miles downstream of the regression-estimated river mile of 73.4. A corresponding low-slack-tide delineation located the salt front at RM 67.5. The longitudinal movement of the salt front during this tidal cycle was 4.7 river miles. A third high-slack-tide delineation made on September 6 located the salt front at RM 75.9, 1.2 river miles downstream of the regression-estimated river mile of 77.1. A corresponding low-slack-tide delineation located the salt front at RM 72.4. The longitudinal movement of the salt front during this tidal cycle was 3.5 river miles. Regression Analysis
The location of the salt front is estimated using multiple linear regressions developed for each station. These regressions may be updated once a year based on the results of at least three high-slack-tide salt-front delineations and the corresponding daily mean specific conductance at each monitoring station (table 6). The delineations on August 1 and September 6 were not included in the Hastings regression as the model appears to lose sensitivity at the extreme upper end of the regression. Revised regression curves and statistics for the 2007 water year at Hastings-on-Hudson, West Point, and Poughkeepsie are presented in figs. 12-14. Daily salt-front locations at high-slack-tide, computed from the 2007 water-year salt-front delineations and revised regression equations, are presented in figure 15 and table 7. The estimated salt-front location ranged from below RM 16.0 to RM 77.7 (September 28) from October 1, 2006, through September 30, 2007. Estimated locations below RM 16.0 are not published because they are below the calibration limits of the Hastings-on-Hudson regression equation.
Page 3

Glossary Above-average discharge is the range of discharges that are greater than the 75th percentile of all discharge values. (See also "Percentile.") Average discharge is the range of discharge between the 25th and 75th percentiles of all discharge values. (See also "Percentile.") Below-average discharge is the range of discharges that are less than the 25th percentile of all discharge values. (See also "Percentile.") Daily discharge is the arithmetic mean of discharge passing a stream cross section during a 24-hour day. (See also "Discharge.") Delineation, in this report, refers to collection of specific-conductance data in river cross sections during specific parts of tide cycles, beginning downstream and moving upstream. Discharge is the rate at which matter passes through a cross section of a stream channel or other water body per unit of time. The term commonly refers to the volume of water (including, unless otherwise stated, any sediment or other constituents suspended or dissolved in the water) that passes a cross section in a stream channel, canal, etc., within a given period of time and is generally expressed in cubic feet per second. Elevation is the height or vertical distance above or below the National Geodetic Vertical Datum of 1929. (See also "National Geodetic Vertical Datum of 1929".) High-slack-tide is the point in the tide cycle that follows high tide, when the water is moving neither upstream nor downstream. Low-slack-tide is the point in the tide cycle that follows low tide, when the water is moving neither upstream nor downstream. Lower Hudson River basin is that part of the Hudson River basin downstream from the Federal Dam in Troy, NY (RM 153.7). (See fig. 1) Microsiemens per centimeter (μS/cm) is a unit expressing electrical conductivity of a solution, as measured between opposite faces of a 1-centimeter cube of solution at a specified temperature. Siemens is the International System of Units nomenclature. It is synonymous with mhos and is the reciprocal of resistance, in ohms. (See also "Specific-conductance.") Mohawk River basin is that part of the Hudson River basin that drains into the Mohawk River. (See fig. 1) National Geodetic Vertical Datum of 1929 (NGVD of 1929) is a fixed reference adopted as a standard geodetic datum for elevations determined by leveling. It was formerly called "Sea Level Datum of 1929" or "mean sea level." Although the datum was derived from the mean sea level at 26 tide stations, it does not necessarily represent local mean sea level at any particular place.
Page 4

Percentile is a value on a scale of 100 that indicates the percentage of a distribution that is equal to or below it. On a graph of daily discharge, for example, a river's daily discharge at the 75th percentile is equal to or greater than 75 percent of the daily discharge values recorded on this day of the year during the years indicated. River mile (RM) is the curvilinear distance, in miles, measured upstream from the Battery in New York City along the meandering path of the river channel and is used to denote location along the river. Salt front is the saltwater/freshwater interface, defined in this report as the furthest daily upstream location where specific-conductance exceeds 500 microsiemens per centimeter (μS/cm) at 25°C (or 100 milligrams per liter chloride concentration) at some point in the cross-section (See also Specific conductance.) Specific conductance is a measure of the ability of a solution to conduct an electrical current over a 1-centimeter distance and adjusted to 25 degrees Celsius. Specific conductance is equivalent to the reciprocal of the resistance of the solution and is expressed in microsiemens per centimeter. Specific conductance is directly proportional to the chloride concentration and thus the salinity of the Hudson River. Upper Hudson River basin is that part of the Hudson River basin upstream from the Federal Dam in Troy, NY (RM 153.7). (See fig. 1) Water year is the 12-month period from October 1 through September 30 of the following year. The water year is designated by the calendar year in which it ends and includes the first 9 of the 12 months of the year in which it ends and the last three months of the previous year. Thus, the year ending September 30, 2006, is called the "2006 water year."
Page 5

Illustrations and Tables Fig.1. Locations of Hudson River salt-front monitoring sites, Hudson River below Poughkeepsie (USGS station 01372058), Hudson River at South Dock at West Point (01374019), and Hudson River south of Hastings-on-Hudson (01376304), and three stream gaging stations in the Hudson River basin, Hudson River above Lock 1 at Waterford (01335754), Mohawk River at Cohoes (01357500), and Wappinger Creek at Wappingers Falls (01372500). 2-15. Graphs showing:
2. Daily discharge data for Hudson River above Lock 1 near Waterford (01335754), April 1 through September 30, 2007, and daily discharges for 25th, 50th, and 75th percentiles, April 1 through September 30, 1976-2000.
3. Daily discharge data for Mohawk River at Cohoes (01357500), April 1 through September 30, 2007, and daily discharges for 25th, 50th, and 75th percentiles, April 1 through September 30,1952-2000.
4. Daily discharge data for Wappinger Creek near Wappingers Falls
(01372500) April 1 through September 30, 2007, and daily discharges for 25th, 50th, and 75th percentiles, April 1 through September 30, 1952-2000.
5. Daily mean water-surface elevations in the Hudson River at Poughkeepsie, West Point, and Hastings-on-Hudson salt-front monitoring stations, April 1 through September 30, 2007.
6. Daily high, mean, and low water-surface elevations in the Hudson River at
Poughkeepsie, West Point, and Hastings-on-Hudson salt-front monitoring stations, April 1 through September 30, 2007.
7. Daily mean water temperatures in the Hudson River at Poughkeepsie,
West Point, and Hastings-on-Hudson salt-front monitoring stations, April 1 through September 30, 2007.
8. Daily maximum, mean, and minimum water temperatures in the Hudson River at Poughkeepsie, West Point, and Hastings-on-Hudson salt-front monitoring stations, April 1 through September 30, 2007. 9. Daily mean specific conductance in the Hudson River at Poughkeepsie,
West Point, and Hastings-on- Hudson salt-front monitoring stations, April 1 through September 30, 2007.
10. Daily maximum, mean, and minimum specific conductance in the Hudson River at Poughkeepsie, West Point, and Hastings-on-Hudson salt-front monitoring stations, April 1 through September 30, 2007.
Page 6
7
11. High-slack-tide and low-slack-tide delineations and selected delineation locations made on July 17, August 1, and September 6, 2007. 12. Distance of the salt front upstream from the Battery in relation to daily
mean specific conductance at Hastings-on-Hudson, N.Y. 13. Distance of the salt front upstream from the Battery in relation to daily mean specific conductance at West Point, N.Y. 14. Distance of the salt front upstream from the Battery in relation to daily mean specific conductance at Poughkeepsie, N.Y.
15. Location of salt front (500 microsiemens per centimeter at 25 degrees
Celsius), in the Hudson River at high-slack-tide, based on delineations and regressions of daily specific-conductance data from Hastings-on-Hudson, West Point, and Poughkeepsie, April 1 through September 30, 2007.
Table 1. Total number and percentage of days of above-average, average, and below-average discharges across the entire Hudson River basin from April 1, through September 30, 2007.
2. Number and percentage of days of above-average, average, and below-average discharges at Hudson River above Lock 1 near Waterford (USGS station 01335754), Mohawk River at Cohoes (01357500), and Wappinger Creek at Wappingers Falls (01372500), April 1 through September 30, 2007.
3. Maximum and minimum water-surface elevation, water temperature,
and specific conductance at Hudson River below Poughkeepsie (01372058), Hudson River at South Dock at West Point (01374019), and Hudson River south of Hastings-on-Hudson (01376304), April 1 through September 30, 2007.
4. Salt-front locations found during high-slack-tide and low-slack-tide delineations
on July 17, August 1 and September 6, 2007, and the corresponding location of the salt front estimated by regression for the given day.
5. Depth and specific-conductance data measured at selected cross-sections during
delineations on July 17, August 1, and September 6, 2007.
6. Location of the salt front found by delineation and the corresponding daily mean specific conductance at each monitoring station.
7. Daily salt-front locations at slack-high tide from October 1, 2006, through
September 30, 2007, estimated from the 2007 water year salt-front delineations and revised regression equations.
Page 7

Page 8

Discharge in cubic feet per second
2007
April May June July August September1,000
2,000
3,000
4,000
5,000
6,000
8,000
10,000
20,000
30,000
40,000
50,000
60,000
Daily discharge from April 1 through September 30, 2007, and deviation from the 50th percentile.
Daily discharge representing the indicated percentiles during 1976-2000.
Daily discharge representing the 50th percentile during 1976-2000.
HUDSON RIVER ABOVE LOCK 1 NEAR WATERFORD (01335754)
Drainage area 4,605 square miles
75th percentile
25th percentile
Figure 2.--Daily discharge data for Hudson River above Lock 1 near Waterford, N.Y., October 1, 2006, through March 31, 2007, and daily discharges for selected percentiles, October 1 through March 31, 1976-2000. Location shown in fig. 1.
Page 9

Discharge in cubic feet per second
2007
April May June July August September100
200
500
1,000
2,000
5,000
10,000
20,000
50,000
80,000
Daily discharge from April 1 through September 30, 2007, and deviation from the 50th percentile.
Daily discharge representing the indicated percentiles during 1952-2000.
Daily discharge representing the 50th percentile during 1952-2000.
MOHAWK RIVER AT COHOES (01357500)
Drainage area 3,450 square miles
75th percentile
25th percentile
Figure 3.--Daily discharge data for Mohawk River at Cohoes (01357500), April 1 through September 30, 2007, and daily discharges for selected percentiles, April 1 through September 30, 1952-2000. Location shown in fig. 1.
Page 10

Discharge in cubic feet per second
2007
April May June July August September10
20
50
100
200
500
1,000
2,000
5,000
10,000
Daily discharge from April 1 through September 30, 2007, and deviation from the 50th percentile.
Daily discharge representing the indicated percentiles during 1952-2000.
Daily discharge representing the 50th percentile during 1952-2000.
WAPPINGER CREEK NEAR WAPPINGERS FALLS (01372500)
Drainage area 181 square miles
75th percentile
25th percentile
Figure 4.--Daily discharge data for Wappinger Creek near Wappingers Falls, April 1 through September 30, 2007, and dailydischarges for selected percentiles, April 1 through September 30, 1952-2000. Location shown in fig. 1.
Page 11

Mean elevation in ft relative to MSL
2007
April May June July August September-1
00
1
2
3
4
5
Hudson River below Poughkeepsie
Hudson River at West Point
Hudson River south of Hastings-on-Hudson
Figure 5.-- Daily mean water-surface elevations relative to mean sea level (MSL) for the Hudson River below Poughkeepsie, at West Point, and south of Hastings-on-Hudson salt-front monitoring stations, April 1 through September 30, 2007. Zero ft elevation is mean sea level(from National Geodetic Vertical Datum of 1929). Locations shown in fig. 1.
Page 12

-4
-2
00
2
4
6
8
Elevation in ft relative to MSL
-4
-2
00
2
4
6
8
2007
April May June July August September-4
-2
00
2
4
6
8
Daily high water-surface elevation
Daily mean water-surface elevation
Daily low water-surface elevation
Figure 6.-- Daily high, mean, and low water-surface elevations relative to mean sea level (MSL) for the Hudson River below Poughkeepsie, at West Point, and south of Hastings-on-Hudson salt-front monitoring stations, April 1 through September 30, 2007. Zero ft elevation is mean sea level (from National Geodetic Vertical Datum of 1929). Locations shown in fig. 1.
Hudson River below Poughkeepsie
Hudson River at West Point
Hudson River south of Hastings-on-Hudson
Page 13

Mean water temperature, oC
2007
April May June July August September0.0
2.5
5.0
7.5
10.0
12.5
15.0
17.5
20.0
22.5
25.0
27.5
30.0
Hudson River below Poughkeepsie
Hudson River at West Point
Hudson River south of Hastings-on-Hudson
Figure 7.--Daily mean water temperatures in degrees Celsius for the Hudson River below Poughkeepsie, at West Point, and south of Hastings-on-Hudson salt-front monitoring stations, April 1 through September 30, 2007. Locations shown in fig. 1.
Page 14

02.5
57.510
12.515
17.520
22.525
27.530
Water temperature, oC
02.5
57.510
12.515
17.520
22.525
27.530
2007
April May June July August September0
2.55
7.510
12.515
17.520
22.525
27.530
Daily maximum water temperature
Daily mean water temperature
Daily minimum water temperature
Figure 8.-- Daily maximum, mean, and minimum water temperatures in degrees Celsius for the Hudson River below Poughkeepsie, at West Point, and south of Hastings-on-Hudson salt-front monitoring stations, April 1 through September 30, 2007. Locations shown in fig. 1.
Hudson River below Poughkeepsie
Hudson River at West Point
Hudson River south of Hastings-on-Hudson
Page 15

Specific conductance, uS per cm at 25oC
2007
April May June July August September100
200
500
1,000
2,000
5,000
10,000
20,000
30,000
Hudson River below Poughkeepsie
Hudson River at West Point
Hudson River south of Hastings-on-Hudson
Figure 9.--Daily mean specific conductance in microsiemens per centimeter at 25 degrees Celsius for the Hudson River below Poughkeepsie, at West Point, and south of Hastings-on-Hudson salt-front monitoring stations, April 1 through September 30, 2007. The salt front is located at 500 microsiemens per centimeter. Locations shown in fig. 1.
Salt-front
500 microsiemens per centimeter
Page 16

100
200
300400500600800
1000
2000
3000Specific conductance, uS per cm at 25oC
100
200
500
1000
2000
5000
10000
20000
2007
April May June July August September100
200
500
1000
2000
5000
10000
20000
40000
Daily maximum specific conductance
Daily mean specific conductance
Daily minimum specific conductance
Figure 10.-- Daily maximum, mean, and minimum specific conductance for the Hudson River below Poughkeepsie, at West Point, and south of Hastings-on-Hudson salt-front monitoring stations, April 1 through September 30, 2007. The salt front is located at 500 microsiemens per centimeter. Locations shown in fig. 1.
Hudson River below Poughkeepsie
Hudson River at West Point
Hudson River south of Hastings-on-Hudson
Page 17

a
100
1000
10000
50 55 60 65 70 75 80Distance above the Battery, in miles
July 17 high slack tideJuly 17 low slack tideAugust 1 high slack tideAugust 1 low slack tideSeptember 6 high slack tideSeptember 6 low slack tide
Salt front
Specific
conductance,
uS/cm at
25oC
Chelsea Pump Station
RM 66.2West PointRM 51.6
Poughkeepsie Water Treatment Plant
RM 77.2
500 uS/cm
Page 18

Daily mean specific conductance at Hastings-on-Hudson, in uS/cm at 25 deg C
River miles above Battery
200 500 1,000 2,000 5,000 10,000 20,000 30,00015
20
50
80
Regression curve - 2007, R-sqaure = 0.9296, RMSE = 4.2
Regression curve prior to 2007, R-square = 0.9293, RMSE = 4.2
Salt front location measured by delineation prior to 2007
Salt front location measured by delineation in 2007
Residuals 200 500 1,000 2,000 5,000 10,000 20,000 30,000
-10
-5
00
5
10
Figure 12.-- Distance of the salt front upstream from the Battery in relation to daily mean specific conductance at Hastings-on-Hudson, N.Y. Location is shown in Fig. 1.
overestimated
underestimated
Page 19

Daily mean specific conductance at West Point, in uS/cm at 25 deg C
River miles above the Battery
100 200 500 1,000 2,000 5,000 10,000 15,00030
40
50
60
80
90
Regression curve - 2007, R-square = 0.9697, RMSE = 2.4
Regression curve prior to 2007, R-square = 0.9696, RMSE = 2.4
Salt front location measured by delineation prior to 2007
Salt front location measured by delineation in 2007
Residuals
100 200 500 1,000 2,000 5,000 10,000 15,000-10
-5
00
5
10
Figure 13.-- Distance of the salt front upstream from the Battery in relation to daily mean specific conductance at West Point, N.Y. Location is shown in Fig. 1.
overestimated
underestimated
Page 20

Daily mean specific conductance at Poughkeepsie, in uS/cm at 25 deg C
River miles above Battery
100 200 500 1,000 2,000 4,00060
70
80
90
Regression curve - 2007, R-square = 0.9459, RMSE = 1.3
Regression curve prior to 2007, R-square = 0.9520, RMSE = 1.2
Salt front measured by delineation prior to 2007
Salt front measured by delineation in 2007
Residuals 100 200 500 1,000 2,000 4,000
-3
-2
-1
00
1
2
3
Figure 14.-- Distance of the salt front upstream from the Battery in relation to daily mean specific conductance below Poughkeepsie, N.Y. Location is shown in Fig. 1.
overestimated
underestimated
Page 21

River mile above Battery
Oct Nov Dec2007
Jan Feb Mar Apr May Jun Jul Aug Sep10
20
30
40
50
60
70
80
90
100
Location of salt front during the 2007 water year, computed by regression.
Location of salt front measured by delineation during the 2007 water year.
Residuals
-2
-1
00
1
Poughkeepsie Water Treatment Plant
RM 77.2Poughkeepsie
RM 72.3
West Point
RM 51.6
Hastings-on-Hudson
RM 21.1
overestimated
underestimated
Figure 15.-- Location of salt front in Hudson River at high-slack-tide, based on delineations and regressions of daily specific conductance data from Hastings-on-Huson, West Point, and Poughkeepsie stations, October 1, 2006, through September 30, 2007. Locations are shown in fig. 1.
[Estimated salt-front locations downstream of river mile 16.0 from April 19 through 24 are not plotted because they are beyond the calibration limits of the Hastings-on-Hudson regression equation.]Page 22

Table 1. Total number and percentage of days of above average, average, and below average discharge across the entire Hudson River basin from April 1 through September 30, 2007.
[Days above average, days above the 75th percentile; days below average, days below the 25th percentile; days average, days between the 25th and 75th percentiles. Percentage of total days, percentage of days when discharge was above average, average, and below average during the 183-day monitoring period. Locations are shown in figure 1.]
Month
1Days above average 1Days average
1Days below average
April 44 39 7May 4 71 18June 2 49 39July 9 61 23August 3 54 36September 1 41 48
Total 1days 63 315 171
Percentage of total 1days 11 57 311Days are the combined sum of days for the Hudson River above Lock 1 near Waterford, Mohawk River at Cohoes, and Wappinger Creek nr Wappingers Falls corresponding to the indicated discharge condition during each month (table 2). The total number of days is equal to 3 times the 183-day monitoring period, or 549 days.
Page 23

Table 2. Number of days of above average, average, and below average discharge at Hudson River above Lock 1 near Waterford, Mohawk River at Cohoes, and Wappinger Creek at Wappingers Falls, April 1 through September 30, 2007.[Days above average, days above the 75th percentile; days below average, days below the 25th percentile; days average, days between the 25th and 75th percentiles. Percentage of total days, percentage of days when discharge was above average, average, and below average during the 183-day monitoring period. Locations are shown in figure 1.]
Station Month Days above
average Days averageDays below
average
A. Hudson River above Lock 1 near Waterford (01335754, Upper Hudson River basin)
April 14 9 7May 3 28 0June 0 25 5July 1 19 11August 0 6 25September 1 3 26
Total 19 90 74Percentage of total days 10 49 40
B. Mohawk River at Cohoes (01357500, Mohawk River basin)
April 15 15 0May 1 27 3June 2 15 13July 3 20 8August 0 20 11September 0 16 14
Total 21 113 49Percentage of total days 11 62 27
C. Wappinger Creek at Wappingers Falls (01372500, Lower Hudson River basin)
April 15 15 0May 0 16 15June 0 9 21July 5 22 4August 3 28 0September 0 22 8
Total 23 112 48Percentage of total days 13 61 26
Page 24

Table 3.-- Maximum and minimum water-surface elevations, water-temperature, and specific-conductance data for the Hudson River below Poughkeepsie, at South Dock at West Point, and South of Hastings-on-Hudson monitoring stations, April 1 through September 30, 2007.[uS/cm at 25°C, microsiemens per centimeter at 25 degrees Celsius; NGVD 29, National Geodetic Vertical Datum of 1929. Locations shown in fig. 1]
Water-surface elevation (feet above NGVD 29)
Maximum Minimum
Station Feet Date Feet Date
Poughkeepsie 6.08 Apr. 16 -1.60 Apr. 9
West Point 5.80 Apr. 16 -1.60 Apr. 9
Hastings-on-Hudson 5.91 Apr. 16 -1.77 Apr. 9
Water temperature (°C)
Maximum Minimum
Station °C Date °C Date
Poughkeepsie 27.5 Aug. 8, 9, 13 4.0 Apr. 17, 18
West Point 28.0 Aug. 8 4.5 Apr. 1, 2, 3, 17, 18, 19, 20
Hastings-on-Hudson 28.0 Aug. 7, 8, 9 4.5 Apr. 1, 2, 8, 9
Specific conductance (uS/cm at 25°C)
Maximum Minimum
Station °C Date °C Date
Poughkeepsie 1,770 Sept. 30 145 May 2, 3, 4
West Point 12,400 Sept. 24, 25 160 May 9, 25, 26
Hastings-on-Hudson 27,200 Jun. 4 219 Apr. 24
Page 25

Table 4.-- Salt-front locations found during high-slack-tide and low-slack-tide delineations and the corresponding location of the salt front estimated by regression for the given day. [RM, river miles, measured in curvilinear distance upstream from the Battery in New York City]
Found by delineation
(RM)
Estimated by regression
(RM)Date Tide
Jul. 17 High 67.2 66.6Low 63.4 *****
Aug. 1 High 72.2 73.4Low 67.5 *****
Sept. 6 High 75.9 77.1Low 72.4 *****
*****The regressions estimate the daily upstream location of the salt front and thus do not estimate the location of the salt front at low-slack-tide.
Page 26

Date and cross-section Depth Spec. cond. Depth Spec. cond. Depth Spec. cond.
West Point 70 2,425 60 2,988 60 2,705 River mile: 51.6 35 2,414 30 2,521 30 2,653 Mean time: 0932 5 2,408 5 2,483 5 2,565
Foundry -- -- 60 2,126 -- -- River mile: 53.9 -- -- 30 1,879 -- -- Mean time: 0946 -- -- 5 1,688 -- --
Breakneck Point -- -- 75 1,293 -- -- River mile: 56.2 -- -- 35 1,253 -- -- Mean time: 0954 -- -- 5 1,213 -- --
Pollepel Island -- -- 35 935 -- -- River mile: 57.4 -- -- 15 911 -- -- Mean time: 1000 -- -- 5 910 -- --
Newburg -- -- 30 614 -- -- River mile: 61.4 -- -- 15 593 -- -- Mean time: 1012 -- -- 5 579 -- --
Newburg-Beacon Bridge 20 647 40 433 30 438 River mile: 62.3 10 617 20 428 15 433 Mean time: 1024 5 568 5 425 5 418
Empire 10 475 25 380 40 297 River mile: 63.6 5 464 10 380 20 298 Mean time: 1041 -- -- 5 386 5 310
Castle Point -- -- 45 283 -- -- River mile: 64.7 -- -- 20 283 -- -- Mean time: 1054 -- -- 5 282 -- --
West Point 70 3,843 65 4,300 65 4,275 River mile: 51.6 35 3,567 30 3,654 30 4,050 Mean time: 1353 5 3,069 5 3,322 5 3,480
Foundry -- -- 70 3,143 -- -- River mile: 53.9 -- -- 35 2,958 -- -- Mean time: 1405 -- -- 5 2,827 -- --
Table 5. --Depth and specific conductance measured at selected cross-sections of the Hudson River on July 17, August 1, and September 6, 2007.[Depths are measured in feet below water surface. Spec. cond., specific conductance, in microsiemens per centimeter at 25°C. Deepest measurements are 5 feet above bottom. Mean time, in Eastern Standard Time (EST).]
July 17 Low slack
Left Center RightPosition in cross-section, facing downstream
July 17 High slack
Page 27

Date and cross-section Depth Spec. cond. Depth Spec. cond. Depth Spec. cond.
Breakneck Point -- -- 80 2,533 -- -- River mile: 56.2 -- -- 40 2,520 -- -- Mean time: 1419 -- -- 5 2,255 -- --
Pollepel Island -- -- 35 2,175 -- -- River mile: 57.4 -- -- 15 2,176 -- -- Mean time: 1427 -- -- 5 1,817 -- --
Newburg -- -- 40 1,359 -- -- River mile: 61.4 -- -- 20 1,342 -- -- Mean time: 1447 -- -- 5 819 -- --
Newburg-Beacon Bridge 30 1,040 40 1,150 30 1,224 River mile: 62.3 15 1,006 20 1,098 15 1,127 Mean time: 1501 5 1,290 5 768 5 800
Empire -- -- 40 922 -- -- River mile: 63.6 -- -- 20 851 -- -- Mean time: 1515 -- -- 5 646 -- --
Castle Point -- -- 45 834 -- -- River mile: 64.7 -- -- 20 660 -- -- Mean time: 1524 -- -- 5 511 -- --
Chelsea Pump Station 30 609 50 607 45 636 River mile: 66.2 15 600 25 457 20 403 Mean time: 1542 5 550 5 426 5 350
Danskammer Point 70 541 55 496 45 554 River mile: 66.7 35 505 25 395 20 450 Mean time: 1556 5 422 5 350 5 329
Wappinger Creek 70 450 60 460 40 483 River mile: 67.3 35 383 30 417 20 375 Mean time: 1610 5 480 5 328 5 297
New Hamburg -- -- 65 407 -- -- River mile: 67.7 -- -- 30 364 -- -- Mean time: 1618 -- -- 5 399 -- --
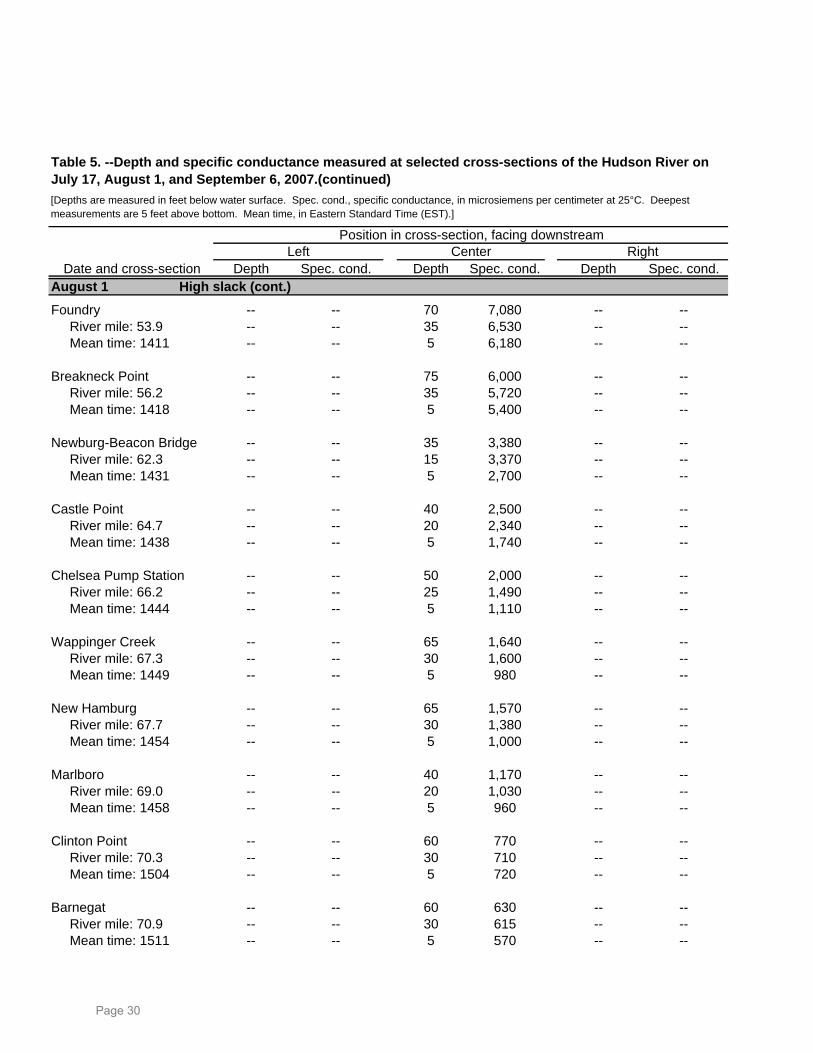
Table 5. --Depth and specific conductance measured at selected cross-sections of the Hudson River on July 17, August 1, and September 6, 2007.(continued)[Depths are measured in feet below water surface. Spec. cond., specific conductance, in microsiemens per centimeter at 25°C. Deepest measurements are 5 feet above bottom. Mean time, in Eastern Standard Time (EST).]
Position in cross-section, facing downstreamLeft Center Right
July 17 High slack (cont.)
Page 28

Date and cross-section Depth Spec. cond. Depth Spec. cond. Depth Spec. cond.
West Point 45 5,480 55 4,080 60 5,670 River mile: 51.6 20 5,300 25 4,950 30 5,600 Mean time: 0848 5 5,230 5 5,240 5 5,400
Foundry -- -- 60 5,190 -- -- River mile: 53.9 -- -- 30 4,770 -- -- Mean time: 0901 -- -- 5 3,900 -- --
Breakneck Point -- -- 60 4,200 -- -- River mile: 56.2 -- -- 30 3,440 -- -- Mean time: 0913 -- -- 5 3,100 -- --
Newburg-Beacon Bridge -- -- 30 1,460 -- -- River mile: 62.3 -- -- 15 1,460 -- -- Mean time: 0928 -- -- 5 1,420 -- --
Castle Point -- -- 35 880 -- -- River mile: 64.7 -- -- 15 800 -- -- Mean time: 0938 -- -- 5 740 -- --
Chelsea Pump Station -- -- 50 580 -- -- River mile: 66.2 -- -- 25 407 -- -- Mean time: 0945 -- -- 5 370 -- --
Wappinger Creek 60 546 45 310 35 330 River mile: 67.3 30 463 20 310 15 320 Mean time: 0955 5 400 5 320 5 320
New Hamburg 65 460 60 300 55 305 River mile: 67.7 30 390 30 330 25 310 Mean time: 1006 5 350 5 330 5 310
Marlboro -- -- 40 280 -- -- River mile: 69.0 -- -- 20 280 -- -- Mean time: 1017 -- -- 5 290 -- --
West Point 75 4,800 65 8,200 60 8,050 River mile: 51.6 35 4,850 30 7,750 30 8,010 Mean time: 1402 5 4,870 5 7,100 5 7,000
[Depths are measured in feet below water surface. Spec. cond., specific conductance, in microsiemens per centimeter at 25°C. Deepest measurements are 5 feet above bottom. Mean time, in Eastern Standard Time (EST).]
Position in cross-section, facing downstreamLeft Center
August 1 Low slack
August 1 High slack
Right
Table 5. --Depth and specific conductance measured at selected cross-sections of the Hudson River on July 17, August 1, and September 6, 2007.(continued)
Page 29
Date and cross-section Depth Spec. cond. Depth Spec. cond. Depth Spec. cond.
Foundry -- -- 70 7,080 -- -- River mile: 53.9 -- -- 35 6,530 -- -- Mean time: 1411 -- -- 5 6,180 -- --
Breakneck Point -- -- 75 6,000 -- -- River mile: 56.2 -- -- 35 5,720 -- -- Mean time: 1418 -- -- 5 5,400 -- --
Newburg-Beacon Bridge -- -- 35 3,380 -- -- River mile: 62.3 -- -- 15 3,370 -- -- Mean time: 1431 -- -- 5 2,700 -- --
Castle Point -- -- 40 2,500 -- -- River mile: 64.7 -- -- 20 2,340 -- -- Mean time: 1438 -- -- 5 1,740 -- --
Chelsea Pump Station -- -- 50 2,000 -- -- River mile: 66.2 -- -- 25 1,490 -- -- Mean time: 1444 -- -- 5 1,110 -- --
Wappinger Creek -- -- 65 1,640 -- -- River mile: 67.3 -- -- 30 1,600 -- -- Mean time: 1449 -- -- 5 980 -- --
New Hamburg -- -- 65 1,570 -- -- River mile: 67.7 -- -- 30 1,380 -- -- Mean time: 1454 -- -- 5 1,000 -- --
Marlboro -- -- 40 1,170 -- -- River mile: 69.0 -- -- 20 1,030 -- -- Mean time: 1458 -- -- 5 960 -- --
Clinton Point -- -- 60 770 -- -- River mile: 70.3 -- -- 30 710 -- -- Mean time: 1504 -- -- 5 720 -- --
Barnegat -- -- 60 630 -- -- River mile: 70.9 -- -- 30 615 -- -- Mean time: 1511 -- -- 5 570 -- --
Table 5. --Depth and specific conductance measured at selected cross-sections of the Hudson River on July 17, August 1, and September 6, 2007.(continued)[Depths are measured in feet below water surface. Spec. cond., specific conductance, in microsiemens per centimeter at 25°C. Deepest measurements are 5 feet above bottom. Mean time, in Eastern Standard Time (EST).]
Position in cross-section, facing downstreamLeft Center Right
August 1 High slack (cont.)
Page 30

Date and cross-section Depth Spec. cond. Depth Spec. cond. Depth Spec. cond.
Lions -- -- 50 560 -- -- River mile: 71.1 -- -- 25 610 -- -- Mean time: 1516 -- -- 5 570 -- --
Lagoon -- -- 45 530 -- -- River mile: 71.6 -- -- 20 530 -- -- Mean time: 1522 -- -- 5 570 -- --
Horn -- -- 45 550 -- -- River mile: 72.0 -- -- 20 500 -- -- Mean time: 1527 -- -- 5 510 -- --
IBM/Kedem 15 365 45 460 55 450 River mile: 72.3 10 350 20 440 25 380 Mean time: 1535 5 350 5 430 5 330
Newburg-Beacon Bridge 25 3,190 40 3,420 35 2,690 River mile: 62.3 10 3,120 20 2,950 15 2,510 Mean time: 1413 5 2,810 5 2,300 5 2,200
New Hamburg -- -- 65 1,411 -- -- River mile: 67.7 -- -- 30 1,278 -- -- Mean time: 1433 -- -- 5 1,000 -- --
Clinton Point -- -- 55 725 -- -- River mile: 70.3 -- -- 30 649 -- -- Mean time: 1519 -- -- 5 541 -- --
Barnegat 65 669 55 622 55 525 River mile: 70.9 30 612 30 594 30 522 Mean time: 1538 5 563 5 525 5 448
Lagoon 50 574 45 559 55 466 River mile: 71.6 25 548 25 543 25 439 Mean time: 1542 5 546 5 467 5 391
IBM/Kedem 55 507 45 492 55 378 River mile: 72.3 30 477 25 479 30 372 Mean time: 1551 5 491 5 445 5 369
August 1 (cont.) High slack
September 6 Low slack
Position in cross-section, facing downstreamLeft Center Right
Table 5. --Depth and specific conductance measured at selected cross-sections of the Hudson River on July 17, August 1, and September 6, 2007.(continued)[Depths are measured in feet below water surface. Spec. cond., specific conductance, in microsiemens per centimeter at 25°C. Deepest measurements are 5 feet above bottom. Mean time, in Eastern Standard Time (EST).]
Page 31

Date and cross-section Depth Spec. cond. Depth Spec. cond. Depth Spec. cond.
Milton 55 418 50 370 50 346 River mile: 72.9 30 419 25 386 25 346 Mean time: 1602 5 435 5 390 5 347
Newburg-Beacon Bridge 30 3,990 40 4,090 35 4,120 River mile: 62.3 15 3,480 20 3,960 15 3,390 Mean time: 0828 5 3,180 5 3,040 5 3,130
New Hamburg -- -- 65 2,510 -- -- River mile: 67.7 -- -- 30 2,260 -- -- Mean time: 0844 -- -- 5 1,920 -- --
IBM/Kedem 50 804 45 918 55 1,074 River mile: 72.3 25 779 20 914 30 1,082 Mean time: 0900 5 772 5 780 5 715
Pirates Canoe Boat Club -- -- 50 751 -- -- River mile: 73.6 -- -- 25 706 -- -- Mean time: 0912 -- -- 5 644 -- --
Oakes -- -- 75 619 -- -- River mile: 74.6 -- -- 35 586 -- -- Mean time: 0919 -- -- 5 441 -- --
Central Hudson Power -- -- 55 594 -- -- River mile: 74.8 -- -- 25 487 -- -- Mean time: 0923 -- -- 5 421 -- --
Lincoln -- -- 60 525 -- -- River mile: 75.4 -- -- 30 500 -- -- Mean time: 0928 -- -- 5 413 -- --
Mid-Hudson Bridge 55 480 55 498 60 493 River mile: 75.9 25 473 25 461 30 460 Mean time: 0935 5 460 5 419 5 387
Poughkeepsie RR Bridge 50 445 50 417 65 357 River mile: 76.4 25 435 25 409 30 358
September 6 High slack
Left Center Right
September 6 Low slack (cont.)
Table 5. --Dedpth and specific conductance measured at selected cross-sections of the Hudson River on July 17, August 1, and September 6, 2007.(continued)[Depths are measured in feet below water surface. Spec. cond., specific conductance, in microsiemens per centimeter at 25°C. Deepest measurements are 5 feet above bottom. Mean time, in Eastern Standard Time (EST).]
Position in cross-section, facing downstream
Page 32

Mean time: 0947 5 435 5 386 5 359
Date and cross-section Depth Spec. cond. Depth Spec. cond. Depth Spec. cond.
Pough. Water Treat. Plant 50 402 50 389 55 345 River mile: 77.2 25 404 25 376 25 342 Mean time: 1002 5 398 5 367 5 342
September 6 High slack (cont.)
[Depths are measured in feet below water surface. Spec. cond., specific conductance, in microsiemens per centimeter at 25°C. Deepest measurements are 5 feet above bottom. Mean time, in Eastern Standard Time (EST).]
Position in cross-section, facing downstreamLeft Center Right
Table 5. --Depth and specific conductance measured at selected cross-sections of the Hudson River on July 17, August 1, and September 6, 2007.(continued)
Page 33

Tabel 6.--Location of the salt front found by delineation in 2007 and the corresponding daily mean specific conductance at each monitoring station. These data were used to verify and update the regressions.
[RM, river miles above the Battery; uS/cm at 25°C, microsiemens per centimeter at 25 degrees Celsius]
Daily mean specific conductance (uS/cm at 25°C)
Location of salt front found by delineation
(RM) Poughkeepsie West PointHastings-on-
HudsonDate
Jul. 17 67.2 298 3,200 18,000
Aug. 1 1 72.2 373 6,140 1 16,700
Sept. 6 1 75.9 758 7,050 1 17,500
[1 Delineation data on Aug. 1 and Sept. 6 were not included in the Hastings-on-Hudson regression.]
Page 34

Table 7.--Daily salt-front locations in river miles above the Battery at slack-high-tide from October 1, 2006, through September 30, 2007, estimated from the 2007 water year salt-front delineations and revised regression equations. Maximum upstream location of the salt front was 77.7 river miles above the Battery on Sept. 28.
[*****, estimated salt-front river mile below model calibration limit of 16.0 river miles]
Day October November December January February March
1 58.9 33.2 48.3 50.2 50.8 65.82 56.6 35.6 40.2 41.3 39.7 67.73 56.6 36.4 36.9 39.4 47.5 66.04 56.8 34.5 35.3 36.9 41.7 63.45 54.3 33.7 34.2 37.6 37.9 60.8
6 56.4 32.9 35.2 36.1 37.4 48.57 57.5 32.6 33.0 32.6 42.8 56.08 54.1 35.2 23.9 34.9 44.0 56.19 52.3 34.0 31.7 30.7 42.6 53.510 51.0 31.8 32.1 31.2 40.9 54.4
11 53.3 31.7 35.8 31.5 41.0 51.212 52.6 32.7 48.2 31.3 46.3 53.213 48.9 40.6 36.4 33.3 56.9 57.014 47.0 44.4 47.4 41.6 63.5 58.515 49.6 43.3 43.3 49.6 63.7 56.2
16 51.2 46.0 50.5 45.1 67.8 43.717 48.3 44.2 55.0 44.2 70.6 50.218 48.8 38.2 56.9 49.3 72.8 43.619 43.3 34.6 56.5 48.6 69.0 39.620 50.5 32.0 56.7 41.2 70.4 36.7
21 43.8 30.8 52.4 40.7 70.0 34.822 43.8 34.1 49.7 47.1 69.6 34.623 40.4 41.1 53.4 45.7 67.5 32.424 37.1 39.7 44.2 43.1 65.8 30.925 34.4 42.7 50.3 41.4 65.4 26.6
26 36.1 42.1 41.8 35.6 65.8 19.027 41.6 42.2 45.0 47.0 65.8 25.728 42.1 45.1 42.3 45.8 65.3 29.729 32.1 48.6 42.3 45.9 --- 29.530 24.7 46.3 42.9 45.6 --- 31.931 30.5 --- 43.9 46.6 --- 32.5
Max 58.9 48.6 56.9 50.2 72.8 67.7Min 24.7 30.8 23.9 30.7 37.4 19.0
Page 35

Table 7 (cont.).--Daily salt-front locations in river miles above the Battery at slack-high-tide from October 1, 2006, through September 30, 2007, estimated from the 2007 water year salt-front delineations and revised regression equations. Maximum upstream location of the salt front was 77.7 river miles above the Battery on Sept. 28.
[*****, estimated salt-front river mile below model calibration limit of 16.0 river miles]
Day April May June July August September
1 34.1 35.9 61.7 68.4 72.9 76.42 35.8 37.6 61.6 69.0 72.8 76.63 35.3 38.1 62.5 69.7 72.5 76.64 36.9 37.3 63.6 70.7 71.6 76.25 31.9 38.3 61.8 70.5 71.2 76.4
6 22.9 39.5 58.7 69.2 71.6 76.77 29.3 42.2 57.9 68.7 70.9 76.88 31.3 39.5 58.4 68.8 70.9 76.69 31.8 42.1 57.9 68.7 70.4 76.710 35.2 45.0 56.9 68.2 70.8 76.8
11 42.4 46.9 55.3 68.4 70.4 77.012 41.6 47.2 56.1 67.3 69.3 76.113 46.1 47.8 58.1 66.8 69.0 75.814 44.8 50.3 58.2 66.5 68.8 76.115 57.2 48.5 58.1 66.9 69.4 75.8
16 47.8 46.3 58.3 65.9 68.9 71.417 32.9 44.9 57.8 66.0 68.7 75.218 24.5 46.3 58.0 66.1 67.8 75.519 ***** 44.8 59.1 66.0 67.9 75.420 ***** 43.6 58.2 65.0 68.1 75.1
21 ***** 41.9 57.4 64.1 69.7 75.322 ***** 42.9 55.8 64.5 69.9 75.623 ***** 41.5 57.4 66.1 70.6 75.224 ***** 39.4 60.8 66.9 73.4 75.525 27.6 41.0 62.3 68.4 75.2 76.3
26 31.8 49.1 63.9 70.1 75.6 77.027 33.0 35.4 64.9 71.8 75.8 77.428 34.0 36.2 65.9 73.0 77.0 77.729 34.6 45.0 66.7 72.4 76.2 77.030 35.5 55.8 68.4 73.2 76.6 77.631 --- 59.8 --- 73.0 76.3 ---
Max 57.2 59.8 68.4 73.2 77.0 77.7Min ***** 35.4 55.3 64.1 67.8 71.4
Page 36