hud pd&r housing market profiles · 2017-05-17 · new home sales (including single-family...
TRANSCRIPT

HUD PD&R Housing Market Profiles Anaheim-Santa Ana-Irvine, California
Quick Facts About Anaheim-Santa Ana-Irvine
Current sales market conditions: balanced.
Current rental market conditions: tight.
The tourism industry accounts for 99,800 jobs in the Anaheim metropolitan division and has been one of the greatest sources of job growth for 6 consecutive years. Home to 42 miles of beaches, Disneyland, Disney California Adventure Park, and Knott’s Berry Farm, the metropolitan division received 47.4 million visitors during 2015, the most number of visitors of any year since 2000 (California Travel and Tourism Commission).
By Wendy Lynn Ip | As of March 1, 2017
OverviewThe Anaheim-Santa Ana-Irvine (hereafter, Anaheim) metropolitan division comprises Orange County, California, and is part of the greater Los Angeles-Long Beach-Anaheim metropolitan area. Orange County is the third most populous county in California and the sixth most populous county in the nation. As a regional center for health care, education, and the development of technology, the metropolitan division is also one of the most popular tourist destinations in the nation. Tourism spending in the Anaheim met-ropolitan division was $11.3 billion during 2015, surpassing the prerecession peak of nearly $9.7 billion in 2007 (Visit California).
• As of March 1, 2017, the estimated population of the Anaheim metropolitan division is nearly 3.2 million, increasing by 26,750, or 0.9 percent, annually since 2010, the highest increase in more than a decade. Strong economic conditions since 2010 supported an average net in-migration of 7,525 people annually.
• Population growth averaged only 6,525 people, or 0.2 percent, from 2003 to 2007, when lenient mortgage lending standards and relatively lower-priced homes in neighboring Riverside and San Bernardino Counties contributed to an average net out- migration of 20,850 people annually.
• Prior to 2010, weak economic conditions from the Great Reces sion and tight mortgage lending standards contributed to a slowing of net out-migration to neighboring counties. Net out-migration averaged 8,050 people a year from 2007 to 2010, resulting in net population growth averaging 14,900 people, or 0.5 percent.
U.S. Department of Housing and Urban Development | Office of Policy Development and Research

Anaheim-Santa Ana-Irvine, CAHUD PD&R Housing Market Profiles 2
U.S. Department of Housing and Urban Development | Office of Policy Development and Research
As of March 1, 2017
Ten sectors in the Anaheim area expanded during the 3 months ending February 2017.3 Months Ending Year-Over-Year Change
February 2016 (thousands)
February 2017 (thousands)
Absolute(thousands) Percent
Total nonfarm payrolls 1,568.1 1,585.5 17.4 1.1Goods-producing sectors 251.5 252.1 0.6 0.2
Mining, logging, and construction 95.2 96.6 1.4 1.5Manufacturing 156.3 155.5 – 0.8 – 0.5
Service-providing sectors 1,316.6 1,333.4 16.8 1.3Wholesale and retail trade 234.7 235.6 0.9 0.4Transportation and utilities 27.3 29.0 1.7 6.2Information 25.7 26.0 0.3 1.2Financial activities 116.3 117.6 1.3 1.1Professional and business services 292.8 298.7 5.9 2.0Education and health services 203.6 204.0 0.4 0.2Leisure and hospitality 206.4 209.5 3.1 1.5Other services 49.5 50.3 0.8 1.6Government 160.2 162.8 2.6 1.6
(percent) (percent)
Unemployment rate 4.0 3.7
Note: Numbers may not add to totals because of rounding.Source: U.S. Bureau of Labor Statistics
Economic ConditionsEconomic conditions in the Anaheim metropolitan division have been strong since 2010, although nonfarm payroll growth has moderated since 2016. Despite the recent moderation, nonfarm payroll growth following the Great Recession averaged more than 2.0 percent annually, surpassing a period of strong economic expansion that occurred from 2003 through 2007 when payroll growth averaged 1.5 percent annually.
During the 3 months ending February 2017—
• Nonfarm payrolls averaged nearly 1.59 million jobs, an increase of 17,400 jobs, or 1.1 percent, compared with the number of jobs during the same 3-month period in 2016, resulting from growth in 10 of the 11 sectors.
• The most significant gains were in the professional and business services and the leisure and hospitality sectors, which increased by 5,900 and 3,100 jobs, or 2.0 and 1.5 percent, respectively from the 3 months ending February 2016. The transportation and utilities sector had the greatest percentage net gain, up by 6.2 percent, or 1,700 jobs, because of 1,800 jobs added in the transportation and warehousing industry.
Nonfarm payroll growth in the Anaheim area dur ing the 3 months ending February 2017 slowed from a year ago, a similar trend as in the Pacific region and the nation.
Source: U.S. Bureau of Labor Statistics
Largest employers in the Anaheim area
Name of Employer Nonfarm Payroll Sector
Number of Employees
The Walt Disney Company Leisure and hospitality 29,000
University of California, Irvine Government 23,100
St. Joseph Health Education and health services 11,900
Note: Excludes local school districts. Source: Orange County Business Journal, 2016
4.0
2.0
0.0
– 2.0
– 4.0
– 6.0
Per
cent
cha
nge
from
pre
viou
sye
ar (3
-mon
th a
vera
ge)
Anaheim areaPacific region Nation
Feb
2008
Feb
2009
Feb
2010
Feb
2011
Feb
2012
Feb
2013
Feb
2014
Feb
2015
Feb
2016
Feb
2017
continued on page 3

Anaheim-Santa Ana-Irvine, CAHUD PD&R Housing Market Profiles 3
U.S. Department of Housing and Urban Development | Office of Policy Development and Research
As of March 1, 2017
• Nearly the entire gain in the professional and business services sector was attributed to growth in the administrative and support services industry, up by 5,800 jobs, or 4.5 percent, from a year ago. Approximately 80 companies throughout the metropolitan division expanded during the period, adding approximately 6,000 jobs (Orange County Business Journal). Companies that expanded include the Irvine Company, which added approximately 300 jobs.
• In the leisure and hospitality sector, the completion of two hotels in the Anaheim Resort™ district, an area that includes Disneyland and Disney California Adventure Park, added approximately 400 jobs, contributing to overall job gains in the sector.
• Job losses occurred only in the manufacturing sector, which decreased by 800 jobs, or 0.5 percent, from the 3 months ending
February 2016. The net decline in jobs partly resulted from restructuring at The Boeing Company in Huntington Beach, leading to more than 200 layoffs since February 2016.
The leisure and hospitality sector is expected to continue expanding through 2019 with the completion of three hotels that are currently under way, adding approximately 640 jobs in the in the Anaheim Resort district. In addition, the opening of the Star Wars Land attrac-tion at Disneyland is expected to add 1,525 permanent jobs when complete by the end of 2019. Growth in the transportation and warehousing industry is anticipated to continue through 2017 with the opening of two distribution centers, Amazon.com Inc. in the city of Irvine and GuardTop in the city of Anaheim, which will add a combined 100 jobs when complete. Layoffs at Boeing are expected to continue through 2018, with more than 500 jobs expected to be lost.
Sales Market ConditionsThe sales housing market in the Anaheim metropolitan division is currently balanced, with an estimated sales vacancy rate of 1.0 percent, a decrease from 1.4 percent in 2010 when conditions were soft. Sales market conditions improved as the inventory of homes for sale declined 51 percent, or 10,900 homes, from 2010 through January 2017 (CoreLogic, Inc.). The number of months homes remained on the market was down from 3.6 to 2.2 during the same period. During the 12 months ending January 2017, new home sales (including single-family homes, townhomes, and condominiums) were up from a year ago, while new home prices
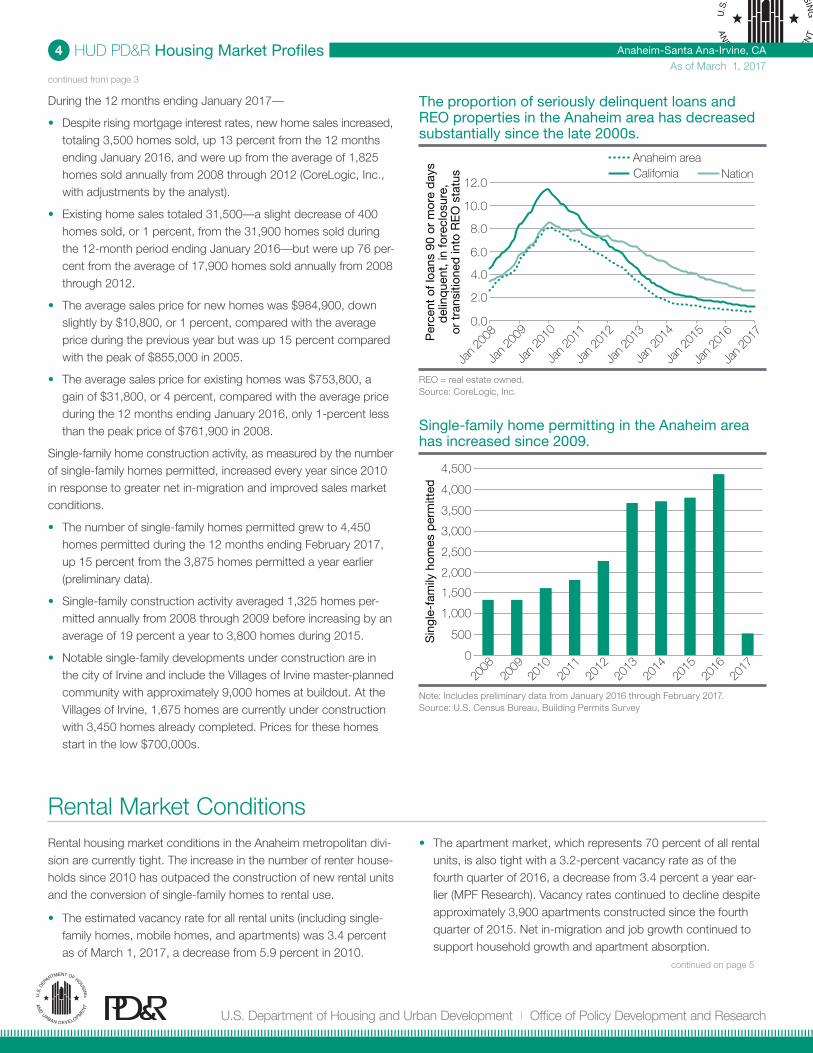
fell. The adjustment in prices follows 4 years of unsustainable price growth that averaged 13 percent a year. The sale of new luxury homes, particularly in the city of Irvine, where development had been strongest, contributed to the period of strong price growth. Existing home prices increased each year by an average of 5 per-cent annually since 2012, while sales contracted from the 3 months ending January 2016 because of continued price growth and reductions in available inventory. The gain in the average existing home sales price was partly attributed to a decline in the number of real estate owned (REO) home sales, which are currently priced approximately $112,500 less than the price of regular resales. As sales market conditions improved, the percentage of home loans in the Anaheim metropolitan division that were seriously delinquent (90 or more days delinquent or in foreclosure) or transitioned into REO status declined from 1.0 percent in January 2016 to 0.8 percent in January 2017 (CoreLogic, Inc.). The current rate is less than the 1.3-percent rate for California and the 2.6-percent rate for the nation.
New home sales prices in the Anaheim area have increased at a faster pace than existing home sale prices during most of the period since 2013.
Note: Includes single-family homes, townhomes, and condominiums.Source: CoreLogic, Inc., with adjustments by the analyst
Home sales in the Anaheim area have moderated since 2016 because of higher prices.
Note: Includes single-family homes, townhomes, and condominiums.Source: CoreLogic, Inc., with adjustments by the analyst
continued on page 4
850,000
900,000
950,000
1,000,000
1,050,000
800,000
750,000
700,000
650,000
600,000
550,000Ave
rage
pric
e (1
2-m
onth
ave
rage
$)
New home sales prices
Jan
2008
Jan
2007
Jan
2009
Jan
2010
Jan
2011
Jan
2012
Jan
2013
Jan
2014
Jan
2015
Jan
2016
Jan
2017
Existing home sales prices
35,000
30,000
25,000
10,000
15,000
20,000
5,000
4,200
3,400
1,000
1,800
2,600
Exi
stin
g ho
me
sale
s(1
2 m
onth
s en
din
g)
New
hom
e sa
les
(12
mon
ths
end
ing)
New home salesExisting home sales
Jan
2008
Jan
2007
Jan
2009
Jan
2010
Jan
2011
Jan
2012
Jan
2013
Jan
2014
Jan
2015
Jan
2016
Jan
2017
continued from page 2
Anaheim-Santa Ana-Irvine, CAHUD PD&R Housing Market Profiles 4
U.S. Department of Housing and Urban Development | Office of Policy Development and Research
As of March 1, 2017
During the 12 months ending January 2017—
• Despite rising mortgage interest rates, new home sales increased, totaling 3,500 homes sold, up 13 percent from the 12 months ending January 2016, and were up from the average of 1,825 homes sold annually from 2008 through 2012 (CoreLogic, Inc., with adjustments by the analyst).
• Existing home sales totaled 31,500—a slight decrease of 400 homes sold, or 1 percent, from the 31,900 homes sold during the 12-month period ending January 2016—but were up 76 per-cent from the average of 17,900 homes sold annually from 2008 through 2012.
• The average sales price for new homes was $984,900, down slightly by $10,800, or 1 percent, compared with the average price during the previous year but was up 15 percent compared with the peak of $855,000 in 2005.
• The average sales price for existing homes was $753,800, a gain of $31,800, or 4 percent, compared with the average price during the 12 months ending January 2016, only 1-percent less than the peak price of $761,900 in 2008.
Single-family home construction activity, as measured by the number of single-family homes permitted, increased every year since 2010 in response to greater net in-migration and improved sales market conditions.
• The number of single-family homes permitted grew to 4,450 homes permitted during the 12 months ending February 2017, up 15 percent from the 3,875 homes permitted a year earlier (preliminary data).
• Single-family construction activity averaged 1,325 homes per-mitted annually from 2008 through 2009 before increasing by an average of 19 percent a year to 3,800 homes during 2015.
• Notable single-family developments under construction are in the city of Irvine and include the Villages of Irvine master-planned community with approximately 9,000 homes at buildout. At the Villages of Irvine, 1,675 homes are currently under construction with 3,450 homes already completed. Prices for these homes start in the low $700,000s.
The proportion of seriously delinquent loans and REO properties in the Anaheim area has decreased substantially since the late 2000s.
REO = real estate owned.Source: CoreLogic, Inc.
Single-family home permitting in the Anaheim area has increased since 2009.
Note: Includes preliminary data from January 2016 through February 2017.Source: U.S. Census Bureau, Building Permits Survey
Rental Market ConditionsRental housing market conditions in the Anaheim metropolitan divi-sion are currently tight. The increase in the number of renter house-holds since 2010 has outpaced the construction of new rental units and the conversion of single-family homes to rental use.
• The estimated vacancy rate for all rental units (including single- family homes, mobile homes, and apartments) was 3.4 percent as of March 1, 2017, a decrease from 5.9 percent in 2010.
• The apartment market, which represents 70 percent of all rental units, is also tight with a 3.2-percent vacancy rate as of the fourth quarter of 2016, a decrease from 3.4 percent a year ear-lier (MPF Research). Vacancy rates continued to decline despite approximately 3,900 apartments constructed since the fourth quarter of 2015. Net in-migration and job growth continued to support household growth and apartment absorption.
0.0
2.0
4.0
10.0
12.0
8.0
6.0
Per
cent
of l
oans
90
or m
ore
day
sd
elin
que
nt, i
n fo
recl
osur
e,
or t
rans
ition
ed in
to R
EO
sta
tus
Anaheim areaCalifornia Nation
Jan
2008
Jan
2009
Jan
2010
Jan
2011
Jan
2012
Jan
2013
Jan
2014
Jan
2015
Jan
2016
Jan
2017
0
1,000
500
2008
2009
2010
2011
2012
2013
2014
2015
2016
2017
1,500
Sin
gle-
fam
ily h
omes
per
mitt
ed
2,000
2,500
4,500
3,000
3,500
4,000
continued from page 3
continued on page 5

Anaheim-Santa Ana-Irvine, CAHUD PD&R Housing Market Profiles 5
U.S. Department of Housing and Urban Development | Office of Policy Development and Research
As of March 1, 2017
• The average monthly apartment asking rent was $1,896 in the fourth quarter of 2016, an increase of $81, or 5 percent, from the fourth quarter of 2015.
Multifamily construction activity, as measured by the number of multifamily units permitted, slowed in the past year, but is at a higher level compared with the period from 2008 through 2012.
• During the 12 months ending February 2017, approximately 5,825 multifamily units were permitted, compared with 7,075 units permitted during the same period a year ago (preliminary data).
• Multifamily construction, as measured by the number of multi-family units permitted, averaged 1,400 units annually during 2008 through 2010 in response to stringent lending standards that restricted development before increasing to 3,800 units by 2012.
• From 2013 through 2015, multifamily construction averaged 6,425 units permitted a year. The increase was partly in response to the increased net in-migration and a greater proportion of renter households from 43.1 percent in 2012 to 43.4 percent in 2015 (2012 and 2015 American Community Survey 1-year data).
• Nearly 60 percent of apartments under construction are in the cities of Anaheim and Irvine. The Platinum Triangle neighbor-hood in the city of Anaheim is among the largest redevelop-ment district in the metropolitan division undergoing multifamily construction with 9,050 units approved since 2008, of which approximately 3,675 units have been completed. Developments under construction include the 386-unit Platinum Vista Apart-ments and the 400-unit A-Town Apartments with expected completion by late 2017 to mid-2018. In the city of Irvine, the 583-unit Westview Irvine Spectrum and the 520-unit Vireo at Park Place are under way. These two developments are expect-ed to be completed later in 2017. Rents for newly constructed, market-rate studio, one-, two-, and three-bedroom units start at $1,600, $1,700, $2,000, and $2,500 respectively in the Anaheim metropolitan division.
Apartment market conditions in the Anaheim area have been tight, with low vacancy rates and positive rent growth.
Q2 = second quarter. Q4 = fourth quarter.Source: MPF Research
Multifamily permitting in the Anaheim area has been greater since 2013 compared with permitting from 2008 through 2012.
Note: Includes preliminary data from January 2016 through February 2017.Source: U.S. Census Bureau, Building Permits Survey
4,000
1,000
2,000
3,000
5,000
6,000
7,000
8,000
0
Mul
tifam
ily u
nits
per
mitt
ed
2008
2009
2010
2011
2012
2013
2014
2015
2016
2017
2.0
3.0
4.0
5.0
6.0
7.0
2.5
3.0
3.5
4.0
4.5
5.0
Q2 20
13
Q4 20
12
Q4 20
13
Q2 20
14
Q4 20
14
Q2 20
15
Q4 20
15
Q2 20
16
Q4 20
16
Vac
ancy
rat
e (p
erce
nt)
Yea
r-ov
er-y
ear
per
cent
chan
ge in
ask
ing
rent
Asking rent Vacancy rate
continued from page 4