http:d.doi.org10.59350103-5053.20140038 0103 - 5053 · pdf filethe injected sample zone length...
TRANSCRIPT

Article J. Braz. Chem. Soc., Vol. 25, No. 4, 770-776, 2014.Printed in Brazil - ©2014 Sociedade Brasileira de Química0103 - 5053 $6.00+0.00Ahttp://dx.doi.org/10.5935/0103-5053.20140038
*e-mail: [email protected]
Rapid and Variable-Volume Sampling Loading in Nonaqueous Microchip Electrophoresis
Zhenhua Li,a Yuanming Guo,a Yongdong Zhou,a Xiaoning Zhangb and Hongmei Hu*,a
aZhejiang Province Key Lab of Mariculture & Enhancement, Marine Fishery Institute of Zhejiang Province, 316100 Zhoushan, China
bDepartment of Chemistry, Marshall University, 25755 Huntington-WV, USA
Um esquema rápido e de volume variável de carregamento de amostras para eletroforese não-aquosa em microchip com fluorescência induzida a laser (NAMCE-LIF) foi desenvolvido, incluindo um plugue de polímero poroso, uma bomba de microvácuo de baixo custo e uma fonte de alta tensão com potencial único. O plugue de polímero poroso foi fabricado dentro do canal de separação como uma válvula de seleção, que impedia o tampão de corrida do reservatório de descarte de tampão (BW) de fluir de volta ao canal de separação, mas permitia a migração eletroforética ao longo do canal de separação. Aplicando uma pressão subatmosférica ao headspace do reservatório de descarte (SW), amostra e tampão de corrida eram passados imediatamente ao SW. Concomitantemente, uma parte do fluxo de amostra era conduzido através do plugue de polímero poroso pela força elétrica, formando uma zona de amostra no canal de separação. O comprimento da zona de amostra injetada era proporcional ao tempo de injeção. O método proposto foi aplicado com sucesso na separação de Rodamina 123 (Rh123) e Rodamina 6G (Rh6G). Os limites de detecção para Rh123 e Rh6G baseados em S/N = 3 foram 0,63 e 0,48 nmol L–1, respectivamente. O sistema provou possuir um potencial para aperfeiçoamento de rendimento, repetibilidade, sensibilidade, desempenho da separação da eletroforese não aquosa em microchip e uma ampla gama de aplicações.
A rapid and variable-volume sample loading scheme for nonaqueous microchip electrophoresis with laser induced fluorescence detection (NAMCE-LIF) was developed, which included a porous polymer plug, a low-cost microvacuum pump, and a single potential supply. The porous polymer plug was fabricated within the separation channel as a select valve, which prevented the running buffer from buffer waste reservoir (BW) flowing back into the separation channel, but allowed electrophoretic migration along the separation channel. By applying a subatmospheric pressure to the headspace of sample waste reservoir (SW), sample and running buffer were drawn immediately to SW. At the same time, a branch of the sample stream was driven across the porous polymer plug by the electric force and formed a sample zone in the separation channel. The injected sample zone length was in proportion with the injection time. The proposed method was successfully applied to separation of Rhodamine 123 (Rh123) and Rhodamine 6G (Rh6G). The limits of detection for Rh123 and Rh6G based on S/N = 3 were 0.63 and 0.48 nmol L–1, respectively. The system has been proved to possess an exciting potential for improving throughput, repeatability, sensitivity, separation performance of nonaqueous microchip electrophoresis and a wide range of applications.
Keywords: variable-volume sample loading, nonaqueous microchip electrophoresis, negative pressure, porous polymer plug, electrokinetic force
Introduction
In the past decade, microchip electrophoresis (MCE) has been developed for biological and biomedical applications.1,2 There are various advantages of MCE over traditional separation techniques including high
separation efficiency, rapid analysis, small reagent and sample requirements, quite miniaturization, and integration. However, the small sample quantity makes it a challenge to achieve highly sensitive detection. Sample injection is crucial because it determines the quantity and the shape of a sample plug, both of which are closely related to separation.3 Up to now, electrokinetically pinched injection is the most commonly used method.4,5 But it has been
Li et al. 771Vol. 25, No. 4, 2014
reported that long sampling times, typically 10-150 s, are required for sampling with electrokinetically pinched scheme, which restricts the analytical speed.6 Two of the main limitations of electrokinetic injection are its strong dependency on surface properties of channel walls and the bias effect towards different species.7 To avoid biased injection and reduce injection time, our research group has proposed some negative pressure sampling devices in which negative pressure generated by a syringe pump,8 a microvacuum pump,9 or a pipet bulb,10 which only need 0.5-2 s for sampling. But the above method only could provide a short well-defined sample plug and the amount of sample was fixed, which may not meet the requirement of large volume injection.4,5,8-10 In practical analysis, the concentration of analytes may be extremely low, which need to increase the amount of sample to increase the sensitivity. Qi et al.11 developed a rapid and variable-volume sample loading scheme for chip-based sieving electrophoresis by negative pressure combined with electrokinetic force. This method realized variable-volume sample loading, but it may only suitable for separation of macromolecules of biological and medical interest such as DNA, RNA and protein. It is reported that integrating a lectin affinity monolith column in the microchannel of a microfludic chip would prevent pressure flow, but allow electrophoretic migration along the separation channel,12 and the combination of negative and electrokinetic has been well discussed.8-10 Combining negative pressure, electrokinetic, and a polymer plug would be a good choice to realize rapid and variable-volume sample loading.
Rhodamine dyes are used extensively in biotechnology applications due to their excellent optical property and considerable water solubility.13,14 Meanwhile, they may also affect on energy transduction,15 or selective phototoxicity to carcinoma cells.16 Once being widely used in textile industry, Rhodamine 6G (Rh6G) can pose environmental risk as being an emerging contaminant in wastewater.17 In general, the most attractive analytical separation techniques for determination of rhodamine dyes are high performance liquid chromatography (HPLC),18,19 capillary electrophoresis (CE),20 MCE,21,22 nonaqueous microchip electrophoresis (NAMCE),23 with detection of mass spectrometry (MS), laser induce fluorescence (LIF), or chemiluminiscence (CL).
It is reported that a better result with higher sensitivity can be achieved in nonaqueous media compared to analysis in aqueous media. In this paper, a rapid and variable-volume sampling loading in NAMCE-LIF system was established. This approach has been proved to be highly reproducible for introducing rhodamine dyes in NAMCE with the following advantages: 1. the capability to freely choose the
sample plug volume by simply changing the injection time; 2. high sensitivity and superior separation performance; 3. simplification of the electrophoresis system by using a single power supply with a low-cost microvacuum pump-based negative pressure sampling device and a porous polymer plug; 4. rapid bias-free analyte transport from sample reservoir to the injection point.
Experimental
Chemicals and reagents
All the chemicals and reagents were of analytical grade and used without further purification. Ultrapure water (Mili-Q Plus 185, Millipore Corporation) was used throughout. Butyl methacrylate (BMA), 2-acrylamido-2-methyl-1-propane sulfonic acid (AMPS), 3-glycidoxypropyltrimethoxysilane (GLYMO) and fluorescein sodium salt (Flu) were obtained from Sigma-Aldrich (St. Louis, MO, USA). Ethylene dimethacrylate (EDMA) and 2,2-dimethoxy-2-phenylacetophenone (DMAP) were purchased from Acros Organics (Geel, Belgium, USA). Rhodamine 123 (Rh123) was purchased from Fluka (Buchs, Germany). Rh6G and 2-hydroxyethyl methacrylate (HEMA) were purchased from J&K Chemical LTD (Shanghai, China).
Flu was dissolved in the running buffer (20 mmol L–1 borate buffer, pH 9.2). 1 × 10⁻⁴ mol L–1 sample stock solutions were prepared by dissolving certain amount of Rh123 and Rh6G in acetonitrile (ACN), respectively. The running buffer for separation Rh123 and Rh6G was 5 mmol L–1 Tris and 5 mmol L–1 ammonium acetate in ACN.
Instruments
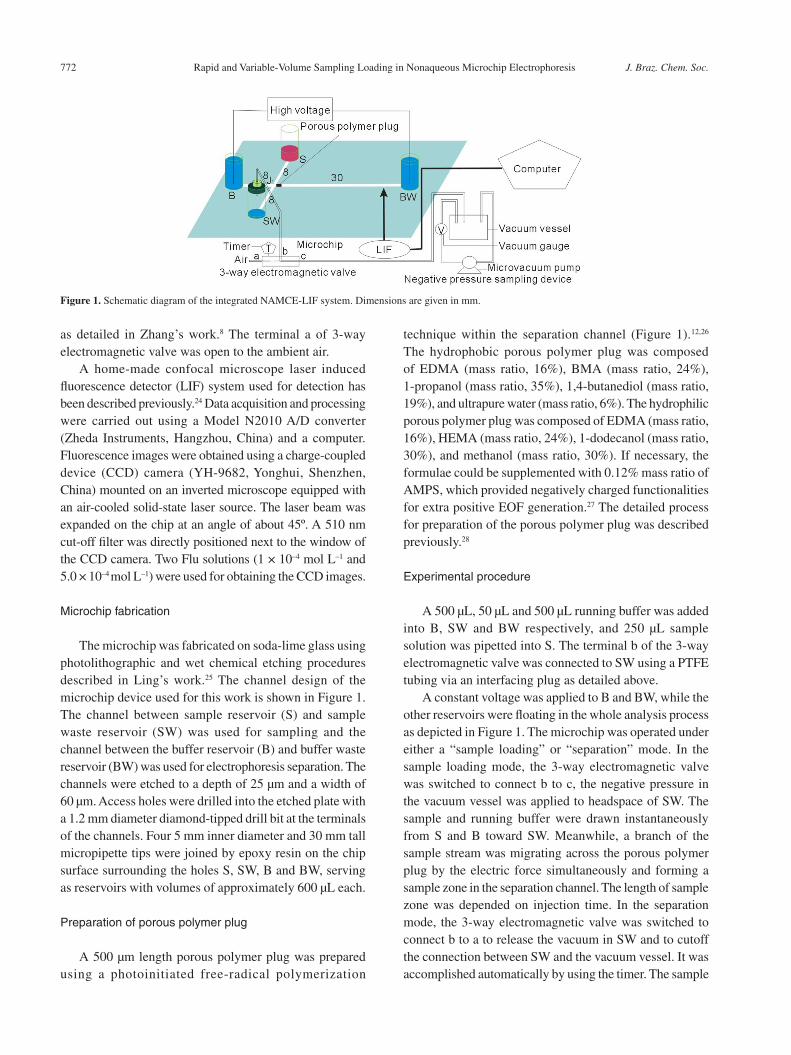
The schematic diagram of NAMCE-LIF analysis system is shown in Figure 1. A microvacuum pump (Ruiyi, Model PS5008B, Chengdu, China), a vacuum vessel (50 mL), a 3-way electromagnetic valve (SMC, Model VDW250-5G-2-M5, Tokyo, Japan),a timer (precision 10 ms), a vacuum gauge (60 mm, 0-1000 mbar, YXC-100, YICHUAN, Shanghai, China) with two electric switches to adjust the vacuum in the vacuum vessel and a single high voltage power supply (HV) (Dongwen, Model DW-P602-1F, Tianjin, China), variable in the range of 0-6 kV, were used for sampling and electrophoresis separation. The vacuum vessel was connected to the terminal c of the 3-way electromagnetic valve through a polytetrafluoroethene (PTFE) tubing of 0.8 mm i.d. and 1.8 mm o.d.. The terminal b of the 3-way electromagnetic valve was connected to SW using the same PTFE tubing via an interfacing plug
Rapid and Variable-Volume Sampling Loading in Nonaqueous Microchip Electrophoresis J. Braz. Chem. Soc.772
as detailed in Zhang’s work.8 The terminal a of 3-way electromagnetic valve was open to the ambient air.
A home-made confocal microscope laser induced fluorescence detector (LIF) system used for detection has been described previously.24 Data acquisition and processing were carried out using a Model N2010 A/D converter (Zheda Instruments, Hangzhou, China) and a computer. Fluorescence images were obtained using a charge-coupled device (CCD) camera (YH-9682, Yonghui, Shenzhen, China) mounted on an inverted microscope equipped with an air-cooled solid-state laser source. The laser beam was expanded on the chip at an angle of about 45º. A 510 nm cut-off filter was directly positioned next to the window of the CCD camera. Two Flu solutions (1 × 10⁻⁴ mol L–1 and
5.0 × 10⁻⁴ mol L–1) were used for obtaining the CCD images.
Microchip fabrication
The microchip was fabricated on soda-lime glass using photolithographic and wet chemical etching procedures described in Ling’s work.25 The channel design of the microchip device used for this work is shown in Figure 1. The channel between sample reservoir (S) and sample waste reservoir (SW) was used for sampling and the channel between the buffer reservoir (B) and buffer waste reservoir (BW) was used for electrophoresis separation. The channels were etched to a depth of 25 μm and a width of 60 μm. Access holes were drilled into the etched plate with a 1.2 mm diameter diamond-tipped drill bit at the terminals of the channels. Four 5 mm inner diameter and 30 mm tall micropipette tips were joined by epoxy resin on the chip surface surrounding the holes S, SW, B and BW, serving as reservoirs with volumes of approximately 600 μL each.
Preparation of porous polymer plug
A 500 μm length porous polymer plug was prepared using a photoinitiated free-radical polymerization
technique within the separation channel (Figure 1).12,26 The hydrophobic porous polymer plug was composed of EDMA (mass ratio, 16%), BMA (mass ratio, 24%), 1-propanol (mass ratio, 35%), 1,4-butanediol (mass ratio, 19%), and ultrapure water (mass ratio, 6%). The hydrophilic porous polymer plug was composed of EDMA (mass ratio, 16%), HEMA (mass ratio, 24%), 1-dodecanol (mass ratio, 30%), and methanol (mass ratio, 30%). If necessary, the formulae could be supplemented with 0.12% mass ratio of AMPS, which provided negatively charged functionalities for extra positive EOF generation.27 The detailed process for preparation of the porous polymer plug was described previously.28
Experimental procedure
A 500 μL, 50 μL and 500 μL running buffer was added into B, SW and BW respectively, and 250 μL sample solution was pipetted into S. The terminal b of the 3-way electromagnetic valve was connected to SW using a PTFE tubing via an interfacing plug as detailed above.
A constant voltage was applied to B and BW, while the other reservoirs were floating in the whole analysis process as depicted in Figure 1. The microchip was operated under either a “sample loading” or “separation” mode. In the sample loading mode, the 3-way electromagnetic valve was switched to connect b to c, the negative pressure in the vacuum vessel was applied to headspace of SW. The sample and running buffer were drawn instantaneously from S and B toward SW. Meanwhile, a branch of the sample stream was migrating across the porous polymer plug by the electric force simultaneously and forming a sample zone in the separation channel. The length of sample zone was depended on injection time. In the separation mode, the 3-way electromagnetic valve was switched to connect b to a to release the vacuum in SW and to cutoff the connection between SW and the vacuum vessel. It was accomplished automatically by using the timer. The sample
Figure 1. Schematic diagram of the integrated NAMCE-LIF system. Dimensions are given in mm.

Li et al. 773Vol. 25, No. 4, 2014
zone entered into the separation channel and migrated along the separation channel under the potential applied. At the same time, the data acquisition and processing system was activated to record the electropherograms.
Results and discussion
Function of the porous polymer plug
A negative pressure sampling device was used for sample loading which has been detail presented in our previous work.8-10 According to the previous work,8-10 in the sample loading mode, a well pinched sample plug was formed at the channel intersection. As can be seen from Figure 2A, when microvacuum pump was used to generate negative pressure,9 a well pinched sample plug could be formed in less than 0.5 s, and it would remain the same profile with longer sampling time. In this paper, since a 500 μm length porous polymer plug was fabricated within the separation channel as a select valve, which prevented the running buffer from BW flowing back into the separation channel, but allowed electrophoretic migration along the separation channel. Variable-volume sampling loading was realized by controlling injection time. Fluorescence images of sample loading profile with different injection time are shown in Figure 2B. With the injection time increased, more and more sample was introduced into the separation channel.
The interaction between analytes and porous polymer plug has been investigated in this work. It is known that the surface properties of the porous polymer plug was judged by the monomers used. HEMA provided hydrophilic polar function, BMA afforded a hydrophobic surface, ionizable monomer-AMPS was used in the polymerization mixtures to provide negatively charged functionalities. When the
porous polymer plug with hydrophilic surface was chosen to detect Flu, Flu could not pass through the porous polymer plug after several injections. When the porous polymer plug with hydrophobic surface was used, the reproducibility was satisfactory after dozens of injections. Therefore, to meet the requirement of different analyses, special monomers should be chosen.
To avoid the interaction between analytes and porous polymer plugs, opposite polarities of porous polymer plugs were chosen for analytes with different polarities. The effect of the porous polymer plug with hydrophobic surface on separation was investigated by MCE-LIF system. The result is shown in Figure 3. Average migration times of impurity and Flu were 38.48 s, 76.21 s and 37.49 s, 70.01 s, with RSDs of 1.7%, 2.8% and 1.2%, 1.4% for the porous polymer plug with hydrophobic surface and without a porous polymer plug, respectively. Average peak widths were 3.71 s, 11.32 s and 3.88 s, 10.19 s, with RSDs of 2.5%, 1.6% and 5.4%, 5.1%. RSDs of average peak height were 1.1%, 3.5% and 0.4%, 3.6%. RSDs of average of peak area were 3.6%, 2.1% and 4.8%, 4.9%. Resolution of the two compounds were 4.6 and 5.0, with RSDs of 4.9% and 3.5% (n = 5). Hence, the porous polymer plug in the separation channel would not affect the separation performance.
NAMCE-LIF system applied in the separation of Rh123 and Rh6G
Rh6G and Rh123 were used as model molecules in the proposed NAMCE-LIF system to investigate the performance of this method. To avoid adsorption of Rh6G and Rh123 on the surface of the porous polymer plug, hydrophobic surface of the porous polymer plug was chosen in this section.
Figure 2. Fluorescence images depicting negative pressure sampling method. A: without porous polymer plug, (a-f) sample loading profile after applying vacuum degree (–50 mbar) to the headspace of the sealed SW for 0, 0.1, 0.2, 0.3, 0.4, 0.5 s, respectively. B: with porous polymer plug containing AMPS, (a-f) sample loading profile after applying vacuum degree (–50 mbar) to the headspace of the sealed SW for 0, 0.2, 0.4, 0.6, 1.0, 1.5 s, respectively. The arrows indicate the direction of the flow in channels.

Rapid and Variable-Volume Sampling Loading in Nonaqueous Microchip Electrophoresis J. Braz. Chem. Soc.774
Running buffer and electric-field strength
The influences of three different running buffers (pure ACN, 5 mmol L–1 Tris in ACN, 5 mmol L–1 Tris and 5 mmol L–1 ammonium acetate in ACN) on nonaqueous electrophoresis separation were investigated under different electric-field strength ranging from 75 to 750 V cm–1. As shown in Figure 4, when pure ACN was used, with the increasing of electric-field strength, the degree of separation first increased then decreased, and the optimized degree of separation was 0.76 at the electric-field strength of 162.5 V cm–1, which could not meet the requirement of the
analysis method. Electroosmotic flow (EOF) was reduced to improve separation. On the one hand, the monolith used to generate EOF must contain ionizable functional groups, ionizable monomer-AMPS was used in the polymerization mixtures to provide negative charged function for extra EOF generation.26 Therefore, when a 500 μm length hydrophobic porous polymer plug without AMPS was prepared in separation channel, the EOF would be reduced. On the other hand, adding the appropriated electrolytes in nonaqueous was another good choice. The higher concentration of the electrolyte, the smaller EOF.29 When 5 mmol L–1 Tris in ACN was used, the results showed that the
Figure 3. Electropherograms of 5 times repetitively separated Flu and impurity and microscope image of porous polymer plug. (A) porous polymer plug with hydrophobic surface without AMPS; (B) without porous polymer plug; (C) image of porous polymer plug. Sampling loading time: 0.2 s, detection length L = 2 cm, electric-field strength E = 250 V cm–1, n = 5. Arrows on the baselines correspond to the starting point of the MCE separation.
Figure 4. Influence of electric-field strength on NAMCE separation of Rh123 (2 × 10⁻⁷ mol L–1) and Rh6G (2 × 10⁻⁷ mol L–1) using ACN as running buffer (a) 75 V cm–1; (b) 125 V cm–1; (c) 162.5 V cm; (d) 200 V cm–1 and (e) 250 V cm–1. A 500 μm length hydrophobic porous polymer plug containing AMPS; sampling loading time: 0.2 s; vacuum degree of sampling: –50 mbar; detection length L = 2.5 cm; arrows on the baselines correspond to the starting point of the NAMCE separation.

Li et al. 775Vol. 25, No. 4, 2014
optimized degree of separation was 0.926 at the electric-field strength of 125 V cm–1 (Figure 5). But under this condition, the column efficiency was a little small. Then, 5 mmol L–1 Tris and 5 mmol L–1 ammonium acetate in ACN was used. As shown in Figure 6, the degrees of separation were all more than 1.0 at each electric-field strength. Considering both the effect of joule heating and the column efficiency, electric-field strength of 375 V cm–1 was selected. Therefore, 5 mmol L–1 Tris and 5 mmol L–1 ammonium acetate in ACN and electric-field strength of 375 V cm–1 were used in the following experiments.
Injection time
As discussed above, the proposed method was based on variable-volume sampling loading. With injection time
increased, the length of sample zone increased, which is very suitable for trace analysis. 1.0 × 10⁻⁸ mol L–1 of Rh123 and Rh6G was examined under injection time of 0.1, 0.3, 0.6, 1, 1.5 and 2 s. The results showed that the peak area increased with the increase of injection time. A linear relationship was between peak area of Rh123 and Rh6G and injection. The linear regression coefficient of Rh123 and Rh6G were 0.9907 and 0.9913, respectively.
Performance of the NAMCE-LIF system
To evaluate the precision of the method, 30 sequential injections were performed using a standard solution of 2.0 × 10⁻⁷ mol L–1 Rh123 and 2.0 × 10⁻⁷ mol L–1 Rh6G with detection point at 25 mm down towards BW from the cross intersection and 0.5 s of injection time. The
Figure 5. Influence of electric-field strength on NAMCE separation of Rh123 (5 × 10⁻⁸ mol L–1) and Rh6G (5 × 10⁻⁸ mmol L–1) using 5 mmol L–1 Tris in ACN as running buffer (a) 625 V cm–1; (b) 500 V cm–1; (c) 375 V cm–1; (d) 250 V cm–1; (e) 187.5 V cm–1 and (f) 125 V cm–1. A 500 μm length hydrophobic porous polymer plug without AMPS; sampling loading time: 0.5 s; vacuum degree of sampling: –50 mbar; detection length L = 2.5 cm; arrows on the baselines correspond to the starting point of the NAMCE separation.
Figure 6. Influence of electric-field strength on NAMCE separation of Rh123 (2 × 10⁻⁷ mol L–1) and Rh6G (2 × 10⁻⁷ mol L–1) using 5 mmol L–1 Tris + 5 mmol L–1 ammonium acetate in ACN as running buffer (a) 200 V cm–1; (b) 375 V cm–1; (c) 500 V cm–1; (d) 625 V cm–1 and (e) 750 V cm–1. A 500 μm length hydrophobic porous polymer plug without AMPS; sampling loading time: 0.5 s; vacuum degree of sampling: –50 mbar; detection length L = 2.5 cm; arrows on the baselines correspond to the starting point of the NAMCE separation.

Rapid and Variable-Volume Sampling Loading in Nonaqueous Microchip Electrophoresis J. Braz. Chem. Soc.776
average migration time of the peaks for Rh123 and Rh6G were 28.1 and 35.6 s, with a precision of 2.6 and 2.1% RSD, respectively. Peak height precisions for Rh123 and Rh6G were 3.5% and 4.2% and peak area 5.6% and 4.8% RSD (n = 30). These results indicate that the sample composition in S would not vary with the running times, because the analytes were bias-freely transported from S to the injection point by a subambient pressure applied to the headspace of SW. In addition, it can also be inferred that liquid level variation has a little effect on the sampling precision. Chip-to-chip deviation were also examined by measuring the same solution on 4 parallel prepared microchips. The RSDs for the migration time were 6.8% and 6.5% and the peak height 7.2% and 8.3% for Rh123 and Rh6G respectively. The LODs for Rh123 and Rh6G based on S/N = 3 were found to be 0.63 and 0.48 nmol L–1, respectively.
Conclusions
The present method provided a time-based sample injection scheme in nonaqueous microchip electrophoresis using a simple and robust sampling device composed of a single power supply, a low-cost microvacuum pump, and a porous polymer plug. It enables rapid bias-free analyte transport from sample reservoir to the injection point. Simply changing the injection time can freely optimize the sample plug length. The approach has been proved to be useful for introduction of rhodamine dye with high reliability in NAMCE. Experimental results indicated that high sensitivity, reproducibility and superior separation performance can be achieved in NAMCE due to the more injected sample amount.
Acknowledgements
This work was supported by Science and Technology Plan Project of Zhejiang Province (No. 2012C37022, No. 2012F20026).
References
1. Masatoshi, K.; Junichi, K.; Yasuo, S.; Trans. Inst. Elect. Eng.
Jpn. 2007, 127, 222.
2. Gawron, A. J.; Martin, R. S.; Lunte, S. M.; Eur. J. Pharm. Sci.
2001, 14, 1.
3. Fu, L. M.; Yang, R. J.; Lee, G. B.; Anal. Chem. 2003, 75, 1905.
4. Jacobson, S. C.; Hergenroder, R.; Koutny, L. B.; Warmack,
R. J.; Ramsey, J. M.; Anal. Chem. 1994, 66, 1107.
5. Jacobson, S. C.; Hergenroder, R.; Koutny, L. B.; Ramsey, J. M.;
Anal. Chem. 1994, 66, 1114.
6. Zhang, C. X.; Manz, A.; Anal. Chem. 2001, 73, 2656.
7. Wang, W.; Zhou, F.; Zhao, L.; Zhang, J. R.; Zhu, J. J.;
Electrophoresis 2008, 29, 561.
8. Zhang, L.; Yin, X. F.; Fang, Z. L.; Lab Chip 2006, 6, 258.
9. Zhang, L.; Yin, X. F.; Electrophoresis 2007, 28, 1281.
10. Hu, H. M.; Yin, X. F.; Qi, L. Y.; Liu, J. H.; Electrophoresis 2009,
30, 4213.
11. Qi, L. Y.; Yin, X. F.; Zhang, L.; Wang, M.; Lab Chip 2008, 8,
1137.
12. Mao, X. L.; Luo, Y.; Dai, Z. P.; Wang, K. Y.; Du, Y. G.; Lin,
B. C.; Anal. Chem. 2004, 76, 6941.
13. Sun, Y. B.; Wen, Y. G.; Yan, Y.; Li, G. F.; J. Chromatogr. B 2011,
879, 3943.
14. Mandala, M.; Serck-Hanssen, G.; Martino, G.; Helle, K. B.;
Anal. Biochem. 1999, 274, 1.
15. Higuti, T.; Niimi, S.; Saito, R.; Nakasima, S.; Ohe, T.; Tani, I.;
Yoshimura, T.; Biochim. Biophys. Acta 1980, 593, 463.
16. Shea, C. R.; Sherwood, M. E.; Flotte, T. J.; Chen, N.; Scholz, M.;
Hasan, T.; Cancer Res. 1990, 50, 4167.
17. Duran, C.; Ozdes, D.; Bulut, V. N.; Tufekci, M.; Soylak, M.;
J. AOAC Int. 2011, 94, 286.
18. Zhao, S.; Yin, J.; Zhang, J.; Ding, X. J.; Wu, Y. N.; Shao, B.;
Food Anal. Method. 2012, 5, 1018.
19. Chiang, T. L.; Wang, Y. C.; Ding, W. H.; J. Chin. Chem. Soc.
2012, 59, 515.
20. Zhu, J. K.; Shu, L.; Zhang, F.; Li, Z.; Wang, Q.; He, P.; Fang, Y.;
Luminescence 2012, 27, 482.
21. Yang, X. B.; Yan, W. P.; Liu, Z. H.; Lv, H. F.; Appl. Opt. 2012,
51, 1697.
22. Milanova, D.; Chambers, R. D.; Bahga, S. S.; Santiago, J. G.;
Electrophoresis 2011, 32, 3286.
23. Hu, H. M.; Yin, X. F.; Wang, X. Z.; Shen, H.; J. Sep. Sci. 2013,
36, 713.
24. Sun, Y.; Yin, X. F.; J. Chromatogr. A 2006, 1117, 228.
25. Ling, Y. Y.; Yin, X. F.; Fang, Z. L.; Electrophoresis 2005, 26,
4759.
26. Yu, C.; Xu, M. C.; Svec, F.; Frechet, J. M. J.; J. Polym. Sci.,
Part A: Polym. Chem. 2002, 40, 755.
27. Ping, G.; Zhang, L.; Zhang, L.; Zhang, W.; Schmitt-Kopplin, P.;
Kettrup, A.; Zhang, Y.; J. Chromatogr. A 2004, 1035, 265.
28. Wang, X. Z.; Yin, X. F.; Cheng, H. Y.; Shen, H.; Analyst 2010,
135, 1663.
29. Bowser, M. T.; Kranack, A. R.; Chen, D. D. Y.; TrAC-Trend.
Anal. Chem. 1998, 17, 424.
Submitted on: September 08, 2013
Published online: February 14, 2014