hsbc managing growth, scale and complexity
TRANSCRIPT

MANAGING GROWTH, SCALE AND COMPLEXITY
Douglas FlintGroup Finance Director
CLSA Conference – Hong Kong - September 2006

XGS4354
2
Forward-looking statements
This presentation and subsequent discussion may contain certain forward-looking statements with respect to the financial condition, results of operations and business of the Group. These forward-looking statements represent the Group’s expectations or beliefs concerning future events and involve known and unknown risks and uncertainty that could cause actual results, performance or events to differ materially from those expressed or implied in such statements. Additional detailed information concerning important factors that could cause actual results to differ materially is available in our Annual Report.
XGS4354
3
Tegucigalpa
Bogotá
SanSalvador
San Jose
Managua
To be added with Grupo Banistmo S.A.
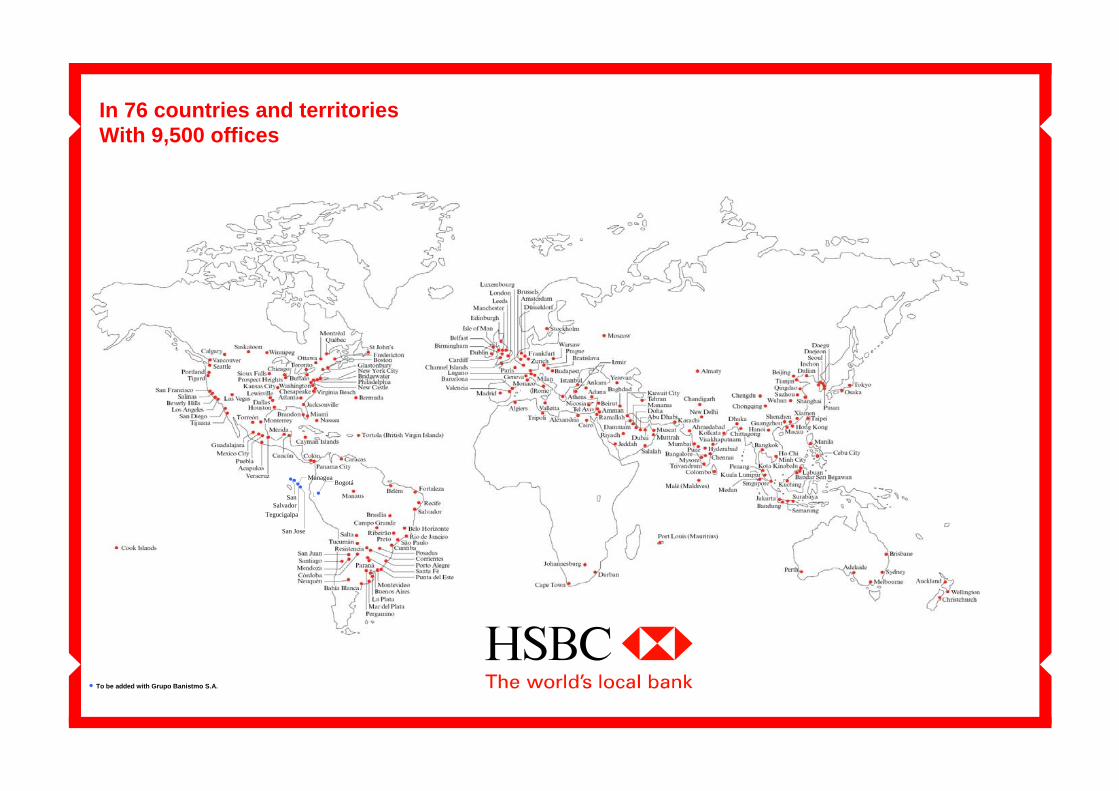
In 76 countries and territoriesWith 9,500 offices

XGS4354
4
Changed and expanded Group profile
Staff (FTE) 101,000 284,000 10%
Customers 25m > 100m 15%
RWAs US$ 225bn US$ 873bn 14%
HSBC’s market cap US$ 40bn US$ 202bn 17%
HSBC’s dividend yield – 31 Aug 2006 4.1%
1995 1H06 CAGR%

XGS4354
5
HSBC – record of growthDividends per share / earnings per share
0
20
40
60
80
100
120
140
1995 1996 1997 1998 1999 2000 2001 2002 2003 2004 2005
DPS EPS
(US cents)
UK GAAP (excl goodwill amortisation) IFRS

XGS4354
6
Geographic coverage and scale
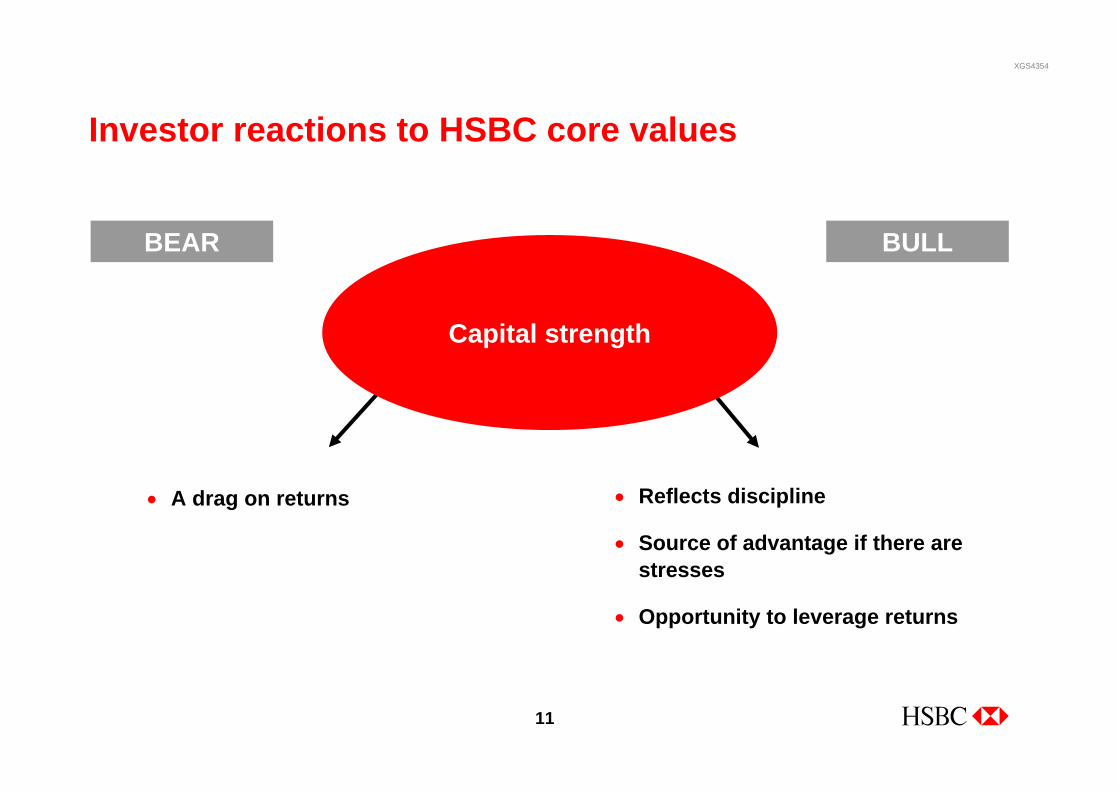
BULL
Investor reactions to HSBC core values
BEAR
• Too many moving parts?
• Hard to see what drives performance
• Is it manageable?
• Cross border differentiation
• Cost synergies
• Development opportunities for human talent pool
XGS4354
7
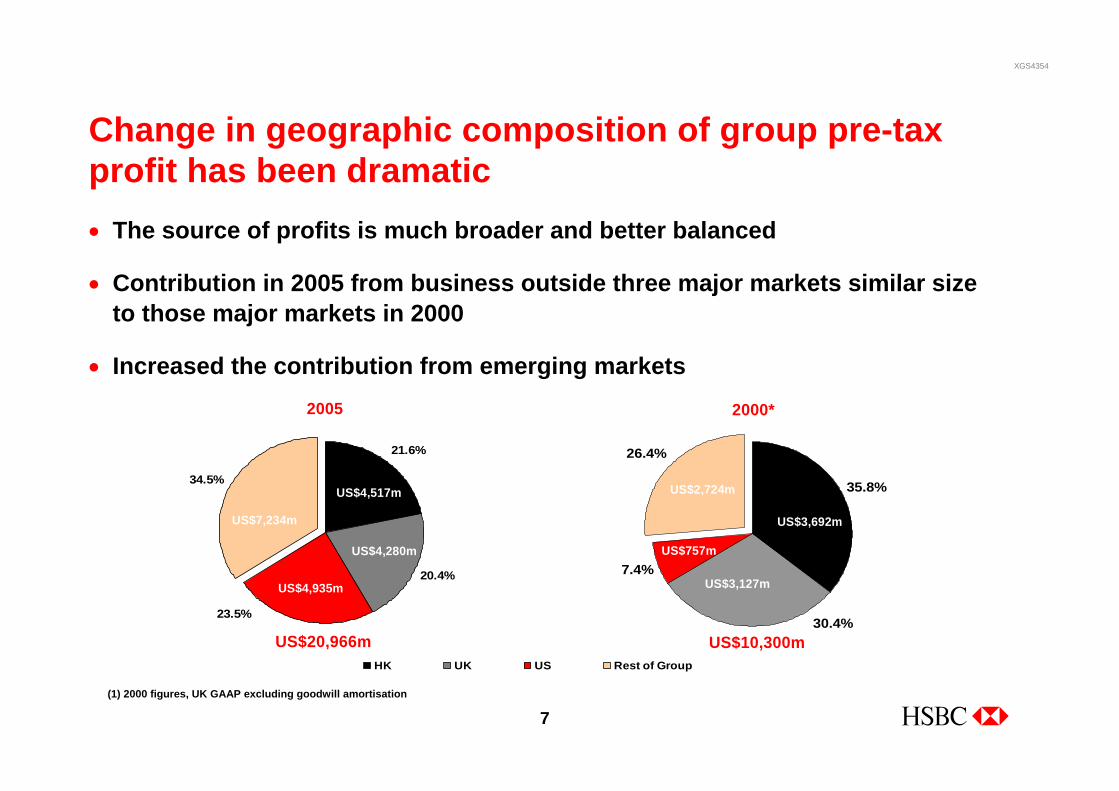
Change in geographic composition of group pre-tax profit has been dramatic• The source of profits is much broader and better balanced
• Contribution in 2005 from business outside three major markets similar size to those major markets in 2000
• Increased the contribution from emerging markets
(1) 2000 figures, UK GAAP excluding goodwill amortisation
21.6%
20.4%
34.5%
23.5%
HK UK US Rest of Group
2005 2000*
35.8%
7.4%
26.4%
30.4%
US$4,517m
US$757mUS$4,280m
US$4,935m
US$7,234m
US$2,724m
US$3,127m
US$3,692m
US$20,966m US$10,300m*2000 figures, UK GAAP excluding goodwill amortisation

XGS4354
8
Emerging market potential
BULL
Investor reactions to HSBC core values
BEAR
• Not as leveraged as pure plays
• Absence of consolidation premium
• Combination of emerging markets and developed economies offers powerful synergies
• Best positioned in China

XGS4354
9
Strong growth in emerging markets
Argentina 112 154 244 58Brazil 208 281 406 44China -26 32 334 944India 87 178 212 19Indonesia 70 76 113 49Malaysia 116 214 236 10Mexico 9 774 923 19Saudi Arabia 30 122 236 93South Korea 65 89 94 6Taiwan 45 107 68 -36Turkey 59 142 265 87UAE 130 192 308 60Total 905 2,361 3,439 +46
(US$ millions) 20001 2004 2005 % change 2004/2005
(1) 2000 figures, UK GAAP excluding goodwill amortisation

XGS4354
10
Which continues into 2006
Mexico 428 515 +20Middle East 204 378 +85Mainland China 161 280 +74Brazil 185 251 +36India 108 215 +99Saudi Arabia 128 181 +41Malaysia 103 128 +24Turkey 133 120 -10Argentina 165 83 -50South Korea 55 48 -13Philippines 19 43 +126Indonesia 55 27 -51Thailand 31 24 -23Taiwan 48 (43) n/aTotal 1,823 2,250 +23
Profit before tax (US$ millions) 1H05 1H06 % change
XGS4354
11
Capital strength
BULL
Investor reactions to HSBC core values
BEAR
• Reflects discipline
• Source of advantage if there are stresses
• Opportunity to leverage returns
• A drag on returns
XGS4354
12
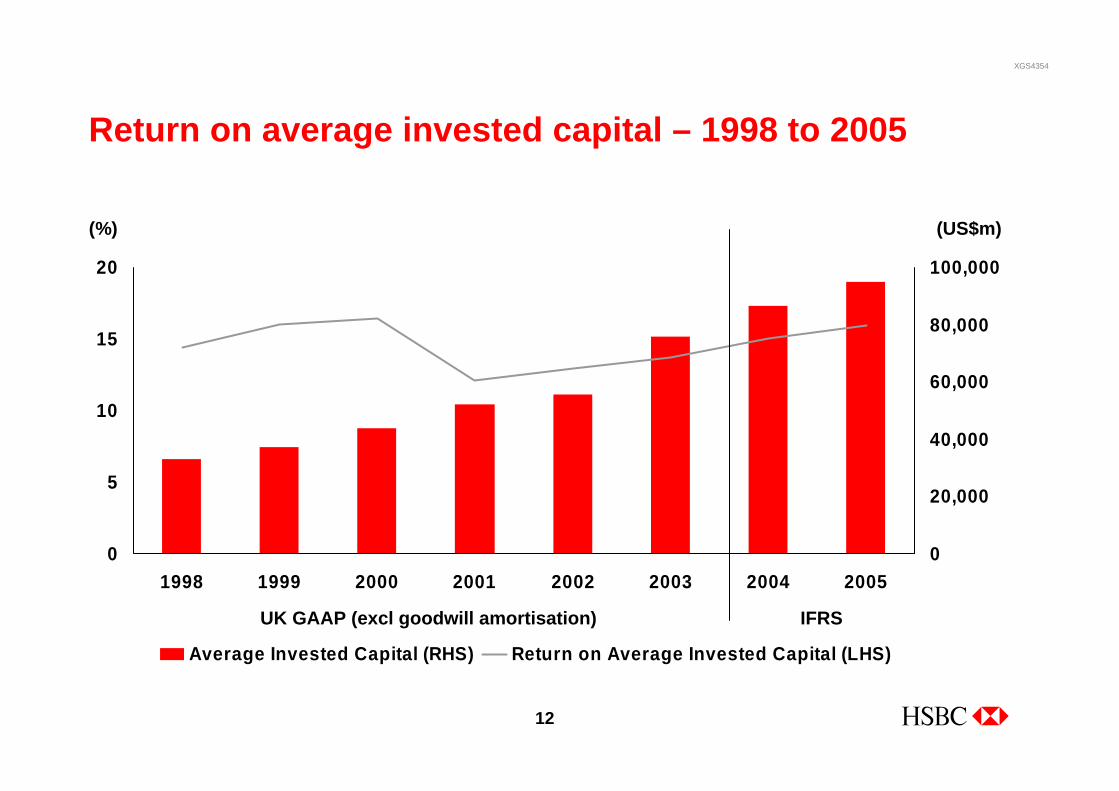
Return on average invested capital – 1998 to 2005
0
5
10
15
20
1998 1999 2000 2001 2002 2003 2004 20050
20,000
40,000
60,000
80,000
100,000
Average Invested Capital (RHS) Return on Average Invested Capital (LHS)
(%) (US$m)
UK GAAP (excl goodwill amortisation) IFRS
XGS4354
13
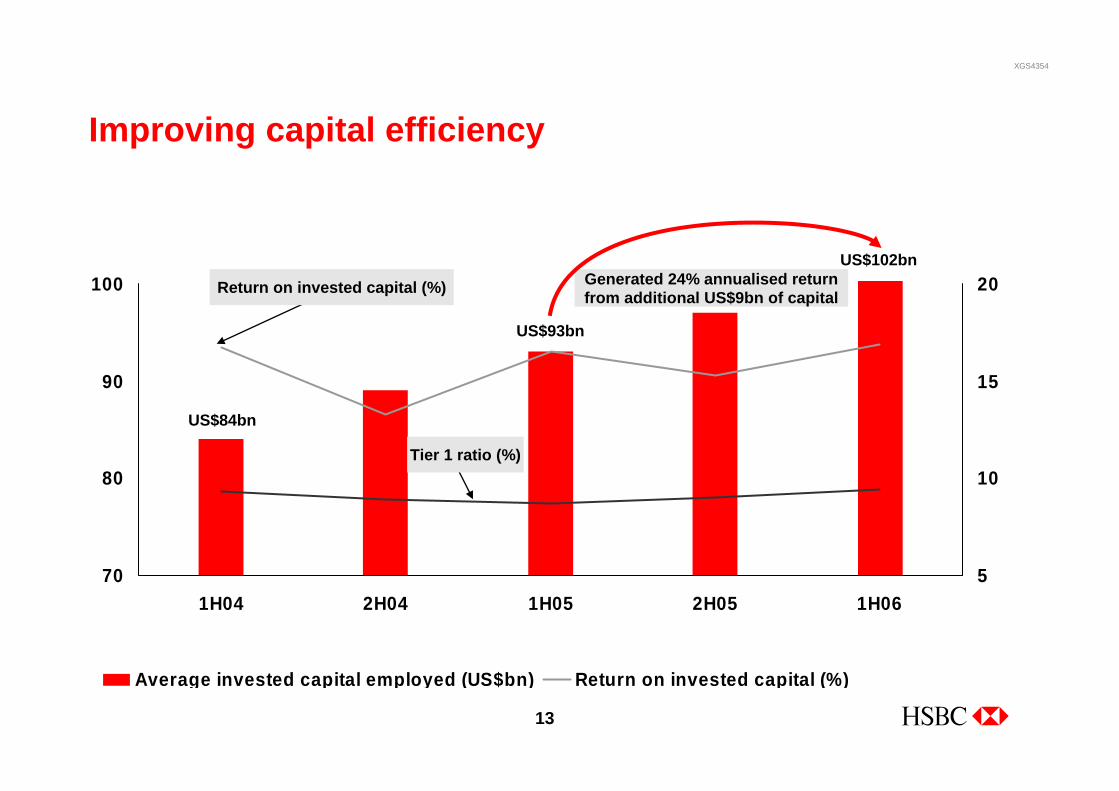
Improving capital efficiency
70
80
90
100
1H04 2H04 1H05 2H05 1H065
10
15
20
Average invested capital employed (US$bn) Return on invested capital (%)
US$102bn
US$84bn
US$93bn
Generated 24% annualised return from additional US$9bn of capital
Tier 1 ratio (%)
Return on invested capital (%)

XGS4354
14
HSBC financial framework
$bn
Tier 1 Capital (as at 31Dec05) 74
Net income attributable to ordinary shareholders (2005) 15
Dividend payout 50 - 60%
Scrip dividend impact 15 - 40% (of dividends)
Available to fund organic growth and acquisitions goodwill 50 - 60% (of net income)

XGS4354
15
HSBC – profit before tax by main country – 2005
United StatesHong KongUnited Kingdom
US$4-5bn
MexicoFranceCanada
US$500m – 1bn
BrazilMainland ChinaSingaporeSwitzerlandMalaysiaUAEIndiaSaudi ArabiaArgentinaTurkeyGermanyBermudaIndonesiaMalta
US$100m – 500m
South KoreaAustraliaThailandTaiwanRep. of IrelandEgypt Qatar
US$50 – 100m
Personal Financial Services
Commercial Banking
Denotes significant acquisition in the last 10 years
ConsumerFinance
Private Banking
Corporate, Invest. Banking
& Markets

XGS4354
16
Longer term the recycling of capital through New York or London will diminish ‘South-North’ and ‘South-South’ investment flows increasingly important
Expected sources of FDI Latin America 2005-06 Expected sources of FDI Asia-Pacific 2005-06
Chinese outward direct investment Most attractive business locations for trans-national corporations 2005-06
Source: UNCTAD FDI Prospects 2005 Source: UNCTAD FDI Prospects 2005
Source: HSBC, CEIC Source: UNCTAD FDI Prospects 2005
0% 10% 20% 30% 40% 50% 60% 70%
US
China
Japan
Australia
India
0%
20%
40%60%
80%
100%
Chi
na
Indi
a
US
Rus
sia
Bra
zil
Mex
ico
Ger
man
y
UK
Thai
land
Can
ada
0
2,000
4,000
6,000
8,000
1991 1993 1995 1997 1999 2001 2003 2005
USDm
0% 10% 20% 30% 40% 50% 60% 70% 80%
US
Spain
Brazil
China
Canada

XGS4354
17
And scale allows us to think long term:Positioning for growth in Mainland China – patient money investment
Date Cost (US$m)
Market value (US$m)
2001 62
2002-5
2004
2004-5
Not listed
Not listed208
1.8bn 4.0bn
5.8bn2.2bn
XGS4354
18
Role of the centre – capital allocation
• Can we get scale?
• Have we comparative advantage and will it last?
• How consumptive of technology resource is it?
• How distracting will it be for existing management?
• How does the market value this business?
• Can we migrate the learning if successful?

XGS4354
19
Investment spend focused on higher growth markets
0
10
20
30
40
50
60
70
80
90
100-40 -30 -20 -10 0 10 20 30 40 50 60 70 80
Revenue growth1
Cos
t effi
cien
cy ra
tio1
48.8%2
12.5%2
Note: Size of circle represents profit contribution(1) Excluding Corporate, Investment Banking and Markets(2) Group average figure, excluding Corporate, Investment Banking and Markets
USUK
HongKong
Mainland ChinaFrance
Argentina Brazil
UAE
India
Mexico
Malaysia
Turkey
Canada
Re-engineer
Harvest
Invest
Grow

XGS4354
20
CIBM cost trends
Total cost growth has slowed
23.8%
12.5%
13.0%
17.2%
5.6%
6.5%
6.0%
0% 5% 10% 15% 20% 25% 30%
1H05 vs 1H04
2H05 vs 2H04
1H06 vs 1H05
2H04 vs 1H04
1H05 vs 2H04
2H05 vs 1H05
1H06 vs 2H05
% Change against comparable period
% Change against trailing half
0
2
4
6
8
10
12
14
16
18
20
2H04 vs 1H04
1H05 vs 2H04
2H05 vs 1H05
1H06 vs 2H05
% change
Jaws are positive
Revenue growth
Cost growth

XGS4354
21
Role of the centre – driving IT efficiencies from scale
Equipment/
tools
standardization
Best practice
and architecture
simplification
Application
consolidation
Geographical
& physical
consolidation
High
Cost savings
Low
Low Risk & difficulty to implement High
• Standardize applications used across the business
• Standardize business processes• Standardize Back office• Globalisation of customer base
• Elimination of excess overheads and fixed costs• Aggregation of demand, leverage economies of scale
• Multiple applications on a single partitioned server• Replace many low end servers with one high-end server• Enable ‘follow the sun’ support
• Advantages of skills transfer and Training• Increased purchasing leverage and Global best pricing

XGS4354
22
Technology
• Our customers are using technology in a transforming way:– 1.5 billion visits to HSBC websites in 2005, +48% on 2004– 25 million registered internet customers, +27% on 2004– High penetration in Commercial Banking with 950k registered internet banking
customers, around 40% of customer base– 271 million online transactions, +37% on 2004– 66% growth in online sales worldwide in 2005
• Constant drive to common architecture– HSBC Universal Banking (“HUB”)– Credit card system (WHIRL)– Bank on the internet - hsbc.com / HSBCnet

XGS4354
23
Role of the centre – examples of leveraging group skills• Mexico
• Internationality of Group key to ensuring success of acquisition– Influx of Group talent– Tightened controls (compliance and internal audit)– Installed new systems (treasury, branches, trade services and credit card)
• Leverage Mexico’s ATM capabilities – location selection, direct sales channel, charity donations
Rolling out the consumer finance model– Marketing skills Asia– Sophisticated analytics Mexico– Scaleable systems Brazil

XGS4354
24
In Global Markets we have rolled out our Asian financing model with great success
• Hub and spoke management complemented by in-country coverage expertise
• Strong local distribution coupled with global emerging markets platform provides optimal execution for issuers
In Latin America
In the Middle East and North Africa
Mandates at bookrunner or equivalent
In Central and Eastern Europe
0
10
20
30
2002 2003 2004 2005
Mandates - Bonds Mandates - Loans
0
10
20
30
40
2002 2003 2004 2005
Mandates - Bonds Mandates - Loans
0
10
20
2002 2003 2004 2005
Mandates - Bonds Mandates - Loans

XGS4354
25
Diversified risk profile
BULL
Investor reactions to HSBC core values
BEAR
• Over-exposed to US consumer • Most diversified by geography, customer segment and risk type
• Consumer finance model transferable

XGS4354
26
Role of the centre – maintaining a consistent risk profileAs a % of average risk-weighted assets
0
1
2
3
4
5
6
7
8
9
10
2001 2002 2003 2004 2005
Credit Charges RevenuesNote: 2001-2003, UK GAAP; 2004-2005 IFRS

XGS4354
27
US residential first mortgages & 2nd lien lending market
Recent trends• Housing market showing signs of slowing. Increased loan impairment charges in 1H06 due to
deteriorating performance in the 2005 vintages within our wholesale/correspondent business• Overall, the first lien mortgage book shows stable credit
(1) Percentages are based on stated portfolio. Certain loans may be included in more than one classification.Interest rate only balances are included in adjustable rate balances.
US residential first mortgages & 2nd lien lending 112 118 126
(US$ billions) 1H05 2H05 1H06
Geographical and composition1 considerations at 30 June, 2006
California 19 14 16
New York 23 5 10
Florida 5 8 7
(%) of portfolio Consumer Overallby State Bank Finance portfolio
Total book (US$bn) 38 89
Adjustable rate 77% 27%
Interest only 24% 7%
Second lien 10% 18%
Composition Bank Consumer Finance

XGS4354
28
Real estate market – key actions
• Risk mitigation programs and efforts are underway including– Enhanced segmentation– Stress testing to evaluate difference scenarios– Enhanced pricing models– Proactively working with customers regarding ARM resets
• Increased collection capacity and enhanced strategies
• Ongoing reassessments of origination metrics impacting second liens and stated income volumes

XGS4354
29
Role of the centre – managing scale and complexity
• Tone from the top
• Collective management
• Rotation of senior management
• Training at all levels
• Reward mechanisms

XGS4354
30
Role of the centre – developing human capital
• Core values underpin corporate culture– Putting the team’s interests ahead of individuals– Individual accountability, aversion to committees and bureaucracy– Speed of decision making– Integrity– Reputation is paramount
• Talent Management
• Diversity and international experience
XGS4354
31
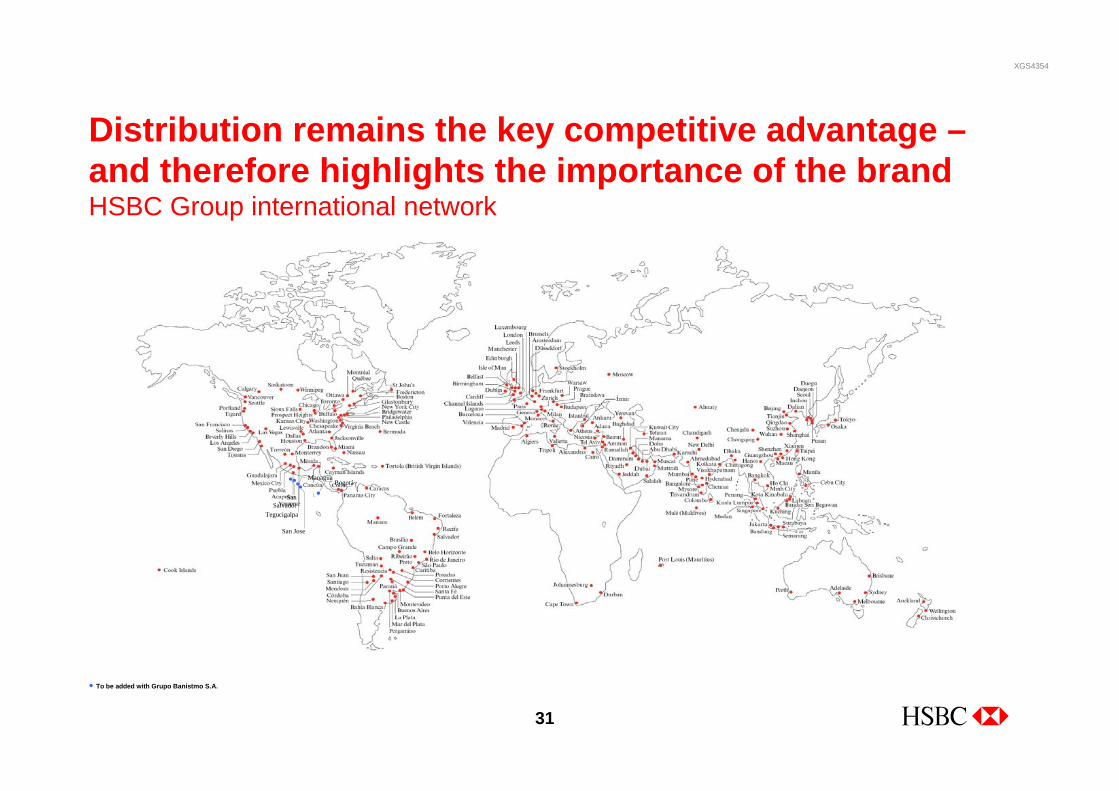
Tegucigalpa
Bogotá
SanSalvador
San Jose
Managua
To be added with Grupo Banistmo S.A.
Distribution remains the key competitive advantage –and therefore highlights the importance of the brandHSBC Group international network

XGS4354
32
HSBC brandMake HSBC one of the world’s leading brands for customer experience and corporate social responsibility
• 1998 Brand identity
• 2002 Brand identity with differentiated positioning
• 2005 Using the Brand for business growth
HSBC now ranked No. 28 by Interbrand(Highest mover in top 40. Absent from top 100 in 2002)
HSBC Amanah
HSBC Direct USA
HSBC France

XGS4354
33
Outlook
• HSBC’s unique international distribution footprint provides the platform for profitable growth
• The Group’s scale and breadth, together with financial strength (Tier 1 capital 9.4 per cent at 30Jun06) provides competitive advantage
• Strong opportunities for organic growth in Asia, Turkey, Mexico, Brazil and the Middle East
• Opportunities to strengthen our position in established franchises in the US, UK, Hong Kong and France
• Growing momentum in Corporate, Investment Banking and Markets

XGS4354
34
Distribution
TechnologyBrand
Customer
Culture
OrganisationDistribution
TechnologyBrand
Customer
Culture
Organisation
Our main focus going forward

XGS4354
35
Tegucigalpa
Bogotá
SanSalvador
San Jose
Managua
To be added with Grupo Banistmo S.A.
In 76 countries and territoriesWith 9,500 offices