hsbc holdings plc 2007 final results – highlights
TRANSCRIPT

– 1 –
HSBC Holdings plc Incorporated in England with limited liability. Registered in England: number 617987. Registered Office and Group Head Office: 8 Canada Square, London E14 5HQ, United Kingdom. Web: www.hsbc.com Stock code: 5 3 March 2008
HSBC HOLDINGS PLC 2007 FINAL RESULTS – HIGHLIGHTS
• Total operating income up 25 per cent to US$87,601 million (US$70,070 million in 2006). For the year: • Net operating income up 13 per cent to US$61,751 million (US$54,793 million in 2006). • Group pre-tax profit up 10 per cent to US$24,212 million (US$22,086 million in 2006). • Profit attributable to shareholders of the parent company up 21 per cent to US$19,133 million
(US$15,789 million in 2006). • Return on average invested capital of 15.3 per cent (14.9 per cent in 2006). • Earnings per share up 17.9 per cent to US$1.65 (US$1.40 in 2006). Dividend and capital position: • Total dividends declared in respect of 2007 of US$0.90 per share, an increase of 11.1 per cent
over 2006; fourth interim dividend for 2007 of US$0.39 per share, an increase of 8.3 per cent. • Tier 1 capital ratio of 9.3 per cent and total capital ratio of 13.6 per cent.

– 2 –
HSBC Holdings plc
________________________________________________________________________________ HSBC HOLDINGS REPORTS PRE-TAX PROFIT OF US$24,212 MILLION HSBC made a profit before tax of US$24,212 million, an increase of US$2,126 million, or 10 per cent, over 2006. Net interest income of US$37,795 million was US$3,309 million, or 10 per cent, higher than 2006. Net operating income before loan impairment charges and other credit risk provisions of US$78,993 million was US$13,627 million, or 21 per cent, higher than 2006. Total operating expenses of US$39,042 million rose by US$5,489 million, or 16 per cent, compared with 2006. HSBC’s cost efficiency ratio was 49.4 per cent compared with 51.3 per cent in 2006. Loan impairment charges and other credit risk provisions were US$17,242 million in 2007, US$6,669 million higher than 2006. The tier 1 capital and total capital ratios for the Group remained strong at 9.3 per cent and 13.6 per cent, respectively, at 31 December 2007. The Group’s total assets at 31 December 2007 were US$2,354 billion, an increase of US$494 billion, or 27 per cent, since 31 December 2006. The consolidated financial statements of HSBC have been prepared in accordance with International Financial Reporting Standards (‘IFRSs’) as endorsed by the EU. EU-endorsed IFRSs may differ from IFRSs as published by the International Accounting Standards Board (‘IASB’) if, at any point in time, new or amended IFRSs have not been endorsed by the EU. At 31 December 2007, there were no unendorsed standards effective for the year ended 31 December 2007 affecting these consolidated financial statements, and there was no difference between IFRSs endorsed by the EU and IFRSs issued by the IASB in terms of their application to HSBC. Accordingly, HSBC’s financial statements for the year ended 31 December 2007 are prepared in accordance with IFRSs as issued by the IASB.

– 3 –
HSBC Holdings plc
________________________________________________________________________________ Geographical distribution of results Profit before tax Year ended 31 December 2007 2006 US$m % US$m %
Europe 8,595 35.5 6,974 31.5 Hong Kong 7,339 30.3 5,182 23.5 Rest of Asia-Pacific 6,009 24.8 3,527 16.0 North America 91 0.4 4,668 21.1 Latin America 2,178 9.0 1,735 7.9
24,212 100.0 22,086 100.0
Tax expense (3,757) (5,215 )
Profit for the year 20,455 16,871
Profit attributable to shareholders of the parent company 19,133 15,789 Profit attributable to minority interests 1,322 1,082 Distribution of results by customer group and global business Profit before tax Year ended 31 December 2007 2006 US$m % US$m %
Personal Financial Services 5,900 24.4 9,457 42.8 Commercial Banking 7,145 29.5 5,997 27.2 Global Banking and Markets 6,121 25.3 5,806 26.3 Private Banking 1,511 6.2 1,214 5.5 Other 3,535 14.6 (388 ) (1.8 )
24,212 100.0 22,086 100.0

– 4 –
HSBC Holdings plc
________________________________________________________________________________ Statement by Stephen Green, Group Chairman
2007 was a year when large parts of the international financial system came under extraordinary strain. For HSBC to achieve another new high in earnings, despite these conditions and the exceptionally weak performance of our US business, underscores the value of the strategic focus we announced early last year to drive sustainable growth by concentrating on the faster growing markets of the world.
Pre-tax profits in 2007 increased by 10 per cent to US$24 billion and earnings per share rose by 18 per cent to US$1.65. Excluding the dilution gains arising from our strategic investments in mainland China, which I highlighted at the interim stage, profits grew by 5 per cent. Consistent with our strategy of focusing on emerging markets where we are the world’s leading international bank, profits from those businesses, excluding dilution gains, grew by 41 per cent to US$15 billion.
Our return on shareholders’ equity exceeded 15 per cent, revenue growth was in double digits for the fifth year running, our cost efficiency ratio improved and our capital ratios remained strong. HSBC’s financial strength in terms of both capital and liquidity is a powerful driver of sustainable growth and helps ensure continued resilience.
Strong operating performance in 2007 We produced exceptionally strong results in Asia-Pacific, Latin America and the Middle East while facing considerable business challenges in North America. In our customer groups, we also achieved record results in Commercial Banking and Private Banking, and a strong performance in Global Banking and Markets, despite write-downs arising from market turbulence in the second half of the year. In addition, Personal Financial Services produced record profits in emerging markets. Within these customer groups, our insurance operations made further progress.
Our North American results continue to be adversely affected by high loan impairment charges as we respond to the impact on our portfolio of credit deterioration arising largely from housing market weakness in the US. The management team has taken vigorous action to address and mitigate the problem. In Europe, excluding the positive effect of movements in the fair value of HSBC’s own debt, performance was broadly in line with 2006. In the UK, Commercial Banking generated pre-tax profits of over US$2 billion for the first time and, in Turkey, further expansion of the branch network helped drive strong organic growth in numbers of personal and business customers.
Financial strength underpins our progressive dividend policy The Directors have declared a fourth interim dividend for 2007 of US$0.39 per ordinary share (in lieu of a final dividend) which, together with the first three interim dividends for 2007 of US$0.17 already paid, will make a total distribution in respect of the year of US$0.90 per share (US$0.81 per share in respect of 2006), an increase of 11.1 per cent. The dividend will be payable on 7 May 2008 with a scrip dividend alternative, to shareholders on the register on 25 March 2008. HSBC's dividend has increased by 10 per cent or more every year for 15 years.
A clear and compelling strategy playing to our strengths At the beginning of 2007, we refreshed our strategy, considering how we should shape HSBC for the future. Our deliberations were influenced by some fundamental long-term trends that will shape tomorrow’s world: emerging markets will continue to grow faster than mature ones; world trade

– 5 –
HSBC Holdings plc
________________________________________________________________________________ will continue to grow faster than world output; and people are living longer than ever before with all the implications that has for long-term savings and pensions.
Our thinking was also informed by a clear appreciation of HSBC’s strengths. We believe that the global leadership we have built in emerging markets and in trade, and our international perspective are compelling advantages that set HSBC apart for our customers, our shareholders and our people.
As we explained in March 2007, our conclusion was that the Group should place renewed emphasis on investing in fast moving emerging markets in Asia-Pacific, the Middle East and Latin America. We believe we can grow strongly and sustainably. We achieved our position as the number one international bank in Asia-Pacific and the Middle East over many years; by contrast, we have built one of Latin America’s largest financial services businesses in little more than a decade.
In mature markets, we are determined to focus our businesses on areas where we can build on our unique global franchise, so as to benefit from the long-term trend of increasing international connectivity. We have international customer bases across many of our businesses, from the largest corporates, through to small or medium-sized enterprises, to the internationally mobile mass affluent and other personal customers with specific international requirements. We have developed a clear approach which is enabling our business to focus strongly on these groups of customers now and in the years ahead.
Where opportunities arise, we shall seek to redeploy capital towards emerging markets through divestment of assets of greater strategic value to others. In France, we have received a firm cash offer of US$3.1 billion for our seven, separately branded, regional banks and have entered into exclusive discussions. This potential transaction, which is subject to necessary approvals and consultation, could complete in mid-2008. We remain committed to France through our HSBC-branded network serving retail and commercial customers and through our activities in Global Banking and Markets, Private Banking, asset management and insurance. During 2007, we acquired the 50 per cent of Erisa, our French insurance business, which we did not own.
We will also build businesses, in both our emerging and mature markets, that help our customers with their long-term savings needs, as demographics and wealth creation trends around the world make this ever more important to them.
Finally, we will shape our business operations so that we use our scale to deliver better, more efficient services to our customers. Their use of technology increasingly dictates how they interact with us. We increasingly employ technology to create better products which we can deliver globally at lower cost. As we grow our direct banking business, we will create opportunities to meet more of our customers’ financial needs.
Building on our position as the world’s leading international emerging markets bank During 2007, we continued to build our businesses in emerging markets organically. For example, on a like-for-like basis, risk-weighted assets in these areas grew by 42 per cent compared with 16 per cent for the Group as a whole.
As the leading international bank in the country of our birth, China, we were delighted to be among the first to incorporate locally in the mainland. We have built the largest branch network of any international bank and we have significant and profitable strategic investments in our Chinese associates.

– 6 –
HSBC Holdings plc
________________________________________________________________________________
In mainland China, through our own businesses and in conjunction with our associates, we achieved for the first time in our history a profit before tax of over US$1 billion, in addition to over US$7 billion generated in Hong Kong.
As China continues to reshape itself as a 21st century powerhouse, HSBC seeks to play a constructive role in its continued progressive economic and social development. We were the first international bank to establish and open a rural bank. Hang Seng Bank has agreed to acquire 20 per cent of Yantai City Commercial Bank in the fast growing Bohai region of China.
Elsewhere in Asia-Pacific, we have sought to further strengthen our position through a series of investments in faster-growing economies. In South Korea, we have agreed to acquire 51 per cent of Korea Exchange Bank for US$6.5 billion, subject to regulatory approvals. In Taiwan, we acquired Chailease Credit Services, a factoring company serving commercial customers, and agreed to acquire the assets, liabilities and operations of The Chinese Bank, which will extend our network by 39 branches and bring us many new customers.
As foreign investment rules are eased, we have made significant investments to expand our business in Vietnam with the acquisition of a further 5 per cent interest in Techcombank, bringing our stake to 15 per cent, and the purchase for some US$255 million of a 10 per cent interest in Bao Viet, the leading insurance company in the country.
The latter investment reflects our determination to increase the contribution of insurance to Group earnings. We also entered into agreements to invest in a 26 per cent interest in a new life insurance joint venture in India, in partnership with two of the larger state-owned banks, and to acquire just under 50 per cent of Hana Life Insurance Company in South Korea. We have entered a number of strategic alliances to ensure that we have the best products for our customers and the support to grow our activities.
A fifth consecutive year of rising oil prices facilitated growth in public and private investment in the Middle East. As a result, infrastructure development accelerated and consumption and employment rose. Our businesses in the Middle East were well positioned to benefit from this and have had an excellent year.
Our acquisition of Grupo Banistmo in Central America and Banco Nazionale in Argentina in 2006 strengthened our existing business. 2007 has been a year of integrating these operations. It is a testimony to the strength of our Latin American businesses that we have been able to grow profits by 26 per cent to over US$2 billion while investing in the integration and despite the increase in loan impairment charges in Mexico as our loan portfolio began to mature.
A people business It is people, of course, who define an organisation; and any business’s success is dependent on the calibre of its staff. 2007 was a demanding year in many respects and it is testament to the talent and professionalism of my 330,000 colleagues around the world that HSBC successfully met its challenges and excelled in so many areas. I would like to take this opportunity to extend my personal thanks to my colleagues – their commitment and expertise have greatly benefited the Group and our shareholders.
Measuring the results of our strategy Today we are publishing, for the first time, the key metrics which we will use to measure our performance in future. These include a number of measures that cover financial performance, customer recommendation and employee engagement.
– 7 –
HSBC Holdings plc
________________________________________________________________________________
In financial terms we are aiming for a return on equity in a range over the investment cycle of 15-19 per cent; a cost efficiency ratio in the range of 48-52 per cent; Tier 1 capital under the Basel II framework of 7.5-9.0 per cent; and total shareholder return in the top half of that achieved by our peers.
Financial measures are important but not sufficient: it is our people and our relationship with customers that will drive our business and ultimately determine our success. For the first time, in 2007, 290,000 HSBC colleagues completed our new global people survey, allowing us to benchmark ourselves and, over time, raise our game. Similarly, we have established customer engagement metrics which enable us to measure and improve our service to them. We have set ourselves challenging targets to increase both employee and customer engagement. They will help us build on our position as the world’s number one global banking brand.
Changes to your Board Independent oversight of our company and of the execution of strategy is the responsibility of one of the most experienced and international Boards in the world. I am delighted that we will benefit from international business leaders of the calibre of José Luis Durán and Sam Laidlaw, who joined the Board as independent non-executive Directors on 1 January, 2008. We also welcome two other global business leaders, Safra Catz and Narayana Murthy, who will join as independent non-executive Directors on 1 May 2008.
The Board will be further strengthened by the appointment of three executive directors: Vincent Cheng, effective 1 February 2008; and Sandy Flockhart and Stuart Gulliver, who will join the Board, effective 1 May 2008. These are three of our most talented and experienced executives - all emerging market specialists.
Baroness Dunn, Sir Brian Moffat and Lord Butler will retire as non-executive Directors at HSBC’s Annual General Meeting on 30 May 2008 and will not seek re-election. I would like to pay tribute to their tremendous contribution to HSBC. We have been privileged to enjoy their counsel and stewardship for so many years.
HSBC’s core strength in uncertain times
The outlook for the rest of 2008 is uncertain. The economic slowdown and the credit outlook in the US may well get worse before they get better. With significant parts of the international financial system in developed markets still in difficulty, HSBC’s emphasis on faster growing emerging markets means that we are better positioned than many of our competitors.
Emerging markets have only partly decoupled from the US. Hence, while these economies are exhibiting more domestic momentum, they will not be entirely immune from the impact of a US slowdown. However, the major long-term trends are still intact. Emerging markets will continue to outperform mature economies; and world growth, even in this year of relative weakness for the US economy, will be reasonable – albeit slower than in 2007. Meanwhile, trade and investment patterns will continue to evolve to reflect a more interconnected world, notwithstanding some signs of protectionist sentiment in several key mature markets. In particular, we will see further strategic investments from emerging markets into mature markets, as well as into other emerging markets, a trend from which we are well placed to benefit.
2008 is likely to be a year of caution in the financial sector until liquidity, transparency and the proper pricing of risk return to financial markets. We expect to be able to improve margins on the use of our capital and we will continue to invest in building market presence at a time when others with weaker capital positions are constrained.

– 8 –
HSBC Holdings plc
________________________________________________________________________________
The fundamentals of HSBC are very strong. The deleveraging of the financial system clearly plays to HSBC’s strengths, given our conservative balance sheet and international presence. There can be few banks in the world that are better positioned to withstand market turbulence and grasp strategic opportunities. We will continue to focus HSBC on the parts of the global economy that promise the best prospects for higher growth over the long term. We will continue to invest for profitable growth in line with our strategy, and we will do so while maintaining HSBC’s financial strength, which is at the heart of our success.
S K Green, Group Chairman 3 March 2008

– 9 –
HSBC Holdings plc
________________________________________________________________________________ Review by Michael Geoghegan, Group Chief Executive Officer Robust performance in a challenging year The Group Chairman’s statement sets out the clear and compelling strategy for HSBC, and one which very much plays to our strengths. It is my job to lead the senior management team in executing that strategy. 2007 was a year in which we made significant progress in shaping and building our existing businesses for the future, while managing through the particular challenges arising in global financial markets. Our profits of US$24 billion demonstrate the resilience of our business model which, notwithstanding the continuing disappointing results from our US operations, generated a broad spread of earnings by customer group – Commercial Banking (30 per cent), Personal Financial Services (24 per cent), Global Banking and Markets (25 per cent), Private Banking (6 per cent) and others (15 per cent).
We are well-diversified by geography, with a broad spread of earnings coming from developing markets in Asia-Pacific, Middle East, and Latin America and from mature markets in Europe and North America. Our investment approach is a balance between growing our physical presence with investing to increase efficiency in our existing operations. In support of our strategy to increase earnings from developing markets, we continued to invest significantly in existing businesses where we saw opportunities to grow, for instance with new branch programmes in mainland China, Turkey, Indonesia and India. In developed markets, we invested in technology-led initiatives to grow in our targeted customer segments. Our business highlights and results show that we had successes in both developed and developing markets in 2007. Our investments in 2008 will be consistent with our strategy.
Taking each of our customer groups and businesses in turn:
Delivering a global and technology-driven offering to our Commercial Banking clients Commercial Banking had another strong year with a profit before tax of US$7.1 billion, an increase of 19 per cent over 2006. This growth was powered by very strong results in Asia-Pacific, the Middle East, and Latin America. As a result, the proportion of Commercial Banking’s profits arising in faster-growing economies increased from 47 per cent in 2006 to 52 per cent in 2007.
Our focus is twofold: to be the world’s leading international business bank and working to become the best bank for small businesses in target markets. This is supported by our continued investment in both technology and people. HSBC’s technology and global network are key to our position as the leading international business bank.
In 2007, we extended our network of International Banking Centres – which help customers expand their international businesses – across a further 38 countries, bringing the total to 54. These services are now available to 99 per cent of HSBC’s commercial customers. Our Global Links referral system is now available to Relationship Managers in 63 countries. We launched our new SmartForms initiative in 16 countries, making cross-border account opening easier for our customers.
We experienced strong growth in our payments and cash management, and trade and supply chain businesses, with income growth of 18 per cent, and in receivables financing, where we increased the number of operating countries from 12 to 19. Cross-sales of Global Markets’ foreign exchange products also grew very strongly, particularly in emerging markets.

– 10 –
HSBC Holdings plc
________________________________________________________________________________ HSBC delivered technology-led banking for business, winning awards in both Hong Kong and the UK for Business Internet Banking. Almost a quarter of new customers in the UK came to us through our Business Direct proposition. We invested to expand our receivables financing and business cards platforms, and continue to grow by building on existing relationships – over 50 per cent of new customers in the first half of 2007 in key markets had existing Personal Financial Services relationships.
In total, our Commercial Banking customer base grew by 8 per cent to 2.8 million in 2007, with particular growth in small businesses in Hong Kong, UK and Turkey, where we have been investing.
Consumer Finance challenges offset Personal Financial Services growth Our Personal Financial Services business achieved profit before tax of US$5.9 billion, a decline of 38 per cent from 2006. This was largely driven by exposure in the US. However, we experienced strong Asian and Latin American growth by 48 per cent and 12 per cent, respectively. Excluding US consumer finance, profit before tax in our Personal Financial Services business grew by 18 per cent.
Elsewhere, we have had success with three key offerings where our global scale gives us real competitive advantage.
First, we have seen solid growth in the market-leading HSBC Premier offering. Premier is designed for mass-affluent customers who are often internationally mobile. In 2007, we had a very successful international re-launch of HSBC Premier that incorporated a number of truly global, joined-up features. These included worldwide customer recognition, a single emergency help line, a unified view of all accounts, and a single worldwide Premier brand. We added a net 340,000 new Premier customers of which more than 50 per cent were new to the bank, for a total of over 2.1 million. Premier customers represent a valuable client base, each averaging over US$2,000 of revenue annually. We will continue to expand Premier in target markets in 2008, with a focus on wealth management, which has already worked so successfully in Hong Kong. We believe that we can increase our Premier customer base to six million over the next four years.
Second, our global card platform, One HSBC Cards, continues to grow, with a specific focus on developing markets. With three quarters of cards in force on a single platform, we can use scale to reduce costs. In 2007, we launched new card businesses in Vietnam and Pakistan, while growing in other markets, including India and the United Arab Emirates. With over 120 million cards in force, including those with Bank of Communications in China, 26 per cent are now in developing markets, up from 20 per cent in 2006.
Third, we continue to grow our HSBC Direct business. In 2007, US deposits reached US$11.5 billion with 620,000 customers, and Asian deposits reached US$1.2 billion with more than 240,000 customers in Taiwan and South Korea. HSBC Direct most recently launched in Canada in June 2007, with an enhanced local online savings account. 45,000 customers, three quarters of whom were new to HSBC, had deposited over US$800 million by the end of the year. We are putting the entire HSBC Direct offering onto a common transaction platform and intend entering new markets in 2008.

– 11 –
HSBC Holdings plc
________________________________________________________________________________ Repositioning in the US consumer finance market We continue to face challenges as a result of the deterioration of the US housing market; loan impairment charges and other credit risk provisions rose by 79 per cent to US$11.7 billion in our Personal Financial Services business. We were one of the first to highlight the problem and we have actively managed our business to mitigate our position. Our actions have shown our commitment to deal responsibly and resolutely with the issues. We will continue to manage this business so as to preserve the long-term value of our consumer finance platform, which we will use to grow profitable businesses in developing markets.
Our US-based consumer finance business comprises four key portfolios: mortgages, credit cards, vehicle finance and other personal loans. In 2007, we saw a progressive decline in profitability across all portfolios, as the housing market suffered from slower appreciation (and, in some markets, depreciation) and unemployment increased. While we have a geographically diverse book, with no single area over-represented across our key portfolios, most markets are experiencing some decline in credit quality. However, those states in which house prices have declined are experiencing a faster deterioration in delinquency levels.
In our mortgage business, we have a retail branch-based origination channel and a wholesale portfolio, mortgage services, which is running off. This higher risk mortgage services portfolio has been reduced from US$49.5 billion to US$36.2 billion in the last 12 months. In the second half of 2007, we also began to see deterioration in the performance of our retail branch-based consumer lending portfolio as credit availability through equity withdrawal was no longer available to deal with unforeseen financial needs.
We have taken vigorous action to position our business for the current environment. We have discontinued mortgage services correspondent and broker originations. We have restructured our retail operations in the US closing about 400 branches and leaving a network of approximately 1,000. We have tightened our lending criteria, tailored our credit appetite in specific geographies, reduced product offerings and eliminated the small volume of adjustable-rate mortgage products we offered. We have also strengthened our risk management and controls. We shall continue to develop strategic responses to changes in market conditions.
We continue to work responsibly with customers, governments and community leaders to implement loan modifications and foreclosure avoidance programmes. We have improved our collections programme so that we can work to help our customers. In 2007, we modified more than 8,500 loans with an aggregate balance of US$1.4 billion in 2007.
In 2007, we took the decision to integrate retail and credit card services to provide a single management structure. In 2007, we saw a rise in overall delinquency rates among credit card customers, in part due to a change in product mix and historically low levels of bankruptcies in 2006. We modified fee practices in our cards portfolio, which reduced income by approximately US$55 million in 2007, and is expected to have a full year effect of approximately US$250 million in 2008. In addition, to improve the profitability of the credit card business in the long term, we slowed loan and account growth by decreasing credit lines and tightening the criteria for authorising initial credit lines.
Overall delinquency rates in vehicle finance also rose as the US economy weakened. We are taking steps to improve the profitability of new originations and have already seen reduced volume from the dealer channel. We expect this lower origination activity to continue in 2008 as we seek higher credit quality.

– 12 –
HSBC Holdings plc ________________________________________________________________________________ Our continued focus for 2008 is on strengthening the HSBC Finance business, paying particular attention to the core consumer lending and cards businesses in order to preserve the long term value of the platform. We will continue to evaluate our product set and make adjustments in product type and qualification criteria, consistent with our desired risk profile. We will position the business so that when the environment improves we will be well positioned, particularly as many players have exited the market.
Strong Global Banking and Markets performance Despite severe disruption in global credit markets, pre-tax profits for Global Banking and Markets rose by 5 per cent to US$6.1 billion. Performance was driven by strong revenue growth in equities, foreign exchange, securities services, payments and cash management, and asset management.
In 2007, we absorbed a total of US$2.1 billion of write-downs on asset-backed securities and credit trading positions, leveraged and acquisition financing positions, and monoline credit exposures resulting from unprecedented disruption and deterioration in the credit markets. In North America, the mortgage-backed securities operation was closed to new business and downsized.
Strong growth from Asia-Pacific and the Middle East contributed over half of Global Banking and Markets’ 2007 pre-tax profits. Our outstanding performance in Asia reflected continued success in providing our clients with financing, structuring and hedging solutions. We maintained a solid position in mature markets as well, with robust financing and advisory revenues in Europe and strong growth in Global Banking deposits and fee income.
The strength of Global Banking and Markets’ emerging markets-led and financing-focused strategy was illustrated by HSBC’s senior role in large, cross-border transactions. We advised Borse Dubai on its acquisition of OMX of Sweden and related share exchange agreement with Nasdaq. HSBC was lead arranger of US$9.2 billion of facilities for Saudi Basic Industries’ acquisition of GE Plastics. In early 2008 HSBC was mandated as financial adviser and lead arranger to BHP Billiton on its US$174 billion offer for Rio Tinto, the largest mining sector deal announced to date. HSBC also advised on high-profile cross-border transactions that illustrated the growing linkages between emerging markets regions, including Singapore Telecommunications on its US$758 million acquisition of a 30 per cent stake in Warid Telecom of Pakistan, and Dubai Drydocks' S$650 million acquisition of Pan-United Marine of Singapore.
HSBC won numerous industry awards for its emerging markets and financing strength. These included Acquisitions Monthly’s ‘Middle East Mergers and Acquisitions Adviser of the Year’ and International Financing Review’s ‘Middle East Loan House of the Year’.
HSBC was designated global ‘Best Risk Management House’, ‘Best Foreign Exchange House in Asia’ and, for the 10th consecutive year, ‘Best Risk Management House in Asia’ in the Euromoney 2007 Awards for Excellence. HSBC was named in five of LatinFinance’s Deals of the Year, including ‘Best Syndicated Loan’, ‘Best Financing Innovation’, and ‘Best Local Currency Deal’. In debt capital markets, HSBC ranked first in the Bloomberg Asian local currency bond league table, first in sterling bonds and fifth in international bonds.

– 13 –
HSBC Holdings plc
________________________________________________________________________________ Global Banking and Markets continued to refine its IT development strategy, delivering a cost-effective system platform to support HSBC’s global product reach. Barracuda is our award-winning, front-end trading system that enhances straight through processing, by automating trade bookings and back-to-back trades. Barracuda has processed over one million trades and 240 million transactions since its launch and won the 2007 Banking Technology award for ‘Best Trading System in Europe’ and the 2007 American Financial Technology award for ‘Best Cross-Asset Trading System in the US’.
Using Group relationships to grow our Private Bank In Private Banking, our fastest growing business, profit before tax increased by 24 per cent over 2006 to US$1.5 billion, with exceptional performance in Asia and record results in Switzerland, among others. HSBC Private Bank retained its number three ranking in the Euromoney Annual Private Banking Survey which covers excellence across its business model, client segment, geography, product focus and consistency of investments in growth.
Our ability to match developed market expertise with developing market insights helped generate US$36 billion in net new client assets. Of that, US$6 billion was directly referred from other HSBC customer groups. As a result, client assets grew by 26 per cent to US$421 billion. We saw a sharp increase in client demand for alternative assets and emerging market investments, aided by the growth in our hedge funds, and several new private equity and emerging market funds. These included new private client offerings in mainland China and Latin America. Our Global Wealth Solutions business, providing trust and family office services, also benefited from relatively buoyant markets with client assets increasing by 38 per cent to US$79 billion.
Building our insurance business Our insurance business is spread across our customer groups and in 2007 generated profit before tax of US$3.1 billion, a contribution of 13 per cent of the Group pre-tax profit. We believe there is an opportunity to increase insurance’s contribution to the Group to 20 per cent over time.
Insurance is now an integral part of the new Global Premier proposition and we are using the world-class Future of Retirement research we commissioned to design innovative new products and services.
We launched HSBC’s first environmentally friendly motor and house insurance in Brazil and, in Mexico, we developed an innovative new motor insurance product. We consolidated our position in Hong Kong as the leading provider of Mandatory Provident Funds, with a 33 per cent share of funds under management. In France, sales of life-wrapped investment products increased by 9 per cent. In Saudi Arabia, a joint venture with SABB established a Takaful business. In the UK, M&S Money was voted ‘Life Insurance Provider of the Year’ and, due to the success of the Sterling Reserve Bond, HSBC Life in the UK is becoming one of the market’s leading providers of life investment products. In 2007, we launched credit protection products and product enhancements in 12 new markets.
Our new insurance brand, HSBC Insurance, which was launched in 2007, will increase customer awareness of our growing insurance capability.
– 14 –
HSBC Holdings plc
________________________________________________________________________________ To meet growing customer demand for insurance products, we are strengthening our underwriting, broking and agency businesses with proposed strategic investments in mainland China, India, South Korea and Vietnam. To complement growth in our own businesses, we launched a Preferred Strategic Partner programme to provide products in markets where we decide not to manufacture.
Customer access to products has been made easier and more efficient through direct distribution channels and, in 2007, we sold 2.9 million policies over the telephone, online and through other direct channels.
Strong liquidity and capital strength HSBC has maintained its traditional financial strength in terms of capital, liquidity and breadth of earnings. This is reflected in the Group's tier 1 capital ratio of 9.3 per cent and total capital ratio of 13.6 per cent as at the year end compared with 9.4 per cent and 13.5 per cent, respectively, at the end of 2006. Our strong capital position provides comfort for customers placing deposits with HSBC, and attracts institutional balances, which means that we benefit from a strong and well diversified funding base. It also means that we are well-positioned to fund our growth plans and selectively to take advantage of opportunities at a time when many others are unable to do so.
Since volatility in the financial markets began in August 2007, there has been a movement of deposits to well-capitalised financial institutions such as HSBC.
Joining Up the Company The results announced today are a reflection of the rolling out of our ‘Joining Up the Company’ strategy. Put simply, ‘Joining Up’ is about using common products and common systems to deliver an increasingly cohesive service to our customers. This is more than business as usual: HSBC is transforming its business through this strategy, be it the relaunch of Premier in 35 countries, the rollout of Global Links for Commercial Banking, the move to the One HSBC suite of Group Systems or the consolidation of our banking systems to HSBC’s Universal Banking system.
‘Joined Up’ resonates with our customers and our staff, and demonstrating its impact will add value to our shareholders. Our brand recognition is rising in line with our progress: in February 2008, The Banker Magazine named HSBC as the world's most valuable banking brand. This follows Interbrand's 2007 ranking of HSBC's brand as the 23rd most valuable in the world, up from 27th in 2006.
As our brand value increases, so we must ensure we deliver our global brand promise to our customers and employees through continued investment in Joining Up. For example, we shall continue to launch Premier in our target markets. We shall significantly grow our Global Transaction Banking business, continuing our investment in global talent, infrastructure expansion and product development. Our success in developing HSBC Amanah was recognised by the Euromoney award for ‘Best International Islamic Bank’.
We are also connecting the Group by moving to a common HR platform, continuing our common Group-wide employee engagement surveys, and aligning objectives, performance and pay globally. Our people will always be our most important asset. The 330,000 people who work for HSBC across the world demonstrate the shared values, the strength and the resilience of the HSBC Group which will sustain our business in the long term. I would like to record my strong appreciation and thanks for their energy and commitment to our business throughout 2007.

– 15 –
HSBC Holdings plc
________________________________________________________________________________ We will continue to measure and report on our progress on key financial, customer and employee metrics, available in our Annual Report and Accounts.
Our strategy gives us a clear roadmap for progress. It highlights the competitive advantages in each of our customer groups, our emerging markets strength and our international connectivity which so benefits our customers. We will continue to build on our strengths and position HSBC for future growth. M F Geoghegan, Group Chief Executive 3 March 2008
– 16 –
HSBC Holdings plc
Financial Overview
________________________________________________________________________________ Year ended 31 December Year ended 31 December
2007 2007 2006£m HK$m US$m US$m
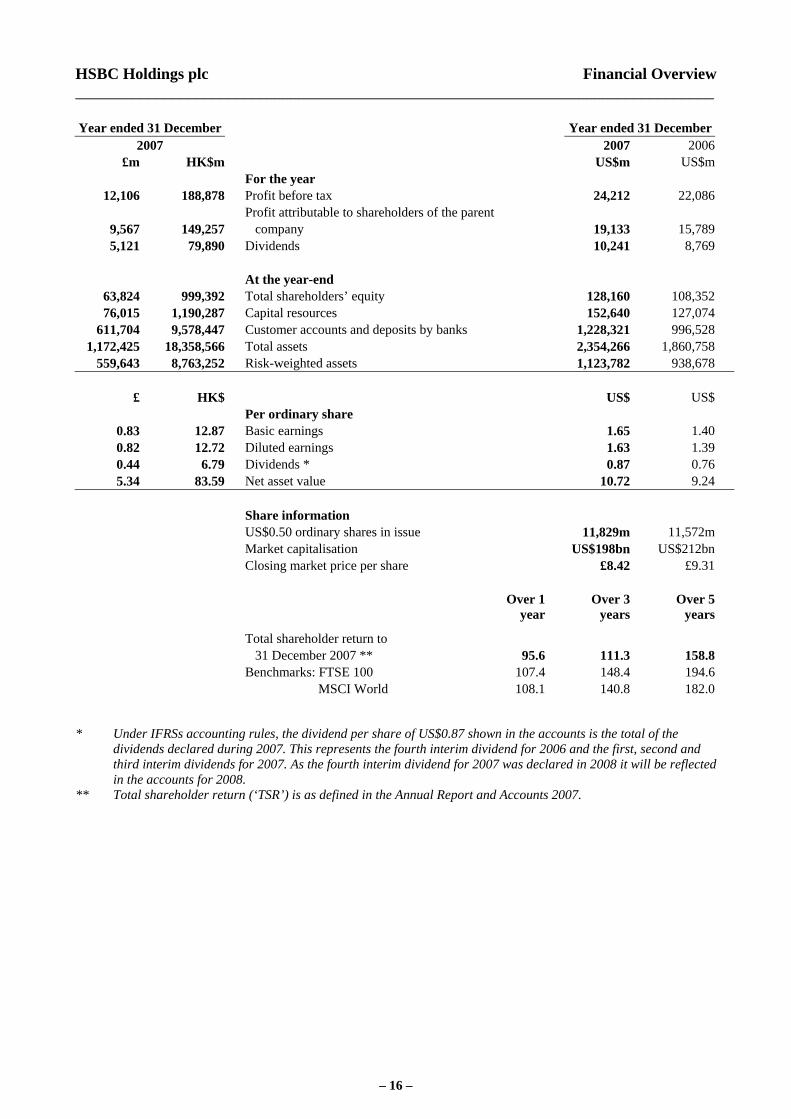
For the year 12,106 188,878 Profit before tax 24,212 22,086 Profit attributable to shareholders of the parent 9,567 149,257 company 19,133 15,7895,121 79,890 Dividends 10,241 8,769
At the year-end
63,824 999,392 Total shareholders’ equity 128,160 108,35276,015 1,190,287 Capital resources 152,640 127,074
611,704 9,578,447 Customer accounts and deposits by banks 1,228,321 996,5281,172,425 18,358,566 Total assets 2,354,266 1,860,758
559,643 8,763,252 Risk-weighted assets 1,123,782 938,678
£ HK$ US$ US$ Per ordinary share
0.83 12.87 Basic earnings 1.65 1.400.82 12.72 Diluted earnings 1.63 1.390.44 6.79 Dividends * 0.87 0.765.34 83.59 Net asset value 10.72 9.24
Share information US$0.50 ordinary shares in issue 11,829m 11,572m Market capitalisation US$198bn US$212bn Closing market price per share £8.42 £9.31 Over 1
year Over 3
years Over 5
years
Total shareholder return to 31 December 2007 ** 95.6 111.3 158.8 Benchmarks: FTSE 100 107.4 148.4 194.6 MSCI World 108.1 140.8 182.0
* Under IFRSs accounting rules, the dividend per share of US$0.87 shown in the accounts is the total of the
dividends declared during 2007. This represents the fourth interim dividend for 2006 and the first, second and third interim dividends for 2007. As the fourth interim dividend for 2007 was declared in 2008 it will be reflected in the accounts for 2008.
** Total shareholder return (‘TSR’) is as defined in the Annual Report and Accounts 2007.

– 17 –
HSBC Holdings plc
Financial Overview
(continued)________________________________________________________________________________ Year ended 31 December 2007 2006 % %Performance ratios
Return on average invested capital 15.3 14.9Return on average total shareholders’ equity 15.9 15.7Post-tax return on average total assets 0.97 1.00Post-tax return on average risk-weighted assets 1.95 1.93 Efficiency and revenue mix ratios Cost efficiency ratio 49.4 51.3 As a percentage of total operating income: - net interest income 43.1 49.2- net fee income 25.1 24.5- net trading income 11.2 11.7 Capital ratios - Tier 1 capital 9.3 9.4- Total capital 13.6 13.5
Return on invested capital is based on the profit attributable to ordinary shareholders. Average invested capital is measured as average total shareholders’ equity after adding back goodwill previously written-off directly to reserves, deducting average equity preference shares issued by HSBC Holdings and deducting/(adding) average reserves for unrealised gains/(losses) on effective cash flow hedges and available-for-sale securities. This measure reflects capital initially invested and subsequent profit.

– 18 –
HSBC Holdings plc
Consolidated Income Statement
________________________________________________________________________________ Year ended 31 December Year ended 31 December
2007 2007 2006 £m HK$m US$m US$m
46,180 720,493 Interest income 92,359 75,879 (27,282 ) (425,654 ) Interest expense (54,564 ) (41,393)
18,898 294,839 Net interest income 37,795 34,486
13,169 205,455 Fee income 26,337 21,080 (2,168 ) (33,817 ) Fee expense (4,335 ) (3,898)
11,001 171,638 Net fee income 22,002 17,182
2,229 34,777 Trading income excluding net interest income 4,458 5,619 2,688 41,938 Net interest income on trading activities 5,376 2,603
4,917 76,715 Net trading income 9,834 8,222
Net income from financial instruments designated at fair 2,042 31,851 value 4,083 657
978 15,259 Gains less losses from financial investments 1,956 969 546 8,519 Gains arising from dilution of interests in associates 1,092 – 162 2,528 Dividend income 324 340
4,538 70,802 Net earned insurance premiums 9,076 5,668 719 11,224 Other operating income 1,439 2,546
43,801 683,375 Total operating income 87,601 70,070
Net insurance claims incurred and movement in (4,304 ) (67,151 ) liabilities to policyholders (8,608 ) (4,704)
Net operating income before loan impairment charges 39,497 616,224 and other credit risk provisions 78,993 65,366 (8,621 ) (134,504 ) Loan impairment charges and other credit risk provisions (17,242 ) (10,573)
30,876 481,720 Net operating income 61,751 54,793
(10,667 ) (166,427 ) Employee compensation and benefits (21,334 ) (18,500) (7,647 ) (119,308 ) General and administrative expenses (15,294 ) (12,823)
Depreciation and impairment of property, plant and (857 ) (13,371 ) equipment (1,714 ) (1,514) (350 ) (5,461 ) Amortisation and impairment of intangible assets (700 ) (716)
(19,521 ) (304,567 ) Total operating expenses (39,042 ) (33,553)
11,355 177,153 Operating profit 22,709 21,240
751 11,725 Share of profit in associates and joint ventures 1,503 846
12,106 188,878 Profit before tax 24,212 22,086
(1,878 ) (29,309 ) Tax expense (3,757 ) (5,215)
10,228 159,569 Profit for the year 20,455 16,871
Profit attributable to shareholders of the parent 9,567 149,257 company 19,133 15,789
661 10,312 Profit attributable to minority interests 1,322 1,082

– 19 –
HSBC Holdings plc
Consolidated Balance Sheet
________________________________________________________________________________
At 31 December At 31 December 2007 2007 2006
£m HK$m US$m US$m
ASSETS
10,839 169,723 Cash and balances at central banks 21,765 12,732 4,869 76,241 Items in the course of collection from other banks 9,777 14,144 6,919 108,339 Hong Kong Government certificates of indebtedness 13,893 13,165
222,092 3,477,658 Trading assets 445,968 328,147 20,699 324,116 Financial assets designated at fair value 41,564 20,573 93,551 1,464,885 Derivatives 187,854 103,702
118,208 1,850,980 Loans and advances to banks 237,366 185,205 488,811 7,654,111 Loans and advances to customers 981,548 868,133 140,934 2,206,834 Financial investments 283,000 204,806
5,171 80,974 Interests in associates and joint ventures 10,384 8,396 19,765 309,495 Goodwill and intangible assets 39,689 37,335 7,816 122,382 Property, plant and equipment 15,694 16,424
19,668 307,969 Other assets 39,493 29,823 446 6,984 Current tax asset 896 380
2,632 41,205 Deferred tax asset 5,284 3,241 10,005 156,670 Prepayments and accrued income 20,091 14,552
1,172,425 18,358,566 Total assets 2,354,266 1,860,758

– 20 –
HSBC Holdings plc
Consolidated Balance Sheet
(continued)________________________________________________________________________________
At 31 December At 31 December 2007 2007 2006
£m HK$m US$m US$m
LIABILITIES AND EQUITY
Liabilities 6,919 108,338 Hong Kong currency notes in circulation 13,893 13,165
65,826 1,030,747 Deposits by banks 132,181 99,694 545,878 8,547,700 Customer accounts 1,096,140 896,834
4,319 67,624 Items in the course of transmission to other banks 8,672 12,625 156,661 2,453,095 Trading liabilities 314,580 226,608
44,790 701,344 Financial liabilities designated at fair value 89,939 70,211 91,330 1,430,099 Derivatives 183,393 101,478
122,796 1,922,823 Debt securities in issue 246,579 230,325 1,441 22,560 Retirement benefit liabilities 2,893 5,555
17,436 273,031 Other liabilities 35,013 28,019 1,274 19,955 Current tax liability 2,559 1,805
21,218 332,242 Liabilities under insurance contracts 42,606 17,670 10,839 169,731 Accruals and deferred income 21,766 16,310
975 15,268 Provisions 1,958 1,763 926 14,496 Deferred tax liability 1,859 1,096
12,360 193,539 Subordinated liabilities 24,819 22,672
1,104,988 17,302,592 Total liabilities 2,218,850 1,745,830 Equity
2,946 46,125 Called up share capital 5,915 5,786 4,051 63,429 Share premium account 8,134 7,789
16,441 257,443 Other reserves 33,014 29,380 40,386 632,395 Retained earnings 81,097 65,397
63,824 999,392 Total shareholders’ equity 128,160 108,352 3,613 56,582 Minority interests 7,256 6,576
67,437 1,055,974 Total equity 135,416 114,928
1,172,425 18,358,566 Total equity and liabilities 2,354,266 1,860,758

– 21 –
HSBC Holdings plc
Consolidated Statement of Recognised Income and Expense
________________________________________________________________________________ Year ended 31 December 2007 2006 US$m US$m Available-for-sale investments: - fair value gains taken to equity 756 1,582 - fair value losses transferred to income statement on disposal or impairment (1,740 ) (644 ) Cash flow hedges: - fair value gains taken to equity 625 1,554 - fair value losses transferred to income statement (1,886 ) (2,198 ) Share of changes in equity of associates and joint ventures 372 20 Exchange differences 5,946 4,675 Actuarial gains/(losses) on defined benefit plans 2,167 (78 )
6,240 4,911 Tax on items taken directly to equity (226 ) (44 ) Profit for the year 20,455 16,871
Total recognised income and expense for the year 26,469 21,738 Total recognised income and expense for the year attributable to: - shareholders of the parent company 24,801 20,527 - minority interests 1,668 1,211
26,469 21,738

– 22 –
HSBC Holdings plc
Consolidated Cash Flow Statement
________________________________________________________________________________ Year ended 31 December 2007 2006 US$m US$m Cash flows from operating activities Profit before tax 24,212 22,086
Adjustments for: Non-cash items included in profit before tax 21,662 14,956 Change in operating assets (176,538 ) (175,317 ) Change in operating liabilities 250,095 237,378 Elimination of exchange differences (18,563 ) (12,114 ) Net gain from investing activities (2,209 ) (2,014 ) Share of profits in associates and joint ventures (1,503 ) (846 ) Dividends received from associates 363 97 Contribution paid to defined benefit plans (1,393 ) (547 ) Tax paid (5,088 ) (4,946 )
Net cash from operating activities 91,038 78,733 Cash flows from investing activities Purchase of financial investments (260,980 ) (286,316 ) Proceeds from the sale and maturity of financial investments 238,647 273,774 Purchase of property, plant and equipment (2,720 ) (2,400 ) Proceeds from the sale of property, plant and equipment 3,178 2,504 Proceeds from the sale of loan portfolios 1,665 2,048 Net purchase of intangible assets (950 ) (852 ) Net cash outflow from acquisition of and increase in stake of subsidiaries (623 ) (1,185 ) Net cash inflow from disposal of subsidiaries 187 62 Net cash outflow from acquisition of and increase in stake of associates (351 ) (585 ) Net cash inflow from the consolidation of funds 1,600 – Proceeds from disposal of associates 69 874
Net cash used in investing activities (20,278 ) (12,076 ) Cash flows from financing activities Issue of ordinary share capital 474 1,010 Issuance of preference shares – 374 Net purchases and sales of own shares for market-making and investment purposes 126 46 Purchases of own shares to meet share awards and share option awards (636 ) (575 ) On exercise of share options 104 173 Subordinated loan capital issued 5,705 5,948 Subordinated loan capital repaid (689 ) (903 ) Dividends paid to shareholders of the parent company (6,003 ) (5,927 ) Dividends paid to minority interests (718 ) (710 )
Net cash used in financing activities (1,637 ) (564 )
Net increase in cash and cash equivalents 69,123 66,093 Cash and cash equivalents at 1 January 215,486 141,307 Exchange differences in respect of cash and cash equivalents 12,400 8,086
Cash and cash equivalents at 31 December 297,009 215,486

– 23 –
HSBC Holdings plc
Additional Information
________________________________________________________________________________ 1. Basis of preparation and accounting policies The consolidated financial statements of HSBC and the separate financial statements of HSBC Holdings have been prepared in accordance with International Financial Reporting Standards (‘IFRSs’) as endorsed by the European Union (‘EU’). EU-endorsed IFRSs may differ from IFRSs as published by the International Accounting Standards Board (‘IASB’) if, at any point in time, new or amended IFRSs have not been endorsed by the EU. At 31 December 2007, there were no unendorsed standards effective for the year ended 31 December 2007 affecting these consolidated and separate financial statements, and there was no difference between IFRSs endorsed by the EU and IFRSs issued by the IASB in terms of their application to HSBC. Accordingly, HSBC’s financial statements for the year ended 31 December 2007 are prepared in accordance with IFRSs as issued by the IASB. IFRSs comprise accounting standards issued by the IASB and its predecessor body and interpretations issued by the International Financial Reporting Interpretations Committee (‘IFRIC’) and its predecessor body. Significant accounting policies applicable to the consolidated and separate financial statements of HSBC Holdings can be found in Notes 1 and 2 of the Annual Report and Accounts 2007. 2. Dividends On 3 March 2008, the Directors declared a fourth interim dividend for 2007 of US$0.39 per ordinary share. The dividend will be payable on 7 May 2008, to shareholders on the Register at the close of business on 25 March 2008. The dividend will be payable in cash, in US dollars, sterling or Hong Kong dollars, or a combination of these currencies, at the exchange rates quoted by HSBC Bank plc in London at or about 11 am on 28 April 2008, and with a scrip dividend alternative. Particulars of these arrangements will be mailed to shareholders on or about 3 April 2008, and elections will be required to be made by 24 April 2008. As this dividend was declared after the balance sheet date, it has not been included in ‘Other liabilities’ at 31 December 2007. The dividend on shares held through Euroclear France, the settlement and central depositary system for Euronext Paris, will be payable on 7 May 2008 to the holders of record on 25 March 2008. The dividend will be payable in cash, in euros at the exchange rate on 28 April 2008, or as a scrip dividend. Particulars of these arrangements will be announced through Euronext Paris on 20 March 2008 and 28 March 2008. The dividend on American Depositary Shares (‘ADSs’), each of which represents five ordinary shares, will be payable on 7 May 2008 to holders of record on 25 March 2008. The dividend of US$1.95 per ADS will be payable in cash in US dollars or as a scrip dividend of new ADSs. Particulars of these arrangements will be mailed to holders on or about 1 April 2008, and elections will be required to be made by 18 April 2008. Alternatively, the cash dividend may be invested in additional ADSs for participants in the dividend reinvestment plan operated by the depositary. The Company’s shares will be quoted ex-dividend in London, Hong Kong and Bermuda on 19 March 2008 and in Paris on 26 March 2008. The ADSs will be quoted ex-dividend in New York on 20 March 2008.

– 24 –
HSBC Holdings plc
Additional Information
(continued)________________________________________________________________________________ Dividends declared on HSBC Holdings shares during 2007 were as follows:
2007 2006 Per
share US$
TotalUS$m
Settled in scrip
US$mPer share
US$Total
US$m
Settled in scrip
US$mDividends declared on ordinary shares Fourth interim dividend in respect of previous year 0.360 4,161 2,116 0.310 3,513 1,542First interim dividend in respect of current year 0.170 1,986 712 0.150 1,712 248Second interim dividend in respect of current year 0.170 1,997 912 0.150 1,724 515Third interim dividend in respect of current year 0.170 2,007 614 0.150 1,730 223 0.870 10,151 4,354 0.760 8,679 2,528Quarterly dividends on preference share capital March dividend 15.50 22 15.50 22June dividend 15.50 23 15.50 23September dividend 15.50 22 15.50 22December dividend 15.50 23 15.50 23 62.00 90 62.00 90 On 13 February 2008, the Directors declared a dividend of US$15.50 per 6.20 per cent non-cumulative US dollar preference share (Series A dollar preference share), equivalent to a dividend of US$0.3875 per Series A American Depositary Share, each of which represents one-fortieth of a Series A dollar preference share. The dividend is payable on 17 March 2008 to the holder of record on 29 February 2008. 3. Earnings and dividends per ordinary share Year ended 31 December 2007 2006 US$ US$
Basic earnings per ordinary share 1.65 1.40 Diluted earnings per ordinary share 1.63 1.39 Dividends per ordinary share 0.87 0.76
Dividend pay out ratio 52.7% 54.3%
Dividends per ordinary share expressed as a percentage of basic earnings per ordinary share. Basic earnings per ordinary share was calculated by dividing the earnings of US$19,043 million by the weighted average number of ordinary shares outstanding, excluding own shares held, of 11,545 million shares (2006: earnings of US$15,699 million and 11,210 million shares).

– 25 –
HSBC Holdings plc
Additional Information
(continued)________________________________________________________________________________ Year ended 31 December 2007 2006 US$m US$m
Profit attributable to shareholders of the parent company 19,133 15,789 Dividend payable on preference shares classified as equity (90 ) (90 )
Profit attributable to the ordinary shareholders of the parent company 19,043 15,699 Diluted earnings per ordinary share was calculated by dividing the basic earnings, which require no adjustment for the effects of dilutive potential ordinary shares (including share options outstanding not yet exercised), by the weighted average number of ordinary shares outstanding, excluding own shares held, plus the weighted average number of ordinary shares that would be issued on conversion of all the dilutive potential ordinary shares in 2007 of 11,661 million shares (2006: 11,320 million shares). 4. Tax expense Year ended 31 December 2007 2006 US$m US$m
UK corporation tax charge 1,326 650 Overseas tax 3,879 4,552
Current tax 5,205 5,202 Deferred tax (1,448 ) 13
Tax expense 3,757 5,215 Effective tax rate 15.5% 23.6% HSBC Holdings and its subsidiaries in the United Kingdom provided for UK corporation tax at 30 per cent (2006: 30 per cent). Overseas tax included Hong Kong profits tax of US$1,137 million (2006: US$751 million) provided at the rate of 17.5 per cent (2006: 17.5 per cent) on the profits for the year assessable in Hong Kong. Other overseas subsidiaries and overseas branches provided for taxation at the appropriate rates in the countries in which they operate. Analysis of tax expense Year ended 31 December 2007 2006 US$m US$m
Taxation at UK corporation tax rate of 30 per cent (2006: 30 per cent) 7,264 6,626 Effect of taxing overseas profit in principal locations at different rates (1,460 ) (568 ) Tax-free gains (296 ) (199 ) Adjustments in respect of prior period liabilities (309 ) (106 ) Low income housing tax credits (107 ) (108 ) Effect of profit in associates and joint ventures (450 ) (253 ) Effect of previously unrecognised temporary differences (485 ) (122 ) Release of deferred tax consequent on restructuring of Group interests (359 ) – Impact of gains arising from dilution of interests in associates (253 ) – Other items 212 (55 )
Overall tax expense 3,757 5,215

– 26 –
HSBC Holdings plc
Additional Information
(continued)________________________________________________________________________________ 5. Capital resources At 31 December 2007 2006 % % Capital ratios Total capital 13.6 13.5 Tier 1 capital 9.3 9.4 US$m US$m Composition of regulatory capital Tier 1: Shareholders’ equity 128,160 108,352 Minority interests and preference shares 6,240 7,413 Innovative tier 1 securities 10,512 9,932 Less: Goodwill capitalised and intangible assets (38,855 ) (36,489) Other regulatory adjustments (1,090 ) (1,366)
Total qualifying tier 1 capital 104,967 87,842 Tier 2: Reserves arising from revaluation of property and unrealised gains on available-for-sale equities 4,393 2,982 Collective impairment allowances 14,047 11,077 Perpetual subordinated debt 3,114 3,396 Term subordinated debt 37,658 30,677 Minority and other interests in tier 2 capital 300 425
Total qualifying tier 2 capital before deductions 59,512 48,557 Unconsolidated investments (11,092 ) (7,512) Investments in capital of other banks – (1,419) Other deductions (747 ) (394)
Total regulatory capital 152,640 127,074 Total risk-weighted assets 1,123,782 938,678 Basel II proforma tier 1 ratio Tier 1 capital* 101,685 – Total risk-weighted assets 1,129,451 – Tier 1 capital ratio – management basis 9.0% – * Management basis (comprising Core tier 1 capital plus Innovative tier 1 securities).

– 27 –
HSBC Holdings plc
Additional Information
(continued)________________________________________________________________________________ 6. Notes on the cash flow statement Year ended 31 December 2007 2006 US$m US$m (a) Non-cash items included in profit before tax Depreciation, amortisation and impairment 2,522 2,528 Gain arising from dilution of interests in associates (1,092 ) - Revaluations on investment property (152 ) (164) Share-based payment expense 870 854 Loan impairment losses gross of recoveries 18,182 11,331 Provisions for liabilities and charges 989 498 Impairment of financial investments 65 21 Charge for defined benefit plans 727 664 Accretion of discounts and amortisation of premiums (449 ) (776)
21,662 14,956 (b) Change in operating assets Change in prepayments and accrued income (5,069 ) (2,478) Change in net trading securities and net derivatives (4,972 ) (13,620) Change in loans and advances to banks (8,922 ) (11,505) Change in loans and advances to customers (131,886 ) (132,987) Change in financial assets designated at fair value (13,360 ) (4,883) Change in other assets (12,329 ) (9,844)
(176,538 ) (175,317) (c) Change in operating liabilities Change in accruals and deferred income 5,119 3,549 Change in deposits by banks 32,594 28,378 Change in customer accounts 199,806 149,849 Change in debt securities in issue (12,489 ) 42,253 Change in financial liabilities designated at fair value 12,304 8,382 Change in other liabilities 12,761 4,967
250,095 237,378 (d) Cash and cash equivalents Cash and balances at central banks 21,765 12,732 Items in the course of collection from other banks 9,777 14,144 Loans and advances to banks of one month or less 232,320 162,998 Treasury bills, other bills and certificates of deposit less than three months 41,819 38,237 Less: items in the course of transmission to other banks (8,672 ) (12,625)
Total cash and cash equivalents 297,009 215,486

– 28 –
HSBC Holdings plc
Additional Information
(continued)________________________________________________________________________________ 7. Loan impairment charge Half-year to Half-year to 30 June 31 December 30 June 31 December 2007 2007 2007 2006 2006 2006 US$m US$m US$m US$m US$m US$m By category: Loan impairment charge Individually assessed impairment
allowances:
- Net new allowances 442 483 925 253 333 586 - Recoveries (57) (72) (129) (75 ) (53 ) (128)
385 411 796 178 280 458 Collectively assessed impairment
allowances:
- Net new allowances 6,230 11,027 17,257 3,986 6,754 10,740 - Recoveries (287) (589) (876) (268 ) (383 ) (651)
5,943 10,438 16,381 3,718 6,371 10,089 Total charge for impairment losses 6,328 10,849 17,177 3,896 6,651 10,547 Customers 6,328 10,849 17,177 3,896 6,654 10,550 Banks – – – – (3 ) (3)

– 29 –
HSBC Holdings plc
Additional Information
(continued)________________________________________________________________________________ 8. Analysis of net fee income Half-year to Half-year to 30 June 31 December 30 June 31 December 2007 2007 2007 2006 2006 2006 US$m US$m US$m US$m US$m US$m
Cards 3,092 3,404 6,496 2,482 2,885 5,367 Account services 1,961 2,398 4,359 1,688 1,945 3,633 Funds under management 1,390 1,585 2,975 1,571 1,147 2,718 Broking income 928 1,084 2,012 728 626 1,354 Insurance 804 1,032 1,836 693 665 1,358 Global custody 557 847 1,404 423 374 797 Credit facilities 672 466 1,138 462 460 922 Unit trusts 420 455 875 265 255 520 Imports/Exports 407 459 866 383 397 780 Remittances 273 283 556 223 249 472 Corporate finance 220 189 409 95 160 255 Underwriting 196 171 367 150 136 286 Trust income 146 153 299 113 135 248 Tax payer financial services 234 18 252 237 26 263 Maintenance income on operating leases 69 70 139 59 63 122 Mortgage servicing 53 56 109 47 50 97 Other 1,066 1,179 2,245 822 1,066 1,888
Total fee income 12,488 13,849 26,337 10,441 10,639 21,080 Less: fee expense (1,993) (2,342) (4,335) (2,061 ) (1,837 ) (3,898)
Net fee income 10,495 11,507 22,002 8,380 8,802 17,182

– 30 –
HSBC Holdings plc
Additional Information
(continued)________________________________________________________________________________ 9. Distribution of results by customer group and global business Personal Financial Services Half-year to Half-year to 30 June 31 December 30 June 31 December 2007 2007 2007 2006 2006 2006 US$m US$m US$m US$m US$m US$m
Net interest income 13,998 15,071 29,069 12,736 13,340 26,076 Net fee income 5,523 6,219 11,742 4,285 4,477 8,762
Net trading income 93 85 178 417 194 611 Net income from financial instruments designated at fair value 796 537 1,333 120 619 739 Gains less losses from financial investments 60 291 351 66 12 78 Dividend income 41 14 55 8 23 31 Net earned insurance premiums 3,735 4,536 8,271 2,517 2,613 5,130 Other operating income 255 132 387 343 439 782
Total operating income 24,501 26,885 51,386 20,492 21,717 42,209
Net insurance claims incurred and movement in liabilities to policyholders (3,605) (4,542) (8,147) (1,975 ) (2,390 ) (4,365) Net operating income before loan impairment charges and other credit risk provisions 20,896 22,343 43,239 18,517 19,327 37,844
Loan impairment charges and other credit risk provisions (5,928) (10,244) (16,172) (3,709 ) (6,240 ) (9,949)
Net operating income 14,968 12,099 27,067 14,808 13,087 27,895
Net operating expenses (10,452) (11,305) (21,757) (9,073 ) (9,745 ) (18,818)
Operating profit 4,516 794 5,310 5,735 3,342 9,077
Share of profit in associates and joint ventures 213 377 590 173 207 380
Profit before tax 4,729 1,171 5,900 5,908 3,549 9,457

– 31 –
HSBC Holdings plc
Additional Information
(continued)________________________________________________________________________________ Commercial Banking Half-year to Half-year to 30 June 31 December 30 June 31 December 2007 2007 2007 2006 2006 2006 US$m US$m US$m US$m US$m US$m
Net interest income 4,286 4,769 9,055 3,515 3,999 7,514 Net fee income 1,904 2,068 3,972 1,555 1,652 3,207
Net trading income 134 162 296 96 128 224 Net income/(expense) from financial instruments designated at fair value (24) 46 22 (40 ) 18 (22) Gains less losses from financial investments 25 65 90 23 21 44 Dividend income 4 4 8 2 4 6 Net earned insurance premiums 205 528 733 128 130 258 Other operating income 2 163 165 126 124 250
Total operating income 6,536 7,805 14,341 5,405 6,076 11,481
Net insurance claims incurred and movement in liabilities to policyholders 44 (435) (391) (42 ) (54 ) (96) Net operating income before loan impairment charges and other credit risk provisions 6,580 7,370 13,950 5,363 6,022 11,385
Loan impairment charges and other credit risk provisions (431) (576) (1,007) (260 ) (437 ) (697)
Net operating income 6,149 6,794 12,943 5,103 5,585 10,688
Net operating expenses (2,907) (3,345) (6,252) (2,385 ) (2,594 ) (4,979)
Operating profit 3,242 3,449 6,691 2,718 2,991 5,709
Share of profit in associates and joint ventures 180 274 454 144 144 288
Profit before tax 3,422 3,723 7,145 2,862 3,135 5,997

– 32 –
HSBC Holdings plc
Additional Information
(continued)________________________________________________________________________________ Global Banking and Markets Half-year to Half-year to 30 June 31 December 30 June 31 December 2007 2007 2007 2006 2006 2006 US$m US$m US$m US$m US$m US$m
Net interest income 1,847 2,583 4,430 1,394 1,774 3,168 Net fee income 2,264 2,637 4,901 1,810 1,908 3,718
Net trading income 2,897 370 3,267 2,496 2,015 4,511 Net income/(expense) from financial instruments designated at fair value 11 (175) (164) 47 (27 ) 20 Gains less losses from financial investments 768 545 1,313 269 265 534 Dividend income 175 47 222 147 88 235 Net earned insurance premiums 46 47 93 41 32 73 Other operating income 529 689 1,218 578 800 1,378
Total operating income 8,537 6,743 15,280 6,782 6,855 13,637
Net insurance claims incurred and movement in liabilities to policyholders (38) (32) (70) (31 ) (31 ) (62) Net operating income before loan impairment charges and other credit risk provisions 8,499 6,711 15,210 6,751 6,824 13,575
Loan impairment charges and other credit risk recoveries 24 (62) (38) 109 10 119
Net operating income 8,523 6,649 15,172 6,860 6,834 13,694
Net operating expenses (4,479) (4,879) (9,358) (3,740 ) (4,251 ) (7,991)
Operating profit 4,044 1,770 5,814 3,120 2,583 5,703
Share of profit in associates and joint ventures 114 193 307 24 79 103
Profit before tax 4,158 1,963 6,121 3,144 2,662 5,806

– 33 –
HSBC Holdings plc
Additional Information
(continued)________________________________________________________________________________ Private Banking Half-year to Half-year to 30 June 31 December 30 June 31 December 2007 2007 2007 2006 2006 2006 US$m US$m US$m US$m US$m US$m
Net interest income 567 649 1,216 482 529 1,011 Net fee income 811 804 1,615 705 618 1,323
Net trading income 259 275 534 216 148 364 Net income/(expense) from financial instruments designated at fair value – (1 ) (1 ) – 1 1 Gains less losses from financial investments 45 74 119 28 138 166 Dividend income 5 2 7 4 1 5 Other operating income 31 27 58 25 36 61
Net operating income before loan impairment charges and other credit risk provisions 1,718 1,830 3,548 1,460 1,471 2,931
Loan impairment charges and other credit risk provisions (9 ) (5 ) (14) (29 ) (4 ) (33)
Net operating income 1,709 1,825 3,534 1,431 1,467 2,898
Net operating expenses (929) (1,096) (2,025) (831 ) (854 ) (1,685)
Operating profit 780 729 1,509 600 613 1,213
Share of profit in associates and joint ventures - 2 2 – 1 1
Profit before tax 780 731 1,511 600 614 1,214

– 34 –
HSBC Holdings plc
Additional Information
(continued)________________________________________________________________________________ Other Half-year to Half-year to 30 June 31 December 30 June 31 December 2007 2007 2007 2006 2006 2006 US$m US$m US$m US$m US$m US$m
Net interest income/(expense) (291) (251) (542) (292 ) (333 ) (625) Net fee income/(expense) (7 ) (221) (228) 25 147 172
Net trading income/(expense) (49) 175 126 (68 ) (78 ) (146) Net income/(expense) from financial instruments designated at fair value 91 2,802 2,893 133 (214 ) (81) Gains less losses from financial investments 101 (18) 83 107 40 147 Gains arising from dilution of interests in associates 1,076 16 1,092 – – – Dividend income 27 5 32 61 2 63 Net earned insurance premiums (9 ) (12) (21) 148 59 207 Other operating income 1,667 1,856 3,523 1,544 1,710 3,254
Total operating income 2,606 4,352 6,958 1,658 1,333 2,991
Net insurance claims incurred and movement in liabilities to policyholders – – – (101 ) (80 ) (181) Net operating income before loan impairment charges and other credit risk provisions 2,606 4,352 6,958 1,557 1,253 2,810
Loan impairment charges and other credit risk provisions (2 ) (9 ) (11) (1 ) (12 ) (13)
Net operating income 2,604 4,343 6,947 1,556 1,241 2,797
Net operating expenses (1,650) (1,912) (3,562) (1,573 ) (1,686 ) (3,259)
Operating profit 954 2,431 3,385 (17 ) (445 ) (462)
Share of profit in associates and joint ventures 116 34 150 20 54 74
Profit/(loss) before tax 1,070 2,465 3,535 3 (391 ) (388)

– 35 –
HSBC Holdings plc
Additional Information
(continued)________________________________________________________________________________ 10. Geographical distribution of results Europe Half-year to Half-year to 30 June 31 December 30 June 31 December 2007 2007 2007 2006 2006 2006 US$m US$m US$m US$m US$m US$m
Interest income 15,217 17,927 33,144 11,765 13,484 25,249 Interest expense (11,297) (14,101) (25,398) (7,671 ) (9,289 ) (16,960)
Net interest income 3,920 3,826 7,746 4,094 4,195 8,289
Fee income 5,382 5,591 10,973 4,874 4,709 9,583 Fee expense (1,238) (1,304) (2,542) (1,361 ) (1,114 ) (2,475)
Net fee income 4,144 4,287 8,431 3,513 3,595 7,108
Net trading income 3,338 3,605 6,943 2,187 2,342 4,529 Net income from financial instruments designated at fair value 348 878 1,226 129 15 144 Gains less losses from financial investments 790 536 1,326 266 358 624 Dividend income 161 10 171 121 62 183 Net earned insurance premiums 1,480 2,530 4,010 668 630 1,298 Other operating income 262 931 1,193 633 795 1,428
Total operating income 14,443 16,603 31,046 11,611 11,992 23,603
Net insurance claims incurred and movement in liabilities to policyholders (1,146) (2,333) (3,479) (287 ) (244 ) (531) Net operating income before loan impairment charges and other credit risk provisions 13,297 14,270 27,567 11,324 11,748 23,072
Loan impairment charges and other credit risk provisions (1,363) (1,179) (2,542) (935 ) (1,220 ) (2,155)
Net operating income 11,934 13,091 25,025 10,389 10,528 20,917
Net operating expenses (7,972) (8,553) (16,525) (6,723 ) (7,148 ) (13,871)
Operating profit 3,962 4,538 8,500 3,666 3,380 7,046
Share of profit/(loss) in associates and joint ventures 88 7 95 (66 ) (6 ) (72)
Profit before tax 4,050 4,545 8,595 3,600 3,374 6,974

– 36 –
HSBC Holdings plc
Additional Information
(continued)________________________________________________________________________________ Hong Kong Half-year to Half-year to 30 June 31 December 30 June 31 December 2007 2007 2007 2006 2006 2006 US$m US$m US$m US$m US$m US$m
Interest income 6,214 6,366 12,580 5,207 5,890 11,097 Interest expense (3,646) (3,451) (7,097) (3,049 ) (3,363 ) (6,412)
Net interest income 2,568 2,915 5,483 2,158 2,527 4,685
Fee income 1,659 2,201 3,860 1,197 1,251 2,448 Fee expense (220) (278) (498) (197 ) (195 ) (392)
Net fee income 1,439 1,923 3,362 1,000 1,056 2,056
Net trading income 469 773 1,242 306 311 617 Net income from financial instruments designated at fair value 210 466 676 6 254 260 Gains less losses from financial investments 32 62 94 122 40 162 Dividend income 17 14 31 59 2 61 Net earned insurance premiums 1,426 1,371 2,797 1,317 1,311 2,628 Other operating income 413 432 845 443 391 834
Total operating income 6,574 7,956 14,530 5,411 5,892 11,303
Net insurance claims incurred and movement in liabilities to policyholders (1,512) (1,696) (3,208) (1,193 ) (1,506 ) (2,699) Net operating income before loan impairment charges and other credit risk provisions 5,062 6,260 11,322 4,218 4,386 8,604
Loan impairment charges and other credit risk provisions (80) (151) (231) (70 ) (102 ) (172)
Net operating income 4,982 6,109 11,091 4,148 4,284 8,432
Net operating expenses (1,665) (2,115) (3,780) (1,504 ) (1,765 ) (3,269)
Operating profit 3,317 3,994 7,311 2,644 2,519 5,163
Share of profit in associates and joint ventures 13 15 28 10 9 19
Profit before tax 3,330 4,009 7,339 2,654 2,528 5,182

– 37 –
HSBC Holdings plc
Additional Information
(continued)________________________________________________________________________________ Rest of Asia-Pacific (including Middle East) Half-year to Half-year to 30 June 31 December 30 June 31 December 2007 2007 2007 2006 2006 2006 US$m US$m US$m US$m US$m US$m
Interest income 4,662 5,496 10,158 3,548 4,145 7,693 Interest expense (2,761) (3,254) (6,015) (2,069 ) (2,577 ) (4,646)
Net interest income 1,901 2,242 4,143 1,479 1,568 3,047
Fee income 1,174 1,535 2,709 949 963 1,912 Fee expense (164) (299) (463) (164 ) (126 ) (290)
Net fee income 1,010 1,236 2,246 785 837 1,622
Net trading income 797 846 1,643 551 630 1,181 Net income/(expense) from financial instruments designated at fair value 78 33 111 (5 ) 84 79 Gains less losses from financial investments 26 12 38 27 14 41 Gains arising from dilution of interests in associates 1,076 5 1,081 – – – Dividend income 4 4 8 – 5 5 Net earned insurance premiums 109 117 226 89 85 174 Other operating income 360 438 798 288 477 765
Total operating income 5,361 4,933 10,294 3,214 3,700 6,914
Net insurance claims incurred and movement in liabilities to policyholders (141) (112) (253) (63 ) (129 ) (192) Net operating income before loan impairment charges and other credit risk provisions 5,220 4,821 10,041 3,151 3,571 6,722
Loan impairment charges and other credit risk provisions (308) (308) (616) (271 ) (241 ) (512)
Net operating income 4,912 4,513 9,425 2,880 3,330 6,210
Net operating expenses (2,075) (2,689) (4,764) (1,609 ) (1,939 ) (3,548)
Operating profit 2,837 1,824 4,661 1,271 1,391 2,662
Share of profit in associates and joint ventures 507 841 1,348 386 479 865
Profit before tax 3,344 2,665 6,009 1,657 1,870 3,527
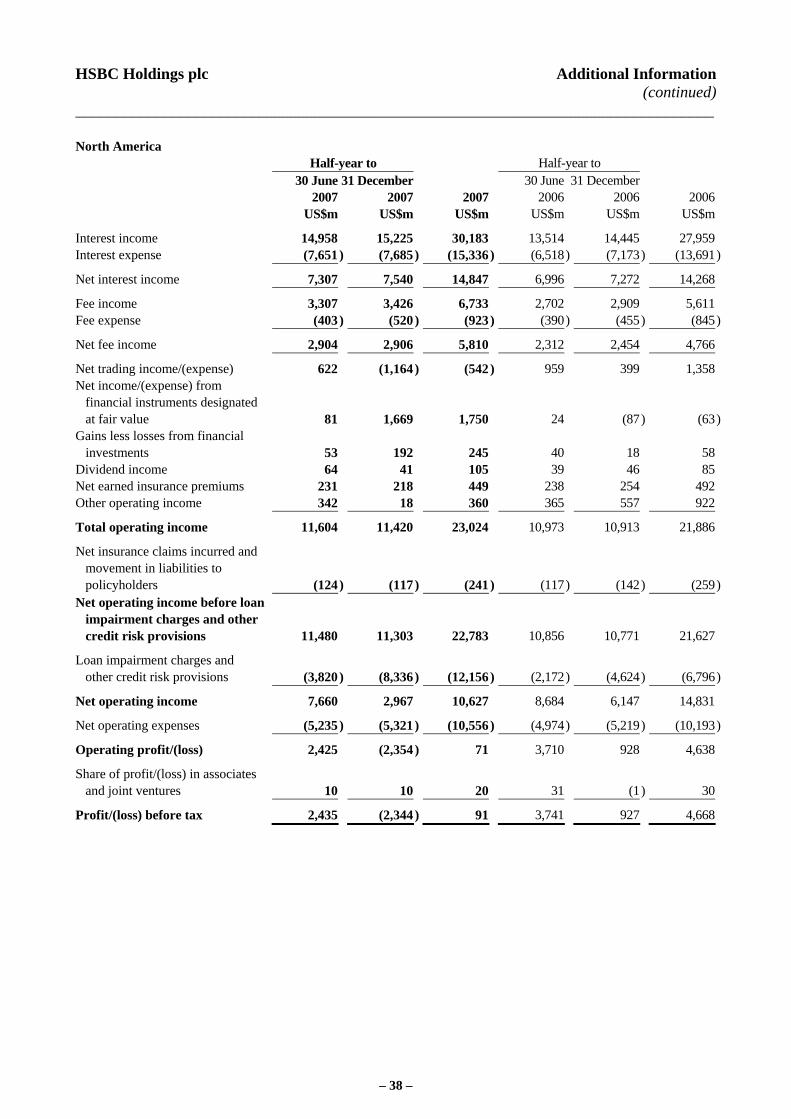
– 38 –
HSBC Holdings plc
Additional Information
(continued)________________________________________________________________________________ North America Half-year to Half-year to 30 June 31 December 30 June 31 December 2007 2007 2007 2006 2006 2006 US$m US$m US$m US$m US$m US$m
Interest income 14,958 15,225 30,183 13,514 14,445 27,959 Interest expense (7,651) (7,685) (15,336) (6,518 ) (7,173 ) (13,691)
Net interest income 7,307 7,540 14,847 6,996 7,272 14,268
Fee income 3,307 3,426 6,733 2,702 2,909 5,611 Fee expense (403) (520) (923) (390 ) (455 ) (845)
Net fee income 2,904 2,906 5,810 2,312 2,454 4,766
Net trading income/(expense) 622 (1,164) (542) 959 399 1,358 Net income/(expense) from financial instruments designated at fair value 81 1,669 1,750 24 (87 ) (63) Gains less losses from financial investments 53 192 245 40 18 58 Dividend income 64 41 105 39 46 85 Net earned insurance premiums 231 218 449 238 254 492 Other operating income 342 18 360 365 557 922
Total operating income 11,604 11,420 23,024 10,973 10,913 21,886
Net insurance claims incurred and movement in liabilities to policyholders (124) (117) (241) (117 ) (142 ) (259) Net operating income before loan impairment charges and other credit risk provisions 11,480 11,303 22,783 10,856 10,771 21,627
Loan impairment charges and other credit risk provisions (3,820) (8,336) (12,156) (2,172 ) (4,624 ) (6,796)
Net operating income 7,660 2,967 10,627 8,684 6,147 14,831
Net operating expenses (5,235) (5,321) (10,556) (4,974 ) (5,219 ) (10,193)
Operating profit/(loss) 2,425 (2,354) 71 3,710 928 4,638
Share of profit/(loss) in associates and joint ventures 10 10 20 31 (1 ) 30
Profit/(loss) before tax 2,435 (2,344) 91 3,741 927 4,668

– 39 –
HSBC Holdings plc
Additional Information
(continued)________________________________________________________________________________ Latin America Half-year to Half-year to 30 June 31 December 30 June 31 December 2007 2007 2007 2006 2006 2006 US$m US$m US$m US$m US$m US$m
Interest income 4,376 5,095 9,471 3,497 3,792 7,289 Interest expense (1,842) (2,053) (3,895) (1,493 ) (1,599 ) (3,092)
Net interest income 2,534 3,042 5,576 2,004 2,193 4,197
Fee income 1,234 1,413 2,647 933 1,042 1,975 Fee expense (236) (258) (494) (163 ) (182 ) (345)
Net fee income 998 1,155 2,153 770 860 1,630
Net trading income 285 263 548 258 279 537 Net income from financial instruments designated at fair value 157 163 320 106 131 237 Gains less losses from financial investments 98 155 253 38 46 84 Gains arising from dilution of interests in associates – 11 11 – – – Dividend income 6 3 9 3 3 6 Net earned insurance premiums 731 863 1,594 522 554 1,076 Other operating income 153 75 228 41 50 91
Total operating income 4,962 5,730 10,692 3,742 4,116 7,858
Net insurance claims incurred and movement in liabilities to policyholders (676) (751) (1,427) (489 ) (534 ) (1,023) Net operating income before loan impairment charges and other credit risk provisions 4,286 4,979 9,265 3,253 3,582 6,835
Loan impairment charges and other credit risk provisions (775) (922) (1,697) (442 ) (496 ) (938)
Net operating income 3,511 4,057 7,568 2,811 3,086 5,897
Net operating expenses (2,516) (2,886) (5,402) (1,946 ) (2,220 ) (4,166)
Operating profit 995 1,171 2,166 865 866 1,731
Share of profit in associates and joint ventures 5 7 12 – 4 4
Profit before tax 1,000 1,178 2,178 865 870 1,735
– 40 –
HSBC Holdings plc
Additional Information
(continued)________________________________________________________________________________ 11. Registers of shareholders The Overseas Branch Registers of shareholders in Hong Kong and Bermuda will be closed for one day, on Tuesday 25 March 2008. Any person who has acquired shares registered on the Hong Kong Branch Register but who has not lodged the share transfer with the Hong Kong Branch Registrar should do so before 4.00pm on Thursday 20 March 2008 and any person who has acquired shares registered on the Bermuda Branch Register but who has not lodged the share transfer with the Bermuda Branch Registrar should do so before 4.00pm on Monday 24 March 2008 in order to receive the fourth interim dividend for 2007, which will be payable on Wednesday 7 May 2008. Transfers may not be made to or from the Hong Kong or Bermuda Overseas Branch Registers while those Branch Registers are closed. Any person who has acquired shares registered on the Principal Register in the United Kingdom but who has not lodged the share transfer with the Principal Registrar should do so before 4.00pm on Tuesday 25 March 2008 in order to receive the dividend. Transfers of American Depositary Shares should be lodged with the depositary by 12 noon on Tuesday 25 March 2008 in order to receive the dividend. 12. Foreign currency amounts The sterling and Hong Kong dollar equivalent figures in the consolidated income statement and balance sheet are for information only. These are translated at the average rate for the period for the income statement and the closing rate for the balance sheet as follows: Year ended 31 December 2007 2006 Closing : HK$/US$ 7.798 7.776 £/US$ 0.498 0.509 Average : HK$/US$ 7.801 7.769 £/US$ 0.500 0.543 13. Litigation HSBC is party to legal actions in a number of jurisdictions including the UK, Hong Kong and the US, arising out of its normal business operations. HSBC considers that none of the actions is material, and none is expected to result in a significant adverse effect on the financial position of HSBC, either individually or in the aggregate. Management believes that adequate provisions have been made in respect of such litigation. HSBC has not disclosed any contingent liability associated with these legal actions because it is not practicable to do so, except as set out below.

– 41 –
HSBC Holdings plc
Additional Information
(continued)________________________________________________________________________________ On 27th July 2007, the UK Office of Fair Trading (‘OFT’) issued High Court legal proceedings against a number of UK financial institutions, including HSBC Bank plc, to determine the legal status and enforceability of certain of the charges applied to their personal customers in relation to unauthorised overdrafts (the ‘charges’). Certain preliminary issues in these proceedings were heard in a trial in the Commercial Division of the High Court on 17th January 2008. This trial concluded on 8th February 2008 and judgment, on the preliminary issues tested, is awaited. The proceedings remain at a very early stage and may, if appeals on the preliminary issues (or, subsequently, on substantive issues) are pursued, take a number of years to conclude. A wide range of outcomes is possible, depending, initially, upon whether the Court finds that some, all, or none of the charges should be tested for fairness and/or tested as common law penalties and, if it does find that some or all of the charges should be so tested, upon the Court’s subsequent assessment of each charge across the period under review. Since July 2001, there have been a variety of charges applied by HSBC Bank plc across different charging periods under the then current contractual arrangements. HSBC Bank plc considers the charges to be and to have been valid and enforceable, and intends strongly to defend its position. If, contrary to HSBC Bank plc’s current assessment, the Court should ultimately (after appeals) reach a decision adverse to HSBC Bank plc that results in liability for it, a large number of different outcomes is possible, each of which would have a different financial impact. Based on the facts currently available to it, and a number of assumptions, HSBC Bank plc estimates that the financial impact could be approximately US$600 million. To make an estimate of the potential financial impact at this stage with any precision is extremely difficult, owing to (among other things) the complexity of the issues, the number of permutations of possible outcomes, and the early stage of the proceedings. In addition, the assumptions made by HSBC Bank plc may prove to be incorrect. 14. Dealings in HSBC Holdings plc shares Except for dealings as intermediaries by HSBC Bank plc, HSBC Financial Products (France) and The Hongkong and Shanghai Banking Corporation Limited, which are members of a European Economic Area exchange, neither HSBC Holdings nor any subsidiaries has bought, sold or redeemed any securities of HSBC Holdings during the year ended 31 December 2007. 15. Statutory accounts The information in this news release does not constitute statutory accounts within the meaning of Section 240 of the Companies Act 1985 (the Act). The statutory accounts for the year ended 31 December 2007 will be delivered to the Registrar of Companies in England and Wales in accordance with Section 242 of the Act. The auditor has reported on those accounts. Its report was unqualified and did not contain a statement under Section 237(2) or (3) of the Act.

– 42 –
HSBC Holdings plc
Additional Information
(continued)________________________________________________________________________________ 16. Forward-looking statements This news release contains certain forward-looking statements with respect to the financial condition, results of operations and business of HSBC. These forward-looking statements represent HSBC’s expectations or beliefs concerning future events and involve known and unknown risks and uncertainty that could cause actual results, performance or events to differ materially from those expressed or implied in such statements. Certain statements, such as those that include the words ‘potential’, ‘estimated’, and similar expressions or variations on such expressions may be considered ‘forward-looking statements’. 17. Corporate governance HSBC is committed to high standards of corporate governance. HSBC Holdings plc has complied throughout 2007 with the applicable code provisions of the Combined Code on Corporate Governance issued by the Financial Reporting Council and the Code on Corporate Governance Practices in Appendix 14 to the Rules Governing the Listing of Securities on The Stock Exchange of Hong Kong Limited. The Board of HSBC Holdings plc has adopted a code of conduct for transactions in HSBC Group securities by Directors that complies with The Model Code in the Listing Rules of the Financial Services Authority and with The Model Code for Securities Transactions by Directors of Listed Issuers (‘Hong Kong Model Code’) set out in the Rules Governing the Listing of Securities on The Stock Exchange of Hong Kong Limited save that The Stock Exchange of Hong Kong has granted certain waivers from strict compliance with the Hong Kong Model Code, primarily to take into account accepted practices in the UK, particularly in respect of employee share plans. Following a specific enquiry, each Director has confirmed he or she has complied with the code of conduct for transactions in HSBC Group securities throughout 2007. The Directors of HSBC Holdings plc as at the date of this announcement are: S K Green, Baroness Dunn*, Sir Brian Moffat*, M F Geoghegan, Lord Butler*, V H C Cheng, J D Coombe†, J L Durán†, R A Fairhead†, D J Flint, W K L Fung*, J W J Hughes-Hallett†, W S H Laidlaw†, Sir Mark Moody-Stuart†, G Morgan†, S W Newton†, S M Robertson† and Sir Brian Williamson†. * Non-executive Director † Independent non-executive Director The Group Audit Committee has reviewed the annual results for 2007.

– 43 –
HSBC Holdings plc
Additional Information
(continued)________________________________________________________________________________ 18. Annual Review and Annual Report and Accounts The Annual Review 2007 and/or Annual Report and Accounts 2007 will be mailed to shareholders on or about Thursday 3 April 2008. Copies may be obtained from Group Communications, HSBC Holdings plc, 8 Canada Square, London E14 5HQ, United Kingdom; Group Communications (Asia), The Hongkong and Shanghai Banking Corporation Limited, 1 Queen’s Road Central, Hong Kong; Internal Communications, HSBC – North America, 26525 N Riverwoods Boulevard, Mettawa, Illinois, 60045,USA; Direction de la Communication, HSBC France, 103 avenue des Champs Elysées, 75419 Paris Cedex 08, France; or from the HSBC Group website – www.hsbc.com. Chinese translations of the Annual Review and Annual Report and Accounts may be obtained on request from Computershare Hong Kong Investor Services Limited, Hopewell Centre, Rooms 1806-07, 18th Floor, 183 Queen’s Road East, Hong Kong. A French translation of the Annual Review may be obtained on request from Direction de la Communication, HSBC France, 103 avenue des Champs Elysées, 75419 Paris Cedex 08, France. The Annual Report and Accounts will be filed with the United States Securities and Exchange Commission. The Annual Review and Annual Report and Accounts will be available on the Stock Exchange of Hong Kong’s website – www.hkex.com.hk. Custodians or nominees that wish to distribute copies of the Annual Review and/or Annual Report and Accounts to their clients may request copies for collection by writing to Group Communications at the address given above. Custodians and nominees will need to request copies of the Annual Review 2007 and/or Annual Report and Accounts 2007 no later than 10 March 2008. 19. Annual General Meeting The 2008 Annual General Meeting of the Company will be held at the Barbican Hall, Barbican Centre, London EC2 on Friday 30 May 2008 at 11 am. Notice of the meeting will be mailed to shareholders on or about Thursday 3 April 2008. 20. Interim results for 2008 The interim results for the six months to 30 June 2008 will be announced on Monday 4 August 2008.

– 44 –
HSBC Holdings plc
Additional Information
(continued)________________________________________________________________________________ 21. Proposed interim dividends for 2008 The Board has adopted a policy of paying quarterly interim dividends on the ordinary shares. Under this policy it is intended to have a pattern of three equal interim dividends with a variable fourth interim dividend. It is envisaged that the first interim dividend in respect of 2008 will be US$0.18 per ordinary share. The proposed timetables for the dividends in respect of 2008 are: Interim dividends on the ordinary shares for 2008 First Second Third Fourth
Announcement 6 May 2008 4 August 2008 3 November 2008 2 March 2009
ADSs quoted ex-dividend in New York 21 May 2008 20 August 2008 19 November 2008 18 March 2009
Shares quoted ex-dividend in London, Hong Kong and Bermuda 21 May 2008 20 August 2008 19 November 2008 18 March 2009
Record date and closure of Hong Kong Overseas Branch register of shareholders for one day 23 May 2008 22 August 2008 21 November 2008 20 March 2009
Shares quoted ex-dividend in Paris 26 May 2008 25 August 2008 24 November 2008 23 March 2009
Payment date 9 July 2008 8 October 2008 14 January 2009 6 May 2009 22. News release Copies of this news release may be obtained from Group Communications, HSBC Holdings plc, 8 Canada Square, London E14 5HQ, United Kingdom; Group Communications (Asia) The Hongkong and Shanghai Banking Corporation Limited, 1 Queen’s Road Central, Hong Kong; Group Public Affairs, HSBC Bank USA, N.A., 452 Fifth Avenue, New York, NY 10018, USA; Direction de la Communication, HSBC France, 103 avenue des Champs Elysées, 75419 Paris Cedex 08, France. The news release will also be available on the HSBC Group website – www.hsbc.com.

– 45 –
HSBC Holdings plc
Additional Information
(continued)________________________________________________________________________________ 23. For further information contact: London Hong Kong Richard Beck David Hall Group Communications Director Head of Group Communications (Asia) Telephone: +44 (0)20 7991 0633 Telephone: +852 2822 1133 Danielle Neben Gareth Hewett Manager Investor Relations Senior Manager, External Relations Telephone: +44 (0)20 7992 1938 Telephone: +852 2822 4929 Chicago Paris Lisa Sodeika Chantal Nedjib Executive Vice President, Managing Director, Corporate Communications Corporate Affairs Telephone: +33 1 40 70 7729 Telephone: +1 847 564 6394 Linda Recupero Gilberte Lombard Executive Vice President, Investor Relations Director Group Public Affairs Telephone: +33 1 40 70 2257 Telephone: +1 212 525 3800 By Order of the Board R G Barber Group Company Secretary 3 March 2008