hret hiin clabsi virtual event hiin clabsi virtual event. 1. december 14, 2017. clabsi prevention is...
TRANSCRIPT

HRET HIIN CLABSI Virtual Event
1
December 14, 2017
CLABSI Prevention is a 24 Hour Sport

WELCOME AND INTRODUCTIONS
2
Nerissa Legge, Program Manager| HRET
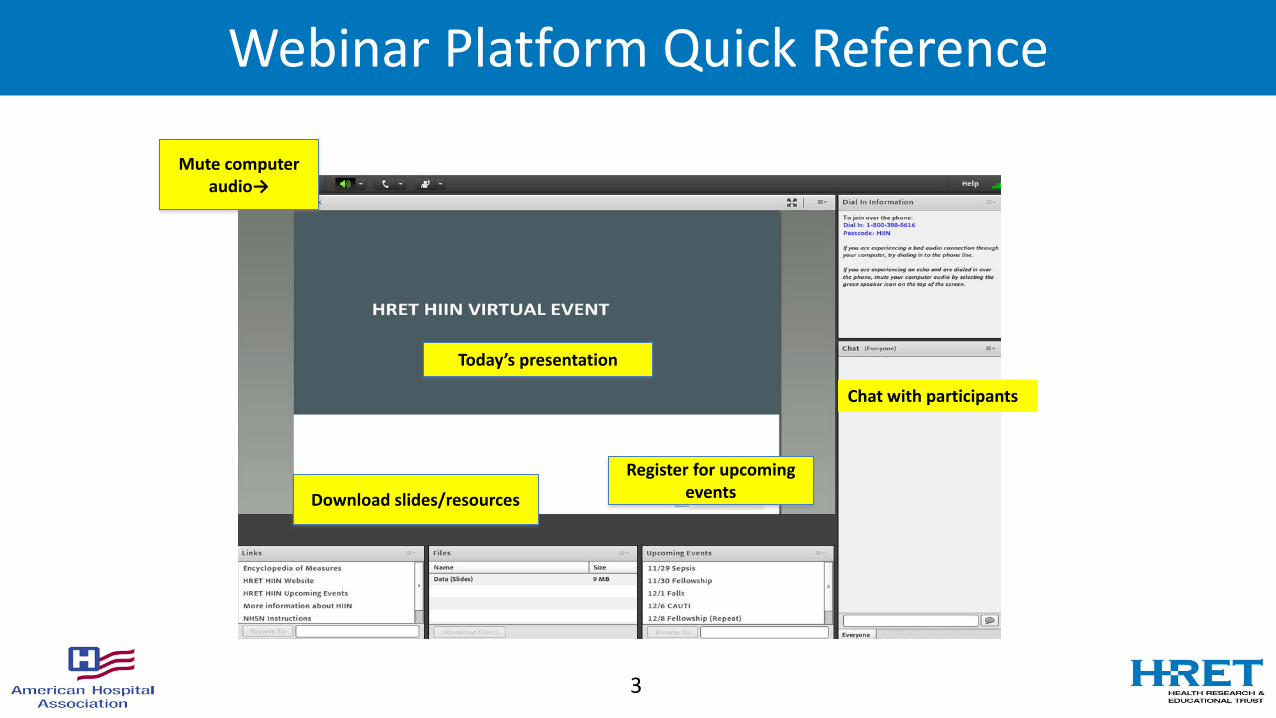
Webinar Platform Quick Reference
3
Mute computer audio→
Today’s presentation
Download slides/resources
Register for upcoming events
Chat with participants

Agenda for Today
4

DATA OVERVIEW
5
Richard Rodriguez, Data Analyst| HRET

CLABSI Rate Data
6
0.0
0.2
0.4
0.6
0.8
1.0
1.2
1.4
1.6
1.8
2.0
BL 2016-10 2016-11 2016-12 2017-01 2017-02 2017-03 2017-04 2017-05 2017-06 2017-07 2017-08 2017-09
CLABSI Rate - AllCLABSI Rate - ICUs
BL 2016-10 2016-11 2016-12 2017-01 2017-02 2017-03 2017-04 2017-05 2017-06 2017-07 2017-08 2017-09Relative reduction,
baseline to Oct '16 - Aug '17
CLABSI Rate - All 0.91 0.73 0.79 0.77 0.71 0.76 0.66 0.78 0.68 0.80 0.78 0.75 0.72 -18.1%
% of hospitals reporting 93% 93% 92% 93% 92% 92% 92% 91% 90% 88% 81% 70% 49% --
CLABSI Rate - ICUs 1.10 0.90 0.93 0.82 0.85 0.83 0.83 0.91 0.81 0.98 0.96 0.90 0.89 -19.7%
% of hospitals reporting 94% 94% 93% 93% 93% 93% 93% 92% 91% 90% 84% 73% 53% --
Data submission represents percentage of hospitals expected to report data for the measure, that have baseline AND at least one month of data between October 2016 and September 2017.Results for months where data submission is below 50% should be interpreted with caution. Data are suppressed for months where submission is less than 30%.

Central Line Utilization Data
7
0.0
5.0
10.0
15.0
20.0
25.0
30.0
35.0
40.0
45.0
50.0
BL 2016-10 2016-11 2016-12 2017-01 2017-02 2017-03 2017-04 2017-05 2017-06 2017-07 2017-08 2017-09
Central line utilization - All Central line utilization - ICUs
BL 2016-10 2016-11 2016-12 2017-01 2017-02 2017-03 2017-04 2017-05 2017-06 2017-07 2017-08 2017-09Relative reduction,
baseline to Oct '16 - Aug '17
Central line utilization - All 18.92 18.59 18.20 17.84 17.65 17.62 17.76 17.74 17.51 17.23 16.94 17.12 17.76 -6.6%
% of hospitals reporting 93% 93% 93% 93% 93% 92% 92% 91% 90% 88% 80% 70% 49% --
Central line utilization - ICUs 40.59 39.15 39.71 39.29 39.38 39.91 39.67 39.46 38.25 37.60 37.06 36.94 37.40 -4.4%
% of hospitals reporting 93% 93% 93% 93% 93% 93% 92% 92% 90% 89% 83% 72% 53% --
Data submission represents percentage of hospitals expected to report data for the measure, that have baseline AND at least one month of data between October 2016 and September 2017.
Results for months where data submission is below 50% should be interpreted with caution. Data are suppressed for months where submission is less than 30%.

CLABSI SIR Data
8
0.0
0.2
0.4
0.6
0.8
1.0
1.2
1.4
1.6
1.8
2.0
BL 2016-10 2016-11 2016-12 2017-01 2017-02 2017-03 2017-04 2017-05 2017-06 2017-07 2017-08 2017-09
CLABSI SIR - all (NHSN only) CLABSI SIR - ICUs (NHSN only)
BL 2016-10 2016-11 2016-12 2017-01 2017-02 2017-03 2017-04 2017-05 2017-06 2017-07 2017-08 2017-09Relative reduction,
baseline to Oct '16 - Aug '17
CLABSI SIR - all (NHSN only) 0.96 0.83 0.85 0.84 0.78 0.84 0.75 0.84 0.72 0.87 0.89 0.85 0.79 -14.0%
% of hospitals reporting 80% 80% 79% 79% 80% 80% 80% 79% 77% 76% 72% 62% 47% --
CLABSI SIR - ICUs (NHSN only) 0.99 0.91 0.89 0.81 0.82 0.84 0.85 0.89 0.76 0.93 0.93 0.91 0.85 -12.4%
% of hospitals reporting 86% 86% 85% 84% 85% 84% 84% 84% 82% 81% 77% 67% 51% --
Data submission represents percentage of hospitals expected to report data for the measure, that have baseline AND at least one month of data between October 2016 and September 2017.
Results for months where data submission is below 50% should be interpreted with caution. Data are suppressed for months where submission is less than 30%.

Today’s facilitators
Barbara DeBaun, RN, MSN, CIC Maryanne Whitney, RN, CNS, MSN
9

Polling Question
• Do you believe that central line insertion and maintenance practices at your facility are a “little different” on weekends or holidays?
• Yes• No
10

Variation in Practice: what to do?
11

CLABSI Prevention is a Team Sport
12

Polling Question
• At my facility, we conduct active and purposeful rounding:
• Every day, every shift, in a reliable way• Monday – Friday, day shift only• Rarely, due to ‘competing priorities’• Hardly ever
13

UMCNO HOSPITAL STORY ERICA PRUITT
14

Meet University Medical Center New Orleans
15
1736 1832 1939 2005 2006 201317851743
L’Hospital Des Pauvres De La
Charite founded.
Second Hospital Building completed.
Fifth hospital built and managed by the Sisters of Charity.
Management change to a not-for-profit,
Public/Private partnership operated by UMCMC.
Third hospital built and renamed “San Carlos Hospital” in honor of the King of
Spain.
Sixth hospital opens; 2,680-bed facility is nation’s second largest.
Hurricane Katrina strikes in August.
Renovated University Hospital becomes the Interim LSU Public
Hospital
Mobile tent hospital opens in October.
2015
Opened Aug 1, 2015

UMCNO Overview
• Reviews of Structure, Process and Data– Nursing Practice– Infection Control– Environment of Care– Culture– Resident and Faculty Practice– Supplies– Role of Quality Staff Department– Executive Team
16

Project Leadership and Team Members
HEN Participants and Contact InfoProject Leadership:• Project Leader: Patient Safety Officer, Dir Quality• Exec Sponsor: CMO• MD Champion(s): ED & Critical Care Medical DirectorsTeam Members:• Quality Department: Director & PI Statistical Analyst• Director IV Team, Member• RN BSN IV Team, Member• RN Nurse PI Analyst, Member• MD Medical Director Critical Care, Member• MD Resident, Member• Infection Control Officer, Member
Central Line Blood Stream Infection Project Summary
Problem Statement(s)47 % of Hospital acquired infected lines during 2016 were not optimal placement.
17% of all central lines audited were not compliant with optimal low risk site choice.
Key medical staff partner(s) absent.
Education of Residents for optimal insertion was not standardized.
Initiative ScopeCentral lines inserted while in the hospital eligible for public reporting through the CDC.
INITIATIVE TITLE: Central Line Associated Blood Stream Infection (CLABSI) Improvement Project
Data Collection/Review
Data collection was performed by RN Quality Analyst through chart reviews and direct observation. Central Line data review was conducted by infection control officer (ICO). Validation of outcomes performed by Infection Control and external validation by the Department of Health and Hospitals Office of Public Health.

Root Causes Identified
HEN Participants and Contact Info• The insertion site with the most site choice fails was the Right Internal Jugular (RIJ). There were also fails in the left internal jugular and right femoral sites. Most fails were in the Emergency Department and the Intensive Care Units (where the majority of central lines are placed).
• Potential Root Causes• Residents are more comfortable with the process of placing
central lines in the IJ than other sites• It is faster to place an IJ central line than a subclavian central
line• The possibility for more mechanical failures in the subclavian
site may discourage clinicians from choosing the subclavian site
• Placement process not standardized
Results To Date
Lessons Learned
• Compliance with and understanding of protocols and procedures were greatly increased with the expanded Infection Control Officer rounding schedule as well as daily huddles. Partnership with Key Medical Staff Leaders in ED and ICU were critical.
What was Implemented
HEN Participants and Contact Info• Medical Staff Partnership established: Although subclavian placement is
preferable to IJ in reducing infections, this was not the main cause of UMC CLABSIs. While UMC encourages subclavian placement when appropriate, discussions about insertions with physicians, residents, infection control, and nursing also covered aseptic technique and need for central line/ reducing central line days. Resident Training focus.
• Infection Control Officers rounding on off hours and weekends. ICOs looked for proper maintenance of central lines and provided real time education for staff and patients.
• ICOs began attending unit staff meetings to discuss information related to central lines and other infections.
• Each unit began participating in daily unit and hospital safety huddles where staff are expected to discuss which patients have central lines, why they are needed, when they can come out and any other relevant information.
• Nurses performed monthly audits on compliance with patient education regarding ongoing line necessity and CLABSI prevention.
BaselinePerformance
Goal CurrentPerformance
Jan – Jul 2016 13 CLABSIs
0 CLABSIs Jan – Sep 2017 0 CLABSIs
Project Metrics
0.472
1.367
0.958
0 0.000 0.000 0.000.000
0.200
0.400
0.600
0.800
1.000
1.200
1.400
Q1 2016 Q2 2016 Q3 2016 Q4 2016 Q1 2017 Q2 2017 Q3 2017
SIR
CLABSI Standardized Infection Ratio (Actual/Expected)
UMC CLABSI SIR CMS 50th Percentile CMS 90th Percentile
University Medical Center New Orleans | www.UMCNO.org
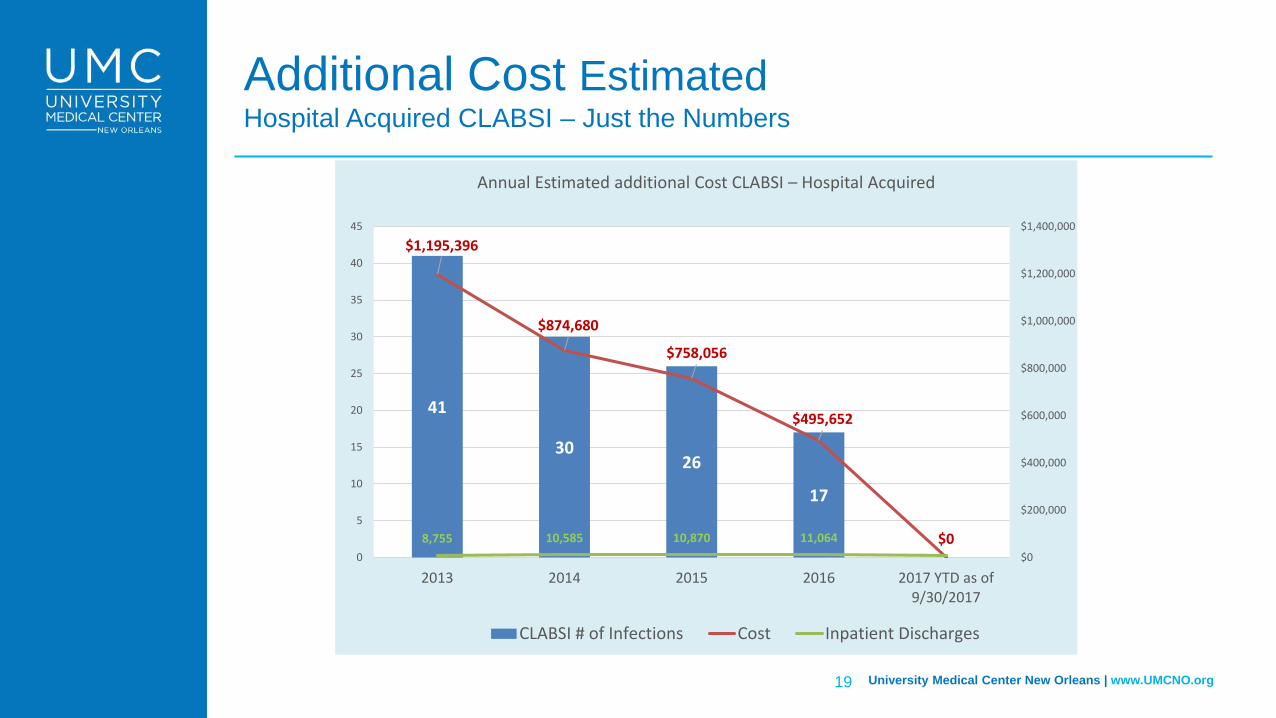
Additional Cost Estimated Hospital Acquired CLABSI – Just the Numbers
19
41
3026
17
0
$1,195,396
$874,680
$758,056
$495,652
$08,755 10,585 10,870 11,064$0
$200,000
$400,000
$600,000
$800,000
$1,000,000
$1,200,000
$1,400,000
0
5
10
15
20
25
30
35
40
45
2013 2014 2015 2016 2017 YTD as of9/30/2017
CLABSI # of Infections Cost Inpatient Discharges
Annual Estimated additional Cost CLABSI – Hospital Acquired
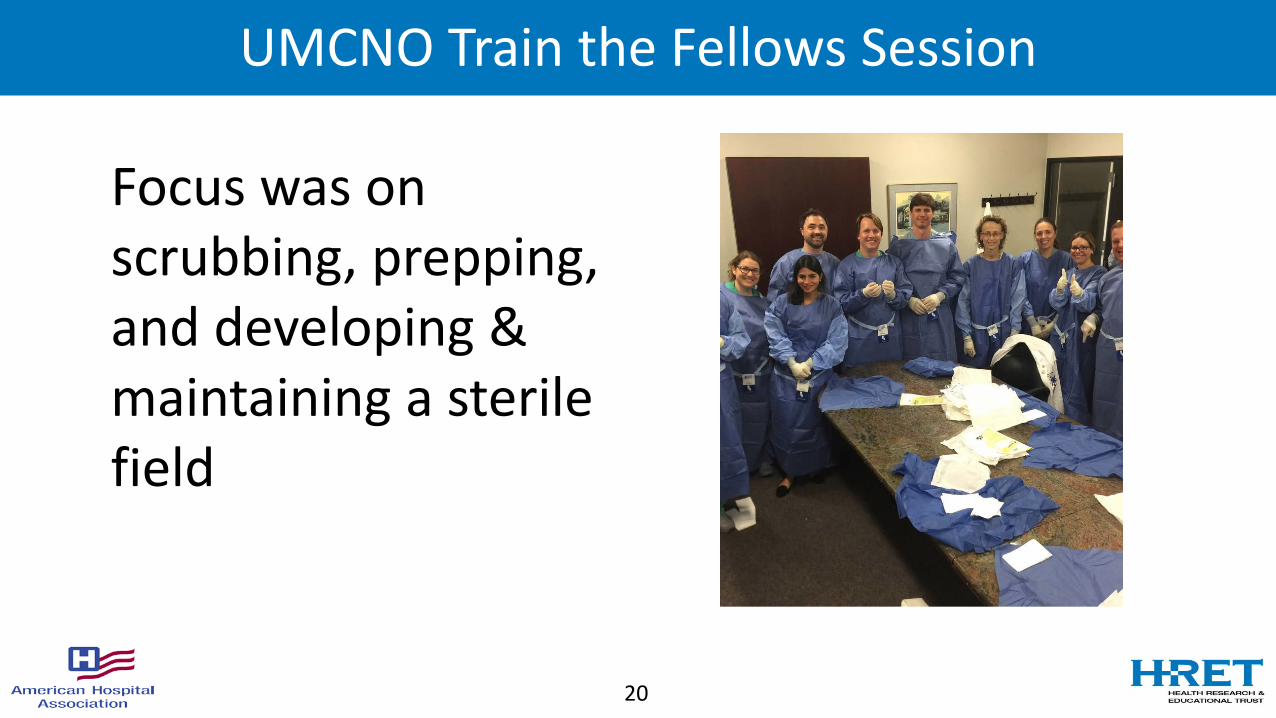
UMCNO Train the Fellows Session
20
Focus was on scrubbing, prepping,and developing & maintaining a sterile field

Preparing a Central Line Tray
21
We used a fluorescent Woods light to search for contamination of the gown, gloves, or sterile field

UMCNO Overview • Infection Control Officers
• Vanessa Bergeron RN• Cathy Lopez RN• Karen Furbert RN• Regularly interact with staff on weekdays,
weekends, off hours (including nights), and Holidays.
- On-the-spot support and re-direction- Participation in Safety Huddles- All patient areas rounding- Department meetings- Daily review of blood culture results- Partner with key Physicians- Executive Team Rounds together
22

Team Work
• What we learned:– Improvements have been incremental, WE NEED TO BE PATIENT– Find the failures most directly related to the outcomes– Build teams, trust, listen, respect each other– Failure to include all stakeholders will likely result in no progress after
a lot of work– Be honest about opportunities
23
Next Steps
24

LISTSERV
• Join the LISTSERV® – Ask questions– Share best practices, tools and resources– Learn from subject matter experts– Receive follow up from this event and notice of
future events
Sign up at http://www.hret-hiin.org/engage/listserv.shtml
25

Thank You!
Find more information on our website: www.hret-hiin.org
Questions or Comments: [email protected]
26