hr final -...
TRANSCRIPT

11/29/12
1
Preventable Hospital Readmissions: Prediction and Prevention } Jan Berger, MD, MJ, Chief Medical Officer, Silverlink Communications
Understanding and Preventing Surgical Readmissions: A Surgeon’s Perspective } John F. Sweeney, MD, FACS, W. Dean Warren Distinguished Professor of Surgery Chief, General and Gastrointestinal Surgery, Emory University Hospital Health Plan Tactics For Reducing Medical and Surgical Unplanned Readmissions } Linda Weiland, VP, Provider Network Innovation and Partnerships, Highmark Inc. } Andrew Bloschichak, MD, Senior Medical Director, Quality & Medical Performance Management, Highmark, Inc.
Final Comments – Strategies for Going Forward } Allen Grimes, Jr. MD, FACS, Regional Medical Director, Health Guidance Organization, Humana
Wrap up and Discussion } Liza Greenberg, RN, MPH, AAPPO Moderator
JAN BERGER, MD, MJ
Preventable Hospital Readmissions: Prediction & Prevention
Chief Medical Officer Silverlink Communications, Inc.
November 26, 2012
This is Not a Single Stakeholder Issue
4
Hospital Readmissions Remain a Challenge
5
$15B
49.5%
$11,300 Opportunity to reduce costs – for Medicare alone
Readmitted within 7 days
Average cost per Medicare hospital stay
20% Medicare members readmitted within 30 days
0 2 4 6
8 10
12 14
16 18
20
0 5 10 15 20 25 30 35
Percent of Readmissions Percent of Potentially Avoidable Readmissions
Days Following Discharge
Perc
ent o
f Pat
ient
s R
eadm
itted
Source: Medicare Payment Advisory Commission. 2007. Report to the Congress: Promoting Greater Efficiency in Medicare. Washington, DC: Medicare Payment Advisory Commission, p. 107; the percent of potentially avoidable readmissions was estimated using 3M software and 2005 Medicare claims data
Readmission Rates for Medicare Beneficiaries
A Percentage of Readmissions are Avoidable
6
16.7% or less
16.8%-19%
19% or more
Readmission Rates by State
Source: 2007 Medicare SAF data
There are Geographic Variations in Hospital Readmissions
7
Unplanned Readmissions Related to Initial Stay Likely Offer Best Opportunity for Savings & Care Improvement
Related to Initial Admission
Unrelated to Initial Admission
Planned Readmission
A planned readmission for which the reason for readmission is related to the reason for the initial
admission.
A planned readmission for which the reason for readmission is not related
to the reason for the initial readmission.
Unplanned Readmission
An unplanned readmission for which the reason for readmission is related to the reason for the initial admission.
An unplanned readmission for which the reason for readmission is not related to the reason for the initial admission.
8 Source: American Hospital Association
Hospital Readmissions Becomes an Increasingly Important Star Measure
9
STARS CUT POINTS
1 >32% 2 >17% to<=32% 3 >12% to <=17% 4 >5% to <=12% 5 <=5%
" Measure: Readmission to a hospital within 30 days of being discharged
" Description: % of seniors (65+) members discharged from a hospital stay or readmitted within 30 days for the same condition as their recent hospital stay or a different one.
" Risk Adjustment: Rate of readmission takes into account how sick patients (age, gender, discharge condition, comorbidity) were when they went into the hospital the first time to make comparisons among plans meaningful.
" Age Bands: 65-74, 75-84, 85+
" Weight: 3
All Medicare Advantage plans also need to submit a QIP focused on All Cause Readmission to CMS for 2012. Cost savings potential is very significant at $11.3K per Medicare discharge.

11/29/12
2
It Has Caught the Hospital’s Attention: It Goes Beyond Star…. § Voluntary reporting began in 2009
§ Section 3025 of ACA; Hospital Readmissions Reduction Program
§ Hospitals’ financial risk program kicked off Oct 1, 2012 with a 1% inpatient payment risk
§ Risk escalates up to 3% by Oct 1, 2014
§ Focus begins with heart attacks, pneumonia and heart failure
10
What is Going Wrong?
§ Lack of patient understanding of medical issue
§ Confusion around medications
§ Lack of appropriate inpatient staff “hand off” to ambulatory providers
§ Follow-up visits not scheduled
§ Lack of appropriate caretaker support for follow up
§ Psycho-social issues not identified and addressed
11
Hospital-Based Interventions
12
While Care Transitions Programs Aim to Reduce Readmissions – There are Gaps
13
Address only a portion of the
population Focus on
medical issues Assume physician
knowledge
Reliance on predictive models
Focus on the discharge
process at the time of discharge
Predicting the Risk of Hospital Readmissions: Easier Said Than Done
Objective: Synthesize the available literature on validated readmission risk prediction models, describe their performance, and assess their suitability for clinical or administrative use.
JAMA, 2011; 306(15): 1688-1698
Risk Prediction Models for Hospital Readmissions: A Systematic Review
14 Kansagara, JAMA, 2011
§ Models developed for hospital comparison and clinical intervention purposes
§ Most models in both categories perform poorly
§ Most models have relied on comorbidity and utilization data
§ Few models have examined social determinant variables
Addressing the Entire Population Through Innovation and Integration with Care Management
15
Technology-Assisted Nurse Interventions
Technology Interventions
Consistency, Auditability, Scale
Highest-Risk Patients
High-Risk Patients identified via technology and triaged to humans
Technology improves outcomes in scale for the
“engage-able” population
Low-risk & low engagement Lower Effort Technology Interventions
Nurse-Patient Interventions
Engage All Patients on All Major Areas of Risk
§ Clinical
§ Family / caregiver
§ Financial
§ Psycho-social
16
Scale and Triage Post-Hospital Discharge Processes
17
Post
-Hos
pita
l Dis
char
ge
§ 29% of patients responding to post-discharge survey had at least one issue that requires care management follow-up
§ 50% of those who were identified with a readmission risk factor would have been missed through the client’s predictive model.
Haven't filled Rx 31%
Need help around the house
19% Financial barriers
to care 15%
Needs same day follow up with care manager
13%
No follow up with provider
11%
Need transportaCon
11%
62%
71%
0%
20%
40%
60%
80%
Medicare Commercial
Post-‐Discharge Survey CompleCon

11/29/12
3
Risk Factors for 30-day Hospital Readmission in General Surgery Patients
John F. Sweeney, MD W. Dean Warren Distinguished Professor Chief of General and Gastrointestinal Surgery Vice Chair for Clinical Affairs Chief Quality Officer Department of Surgery
Framing the Problem ���
• CMS began reporting readmission rates in 2009
• Affordable Care Act – Section 3025
• CMS proposed methodology for adjusting hospital reimbursements based on readmission rates
• Affordable Care Act upheld as constitutional by US Supreme Court June 28, 2012
• Door is now wide open for CMS to begin enforcing Section 3025.
Developing a Strategy���
• EUH readmission rate above UHC median
• General Surgery contributor
• Reviewed 6 month time frame of General Surgery readmissions from UHC databases Heterogeneous population Difficult to draw conclusions/identify areas for
improvement
• Needed new strategy ���
Developing a Strategy���
PROCEDURE CPT CODE COLECTOMY+/-‐ COLOSTOMY 44140-‐44160,44188,44204-‐44208, 44210-‐44213,
44227, 44238
SMALL INTESTINE RESECTION 44187, 44202-‐44203, 44227, 44238, 44120-‐44121, 44125-‐44128, 44130
CHOLECYSTECTOMY/INPATIENT 47562-‐47564, 47579, 47600, 47605, 47610, 47612, 47620
CHOLECYSTECTOMY/OUTPATIENT 47562-‐47564, 47579, 47600, 47605, 47610, 47612, 47620
PANCREATECTOMY 48140, 48145-‐48146, 48148, 48150, 48152-‐48155, 48160
APPENDECTOMY 44955,44970, 44979, 44950-‐44960 BARIATRIC SURGERY 43644-‐43645, 43770-‐43774, 43842-‐43848,
43886-‐43888, 43800, 43651-‐43652, 43659
PROCTECTOMY +/-‐ COLECTOMY +/-‐ ANASTOMOSIS 44155, 44157-‐44158, 44212, 45110-‐45114, 45116, 45119-‐45121, 45123, 45395, 45397
LYSIS OF ADHESIONS 44005, 44180 LIVER RESECTION 47120, 47122, 47125, 47130
Procedure Over
72 hours within
72 hours Total
Encounters
72hour to 30 day re-‐admission
rate
72 hour re-‐admission
rate
Total re-‐admission
rate
CHOLECYSTECTOMY/IN&OUT 12 5 500 2.40% 1.00% 3.40%
COLECTOMY COLOSTOMY 21 11 263 7.98% 4.18% 12.17%
BARIATRIC SURGERY 6 2 255 2.35% 0.78% 3.14%
APPENDECTOMY 2 5 214 0.93% 2.34% 3.27%
DRAIN PERITONEAL ABSCESS/NOT APPENDICEAL 34 3 212 16.04% 1.42% 17.45%
SMALL INTESTINE RESECTION 18 7 171 10.53% 4.09% 14.62%
VENTRAL HERNIA REPAIR 14 1 167 8.38% 0.60% 8.98%
PARATHYROIDECTOMY 2 1 151 1.32% 0.66% 1.99%
PANCREATECTOMY 16 3 134 11.94% 2.24% 14.18%
LIVER RESECTION 4 2 98 4.08% 2.04% 6.12%
J Am Coll Surg 2012;215:322-330

11/29/12
4
Risk Factors for 30-day Hospital Readmission in General Surgery Patients
���
• Link EUH NSQIP data to Emory CDW to identify all readmissions – 2242 patients from 2009-2011 – 182 patients readmitted
• Recognize that some readmissions elsewhere might not be captured
• Patient profile
• Procedure Profile
• Role of Complications in readmissions ���
Risk Factors for 30-day Hospital Readmission in General Surgery Patients
���
Risk Factors for 30-day Hospital Readmission in General Surgery Patients
��� ���
• Preoperative characteristics associated with readmission – Diabetes – Tobacco abuse – Dyspnea – Disseminated Cancer – Open Wound – Chronic Steroids – Unintended weight loss – Acute Renal Failure – Vent Dependent
���
P < 0.05
Risk Factors for 30-day Hospital Readmission in General Surgery Patients
���
Leveraging Investments in Quality to Enhance HSR:Readmission Project ���
Risk Factors for 30-day Hospital Readmission in General Surgery Patients
��� ���
Risk Factors for 30-day Hospital Readmission in General Surgery Patients
���
• Profile of high risk patient identified – Patient Characteristics – Operative Procedure
• Complications are significant drivers
• In general operations are planned interventions
• Implement protocols and pathways
• Enhance transitions of care coordination ���
Thank You Questions?

11/29/12
5
Engaging Providers in Improvement: Outcomes of a Pay-for-Performance
Readmission Reduction Program
Linda R. Weiland Vice President, Provider Network Innovation & Partnerships Andrew Bloschichak, MD Senior Medical Director, Quality & Medical Performance Management
@COPYRIGHT Highmark Inc. 2011. All rights reserved. This information is confidential to Highmark Inc. and cannot be copied or distributed without permission of Highmark Inc.
Highmark Overview
Membership: 4.8 million members Operating Markets: W. Pennsylvania, C. Pennsylvania, West Virginia and Delaware Claims processed: > 201+ million per year Employees: 22,000 employees Corporate social mission: $150 million for programs in support of the mission Number of Accounts: 22,595
Why Pay-for-Performance?
39
• Quality Improvement with savings
• Escalating consumer demand for high quality safe care that is cost effective
• Align payment for the delivery of evidenced-based care
• Means to align provider reimbursement with performance
Sustained Quality
Performance Efficiency
Member Value
Quality Blue Hospital Pay-for-Performance Program
FY 2002 • 6 participating hospitals
FY 2012 • 79 participating hospitals
FY 2013 • 92 participating hospitals
40 41
Program Structure
• Level I: 1 Indicator • Level II: 2 Indicators • Level III: 4 Indicators
Program Levels
• Level 1: 1% • Level 2: 2% • Level 3: 3%
Reimbursement at Risk
• Provider reported • Nine month program year
Program Data
• Hospital Efficiency • Infection Prevention • Process of Care
Categories
• Planning • Action • Measurement • Results • Critical Analysis
Evaluation
Quality Blue FY 2013 Program Indicators
42
Hospital Efficiencies • ED Throughput • Readmissions • Imaging Efficiency
(New)
Infection Prevention • Surgical Safety • MRSA • CDI • IP-GNR • Device-Associated
(New/Level III only)
• CLABSI (Level I & II only)
• CAUTI (Level I & II only)
Process of Care • Perinatal • GWTG®-Stroke • VTE Prevention • Diabetes • GWTG®-Heart Failure • Palliative Care • Sepsis
Engaging Providers in Improvement: Outcomes of a Pay-for-Performance
Readmission Reduction Program
@COPYRIGHT Highmark Inc. 2011. All rights reserved. This information is confidential to Highmark Inc. and cannot be copied or distributed without permission of Highmark Inc.
Why Readmissions?
44
2007 MedPAC Report to Congress
NEJM Jencks 2009 Article
AHRQ 2010 Report
(Medicare Payment Advisory Commission, 2007)
(Jencks, Williams, & Coleman, 2009)
(Jiang & Wier, 2010)
17.6% of Medicare admissions resulted in readmissions within 30 days $15B in spending $12B for potentially preventable readmissions
1 in 5 Medicare patients readmitted within 30 days 50.2% of patients readmitted had no physician visit between discharge and readmission
1 in 10 non-obstetric Medicaid patients (age 21-64) hospitalized in 2007 for a medical condition had at least one readmission within 30 days
CMS Penalties for High Readmissions
• As of October 1, 2012, CMS has initiated penalties to hospitals exceeding expected readmission limits • FFY 2013 Penalty: Up to 1% of CMS Reimbursements • Over 2,200 (67%) of nation’s hospitals been penalized
278
1933
1156
# Hospitals Receiving CMS Penalties for Readmits
Max Penalty: 1% Other Penalty: <1% No Penalty

11/29/12
6
Poor Coordination
of Care & Quality Issue
Defects in Care
Gaps in Transition Planning
Communication Failure
Medication Errors
Delays in Post Discharge
Appointments
Quality Issues Driving Readmissions
46 (Bisognano & Boutwell, 2009)
34 hospitals participating in Readmissions indicator for FY 2012
47
FY 2010 • 22 hospitals • Reduce 7-day and
30-day all-cause readmissions
• Provide and improve coordination of care efforts
• Included maternity and pediatrics
FY 2011 • 31 hospitals • New hospital 2 yr
commitment • PCPI Care
Transitions measures
• Patient assessment • Excluded maternity
and pediatrics
FY 2012 • 33 hospitals; 16
second year • 2 year commitment • PCPI Care
Transition measures scored
• Excluded maternity and pediatrics
Quality Blue Readmissions Indicator Over Time
Readmissions Indicator: 2013 Mandate
• Mandatory Participation for Level II & III • Based upon Highmark Network claims-based IP
readmissions w/in 30 days, all cause, rate • Readmission rates ≥7% mandated • Readmission rates <7% excluded • Maternity and Pediatrics excluded
• Scored Metrics • Decrease 7-day & 30-day readmissions to IP & Obsv
• Defect-free Transition of Care Bundle
• Reconciled medication list upon discharge
• Transition record upon discharge
• Transition record transmitted to facility/provider within 24 hours
• Assess patient’s perceptions of care transition planning
48
FY 2013 • Mandatory for all
Level II & III hospitals
• 63 hospitals participating
• Continued focus on data, care transitions, patient perception and readmit reduction
Understanding the Readmission Population
• Encourage hospitals to examine readmissions to better define their target population • Recommend analysis & identification of:
– Top readmission DRGs
– Top reasons for readmission
– Trends by physician, service, facility
– Trends by day of week, shifts
– Seasonal influences
– Correlations between adverse outcomes & non-compliance with best practices
49 50
20%
16%
15% 9%
8%
7%
7%
3% 3%
3% 3% 2% 2% 2%
30-Day Readmission Top DRGs HF
Sepsis
COPD
Renal Failure
Esophagitis/ Gastroenteritis/Misc Digestive Disorders Others
Pneumonia
Kidney & Urinary Tract Infections
Respiratory Failure/Infections
Cellulitis
Percutaneous CV Proc
Arrthymic Conduct Disorder
Post-Op Infection
Pulmonary Edema * 2011 Program Data
Quality Blue Top Readmission DRGs (2011)
Defect-free Care Transition Bundle
Transmittal within 24 h
Transition of Care Form
Reconciled Med List
Transitions of Care
• Required to sample 7-day readmissions to inpatient & observation status
• Defect-free Care Transition Bundle (AMA/PCPI Care Transitions Measures)
– Patients/Caregivers receive a reconciled med list at discharge
– Patients/Caregivers receive a Transition Record at time of discharge
– Transition Record transmitted to facility or next level provider within 24 hours of discharge
51
52
35.0
20.0
57.6
18.8
82.5
60.4
90.1
58.7
0 10 20 30 40 50 60 70 80 90
100
Reconciled Med List
Trans of Care Record
Transmittal ToC Defect Free Care
Com
plia
nce
(%)
2011 Year End 2012 Year End
136%
188%
56%
212%
Compliance with Transition of Care Bundles 2nd Year Participant Results (17 hospitals)
53
44.5
15.6
49.4
12.4
84.6
59.3
84.1
51.4
0 10 20 30 40 50 60 70 80 90
Reconciled Med List
Trans of Care Record
Transmittal ToC Defect Free Care
Com
plia
nce
(%)
2011 Year End 2012 Year End
90%
279%
70%
315%
Compliance with Transition of Care Bundles 3rd Year Participant Results (10 hospitals)
54
Readmissions Measures: Patient Perception of Transition Planning • Hospitals required to engage their 30-day readmit population to better understand why the
patient felt they were returning to the hospital
• Opportunity for the hospital to hear the patient perspective
• Dialogue that occurs in these interviews help hospitals to learn more about the patient’s comprehension of their disease, their social, economic and personal resources and/or limitations
• Hospitals have expanded these interviews beyond topics of care transitions to include discussion around:
• Diet • Weight management • Medication management

11/29/12
7
Readmissions Analysis
• Hospitals must provide an analysis and/or commentary of the following items:
• Coordination of care throughout the admission
• Interventions implemented to aid in reducing readmissions
• Describe collaborative efforts in reducing readmissions with care providers in community
• Coordination of care for discharge • Transition in Care programs • Medication reconciliation • Other follow-up processes
• Deficiencies of compliance with defect-free care transition bundle
• Describe processes used to identify patients at high risk for readmission
• Results of the patient assessment and how the patient education process was improved
• Describe processes in place for completion of the POLST (PA), POST (WV), MOLST (NY)
55 55
Most Common Interventions Across Quality Blue Hospitals
56
28
2220 20
1715
12 11
0
5
10
15
20
25
30
ECF Collab MultidiscHuddles
Follow-‐up Appt Trans of CareRN
MD DischargeOrders
MDEngagement in
Data
Nurse ReadmitDashboards
Post DC Calls
# H
ospi
tals
Par
ticip
atin
g
Bridging the Gap: Reaching Out to ECFs
• 28 of 33 hospitals actively engaging ECFs / external programs (e.g. SNF, ECF, Home Care, Hospice)
• Meeting Topics Include:
– Quality data – Advanced directives – Palliative care – Care transition forms – Medication reconciliation – Patient diet – Heart failure
57
• Readmit rates • Patient listings • Dashboards • Report cards
Sharing Data
• Members of Hospital Readmit Committee
• RCA of every readmission • Developing care transitions
competencies • Consistent forms • POLST forms • Enhanced communication
Internal Involvement
• Monthly meetings • Quarterly forums • On-site education at ECF
Education
Care Transitions Huddles
• Many hospitals instituting a daily huddle to discuss discharge planning and care transitions
58
Multidisciplinary
• Nursing • Case Management • Social Services • Medical Staff • Pharmacy • Dieticians • Respiratory • Quality/Patient
Safety • Therapies (PT/OT/
Speech)
Huddle Topics
• Care Transitions • Caregiver Support • Medication Mgmt • Discharge Planning • Diet • Readmission Risk
Follow-up Appointments Scheduled Prior to Discharge
59
• Appointments made by: – Nursing, Case Management, Hospitalist, Care Transitions Nurse
• Working with physician practices to block schedule time for chronic patient discharges (CHF, COPD)
• Attempting to arrange CHF visits within 3 days of discharge
Post-Discharge Follow-up Phone Calls
• Phone calls completed by: – Pharmacists, Nursing,
Hospitalists, Transition of Care Nurse, Case Management
• Timeframe for calls: – 24, 48, 72 hours, 5 days, within
30 days • Targeted populations
– CHF, COPD
60
Follow-up Call Foci
General health
Prescriptions filled
Follow-up appt
Pending tests
Medication review
Diet
Weight
Questions
Example Best Practices
Geisinger • Plan for acute care follow up occurs at
time of admission by communicating the patient’s readmission risk score to the PCP in a formal format
• Create post discharge follow up appointment for every patient
• Geisinger community health services has a comprehensive interdisciplinary LIFE Geisinger team to coordinate and/or provide all needed healthcare including primary care and specialist physician services
61 @COPYRIGHT Highmark Inc. 2011. All rights reserved. This information is confidential to Highmark Inc. and cannot be copied or distributed without permission of Highmark Inc.
Conemaugh • Ensure follow-up appointment scheduled
and encourage compliance
• Phone call to patient if not admitted to home health within 24 hours
• Use teach back method with scripting: “I want to be sure I was clear in my explanation. What will you tell your caregiver when they ask what we discussed”
Readmission Rate Reduction
• Hospitals voiced difficulty in ability to reduce readmissions within the 9 month program year
• Despite significant improvement in care transitions, not seeing definitive reduction in readmission rates; Beginning to see stabilization vs. further increase in rates
• Hospitals are provided additional comparative views at program year end to aid in their readmission reduction efforts
– Readmission profiles
– Highmark Quality Blue Readmission Initiative data
62
FY 2012 Readmission Rates
63 Presentation Title or Footnote area
0.0 1.0 2.0 3.0 4.0 5.0 6.0 7.0
05 06 07 12 15 17 18 19 20 22 24 25 26 29 30 31 33 34 37 39 40 41 42 43 45 50 51 52 56 59 64 67 70 82
Rea
dmis
sion
Rat
e
Hospital ID
FY 2012 Readmission Rates for 7-Day Inpatient and Observation by Hospital ID vs. All QB Participating Hospitals - Aggregate
Hospital All QB Participating Hospitals
QB Rate: 4.5
0.0
4.0
8.0
12.0
16.0
20.0
05 06 07 12 15 17 18 19 20 22 24 25 26 29 30 31 33 34 37 39 40 41 42 43 45 50 51 52 56 59 64 67 70 82
Rea
dmis
sion
Rat
e
Hospital ID
FY 2012 Readmission Rates for 30-Day Inpatient and Observation by Hospital ID vs. All QB Participating Hospitals - Aggregate
Hospital All QB Participating Hospitals
QB Rate: 13.5
11/29/12
8
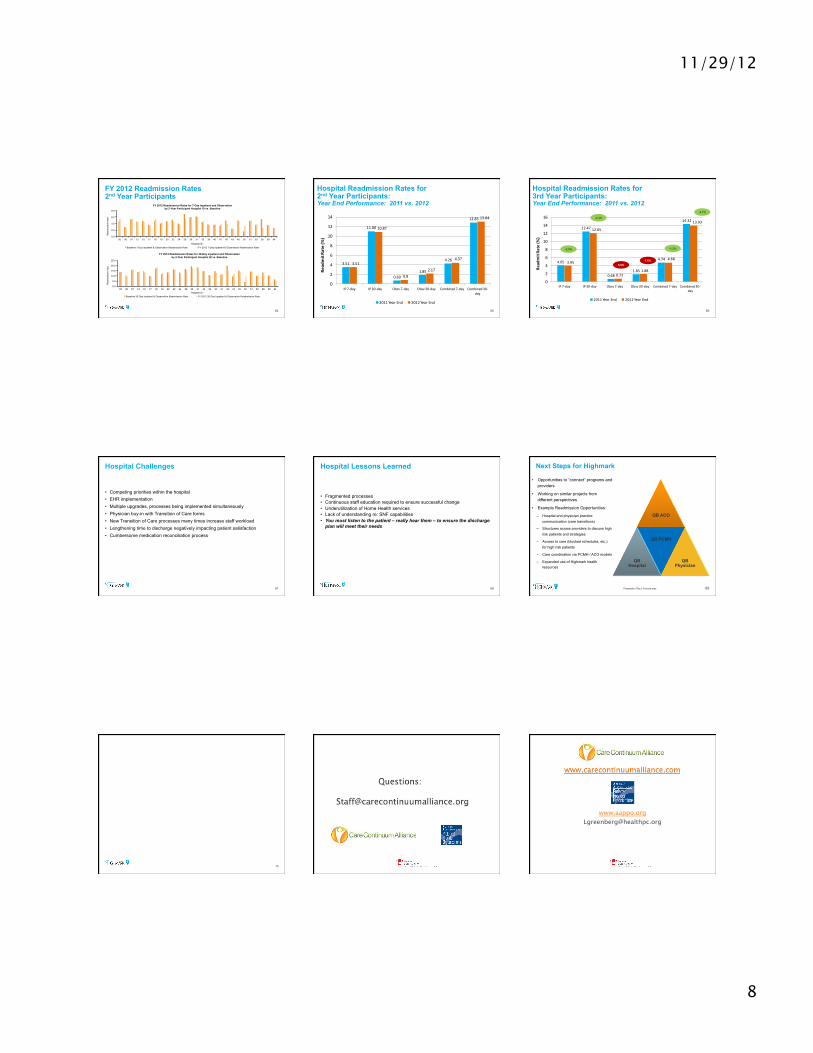
FY 2012 Readmission Rates 2nd Year Participants
64
0.0
2.0
4.0
6.0
8.0
05 06 07 12 15 17 18 19 20 22 24 29 30 31 33 39 40 41 42 43 45 50 51 52 56 59 64
Rea
dmis
sion
Rat
e
Hospital ID
FY 2012 Readmission Rates for 7-Day Inpatient and Observation by 2-Year Participant Hospital ID vs. Baseline
Baseline 7-Day Inpatient & Observation Readmission Rate FY 2012 7-Day Inpatient & Observation Readmission Rate
0.0
5.0
10.0
15.0
20.0
25.0
05 06 07 12 15 17 18 19 20 22 24 29 30 31 33 39 40 41 42 43 45 50 51 52 56 59 64
Rea
dmis
sion
Rat
e
Hospital ID
FY 2012 Readmission Rates for 30-Day Inpatient and Observation by 2-Year Participant Hospital ID vs. Baseline
Baseline 30-Day Inpatient & Observation Readmission Rate FY 2012 30-Day Inpatient & Observation Readmission Rate
Hospital Readmission Rates for 2nd Year Participants: Year End Performance: 2011 vs. 2012
3.51
11.00
0.691.85
4.26
12.85
3.51
10.87
0.82.17
4.37
13.04
0
2
4
6
8
10
12
14
IP 7-‐day IP 30-‐day Obsv 7-‐day Obsv 30-‐day Combined 7-‐day Combined 30-‐day
Read
mit Ra
te (%
)
2011 Year End 2012 Year End
65
Hospital Readmission Rates for 3rd Year Participants: Year End Performance: 2011 vs. 2012
4.05
12.47
0.681.85
4.74
14.32
3.95
12.05
0.721.88
4.68
13.93
0
2
4
6
8
10
12
14
16
IP 7-‐day IP 30-‐day Obsv 7-‐day Obsv 30-‐day Combined 7-‐day Combined 30-‐day
Read
mit Ra
te (%
)
2011 Year End 2012 Year End
66
-2.5%
-3.4%
-1.3%
-2.7%
5.9% 1.6%
Hospital Challenges
• Competing priorities within the hospital • EHR implementation • Multiple upgrades, processes being implemented simultaneously • Physician buy-in with Transition of Care forms • New Transition of Care processes many times increase staff workload • Lengthening time to discharge negatively impacting patient satisfaction • Cumbersome medication reconciliation process
67
Hospital Lessons Learned
68
• Fragmented processes • Continuous staff education required to ensure successful change • Underutilization of Home Health services • Lack of understanding re: SNF capabilities • You must listen to the patient – really hear them – to ensure the discharge
plan will meet their needs
Next Steps for Highmark
QB ACO
QB Hospital
QB PCMH
QB Physician
69 Presentation Title or Footnote area
• Opportunities to “connect” programs and providers
• Working on similar projects from different perspectives
• Example Readmission Opportunities:
– Hospital and physician practice communication (care transitions)
– Structures across providers to discuss high risk patients and strategies
– Access to care (blocked schedules, etc.) for high risk patients
– Care coordination via PCMH / ACO models
– Expanded use of Highmark health resources
Questions?
70
www.aappo.org