hpa-crce-019 - an analysis of radon remediation methods
TRANSCRIPT

HPA-CRCE-019
© Health Protection Agency Centre for Radiation, Chemical and Environmental Hazards Chilton, Didcot, Oxfordshire OX11 0RQ
Approval: May 2011 Publication: May 2011 £21.00 ISBN 978-0-85951-694-5
This report from HPA reflects understanding and evaluation of the current scientific evidence as presented and referenced in this document.
An Analysis of Radon Remediation Methods
S A Hodgson, W Zhang, E J Bradley, B M R Green and N P McColl
ABSTRACT
Radon gas in the home is a major source of public radiation exposure and an established cause of lung cancer. A range of techniques are available to reduce high indoor radon concentrations in homes. Information on some 2,700 radon remediation projects has been analysed with the aim of identifying the factors that influence the performance of various remediation methods, including the specific remediation techniques applied, the physical characteristics of the home, the radon level before remediation and who carried out the work.
The analysis shows that each method used to reduce radon levels has a range of performance which is influenced by some factors but is independent of others. Each remediation method showed a trend in performance with respect to the initial radon concentration. Higher initial radon concentrations offer greater relative reductions when remediated. However, homes with higher initial concentrations measures were less likely to achieve reductions below the Action Level (200 Bq m-3). Overall, an active sump system is most likely to offer a substantial reduction, on average 6 fold. Other methods are less effective, reducing levels by a typical factor of about 2. Passive ventilation and sealing are least effective. This analysis does not support firm conclusions about the relative performance of different types of remediators and householders who do ‘DIY’. Typical costs have been estimated with active sumps being the most expensive at around £800.
This information will be used to update guidance for householders and others such as contractors, using fact sheets, presentations at radon householder events and the UKradon website.


iii
CONTENTS
1 Introduction 1
2 Data collection 2 2.1 Radon measurements 2 2.2 Methods of radon reduction 3 2.3 House details 3 2.4 Contractor experience and costs 4
3 Data, definitions and analysis 4 3.1 The overall dataset 4 3.2 Definitions and dose conventions 5
3.2.1 Effectiveness 5 3.2.2 Dose convention and potential for dose saving 6
3.3 Analysis method 7
4 Results 7 4.1 Effect of remedial method 7
4.1.1 Performance of remediation methods: single compared with combinations 10
4.1.2 Reductions using multiple attempts 12 4.2 Effect of initial radon concentration 13 4.3 Effect of house characteristics 15
4.3.1 Effects of different house types 16 4.3.2 Effects of the date of build 16 4.3.3 Effects of the number of floors and basements 16 4.3.4 Effects of double glazing 16 4.3.5 Effects of floor type 17 4.3.6 Effects of heating method 17
4.4 Effect of different contractor types 17 4.4.1 Contractor type 17 4.4.2 Individual contractors 19
4.5 Costs of remediation 19
5 Discussion 22 5.1 Is remediation effective? 22 5.2 The performance of remediation methods 22
5.2.1 Active sumps 22 5.2.2 Passive sumps 22 5.2.3 Positive ventilation 23 5.2.4 Natural and active under-floor ventilation 23 5.2.5 Sealing floors and passive ventilation 23 5.2.6 Performance of single methods compared with combinations 23
5.3 Performance of remedial measures as influenced by physical characteristics of a home 24
5.4 Contractor choice 26 5.5 Costs 27 5.6 Dose saving after remediation 27 5.7 Guidance for the public, builders and professional bodies 28
6 Conclusions 28
7 Glossary 29

iv
8 References 30
9 Acknowledgments 32
APPENDIX A Survey questionnaires 33 A1 House details questionnaire 33 A2 Retest questionnaire 34
APPENDIX B Remediation methods 35 B1 Radon sump 35 B2 Positive ventilation of living space 37 B3 Ventilation under a suspended floor 37 B4 Passive ventilation of living space 39 B5 Sealing floors and loft hatches 39 B6 Basements 39
APPENDIX C Detailed results of remedial analysis 41
APPENDIX D Probit plot 47

INTRODUCTION
1
1 INTRODUCTION
Radon in the home is the largest source of exposure to ionising radiation for the UK population and accounts for 50% of the total exposure on average (Watson et al, 2005). Levels vary significantly both by area and even between neighbouring properties with concentrations ranging from less than 10 to over 10,000 Bq m-3 (becquerels per cubic metre of air) (Wagland, 2006). The UK average is 20 Bq m-3 (Wrixon et al, 1988). Exposure to radon increases the risk of lung cancer (HPA, 2009).
In July 2010 Health Protection Agency (HPA) issued new advice (HPA, 2010), which recommends that the Action Level (AL) of 200 Bq m-3 is retained but introduced a Target Level of 100 Bq m-3. The data analysed in this report and the analysis pre-date this updated advice.
Before publication of the advice in 2010, the UK radon control strategy was based on the advice published in January 1990 by the National Radiological Protection Board (NRPB) now part of the HPA (NRPB 1990a). Advice was presented to Government covering the principles for the limitation of human exposure to radon in homes. A supporting document explored the practical applications and provided numerical limits and recommendations (NRPB, 1990b). These recommendations included:
Action should be taken to reduce radon concentrations in existing homes if the radon concentration exceeded an Action Level of 200 Bq m-3 in room air averaged over a year.
This approach was supported by the Government and a programme was initiated to identify homes with high radon levels and encourage householders or landlords to reduce levels using radon reduction techniques (Department of the Environment, 1990). Government Departments and the Devolved Administrations have continued to direct, fund and/or support many initiatives under the overall programme (Kendall et al. 2005) The HPA has worked in partnership with Local Authorities and drawn on the expertise of the Building Research Establishment (BRE) to encourage householders with high radon levels to remediate by offering free information, advice and a free post-remediation confirmatory measurement (Department of the Environment, 2000). The HPA and BRE provide information on radon reduction methods in the form of solution sheets, reports, Good Building Guides and websites (www.ukradon.org and www.bre.co.uk/radon/).
This study is based on some 2,700 remediation projects completed between the years of 2000 and 2007 in around 2,400 dwellings. It should be noted that the projects reported here do not represent all of the radon remediation work undertaken in the UK in that period, only those projects that have been reported to HPA and provide sufficient information to support analysis.
Information about these remediation projects has been extracted from the UK national radon database maintained by HPA. It contains data on 3 month measurements of radon in houses before and after remediation, the type of remediation deployed and characteristics of the properties. Information from the analysis of these data can be

AN ANALYSIS OF RADON REMEDIATION METHODS
2
used to improve advice given to the householder by HPA, BRE, Local Authorities and contractors by updating HPA and BRE publications, including websites and via other publications such as the Environmental Radon Newsletter for which an archive is available on www.ukradon.org.
The specific aims of the analysis are to determine the most effective methods of reducing radon concentrations in existing buildings whilst considering other factors such as house characteristics, costs and the effectiveness of the contractor employed. To achieve this, the following questions, amongst others, need to be answered:
i. How effective are different remediation measures?
ii. What factors govern the success of remedial measures in particular situations?
iii. What are typical costs?
iv. Does the implementation by different types of contractor or householder make a significant difference?
2 DATA COLLECTION
Information on radon measurements, property characteristics, location and remedial works is routinely collected on the UK National Radon Database. This study uses data which have been collected on remedies between the years of 2000-2007 in approximately 2,400 dwellings. A large proportion of the data were collected from Cornwall, Devon, Oxfordshire, Somerset, Derbyshire, Northwest England and Northamptonshire; reflecting areas of England with targeted programmes in the timeframe (Kendall et al, 2005).
2.1 Radon measurements
Measurements of radon in houses are made using integrating etched-track detectors. These passive detectors contain sensitive plastic which records damage tracks caused by alpha particles originating from radon or its short-lived decay products. Controlled etching enlarges the tracks so that they can be easily counted. The number of tracks is proportional to the time-integrated, average concentration of radon in the room in which the detector was placed (Ibrahimi and Miles, 2008).
Detectors are in position for three months; one in the main living area and one in a bedroom in regular use. The detectors are returned for processing and the annual average radon concentration is estimated (Wrixon et al, 1988). The effectiveness of remedial works is assessed by comparing the original result with a repeat measurement (taken within three years) after the works are completed.
DATA COLLECTION
3
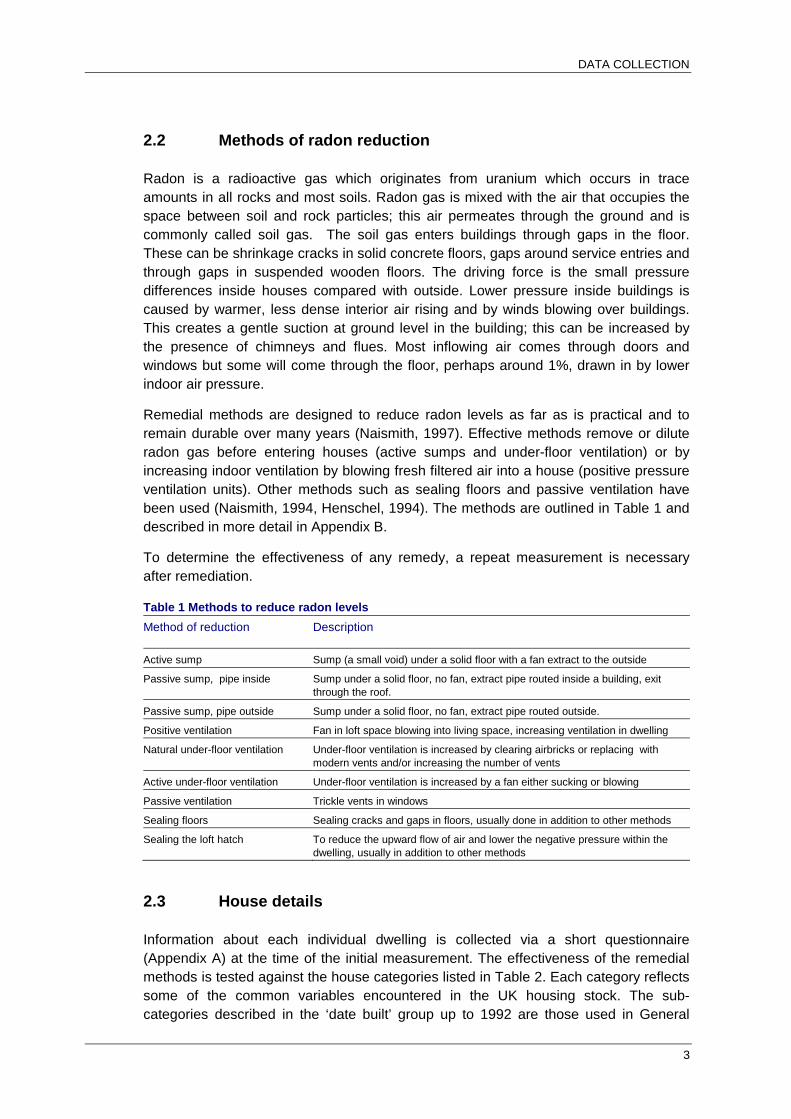
2.2 Methods of radon reduction
Radon is a radioactive gas which originates from uranium which occurs in trace amounts in all rocks and most soils. Radon gas is mixed with the air that occupies the space between soil and rock particles; this air permeates through the ground and is commonly called soil gas. The soil gas enters buildings through gaps in the floor. These can be shrinkage cracks in solid concrete floors, gaps around service entries and through gaps in suspended wooden floors. The driving force is the small pressure differences inside houses compared with outside. Lower pressure inside buildings is caused by warmer, less dense interior air rising and by winds blowing over buildings. This creates a gentle suction at ground level in the building; this can be increased by the presence of chimneys and flues. Most inflowing air comes through doors and windows but some will come through the floor, perhaps around 1%, drawn in by lower indoor air pressure.
Remedial methods are designed to reduce radon levels as far as is practical and to remain durable over many years (Naismith, 1997). Effective methods remove or dilute radon gas before entering houses (active sumps and under-floor ventilation) or by increasing indoor ventilation by blowing fresh filtered air into a house (positive pressure ventilation units). Other methods such as sealing floors and passive ventilation have been used (Naismith, 1994, Henschel, 1994). The methods are outlined in Table 1 and described in more detail in Appendix B.
To determine the effectiveness of any remedy, a repeat measurement is necessary after remediation.
Table 1 Methods to reduce radon levels Method of reduction Description
Active sump Sump (a small void) under a solid floor with a fan extract to the outside
Passive sump, pipe inside Sump under a solid floor, no fan, extract pipe routed inside a building, exit through the roof.
Passive sump, pipe outside Sump under a solid floor, no fan, extract pipe routed outside.
Positive ventilation Fan in loft space blowing into living space, increasing ventilation in dwelling
Natural under-floor ventilation Under-floor ventilation is increased by clearing airbricks or replacing with modern vents and/or increasing the number of vents
Active under-floor ventilation Under-floor ventilation is increased by a fan either sucking or blowing
Passive ventilation Trickle vents in windows
Sealing floors Sealing cracks and gaps in floors, usually done in addition to other methods
Sealing the loft hatch To reduce the upward flow of air and lower the negative pressure within the dwelling, usually in addition to other methods
2.3 House details
Information about each individual dwelling is collected via a short questionnaire (Appendix A) at the time of the initial measurement. The effectiveness of the remedial methods is tested against the house categories listed in Table 2. Each category reflects some of the common variables encountered in the UK housing stock. The sub-categories described in the ‘date built’ group up to 1992 are those used in General

AN ANALYSIS OF RADON REMEDIATION METHODS
4
Household surveys and in other statistical publications from the Office of National Statistics. They reflect major construction periods. After 1992, the dates reflect when significant changes were made to building regulations regarding radon protection (Scivyer, 2007).
Table 2 House characteristics House Characteristic Categories within each characteristic House type Detached, semi-detached, mid-terraced, flat
Date built Before 1900, 1900-1919, 1920-1944, 1945-1964, 1965-1976, 1977-1992, 1993-2000, after 2000
Single storey or not Single storey, multi-storey
Basement or not Basement, no basement
Double glazing Full double glazing, part double glazing, no double glazing
Ground floor type All solid (direct onto earth), all suspended over a small space, a mixture of solid and suspended, over a basement or cellar
Basement effects Basement, no basement
Type of heating Central heating, central heating with open fire, open fire
After remediation, a second retest questionnaire (Appendix A), is completed by householders at the time of the repeat measurement. The questionnaire provides details on: the method used to reduce radon levels; the contractor; the costs of the works and the information previously collected on the house is confirmed. In a small number of cases the householders were unable or unwilling to answer some questions on the questionnaire. This was particularly prevalent for technical questions and for those related to the cost of remedial works. Consequently, some of the analyses will have totals which vary and therefore there are inconsistencies between some tables.
2.4 Contractor experience and costs
Radon remedial work, although generally technically simple, needs to be completed to a high standard to achieve the best results. The second retest questionnaire provided details about the contractor used and the cost of the work (Appendix A).
3 DATA, DEFINITIONS AND ANALYSIS
3.1 The overall dataset
The data analysed in this study comprises information collected from over 2,700 attempts at remedial works in approximately 2,400 dwellings. The remedial works vary in size, complexity and cost. All the main methods described in section 2.2 and Table 1 are represented and include works undertaken by householders themselves on a DIY basis as well as projects completed by both specialist and general contractors.
The dataset includes a range of house types – the largest single group being detached homes (65%) followed by semi-detached (23%). The homes vary in age across the

DATA, DEFINITIONS AND ANALYSIS
5
range shown in Table 2 with the pre-1900 and 1965-1976 being the two largest groups (28% and 23%). Initial Radon levels spanned a wide range with most homes starting above the AL and a limited number (10%) exceeding 1,000 Bq m-3 before remediation. Most homes had only one radon remediation method applied (about 90%). The most prevalent methods were active sumps, natural under-floor ventilation and positive ventilation. The majority of the remediation projects were carried out by contractors and the remainder by householders (DIY).
3.2 Definitions and dose conventions
3.2.1 Effectiveness Two criteria are used to quantify and compare the effectiveness of different remedial methods, the influence of other factors and the variability between different contractor types.
• The first is a test of whether the radon concentration is reduced to below the Action Level (success rate); expressed as a percentage. For example a 50% success rate means that one in two installations in a group reduced the radon concentration to below the Action Level.
• The second is the reduction factor: the initial radon concentration divided by the concentration after remediation to give a ratio. This equates directly to the proportionate reduction in the radon exposure of the occupants while in the home. A value greater than 1 indicates a reduction and a value of unity implies no effect: the greater the number the better the reduction. For example, a reduction from 600 Bq m-3 to 150 Bq m-3 would have a reduction factor of 4.
For an individual property, the measured values corrected for seasonal variations are used. For groups of properties the reduction factor is calculated using the geometric means as the distribution is approximately log-normal (O'Riordan et al, 1987), (Wrixon et al, 1988), (Gunby et al, 1993), (Naismith et al, 1998), (Appendix D). Such distributions are often found when a number of independent variables interact multiplicatively. Figure 1 shows the distribution of radon concentrations in homes before and after remediation from a total of 2,400 homes. Both distributions exhibit the long skewed-tail to high radon levels characteristic of log-normal distributions.

AN ANALYSIS OF RADON REMEDIATION METHODS
6
Figure 1 Distribution of radon concentrations before and after remediation
3.2.2 Dose convention and potential for dose saving As radon inside buildings is the main source of human exposure to radiation in the United Kingdom, there is considerable scope for significant radiation dose reduction to the occupants of homes with significantly elevated concentrations. The effective radiation dose due to radon received by a member of the UK population, who lives in a home at the average level, is estimated to be 1.2 mSv each year assuming that radon concentrations in other buildings are similar to those in dwellings. As the radon concentration in a home increases so does the dose received by the occupants: living in a home at the Action Level (200 Bq m-3) would be equivalent to an effective dose of 10 mSv y-1 (Birchall and Marsh, 2004). In the very highest homes identified so far in the UK with levels over 10,000 Bq m-3, the annual effective dose from radon is over 500 mSv y-1.
Radon concentration (Bq m-3)
Num
ber o
f hou
ses
Ove
r 200
0

RESULTS
7
3.3 Analysis method
Multiple regression analysis was used to assess the relative effectiveness of different methods of radon reduction and to assess the effectiveness when taking the different house characteristics into account. A standard multiple regression model was used to assess the influence on the concentration ratio of the various methods of radon reduction and of the different house characteristics listed in Table 2 and any interactions between the remediation method and the house characteristics.
The model has the following general form
(1) ...ln 332211 +++=
xaxaxa
afterradonbeforeradon
where the ai are regression coefficients and xi are predictive variables.
This can be rearranged to get
(2) ( ) ( ) ( )332211 expexpexp xaxaxabeforeradonafterradon =
which indicates that each significant predictive variable will provide a multiplicative component to the relationship between the radon measurements made before and after remediation.
The main outcome sought from the analysis was to identify what factors govern the success of remedial measures in particular situations. A 5% statistical significance level was used in this analysis. The analyses were performed using the STATA 7.0 statistical packages (STATACorp LP, College Station, TX).
The normal probit plot was used in order to assess whether the radon reduction factors (ratio of radon concentration before and after remediation) are approximately normally distributed. Further details can be found in Appendix D.
4 RESULTS
4.1 Effect of remedial method
The statistical analysis investigated the effectiveness of the method used to reduce radon levels and the relationships between parameters that may be relevant to remediation and the outcomes of remediation itself. The parameters considered are listed in Table 2. Two measures of performance were used; success rate and reduction factor (see section 3.2.1). Together these can indicate whether the remediation will achieve significant reductions in exposure and whether further reduction measures should be considered.

AN ANALYSIS OF RADON REMEDIATION METHODS
8
Attempts at reducing the radon concentrations in 2,700 cases are summarised (by the major method used) in Table 3. Figure 2 gives a graphical representation of the overall reduction factors and 95% confidence intervals for the more common remedial methods. The reduction factors have been calculated from the multiple regression analysis (see section 3.3 and Table C1 in Appendix C). The narrow confidence intervals of these factors, as shown on figure 2 and tabulated in Table C1, Appendix C (p<0.001, except for sealing the loft hatch), indicate that they are good estimates.

RESULTS
9
Table 3 Statistical summary of radon concentrations and reductions resulting from various remediation methods
Principal Remediation method
Number of remediations (% of total)
Geometric Mean (Bq m-3) Before remediation
After remediation
Reduction factor
% reduced below AL
Active sump 771 (29) 523 88 6.0 74
Passive sump, pipe inside 77 (3) 360 189 1.9 42
Passive sump, pipe outside 131 (5) 348 193 1.8 47
Positive ventilation 495 (18) 371 176 2.1 56
Natural under-floor ventilation 636 (24) 317 189 1.7 50
Active under-floor ventilation 128 (5) 494 225 2.2 44
Active under-floor ventilation fan blowing 24/128 (<1) 535 258 2.1 42
Active under-floor ventilation fan sucking 70/128 (3) 482 187 2.6 49
Passive ventilation 259 (10) 291 226 1.3 44
Sealing floors 185 (7) 338 251 1.3 35
Sealing loft hatch 17 (<1) 260 219 1.2 35
Overall data 2700 (100) 386 157 2.5 56
In about a quarter of the cases, when active under-floor fans were used, it was unknown whether they were sucking or blowing.
Figure 2 Comparison of the Relative Effectiveness of Remedial Methods (coefficient + 95% CI). The depth of the marker indicates the 95% confidence interval for each remedy.
The most frequently used methods are the active sump (~29%), natural under-floor ventilation (~24%) and positive ventilation (~18%). The main points arising from Table 3 are:-
• The most effective method is an active sump a typical reduction factor of 6 and a success rate of around 74%.
• A group of methods, (positive ventilation, active under-floor ventilation, passive sumps and natural under-floor ventilation) give a reduction factor around 2.
Active Active Ventilation Sump
Passive
Active
Positive
Passive Under floor
Ventilation
Active Natural
Sealing
6
5
4
3
2
1

AN ANALYSIS OF RADON REMEDIATION METHODS
10
• The least effective methods are passively ventilating the living space and sealing floors, showing a reduction factor around 1.5.
Approximately 70% of the remediations led to a reduction in radon levels of at least 25%. Around 20% of the remediations resulted in a change of less than 25%. A small proportion (10%) gave rise to radon levels being increased by at least 25%.
4.1.1 Performance of remediation methods: single compared with combinations In some homes, combinations of methods are used. This might be for a variety of reasons including cost (trying a lower cost option first) or because an initial attempt does not achieve sufficient reduction.
Table 4 shows the effectiveness of sole remedies compared with combinations of remedies. Most homes (around 2,100) used only a single remedy. The table shows that superficially combinations of remedies do not appear to offer a significant improvement compared with the single remedy. However, one of the reasons why a second remedy may be implemented is that the first method does not perform very well or it does not achieve a reduction sufficient to get below the Action Level. Thus, it is not surprising that in some cases the combined performance of two methods is not much greater than the general performance of a single method. The effect of multiple attempts at remediation is discussed below.
Active sumps are the most effective at reducing below the AL (74%); when an active sump and another remedy is used then there is a marginal increase in the numbers reducing below the AL (between 69 – 79%). For all other remediation types, there was little difference in the success rates or reduction factors.

RESULTS
11
Table 4 Effect of fitting one or more remedial methods
Method
Number of remediation projects (% of total)
Reduced below AL Geometric mean (Bq m-3)
Reduction Factor % Before After Sole Remedies
Active sump 629 (23) 74 525 87 6.0
Passive sump, pipe inside 77 (3) 42 360 189 1.9
Passive sump, pipe outside 131 (5) 47 348 193 1.8
Positive ventilation 421 (16) 57 370 174 2.1
Natural under-floor ventilation 405 (15) 49 320 187 1.7
Active under-floor ventilation 34 (1) 35 491 300 1.6
Active under-floor ventilation fan blowing
24 (1) 42 535 258 2.1
Active under-floor ventilation fan sucking
70 (3) 49 482 187 2.6
Passive ventilation 182 (7) 46 280 223 1.3
Sealing 143 (5) 32 343 265 1.3
Sealing loft hatch 17 (1) 35 260 219 1.2
Multiple remedies
Active sump and Natural under-floor ventilation
38 (1) 79 497 94 5.3
Active sump and passive ventilation of living space
49 (2) 76 450 76 5.9
Active sump and sealing floors 55 (2) 69 598 106 5.6
Positive ventilation and passive ventilation of living space
41 (2) 56 332 164 2.0
Positive ventilation and sealing floors
33 (1) 48 438 209 2.1
Natural under-floor ventilation and passive ventilation of living space
59 (2) 58 286 176 1.6
Natural under-floor ventilation and sealing floors
84 (3) 44 310 215 1.4
Natural under-floor ventilation, passive ventilation and sealing floors
47 (2) 49 340 189 1.8
Natural under-floor ventilation, sealing floors and sealing loft hatch
41 (2) 61 315 177 1.8
Passive ventilation of living space and sealing floors
41 (2) 46 316 224 1.4
Passive ventilation of living space, sealing floors and loft hatch
36 (1) 36 327 246 1.3
Sealing floors and sealing loft hatch
42 (2) 43 320 236 1.4

AN ANALYSIS OF RADON REMEDIATION METHODS
12
4.1.2 Reductions using multiple attempts Table 5 shows the performance of multiple remediation attempts. Each additional attempt after the initial work reflects an additional remediation method or an alteration to the original method (such as increasing the fan speed of a system).
The geometric mean of the initial radon concentration in the full dataset is 380 Bq m-3. In over half the houses, the radon is reduced below the Action Level at the first attempt. In approximately 36% of homes, the first remediation attempt did not get below the Action Level and no further attempts were made. Of the 1,114 homes that attempted remediation but were still above the Action Level after one attempt, 22% made further efforts to reduce the levels. Each subsequent attempt reduced the radon concentration below the Action Level in a third or more of the houses involved in each stage. This suggests that multiple attempts are often worthwhile when the radon level is still substantially above the Action Level.
The average initial radon levels in the homes, that were reduced below the Action Level at each successive stage, increases as the number of attempts increases. This indicates that homes having multiple attempts are generally those with higher initial concentrations and that multiple measures are sometimes needed to get below the Action Level.
The total number of houses that did not achieve reduction below the Action Level is 977 with an initial geometric mean radon level of 424.2 Bq m-3. The geometric mean after reduction was 392.0 Bq m-3; a reduction factor of 1.1. This implies that the selected remedies had little effect. In most of these homes (874), only one attempt was made. Further work would be needed to investigate the characteristics of homes and remediation methods that did not achieve reduction below the Action Level.
Table 5 Performance of multiple attempts to reduce radon levels below the Action Level
Number of attempts
Number of houses entering each attempt
Number of houses reduced below AL at each attempt
% Reduced below AL at each attempt
Geometric mean of the radon concentration in homes reduced below AL (Bq m-3)
Reduction factor, initial radon concentration Initial After
1 2415 1301 54 338.5 75.7 4.5
2 240 108 45 412.9 90.3 4.6
3 59 19 32 631.5 87.5 7.2
4 or more 24 10 42 647.8 106.6 6.1
Figure 3 shows that around 60% of 2,415 homes had final radon concentrations below the Action Level. Most of these achieved this in the first attempt. Of those that did not get below the Action Level on the first attempt (40%), most 36% did not make further attempts. There may be further scope for remediation in these properties.

RESULTS
13
Figure 3 Performance by attempt to reduce radon concentrations below the Action Level (AL)
4.2 Effect of initial radon concentration
The success rate and the reduction factor vary depending on the initial radon concentration. Table 6 shows the success rates of remediation methods used alone, arbitrarily grouped by the initial radon concentration ranges of, under 300, 301 – 600, 601 – 1,000 and over 1,000 Bq m-3. Table 7 shows the reduction factor by the same parameters. Figures 4 and 5 are graphical representations of the results in Table 6 and 7 for the major remedial methods used. Results are not included when the individual number of homes using the remedial measure is less than 20.
% Not reduced below the AL
% Reduced below the AL

AN ANALYSIS OF RADON REMEDIATION METHODS
14
Figure 4 Percent reduction below the Action Level for each method: as a function of initial radon concentration
Figure 5 Reduction factors for each method: as a function of initial radon concentration.
Both Tables 6 and 7 and Figures 4 and 5 show a trend in the two effectiveness measures for each method in relation to the initial radon concentration. As the initial radon concentration rises, the measures are less likely to achieve a reduction below the Action Level but they are also more likely to deliver a greater reduction factor. The effect is strongest for active sumps.

RESULTS
15
Table 6 Success rates of remedial method depending on initial radon concentration
Remedy
Initial concentration range Bq m-3 % reduced below AL, (total number of houses) Under 300 300 – 600 600 - 1000 Over 1000
Active sump 84.2 (152) 77.4 (243) 68.3 (120) 57.8 (116)
Passive sump 58.6 (99) 32.9 (76) 40.9 (22) 18.2 (11)
Passive sump pipe inside 53.1 (32) 29.0 (31) 41.7 (12) 50.0 (2)
Passive sump pipe outside 61.2 (67) 35.6 (45) 40.0 (10) 11.1 (9)
Positive ventilation 71.0 (172) 53.1 (175) 40.8 (49) 19.2 (26)
Natural under-floor ventilation 63.3 (218) 35.8 (151) 23.1 (26) 27.3 (11)
Active under-floor ventilation 62.2 (37) 43.8 (48) 41.2 (17) 19.2 (26)
Active under-floor ventilation fan blowing 57.1 (7) 33.3 (9) 100 (1) 28.6 (7)
Active under-floor ventilation fan sucking 65.2 (23) 50.0 (24) 30.0 (10) 30.8 (13)
Passive ventilation 54.2 (131) 22.5 (40) 22.2 (9) 50.0 (2)
Sealing 47.2 (72) 17.7 (51) 21.4 (14) 14.3 (7)
Sealing loft hatch 38.5 (13) 25.0 (4) NA NA
Total reduction for all methods 64.8 (894) 50.8 (788) 50.2 (257) 42.5 (200)
NA: data not available
Table 7 Reduction factors of remedial method depending on initial radon concentration
Remedy
Initial concentration range Bq m-3 Reduction factor, (total number of houses) Under 300 300 - 600 600 - 1000 Over 1000
Active sump 3.4 (152) 5.3 (243) 7.5 (120) 13 (116)
Passive sump 1.5 (99) 1.7 (76) 4.4 (22) 3.2(11)
Passive sump pipe inside 1.7(32) 1.5 (31) 4.2 (12) 6.0 (2)
Passive sump pipe outside 1.4 (67) 1.9 (45) 4.7(10) 2.8 (9)
Positive ventilation 1.7 (172) 2.3 (175) 2.7 (49) 3.3 (26)
Natural under-floor ventilation 1.6 (218) 1.7 (151) 2.1 (26) 3.6 (11)
Active under-floor ventilation 1.5 (37) 2.2 (48) 3.1 (17) 3.0 (26)
Active under-floor ventilation fan blowing 1.4(7) 1.5 (9) 33 (1) 3.1 (7)
Active under-floor ventilation fan sucking 1.6 (23) 2.7 (24) 2.6 (10) 5.2(13)
Passive ventilation 1.2 (131) 1.2 (40) 1.8 (9) 2.8 (2)
Sealing 1.2 (72) 1.2 (51) 2.4 (14) 2.9(7)
Sealing loft hatch 1.2 (13) 1.3 (4) NA NA
Total reduction for all methods 1.7 (894) 2.5 (788) 4.4 (257) 7.2 (200)
4.3 Effect of house characteristics
The multiple regression model described in section 3.3 was used to investigate the relationship between each remedial method and the house characteristics listed in Table 2. The results are summarised below. Further details, including the confidence

AN ANALYSIS OF RADON REMEDIATION METHODS
16
intervals, are given in Appendix C. Note that in some cases the large confidence intervals are due to small sample sizes and blank spaces reflect insufficient data.
The objective of this study is to determine which house characteristics have an effect on the performance of remediation. The findings will stimulate future work to understand the mechanisms involved.
4.3.1 Effects of different house types Investigation of the potential influence of house type (Appendix C, Table C2) shows that this has little effect on the effectiveness of any individual remedial method.
4.3.2 Effects of the date of build The build date category reflects the major construction periods or the introduction of building standards and/or regulations (Section 2.3). The reduction factor varies significantly with the date of build for active sumps only: the trend shows they are better in newer homes (Appendix C, Table C3). The reduction factors after 1993 seem to be more variable, this is probably due to low sample numbers. For other methods, the age of the homes makes little or no difference.
4.3.3 Effects of the number of floors and basements Investigation of the potential influence of single-storey and multi-storey homes (Appendix C, Table C4a) showed that both active sumps and positive ventilation were 1.5 and 1.25 times more effective respectively in single storey homes than in homes with more than one storey: a finding significant at the 95% confidence level. There are indications, not always significant at the 95% level that passive sumps (with the pipe outside) were approximately 1.5 times more effective in single storey homes and with the pipe inside they were slightly more effective in multi-storey homes. All other remedies were equally effective, regardless of the number of storeys.
The potential influence of basements on the effectiveness of remediation in homes (Appendix C, Table C4b) shows that active sumps are generally more effective in homes without a basement. This may be explained in part because of the greater prevalence of basements in older homes and the correlation of active sump performance with newer homes. The performance of other remediation methods are largely unaffected by the presence or absence of a basement.
4.3.4 Effects of double glazing The influence of double glazing on remediation methods (Appendix C, Table C5) shows that the reduction factors tend to be higher, significant at the 95% confidence level, for active sumps when a home has full double glazing compared with no double glazing. Partly double-glazed homes lie in between. The effectiveness for positive ventilation seems slightly enhanced in fully double glazed homes, also significant at the 95% level. It should be noted that, in general terms, double-glazing is known to be a factor in increasing indoor radon levels (Wrixon et al 1988)

RESULTS
17
4.3.5 Effects of floor type The influences of floor type on the effectiveness of remediation methods (Appendix C, Table C6), shows that active sumps are the most effective remedy, regardless of floor type. The likely explanation for this is that some respondents may have classed a suspended concrete floor as solid. Active under-floor ventilation is more effective than natural under-floor ventilation for solid floors. Active under-floor ventilation for basements (fan blowing) reduces levels by 7.5 times (CI 1-50). For all other remedies, floor type makes little difference to their effectiveness.
4.3.6 Effects of heating method Investigation of the influence of heating method (Appendix C, Table C7) show that heating type, generally has no bearing on the effectiveness of any of the remediation methods.
4.4 Effect of different contractor types
Radon mitigations are carried out by; companies that specialise in this work, general builders and by householders themselves. The effectiveness of methods to reduce radon levels may depend on the quality of the work done as well as the other parameters explored here. This may vary according to the contractor. The difference in effectiveness of remedial measures was investigated in relation to the amount of experience and type of contractor carrying out the work. The work done by contractors here reflects their relative level of experience rather than absolute numbers.
Data used in this analysis do not include results where contractors have used measurement laboratories other than HPA. The remedial information is obtained from questionnaires and relies on the householders’ interpretation and understanding of the questions and some of that information may be reduced in quality or this information may not have been available.
Analysis is complicated because the choice of contractor (experienced, general or DIY) may be biased by the initial radon concentration (Table 9). Table 9 shows that there is a positive correlation between higher initial concentrations being tackled by the experienced contractors rather than the others (general or DIY). It has already been shown in Figures 4 and 5 that initial radon concentration influences the potential for success. These factors have an influence on results in Table 8.
4.4.1 Contractor type In this analysis, contractors who have carried out more than 10 remedial works which are reported here are classed as “experienced”. Contractors who have carried out fewer than 10 remedial works are classed as “general”.
Experienced contractors were further subdivided into categories; those having completed work on more than 30 houses and those completing work on between 10 and 29 houses. General contractors were assumed to have less experience and may

AN ANALYSIS OF RADON REMEDIATION METHODS
18
not necessarily specialise in radon remediation. These general contractors were further subdivided into categories; those who have completed between 5 and 10 works and those who have completed fewer than 5 works on houses respectively. Home owners doing their own work are categorised as DIY. If the contractor was unknown (not stated on the questionnaire), then the results were excluded from analysis.
Table 8 Contractor type and success rates
Contractor category Total no houses
% reduced below AL
Average concentration of Radon Bq m-3 after 1 attempt to reduce levels
Reduction factor
Overall success After 1 attempt
Geometric Mean (GSD) Before After
Experienced All Experienced 803 62 51 467.6 (2.0) 115.8 (3.2) 4.0
Experienced >=30 618 60 48 474.5 (2.1) 120.0 (3.2) 4.0
Experienced>=10<30 185 70 60 445.9 (2.0) 103.1 (3.1) 4.3
General
All General 549 50 43 403.0 (1.9) 170.0 (2.8) 2.4
>=5<10 95 60 54 455.3 (2.1) 126.2 (3.0) 3.6
Rest <5 454 48 41 392.8 (1.9) 180.9 (2.7) 2.2
DIY 445 49 43 351.6 (1.8) 177.5 (2.5) 2.0
Table 8 confirms that higher initial concentrations are correlated with greater reduction factors. The table shows that in general, the more experienced remediators deal with homes having higher initial concentrations.
These observations are further illustrated in Table 9 in relation to ranges of initial radon concentration. It is not clear whether the improved performance is due to the experience of the contractors, the higher initial concentration or a combination. In order to determine this, it would be necessary to analyse different types of remediators undertaking the same work on similar homes having the same initial concentration. This might be the subject of future work but this would need to have sufficient data to support statistically valid conclusions.
Table 9 Contractor effectiveness depending on initial radon concentration
Contractor
Reduction Factor (RF) and % reduced below AL Initial concentration range Bq m-3 Under 500 500 – 1000 Over 1000 No Homes RF Success rate No Homes RF Success rate No Homes RF Success rate
Experienced 470 3.0 74.5 205 5.4 61.5 109 8.5 45.0
General 377 1.8 55.7 115 3.1 38.3 55 9.2 49.1
DIY 347 1.7 55.3 65 2.9 38.5 32 5.3 40.6

RESULTS
19
4.4.2 Individual contractors Table 10 shows the variation in success rates and reduction factors for individual contractors who had done the most number of works. It highlights the variability of performance for reducing radon levels.
Table 10 Contractor performance - individual
Contractor id Total no houses
% Reduced below AL - number of attempts to reduce levels
Average concentration of radon Bq m-3 after 1 attempt to reduce levels
Reduction factor
Overall success 1 2
Geometric mean (GSD) Before After
1 237 49 36 13 506.2 (2) 206.9 (2.3) 2.4
27 137 67 59 8 448.1 (1.9) 92.1 (3.6) 4.9
41 60 76 55 21 421.3 (2.1) 58.3 (3.6) 7.2
61 44 82 73 10 547.3 (2.4) 100.2 (2.3) 5.5
4.5 Costs of remediation
Information on cost was collected on the questionnaire. This sub dataset comprised 1533 entries for costs of single remedies. Unknown costs were excluded. The data in Table 11 reflect an underlying distribution of ‘paid for work’ (including labour costs in most cases). At the low cost end there are DIY and those possibly without labour costs and at the top end there are some outliers which might comprise ‘difficult jobs’ or jobs mixed in with other work and possibly some jobs that have been overcharged.
The costs for each method do not always follow either a normal or log-normal distribution: figures 6, 7 and 8 show the range of costs for the three most common methods. In order to estimate typical costs, Table 11 shows the arithmetic mean, geometric mean and median costs. Typical costs were estimated by rounding the geometric mean to the nearest £50.
Typical costs for the most often used remedies, active sumps, positive ventilation and natural under-floor ventilation are around £800, £500 and £150 respectively.
The period in which the remediation works were undertaken (2000-2007) was characterised generally by low inflation: during the period there was a general price rise of around 20%. Prices here are represented as they were in the same period. Prices since then may have changed.

AN ANALYSIS OF RADON REMEDIATION METHODS
20
Table 11 Costs for remedial methods employed to reduce radon levels in houses
Remedy Frequency (n)
Cost £
Arithmetic mean
Geometric mean Median
Range min max
Active sump 418 915 770 800 30 5000
Passive sump 61 585 374 450 25 3200
Active under-floor ventilation 50 860 570 800 26 6205
Natural under-floor ventilation 147 260 134 150 8 4236
Positive ventilation 291 540 505 515 10 1600
Passive ventilation 39 700 130 80 10 7500
Sealing 29 455 95 75 5 3865
Active sumps (DIY) 28 305 258 300 50 750
Figure 6 Range of costs: Active Sump
480040003200240016008000
90
80
70
60
50
40
30
20
10
0
Cost £
Freq
uenc
y

RESULTS
21
Figure 7 Range of costs: Positive Ventilation
Figure 8 Range of costs: Natural under-floor ventilation
150012009006003000
120
100
80
60
40
20
0
Cost £
Freq
uenc
y
37503000225015007500
100
80
60
40
20
0
Cost £
Freq
uenc
y
AN ANALYSIS OF RADON REMEDIATION METHODS
22
5 DISCUSSION
5.1 Is remediation effective?
Undoubtedly, remedial works can be successful at reducing radon concentrations. This is clearly shown by the downward shift of the distribution of post-remedial radon concentration relative to the initial distribution shown in Figure 1. Reduction factors and success rates in reducing below the Action Level are clearly illustrated in Tables 3 and 4.
5.2 The performance of remediation methods
The aim in radon remediation is generally to obtain a substantial reduction in the radon level and, if practicable, to reduce levels to below the Action Level. The analysis here has identified a number of parameters which influence these two outcomes: the choice of remediation method; the initial (pre-remediation) radon level; and the characteristics of the building being remediated. The most effective remediation method for an individual home can depend on each of these characteristics. It may be that if the same method were applied to the same home by different people, this might also have different performance although the database of information does not support this level of analysis.
The results are reported as success rate at reducing radon levels below the Action Level and as reduction factors in radon concentration. Generally, for all remedies the success rate decreases as the original radon level increases and reduction factors increase with increasing initial radon levels. It should be noted that even if the success rate is low, the reduction factor could be high. Although reduction below the AL may not have been achieved, the reduction of radon levels may still be large therefore the remedy was effective in substantially reducing radon exposure.
Active measures generally perform better than passive measures, for example active sumps are always more effective than passive sumps; positive ventilation is more effective than passive. In some cases, for example active and natural ventilation of under-floor space; there is overlap in performance.
5.2.1 Active sumps This study found that an active sump is the most effective and widely used remedy across a wide range of circumstances and has the most success at reducing radon levels. It achieves a typical reduction factor of 6 and gets below the Action Level in 74% of homes when used as the primary remedial measure. This confirms the findings of others (Cliff et al, 1992), (Naismith et al, 1998) in the UK and in other countries (Henschel, 1994), (Arvela et al, 2008).
5.2.2 Passive sumps Passive sumps are moderately effective at reducing radon concentrations. Overall, the trend with respect to initial concentration follows that shown by other remedial

DISCUSSION
23
measures, namely higher initial radon concentration is associated with greater reduction factors but low success rates at getting below the Action Level.
There appears to be an improvement in performance of passive sumps around several hundred Bq m-3. There is no obvious explanation and, as the sample is small, the statistical significance will be low.
In areas where there the potential for a radon concentration to be at or above the AL in 10% or more of dwellings, sumps and associated under-floor pipework are required to be installed in new buildings with solid floors. This is in addition to a membrane as a protective measure against radon (Communities and Local Government, 2004). It must be stressed that these sumps are capped and are not working as passive sumps.
5.2.3 Positive ventilation Positive ventilation generally offers a reduction of radon by a factor of around 2. Previous work (Cliff et al, 1992) suggest that these systems will offer moderate reductions in radon levels, providing that the house is reasonably airtight and windows are kept closed. The performance of this method is largely unaffected by the characteristics of the home except for a slightly enhanced performance in fully double glazed properties: in line with the finding by Cliff et al. Positive ventilation systems were found to be slightly more effective in single storey houses, a similar finding to Naismith et al, 1998. This is to be expected as, in general terms, the magnitude of the stack-effect is proportional to the height of a building but the pressure exerted by a positive ventilation unit is constant.
5.2.4 Natural and active under-floor ventilation Natural and active under floor ventilation typically offers a reduction in radon levels by a factor of around 2 and shows the same general trend in performance with respect to initial radon levels as other methods. Householders may achieve good results by increasing natural under floor ventilation, and if this fails there is still an option to activate using a fan if the radon reduction is insufficient.
5.2.5 Sealing floors and passive ventilation These measures generally have the lowest performance with reduction factors less than 2 and the percentage reducing levels below the Action Level at the first attempt is around 32% for sealing and 44% for passive ventilation. The regression analysis and the success rate at reducing radon levels below the Action Level shows that sealing and passive ventilation are the least effective, especially at higher radon levels. It is very difficult to seal floors effectively and when used alone is unlikely to yield appreciable reductions. The results here are similar to those shown elsewhere (Naismith, 1994). However, it has been shown elsewhere that it would be advantageous to seal very large holes, block vents or cover large expanses of exposed earth with suitable membranes (Pye, 1993).

AN ANALYSIS OF RADON REMEDIATION METHODS
24
5.2.6 Performance of single methods compared with combinations Combinations of remedial methods are only slightly more effective than single methods alone. The low sample number of multiple remedies in this report does not support firmer conclusions.
5.3 Performance of remedial measures as influenced by physical characteristics of a home
The analysis looked at the reduction factor achieved by each remedial measure and whether this is affected by the physical characteristics of the home. This may be important in helping householders to decide on the most appropriate measure for a specific home and to understand what factors might affect the performance of remedial measures.
The results are shown in Table 12 with further detail in Appendix C. The table indicates the degree of influence of each factor on the performance of each remedial measure. The main observations from Table 12 are:
• House type and heating type do not make a significant difference to the performance of any measures.
• Active sumps tend to perform better in newer homes. The build date has no significant influence on other measures.
• Active sumps, positive ventilation and passive sumps (pipes outside) are more effective in single storey than in multi-storey homes. The number of storeys has no significant influence on the performance of other measures.
• The presence of a basement diminishes the performance of active sumps but this may be correlated with the build date of the property. The presence of a basement makes no significant difference to the effectiveness of other measures.
• All measures are generally more effective when the home has double glazing.
• In general, floor type is not a major determinant of the performance of remedial measure. This is similar to the findings of Naismith et al, 1998.

DISCUSSION
25
Table 12 Effect of house characteristics on the performance of the remedial measure
Factors affecting performance
Method of reduction
Active sump Passive sump Positive ventilation
Passive ventilation
Natural under-floor ventilation
Active under-floor ventilation Sealing Floors
House type No Difference ID
Date built ** Newer the house, the better
No Difference No Difference No Difference No Difference ID No Difference
Single storey effects
** More effective in single storey homes
*More effective in single storey homes
**More effective in single storey homes
No Difference No Difference ID No Difference
Basement effects **More effective in homes without a basement
No Difference No Difference ID No Difference ID ID
Double glazing *Remedies are generally more effective with double glazing
Ground floor type No Difference ID No Difference *Slightly more effective for suspended floors
No Difference ID ID
Type of heating No Difference
* Some effect
** Strong effect
ID - Insufficient Data

AN ANALYSIS OF RADON REMEDIATION METHODS
26
5.4 Contractor choice
There are no firm conclusions drawn from this analysis about the relative performance of the different types of remediators and householders who ‘DIY’. This is largely due to the interaction with the effect of higher initial radon concentration on remediation performance. It has been shown that there are differences in performance between individual experienced contractors. While experienced contractors generally obtain better results, they also undertake a greater proportion of their work on the homes with the higher initial radon levels. It has been shown here that the higher initial radon homes offer greater reduction factors. It is therefore currently not possible to draw firm conclusions about the likely outcome of a remediation based solely on the past experience of the contractor.
There are however, some worthwhile questions that householders should ask when considering radon remediation. The questions are shown below. Some are common to many types of building work; others are specific to radon remediation.
• Have you got several quotes?
• Has the contractor been recommended by others?
• Do you have your own trusted builder/contractor?
• Does the contractor suggest realistic reductions for the proposed remedial measure suggested?
• Does the contractor make or suggest a post remedial measurement?
• Does the contractor inform you of post-remedial maintenance such as: periodic checking that fans are still running; being aware of the cost of running fans; checking radon levels every few years to ensure levels are still low; and re-testing after significant building work has been completed on the home? (Green and Hodgson, 2010).
It is also worth noting that, unlike many types of building work, the results of radon remediation are not directly visible but must be determined through measurement and are also aimed at reduction of a health risk rather than its elimination.
Householders should bear in mind that the performance of radon remediation measures varies according to many factors and there is no certainty of achieving a specific final radon level. Individual contractors might choose to offer such a “guarantee” but this may be problematic as there is insufficient evidence to suggest that a specific technique in a specific situation will definitely achieve a certain reduction factor. Householders should therefore have a realistic expectation that appropriate measures will, if properly carried out, reduce radon considerably but that further measures may be required. It is also important for householders to realise that even if radon levels are not reduced below the action level, if their indoor radon has been significantly reduced then this significantly reduces their lung cancer risk.

DISCUSSION
27
5.5 Costs
When houses have been identified with radon levels above the Action Level, it is the responsibility of the householder or landlord, as appropriate, to fund works to reduce levels. Not surprisingly, cost is a common reason cited for not carrying out work to reduce radon levels (Bradley and Thomas, 1996).
The methods show a distribution of costs generally characterised by a central peak in the distribution but with significant high and low outliers (for example, see figures 6, 7 and 8). It is likely that most of the low outliers are associated with some level of DIY not involving labour costs and the higher ones are understood to be often associated with the combination of other work on the home as part of the radon remediation. For example a sump may be constructed centrally in a house and the cost of replacement floors, carpets etc have been included. In a few homes, costs may be increased if the work is complicated or involves a large build area where several sumps may be required.
Table 13 shows typical cost for each measure, using the geometric mean rounded to the nearest £50.
Table 13 Typical costs for remediation measures
Remedy Cost £ Active sump 800
Passive sump 400
Active under-floor ventilation 550
Natural under-floor ventilation 150
Positive ventilation 500
Passive ventilation 150
Sealing 100
Active sumps (DIY) 250
Typical costs for each individual measure do not take into account price changes since 2007. The distribution of costs is similar to a previous study (Bradley and Thomas 1996).
5.6 Dose saving after remediation
Radon is a proven carcinogen, implicated in over 1,000 lung cancer deaths in the UK each year (HPA, 2009). In addition, it is the largest contributor to the total radiation dose received by the population and shows a large variation. While the typical annual UK radon exposure is around 1.2 mSv, much higher exposures are received by people living in houses with high radon levels, exceptionally exceeding hundreds of millisieverts annually. The aim of radon remediation is to reduce high individual exposures.
A level of 200 Bq m-3 corresponds to an annual exposure of about 10 mSv y-1 (Birchall and Marsh, 2004). The average reduction in radon concentrations for homes analysed

AN ANALYSIS OF RADON REMEDIATION METHODS
28
in this report suggest that dose savings for each occupant is around 11 mSv y-1 but with a large variability between homes. There are only a few other areas of radiation protection where intervention is able to regularly avert individual doses of this magnitude. Summing this dose saving over the total 2,400 homes and assuming that 2.5 people occupy each house, this suggests that around 70 man-sieverts are saved each year.
5.7 Guidance for the public, builders and professional bodies
The effectiveness of reducing high radon levels in a home depends on the initial radon level, the choice of remedy and good building practice. Even after accounting for these factors, the results presented here suggest that there may be significant variation in the performance of remedial measures. This analysis has brought together information which can be used to create simple and concise guidance for householders, builders and other professional bodies. It is intended that this information will be made accessible in updates to existing guidance documents and on the HPA’s radon website (www.UKradon.org).
The development of flow diagrams and website applications that ask relevant questions and suggest solutions, would help householders chose an appropriate method to reduce their radon levels. Provision of this easily accessible information should encourage householders to do the work to reduce their radon levels in their homes.
6 CONCLUSIONS
1. An active sump system is most likely to offer a substantial reduction (typically 6 fold). Other methods such as passive sumps, positive ventilation, natural and active under-floor ventilation, are less effective offering a typical reduction factor of about 2. Passive ventilation and sealing are the least effective.
2. In some cases, multiple methods may be required to achieve significant reductions and to get below the Action Level.
3. Each remediation method showed a trend in performance with respect to the initial radon concentration. The higher the initial radon concentration, the better the reduction in exposure for most measures, but they are less likely to reduce below the Action Level. This effect was more pronounced for active sumps than other methods.
4. The type of home or its heating method does not significantly affect the performance of remedial measures. Double glazing generally improves remediation performance.
5. Active sumps are more effective in newer homes but other measures are largely unaffected by the age of the home.
GLOSSARY
29
6. Some measures (sumps and positive ventilation) are more effective in single storey homes.
7. The typical costs of most frequently used remediation methods are:
o active sump (~£800)
o positive ventilation of living space (~£500)
o natural under-floor ventilation (~£150)
8. The analysis undertaken here does not support firm conclusions about the relative performance of different types of contractors and householders who “DIY”. This is largely because of the interaction with the effect of higher initial radon concentration on remediation performance.
9. Further guidance for householders, contractors and others, using information in this report, will be produced as fact sheets and information on the Ukradon website.
10. Further analysis would be required to assess the effectiveness of remedial measures at attaining levels less than the Target Level (100 Bq m-3) and in homes with initial radon levels in the range 100-200 Bq m-3 (between the Target and Action Levels).
7 GLOSSARY
Active sump. Sump under a solid floor or impermeable membrane with a fan sucking or blowing from the sump (Appendix B).
Active under-floor ventilation. Under-floor ventilation is increased by using a fan which extracts or blows (Appendix B).
Averages. The numerical radon results in this report are presented as arithmetic average and geometric average. The arithmetic average is the normal value used to describe numerical results: it is the sum of the results divided by the number of the results. The geometric average is the nth root of all the results multiplied together. The median is the most common value.
Becquerel. Symbol Bq. The unit of the amount or activity of a radionuclide. Describes the rate which transformations occur. 1 Bq = 1 transformation per second.
Becquerel per cubic metre of air. Symbol Bq m-3. The amount of a radionuclide in each cubic metre of air. Often referred to as the activity concentration.
Half life. The time taken for half the amount of a radioactive element to undergo a radioactive transformation and form a different element.
Isotopes. Chemically identical forms of an element with different masses. The mass is indicated by the number after the element.

AN ANALYSIS OF RADON REMEDIATION METHODS
30
Natural under-floor ventilation. Under-floor ventilation is increased by clearing airbricks or replacing with modern vents and/or increasing the number (Appendix B).
Pascal. Symbol Pa. A unit of pressure (1 N/m2). Normal atmospheric pressure is 101,325 Pa, so, for example, 10 Pa is about 0.0015 psi.
Passive sump. Sump under a solid floor or impermeable membrane. No fan (Appendix B).
Passive ventilation. Trickle vents in windows or windows open on lockable catches (Appendix B).
Positive ventilation. Fan, usually in loft space, blowing into living space (Appendix B).
Radon Action Level (AL). The recommended upper limit for the activity concentration of radon in UK homes. Its value, expressed as the annual average radon gas concentration in the home, is 200 Bq m-3.
Radon Affected Areas. Parts of the country with a 1% probability or more of present or future homes being above the Action Level.
Radioactivity. The spontaneous disintegration of unstable elements (radionuclides). During the process, energy is emitted as either alpha or beta particles or gamma rays or a combination of these.
Reduction Factor. In this report, the initial radon concentration is divided by the concentration after a remediation attempt. A value greater than 1 indicates a reduction and a value less than 1 indicates that the level has increased.
Sealing floors. Sealing cracks and gaps in floors, usually done in addition to other methods, unsuitable for timber floors (Appendix B).
Sealing the loft hatch. The upward flow of air is reduced and as a consequence, the negative pressure within the dwelling is reduced, usually sealing the loft hatch is done in addition to other methods (Appendix B).
Sievert. The SI unit name of equivalent dose, effective dose, and operational dose quantities. The unit is joule per kilogram (J kg-1).
Success rate. In this report the success rate is expressed as a percentage. For example, 50% success indicates that 1 in 2 installations reduced the radon levels below the Action Level.
8 REFERENCES
Arvela H, Reisbacka H and Keraenen P (2008). Radon prevention and mitigation in Finland: Guidance and Practices. Proceedings of the American Association of Radon Scientists and Technologists. International Symposium Las Vegas NV, September 14-17, 2008.

REFERENCES
31
Birchall A and Marsh JW (2004). Radon dosimetry and its implications for risk. 6th International Conference on High Levels of Natural Radiation and Radon Areas - September 6 – 10 2004, Osaka Japan 81-4.
Bradley EJ and Thomas JM (1996). An analysis of responses to radon remediation advice. Chilton, NRPB-M707.
Building Research Establishment. www.bre.co.uk/radon/. (2005).
Cliff KD, Green BMR and Lomas PR (1992). Domestic radon remedies. Radiat Prot Dosim 45, 599-601.
Communities and Local Government (2004). The Building Regulations 2000. Approved Document C, Site preparation and resistance to contaminates and moisture. London, The Stationery Office.
Department of the Environment (1990). Government accepts NRPB recommendation to reduce the Action Level for radon. Environmental News Release 32, 19 Jan (London: DOE).
Department of the Environment (2000). Transport and the Regions. Environment Minister, Michael Meacher, announces new radon programme. DETR News release 467, 10 July 2000.
Gunby JA, Darby SC, Miles JC et al (1993). Factors affecting indoor radon concentrations in the United Kingdom. Health Phys 64, (1) 2-12.
Green BMR and Hodgson SA (2010). Radon remedies – is my fan still going? Environmental Radon Newsletter, Issue 64.
Henschel DB (1994). Analysis of radon mitigation techniques used in existing US houses. Radiat Protection Dosimetry. 56, (1-4) 21-27.
HPA (2009). Radon and Public Health. Report of the Independent Advisory Group on Ionising Radiation. Doc HPA, RCE-11, 1-240. Available at www.hpa.org.uk
HPA (2010). Limitation of Human Exposure to Radon. Advice from the HPA. Doc HPA, RCE-15, 1-20. Available at www.hpa.org.uk
Ibrahimi Z-F and Miles JCH (2008). Performance review of a slide scanner based automated counting system for PADC radon detectors. Radiat Measurements 43, S395-S400.
Kendall GM, Green BMR, Miles JCH, Dixon DW (2005). The development of the UK radon programme. J Radiol Prot, 25, 475-92.
Naismith SP (1994). Efficacy of radon remedial measures. Radiol Prot Bull 152, 10-13.
Naismith SP (1997). Durability of radon remedial measures. Radiat Prot Dosim 71, 215-218.
Naismith SP, Miles JC and Scivyer CR (1998). The influence of house characteristics on the effectiveness of radon remedial measures. Health Phys 75 (4), 410-6.
NRPB (1990a). Limitation of human exposure to radon in homes: Statement by the National Radiological Protection Board. Doc NRPB 1, (1) 15-16.
NRPB (1990b). Human Exposure to Radon in Homes: Recommendations for the Practical Application of the Board’s Statement. Doc NRPB, 1, (1), 17-32.
O'Riordan MC, James AC, Green BMR, Wrixon AD (1987). Exposure to radon daughters in dwellings. NRPB-GS6. 31 pp, National Radiological Protection Board, Chilton.
Pye PW (1993). Sealing cracks in solid floors: a BRE guide to radon remedial measures in existing dwellings. London, Construction Research Publications Ltd.
Scivyer CR (1993). Surveying dwellings with high indoor radon levels. BR250. Bracknell, IHS BRE Press.
Scivyer CR, Cripps A, and Jaggs MPR (1998a). Radon sump systems (2nd edition): BR227. Bracknell, IHS BRE Press.
Scivyer CR and Jaggs MPR (1998b). Dwellings with cellars and basements. BR343. Bracknell IHS BRE Press.
Scivyer CR (2007). Radon: Guidance on protective measures for new buildings. BR211. Bracknell, IHS BRE Press.
Stephen RK (1995). Positive Pressurisation. BR 281. Bracknell, IHS Press.

AN ANALYSIS OF RADON REMEDIATION METHODS
32
Wagland L (2006). High radon results found in Kerrier District. Environmental Radon Newsletter, Issue 42.
Watson SJ, Jones AL, Oatway WB, Hughes JS (2005). Ionising Radiation Exposure of the UK Population. 2005 Review.
Welsh PA, Pye PW and Scivyer CR (1994). Protecting dwellings with suspended timber floors. BR270. Bracknell, IHS BRE Press.
Wrixon AD, Green BMR, Lomas PR et al (1988). Natural radiation exposure in UK dwellings. Chilton, NRPB-R190.
9 ACKNOWLEDGMENTS
We wish to thank Gavin Hanel (Strathclyde University) for his help with data analysis, Chris Scivyer (Building Research Establishment) for technical help and advice, Nezahat Hunter and Richard Haylock for statistical support and all past and present members of the radon team (both in the Health Protection Agency and the Building Research Establishment) for all their efforts.
Special thanks go to the householders who spent time and effort completing the questionnaires: otherwise this analysis would not have been possible.

APPENDIX A
33
APPENDIX A Survey questionnaires
A1 HOUSE DETAILS QUESTIONNAIRE

AN ANALYSIS OF RADON REMEDIATION METHODS
34
A2 RETEST QUESTIONNAIRE

APPENDIX B
35
APPENDIX B Remediation methods
This appendix summarises methods used most commonly in the UK to reduce high radon levels. More detailed descriptions and specifications of the methods are given by the BRE (Scivyer, 1993; Building Research Establishment, 2005).
Radon in soil air (soil gas), is drawn from the ground into buildings through cracks and gaps in floors and walls of buildings: radon enters buildings because the pressure inside the building (Pi) is usually lower than the pressure outside of the building (Po) (see Figure B1). The pressure difference (ΔP=Po-Pi) is caused warm air rising in buildings and by wind blowing over the outlets such as chimneys and roof vents. Typically, ΔP is very small, in the order of a few pascals.
Methods used to reduce radon levels are described briefly below. Methods used for houses with cellars and basements are also briefly described: to clarify, a cellar is an unoccupied area below a building, often used for storage; a basement is occupied and usually heated.
Figure B1: Diagram of airflow from the ground into buildings
B1 RADON SUMP
Sump systems (Scivyer et al, 1998a) are suitable for buildings with a concrete capping or an impermeable membrane over the soil. A passive sump is a space or void which is excavated under the concrete capping or a membrane, this is attached to an exit pipe. The end of the exit pipe is normally routed through the wall and up the side of the building to roof level. An active sump (Figure B1.1) is fitted with an in-line or other duct mounted centrifugal fan which can suck from or blow into the sump. In this case, the exit can be at a low level, ideally positioned away from openings such as doors and windows.
(ΔP=Po-Pi) (Po)
(Po)
(Pi)

AN ANALYSIS OF RADON REMEDIATION METHODS
36
Figure B1.1: Diagram of a radon sump system
A fan sucking on the sump will reduce the pressure within the void and under the floor, provided this pressure (Ps) is less than the indoor pressure (Ps < Pi). The soil gas, contaminated with radon, is drawn preferentially through the under-floor material towards the sump void and is expelled to outside, see Figure B1.2. A typical radon sump under suction will extract radon in soil gas from a surrounding area of approximately 250 m2 but can be effective up to distances of approximately 15 m from the sump, assuming no there are no obstructions. Sumps work most effectively where the fill beneath the slab is permeable (Scivyer, 1993).
Figure B1.2 : The effect of a radon sump on airflow and radon
Alternatively, the fan can be reversed to blow fresh air into the sump creating a region of fresh air under the floor.
(Ps)
(Pi) (Po)
Fan
(Ps < Pi)

APPENDIX B
37
B2 POSITIVE VENTILATION OF LIVING SPACE
A positive ventilation unit, normally positioned in the roof space, uses a fan to blow filtered fresh air into a home. The air enters the house through a diffusing vent mounted in the ceiling of a central hallway or at the top of a stairway Figure B2.1. These units were originally designed to combat condensation problems in poorly ventilated houses.
Figure B2.1 Diagram of Positive ventilation and air flow.
Positive ventilation reduces radon gas by one or both of the following processes. Firstly, radon is diluted by increasing the ventilation rate in the house. Secondly, if the house is particularly airtight, the pressure inside the building may be increased. This reduces the pressure difference between the house and the ground and consequently reduces the ingress of radon into the building. Pressures generated by these fans are small (typically 0.5 to 2 pascals) (Stephen, 1995). Radon reduction is obtained by a combined effect of these two processes, the extent of which depends on the air-tightness of the house.
B3 VENTILATION UNDER A SUSPENDED FLOOR
B3.1 Passive or natural under-floor ventilation Buildings constructed with a suspended timber or concrete ground floor with a space or void underneath should be naturally well ventilated using air bricks, primarily to control moisture levels and prevent rot in timbers. Ideally, vents should be provided on at least two opposite outside walls and the opening should be at least 1500 mm2 (Scivyer, 2007) for each metre run of wall. Typically vents, the size of a house brick, should be spaced every 1.5 – 2.0 m and not more than 450 mm from corners (Welsh and Pye, 1994). Figure B3.1.1 shows a diagram of the airflow under a suspended floor.

AN ANALYSIS OF RADON REMEDIATION METHODS
38
Figure B3.1.1 Airflow under a suspended floor
Increased ventilation of the under-floor space dilutes the radon concentration rising from the ground into the under-floor space. Consequently, less radon enters the building. Increased ventilation can be achieved by ensuring:
• existing under-floor vents are clear
• older ‘terracotta’ style under-floor vents are replaced with plastic air vents
• sufficient numbers of under-floor vents are incorporated into external walls, below the floor level
• under-floor vents should be spaced around the building to ensure a good cross flow of air
B3.2 Active under-floor ventilation When natural under-floor ventilation does not reduce radon levels to acceptable levels, an electric fan can be installed to increase the air-flow under the floor. Fans can be installed to blow air into the under-floor space or extract air from it. Both supplying and extracting air can be successful, the success depends on many factors (Welsh and Pye, 1994). Figure B3.2.1 shows a cross section diagram of and under-floor fan.
Figure B3.2.1 Active under-floor ventilation.

APPENDIX B
39
Active under-floor ventilation reduces radon levels by diluting the concentration of radon in the under-floor space. It should be noted that if the fan blows into the under-floor space service pipes, particularly central heating or water pipes, could be at risk through freezing and that draughts may be a problem inside the house. On the other hand, if suction is applied then the operation of open-flue combustion appliances may be affected (Scivyer, 2007).
B4 PASSIVE VENTILATION OF LIVING SPACE
Improvements to ventilation of the house (such as trickle ventilators) can reduce radon levels by diluting the concentration of radon in the building (Scivyer, 1993). Preferentially, the ventilators should be located on the lower floors of the house, to avoid increasing the “stack effect”, and be kept permanently open. However, some householders choose to keep these closed.
If the house has an open-flue chimney; an adequate air supply should be provided directly from outside to replace large volumes of air drawn through the chimney. The aim is to reduce the pressure differential between the inside and outside of the building. Alternatively, unused chimneys can be blocked. It should be noted that if chimneys are permanently blocked then action should be taken to prevent condensation from building up inside the chimney (Scivyer, 2007).
B5 SEALING FLOORS AND LOFT HATCHES
Sealing the floor seems to be an obvious method for reducing the entry of radon, but it is difficult to implement effectively (Pye, 1993). Completely sealing a suspended timber floor with a membrane is not recommended; this can cause timber rot problems if there is inadequate under-floor ventilation and consequently a build up of damp. However, sealing large gaps, such as those around service pipes entering the property through the floor, can reduce radon levels to a limited degree.
In some properties, floor vents link the under-floor space to the inside of the building. These vents usually provide ventilation for the under-floor space or to an open flue combustion appliance. Sealing these vents can reduce radon but alternative air supplies must be provided in their place.
Loft hatches can also be sealed to reduce bulk movement of air through the dwelling from the ground floor (stack effect) which in turn will reduce the negative pressure within the dwelling and hence reduce the accumulation of radon in the building.
B6 BASEMENTS
Radon sumps are used for houses with basements (usually occupied as a living area) and cellars (generally used as a storage area). Under certain conditions the sump can be located under the floor of the basement (Scivyer and Jaggs, 1998b).

AN ANALYSIS OF RADON REMEDIATION METHODS
40
Cellars can be positively ventilated using a fan to blow in fresh air. Radon in the cellar is diluted and ingress of radon from the ground can be reduced due to a possible increase in air pressure (Scivyer and Jaggs, 1998b). It is important that the doors to the main house have a good seal.

APPENDIX C
41
APPENDIX C Detailed results of remedial analysis
The results of the regression analysis are listed in Tables C1 to C7. These tables show the reduction factor as the relative effectiveness of the methods employed. The confidence interval (CI) indicates the range of values within which there is 95% chance that the true mean lies in the interval. The statistical significance of the results is indicated by the p-value. Confidence Intervals tend to be large when the sample size is small.
Table C1 shows the overall relative effectiveness of remediation methods employed. A brief discussion is given in the main text (Section 4.1.1).
Table C1 Distribution and performance of methods to reduce radon levels in homes
Remediation Frequency % Reduction factor 95% confidence interval
Active sump 771 29 6.0** 5.5 6.4
Passive (pipe inside house) 77 3 1.9** 1.5 2.4
Passive sump (pipe outside house) 131 5 1.8** 1.5 2.1
Positive ventilation 495 18 2.1** 1.9 2.3
Natural under-floor ventilation 636 24 1.7** 1.6 1.8
Active under-floor ventilation 128 5 2.2** 1.8 2.6
Active under-floor ventilation fan blowing (24/128) <1 2.1** 1.4 3.1
Active under-floor ventilation fan sucking (70/128) 3 2.6** 2.0 3.3
Passive ventilation 259 10 1.3** 1.2 1.5
Sealing floors 185 7 1.3** 1.2 1.6
Sealing loft hatch 17 <1 1.2 0.74 1.9
Total 2700 100
*p<0.05 **p<0.001
Table C2 shows the effect on remediation methods for detached, semi detached, mid-terraced houses and flats.
• Generally house type makes little difference to the reduction factors for each remedial type.
• In some cases there are wider variations in the reduction factor when the sample size is small, for example with passive sumps (pipe inside) in flats.
• The sample of flats is small and the floor level of each was not recorded. This may account for a large range in the CI.
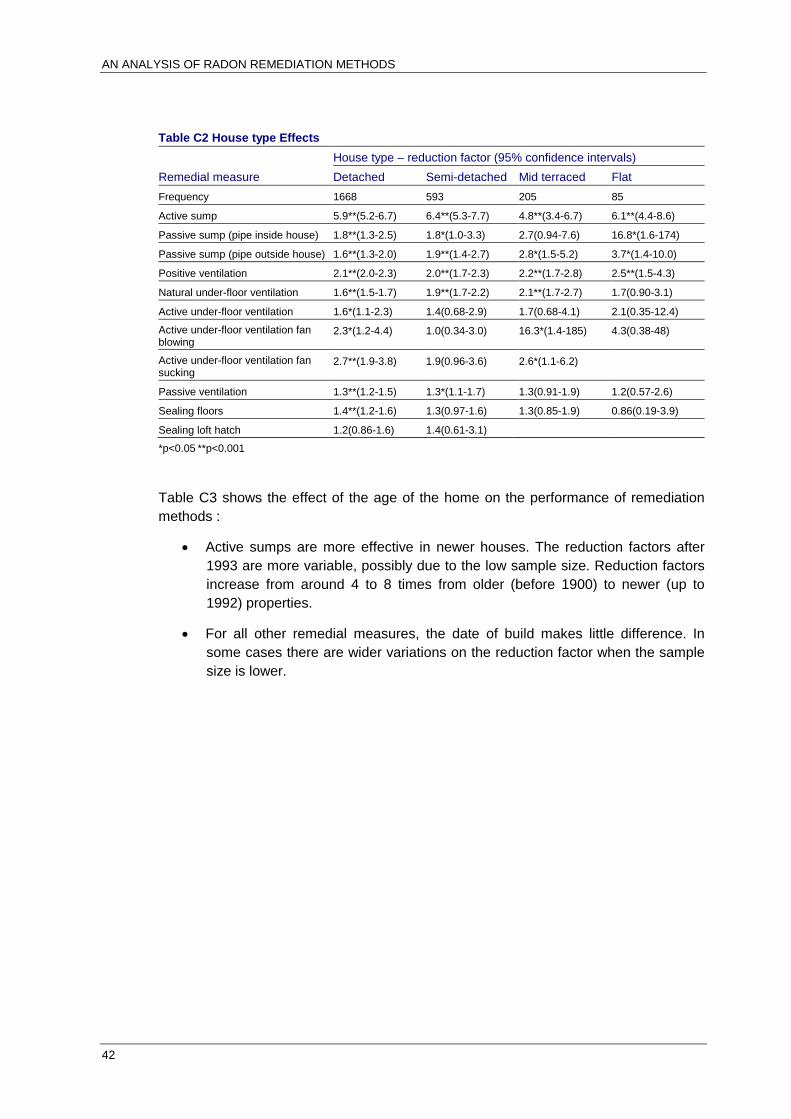
AN ANALYSIS OF RADON REMEDIATION METHODS
42
Table C2 House type Effects
Remedial measure House type – reduction factor (95% confidence intervals) Detached Semi-detached Mid terraced Flat
Frequency 1668 593 205 85
Active sump 5.9**(5.2-6.7) 6.4**(5.3-7.7) 4.8**(3.4-6.7) 6.1**(4.4-8.6)
Passive sump (pipe inside house) 1.8**(1.3-2.5) 1.8*(1.0-3.3) 2.7(0.94-7.6) 16.8*(1.6-174)
Passive sump (pipe outside house) 1.6**(1.3-2.0) 1.9**(1.4-2.7) 2.8*(1.5-5.2) 3.7*(1.4-10.0)
Positive ventilation 2.1**(2.0-2.3) 2.0**(1.7-2.3) 2.2**(1.7-2.8) 2.5**(1.5-4.3)
Natural under-floor ventilation 1.6**(1.5-1.7) 1.9**(1.7-2.2) 2.1**(1.7-2.7) 1.7(0.90-3.1)
Active under-floor ventilation 1.6*(1.1-2.3) 1.4(0.68-2.9) 1.7(0.68-4.1) 2.1(0.35-12.4)
Active under-floor ventilation fan blowing
2.3*(1.2-4.4) 1.0(0.34-3.0) 16.3*(1.4-185) 4.3(0.38-48)
Active under-floor ventilation fan sucking
2.7**(1.9-3.8) 1.9(0.96-3.6) 2.6*(1.1-6.2)
Passive ventilation 1.3**(1.2-1.5) 1.3*(1.1-1.7) 1.3(0.91-1.9) 1.2(0.57-2.6)
Sealing floors 1.4**(1.2-1.6) 1.3(0.97-1.6) 1.3(0.85-1.9) 0.86(0.19-3.9)
Sealing loft hatch 1.2(0.86-1.6) 1.4(0.61-3.1)
*p<0.05 **p<0.001
Table C3 shows the effect of the age of the home on the performance of remediation methods :
• Active sumps are more effective in newer houses. The reduction factors after 1993 are more variable, possibly due to the low sample size. Reduction factors increase from around 4 to 8 times from older (before 1900) to newer (up to 1992) properties.
• For all other remedial measures, the date of build makes little difference. In some cases there are wider variations on the reduction factor when the sample size is lower.

APPENDIX C
43
Table C3 Date built effects
Remedial measure Date built – reduction factor (95% confidence intervals) Before 1900 1900-1919 1920-1944 1945-1964 1965-1976 1977-1992 1993-2000 After 2000
Frequency 673 122 232 426 556 348 39 30
Active sump 3.8**(3.2-4.5) 4.2**(2.6-6.8) 4.9**(3.3-7.3) 6.8**(5.3-8.8) 8.1**(6.6-9.9) 8.3**(6.6-10.5) 15**(7.0-30) 5.4*(1.5-19)
Passive sump (pipe inside house) 1.9*(1.2-3.1) 1.8(0.44-7.3) 2.0(0.49-8.2) 1.8*(1.0-3.2) 1.5(0.71-3.1) 2.3*(1.1-4.8) 7.8(0.68-87)
Passive sump (pipe outside house)
1.4(0.98-2.0) 1.2(0.58-2.6) 1.2(0.60-2.5) 2.3**(1.4-3.8) 2.5**(1.7-3.8) 1.9*(1.2-3.1) 1.2(0.44-3.2) 5.1*(1.2-21)
Positive ventilation 1.8**(1.6-2.1) 2.5**(1.8-3.5) 2.4**(1.7-3.3) 2.2**(1.8-2.5) 2.4**(2.0-2.8) 2.0**(1.7-2.4) 2.2*(1.2-4.2) 0.95(0.32-2.8)
Natural under-floor ventilation 1.6**(1.3-1.8) 1.2(0.96-1.6) 1.5**(1.3-1.8) 1.7**(1.5-1.9) 1.8**(1.6-2.1) 1.8**(1.4-2.3) 2.8**(1.7-4.6) 1.9*(1.3-3.1)
Active under-floor ventilation 1.3(0.7-2.3) 2.4(0.98-6.1) 1.3(0.59-2.6) 1.3(0.52-3.3) 1.4(0.49-4.0) 2.4(0.65-8.6)
Active under-floor ventilation fan blowing
1.8(0.7-4.5) 0.99(0.16-6.3) 1.3(0.28-5.8) 1.8(0.41-8.3) 2.2(0.5-10) 34*(2.5-450) 8.8(0.66-120)
Active under-floor ventilation fan sucking
2.1*(1.3-3.2) 4.3*(1.5-12) 3.0**(1.6-5.6) 2.1(0.85-4.9) 3.7(0.96-14) 3.3*(1.6-6.9)
Passive ventilation 1.2(0.97-1.5) 0.92(0.49-1.7) 1.2(0.76-1.8) 1.7**(1.3-2.2) 1.4**(1.2-1.8) 1.2(0.89-1.6) 1.5(0.79-2.8) 1.1(0.56-2.0)
Sealing floors 1.2*(1.0-1.5) 1.2(0.71-1.2) 1.2(0.73-2.1) 1.4(0.89-2.2) 1.3*(1.1-1.7) 1.8**(1.3-2.5) 1.2(0.25-5.4) 0.86(0.29-2.5)
Sealing loft hatch 0.79(0.31-2.0) 1.6(0.64-3.9) 2.6(0.73-9.6) 0.95(0.45-2.0) 1.2(0.65-2.4) 1.2(0.58-2.6)
*p<0.05 **p<0.001
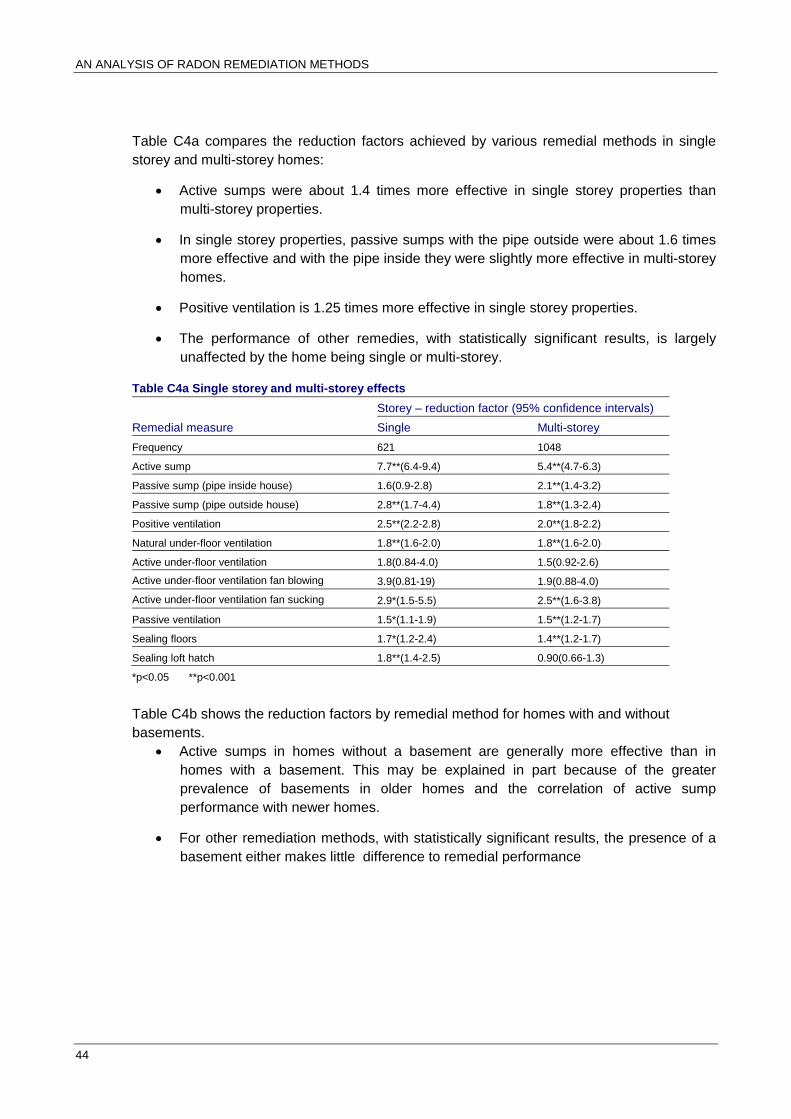
AN ANALYSIS OF RADON REMEDIATION METHODS
44
Table C4a compares the reduction factors achieved by various remedial methods in single storey and multi-storey homes:
• Active sumps were about 1.4 times more effective in single storey properties than multi-storey properties.
• In single storey properties, passive sumps with the pipe outside were about 1.6 times more effective and with the pipe inside they were slightly more effective in multi-storey homes.
• Positive ventilation is 1.25 times more effective in single storey properties.
• The performance of other remedies, with statistically significant results, is largely unaffected by the home being single or multi-storey.
Table C4a Single storey and multi-storey effects
Remedial measure Storey – reduction factor (95% confidence intervals) Single Multi-storey
Frequency 621 1048
Active sump 7.7**(6.4-9.4) 5.4**(4.7-6.3)
Passive sump (pipe inside house) 1.6(0.9-2.8) 2.1**(1.4-3.2)
Passive sump (pipe outside house) 2.8**(1.7-4.4) 1.8**(1.3-2.4)
Positive ventilation 2.5**(2.2-2.8) 2.0**(1.8-2.2)
Natural under-floor ventilation 1.8**(1.6-2.0) 1.8**(1.6-2.0)
Active under-floor ventilation 1.8(0.84-4.0) 1.5(0.92-2.6)
Active under-floor ventilation fan blowing 3.9(0.81-19) 1.9(0.88-4.0)
Active under-floor ventilation fan sucking 2.9*(1.5-5.5) 2.5**(1.6-3.8)
Passive ventilation 1.5*(1.1-1.9) 1.5**(1.2-1.7)
Sealing floors 1.7*(1.2-2.4) 1.4**(1.2-1.7)
Sealing loft hatch 1.8**(1.4-2.5) 0.90(0.66-1.3)
*p<0.05 **p<0.001
Table C4b shows the reduction factors by remedial method for homes with and without basements.
• Active sumps in homes without a basement are generally more effective than in homes with a basement. This may be explained in part because of the greater prevalence of basements in older homes and the correlation of active sump performance with newer homes.
• For other remediation methods, with statistically significant results, the presence of a basement either makes little difference to remedial performance

APPENDIX C
45
Table C4b Basement effects
Remedial measure Reduction factor (95% confidence intervals) Basement No basement
Frequency 247 1711
Active sump 3.8**(2.8-5.2) 6.4**(5.6-7.1)
Passive sump (pipe inside house) 2.0(0.51-7.8) 2.1**(1.4-3.1)
Passive sump (pipe outside house) 1.3(0.31-5.3) 1.7**(1.4-2.1)
Positive ventilation 2.2**(1.5-3.0) 2.1**(1.9-2.2)
Natural under-floor ventilation 1.8**(1.5-2.1) 1.7**(1.5-1.8)
Active under-floor ventilation 1.7(0.94-3.1) 1.3(0.84-2.1)
Active under-floor ventilation fan blowing 1.8(0.91-3.6) 2.1*(1.0-4.3)
Active under-floor ventilation fan sucking 1.9*(1.2-3.1) 2.9**(2.1-4.3)
Passive ventilation 0.95(0.60-1.5) 1.3**(1.2-1.5)
Sealing floors 1.2(0.82-1.9) 1.3**(1.2-1.5)
Sealing loft hatch 1.2(0.88-1.7)
*p<0.05 **p<0.001
Table C5 shows the effects on remedial methods when a house has full, part or no double glazing: there is a small trend for most remedial measures to be more effective when there is more double glazing.
Table C5 Double glazing effects
Remedial measure Amount of double glazing – reduction factor (95% confidence intervals) Full Part None
Frequency 1763 408 368
Active sump 6.6**(5.8-7.3) 6.0**(4.7-7.6) 4.7**(3.7-6.0)
Passive sump (pipe inside house) 2.2**(1.6-3.2) 1.6(0.82-3.0) 1.4(0.72-2.8)
Passive sump (pipe outside house) 1.9**(1.5-2.3) 2.2*(1.3-3.7) 1.2(0.79-1.9)
Positive ventilation 2.3**(2.1-2.5) 1.9**(1.6-2.2) 1.8**(1.6-2.2)
Natural under-floor ventilation 1.8**(1.6-1.9) 1.6**(1.4-1.9) 1.4**(1.2-1.8)
Active under-floor ventilation 1.5*(1.2-2.1) 0.64(0.28-1.5) 5.3**(2.3-12)
Active under-floor ventilation fan blowing
2.2*(1.1-4.8) 1.8(0.58-5.9) 1.6(0.21-12)
Active under-floor ventilation fan sucking
3.2**(2.2-4.8) 2.3**(1.4-3.8) 2.0(0.93-4.2)
Passive ventilation 1.4**(1.2-1.6) 1.2(0.95-1.6) 1.1(0.82-1.53)
Sealing floors 1.4**(1.2-1.6) 1.3(0.97-1.6) 1.2(0.93-1.6)
Sealing loft hatch 1.2(0.89-1.7) 0.91(0.39-2.1)
*p<0.05 **p<0.001
Table C6 shows the effectiveness of methods in houses with different floor types.
• For all floor types, active sumps are the most effective remedy.
• Active under-floor ventilation is more effective than natural under-floor ventilation for solid floors. Active under floor ventilation for basements (fan blowing) reduces levels by 7.5 times (reduction factor range: 1 to 50 times, probably due to small sample numbers).

AN ANALYSIS OF RADON REMEDIATION METHODS
46
• For other remedies, the floor type makes little difference.
Table C6 Effects of ground floor type for each type of remediation
Remedial measure
Ground floor type – reduction factor (95% confidence intervals)
All solid (direct onto solid earth)
All suspended over a small space
Mix of solid and suspended
Over a basement or cellar (floor type not known)
Frequency 1087 342 582 94
Active sump 6.3**(5.6-7.2) 7.1**(4.5-11) 4.0**(3.1-5.2) 3.6**(2.3-5.5)
Passive sump (pipe inside house) 2.3**(1.6-3.5) 0.70(0.06-8.5) 2.4(0.70-8.5) 0.95(0.08-12)
Passive sump (pipe outside house)
1.9**(1.5-2.4) 1.9(0.80-4.6) 1.2(0.72-2.1)
Positive ventilation 2.2**(2.0-2.4) 2.0**(1.6-2.5) 1.9**(1.6-2.2) 3.3**(1.9-5.7)
Natural under-floor ventilation 1.4*(1.1-1.8) 1.7**(1.6-1.9) 1.7**(1.5-1.8) 2.1**(1.6-2.7)
Active under-floor ventilation 2.9*(1.2-6.8) 1.2(0.70-2.0) 1.6*(1.0-2.5)
Active under-floor ventilation fan blowing
2.2(0.61-8.4) 2.9*(1.0-8.6) 1.3(0.58-3.1) 7.5*(1.2-48)
Active under-floor ventilation fan sucking
1.9*(1.1-3.2) 3.1**(2.1-4.4) 1.9(0.95-3.6)
Passive ventilation 1.3**(1.1-1.5) 1.9**(1.3-2.7) 1.2(0.90-1.6) 0.96(0.29-3.2)
Sealing floors 1.4**(1.2-1.6) 1.1(0.7-1.6) 0.97(0.74-1.3) 1.5(0.82-2.7)
Sealing loft hatch 1.2(0.79-1.8) 0.90(0.32-2.5)
*p<0.05 **p<0.001
Table C7 shows the effectiveness of remediation methods with heating types
• Heating type has little effect on the effectiveness of all methods.
• Performance in homes with central heating is generally better when there is not an open fire.
Table C7 Effects of heating type
Remedial measure
Heating type – reduction factor (95% confidence intervals)
Central heating Central heating with open fire Open fire
Frequency 1289 938 83
Active sump 6.4**(5.7-7.5) 5.2**(4.4-6.2) 6.6**(3.9-11)
Passive sump (pipe inside house) 2.2**(1.4-3.5) 1.9*(1.2-3.2) 1.9(0.36-10)
Passive sump (pipe outside house) 2.0**(1.5-2.6) 1.4*(1.1-1.9) 1.3(0.18-9.4)
Positive ventilation 2.3**(2.1-2.5) 1.9**(1.7-2.1) 2.9**(2.0-4.1)
Natural under-floor ventilation 1.7**(1.6-1.8) 1.6**(1.5-1.8) 1.4(1.0-1.9)
Active under-floor ventilation 1.3(0.83-2.1) 1.7*(1.0-2.8)
Active under-floor ventilation fan blowing 4.3**(2.0-9.5) 1.4(0.81-2.6)
Active under-floor ventilation fan sucking 2.9**(2.0-4.1) 2.0*(1.3-3.2) 3.2(0.87-12)
Passive ventilation 1.3**(1.1-1.5) 1.2*(1.0-1.5) 1.3(0.72-2.3)
Sealing floors 1.5**(1.2-1.8) 1.2(0.98-1.4) 2.0*(1.0-3.9)
Sealing loft hatch 1.1(0.78-1.6) 1.3(0.84-2.1)
*p<0.05 * *p<0.001

APPENDIX D
47
APPENDIX D Probit plot
As expected, a range of reduction factors was observed in the study. To compare the likely reduction factor in different situations, it is useful to have a measure of the reduction factor that adequately represents the observed distribution. Where observed values fit a normal distribution, the arithmetic mean is an appropriate measure. For distributions that are more log-normally distributed, the geometric mean is a more appropriate measure.
The log-normal probit plot was used in order to assess whether the radon reduction factors (ratio of radon concentration before and after remediation) are approximately normally distributed (2,400 homes). Figure D1 shows a probit plot of radon reduction factors with a logarithmic scale on the Y axis. Using the data from the radon reduction factors, the probit can be calculated. The probit is the value of standard normal distribution which corresponds to the cumulative percentage of the radon reduction factors. The probit determined from this dataset is then plotted against the radon reduction factors. If the curve is linear then this indicates a log-normal distribution. This plot of reduction factors shows that there is deviation from linearity in the upper and lower tails of the distribution. These two upward curves suggest a mixture of two log-normal distributions. One explanation is that one remediation method has a much higher radon reduction factor than the other methods. Therefore, adding all the data together from different remediation methods, the data might not be expected to be normally distributed (Fig.2). Individual remedies plotted separately show log-normal distribution; our findings were similar to Naismith et al. 1998 (Naismith et al, 1998). For the purpose of this study, we can treat the plots as log-normal distributions and use the geometric mean as the characteristic measure.
Figure D1: Normal probit plot of radon reduction factor for all remedies
Probit
Rad
on re
duct
ion
fact
or
-4 -2 0 2 4
10-1.0
100.0
101.0
102.0
100
10
1
0.1
-4 -2 0 2 4