hox photochemistry during dc3 abstract # a41b-0040 · ho2 generally well, with a median...
TRANSCRIPT
Observation Results
Model Comparisons Instantaneous Ozone Production and Loss
HOx Budget
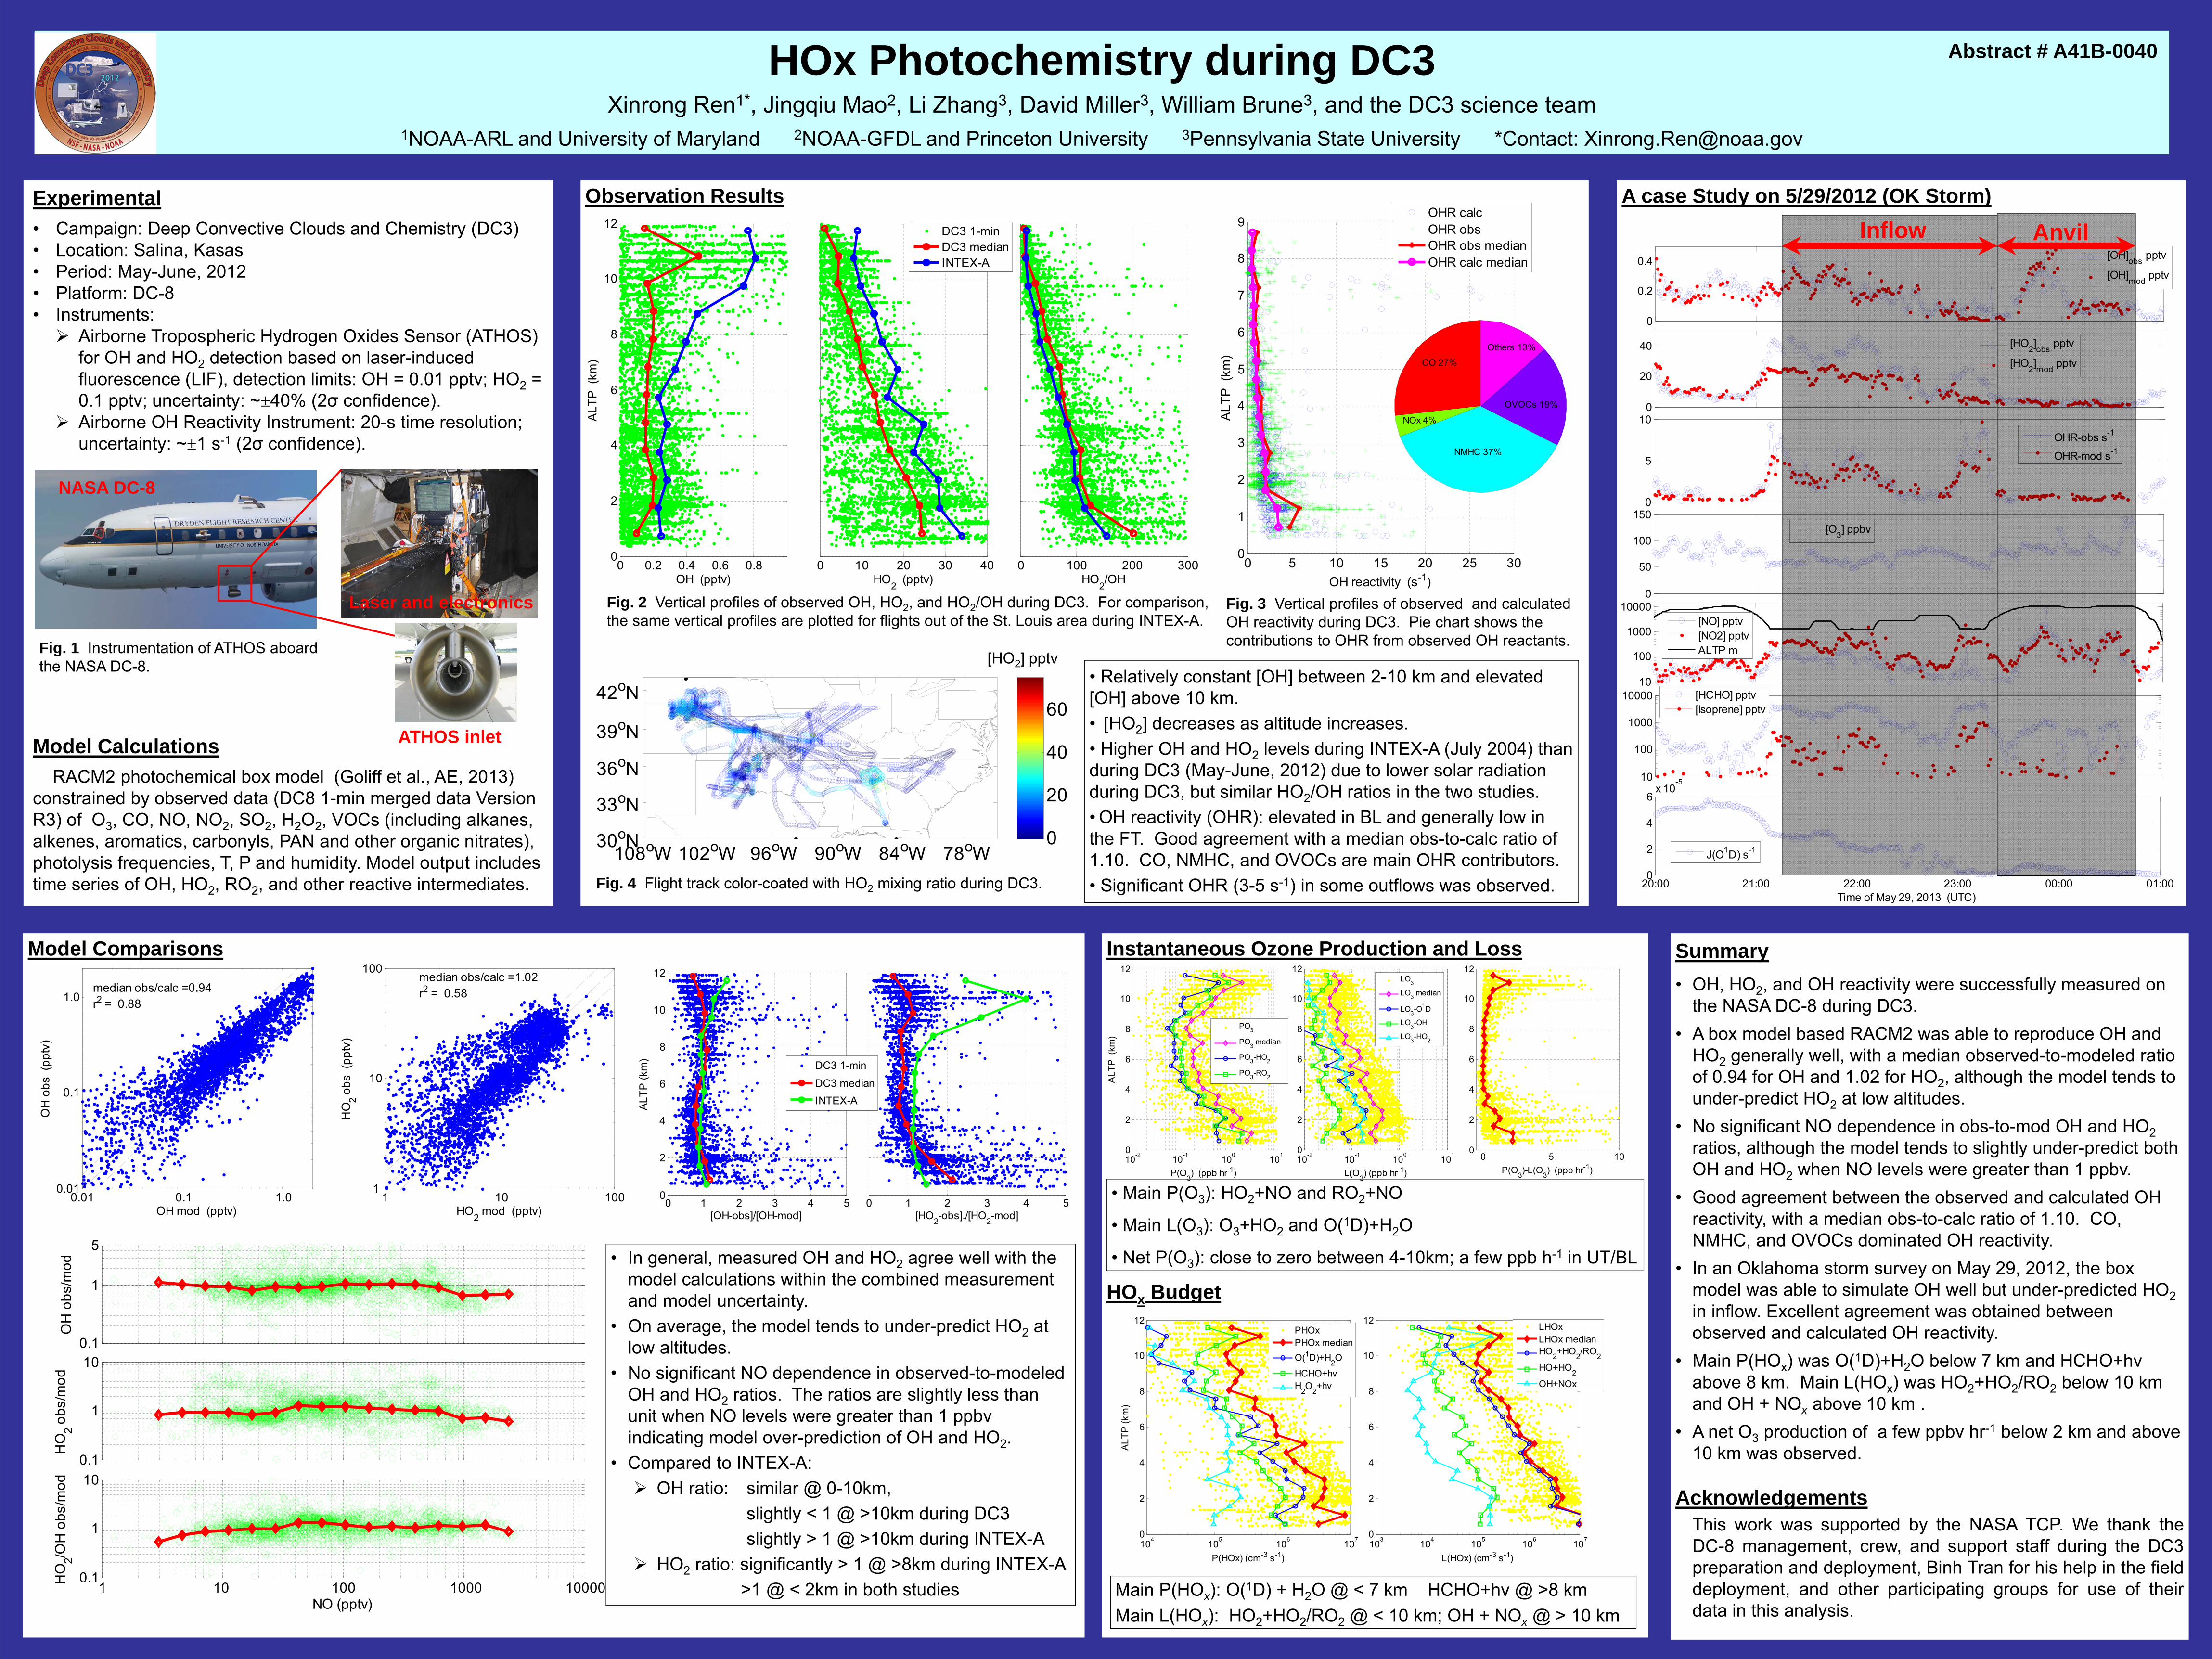
A case Study on 5/29/2012 (OK Storm)
HOx Photochemistry during DC3Xinrong Ren1*, Jingqiu Mao2, Li Zhang3, David Miller3, William Brune3, and the DC3 science team
1NOAA-ARL and University of Maryland 2NOAA-GFDL and Princeton University 3Pennsylvania State University *Contact: [email protected]
Experimental• Campaign: Deep Convective Clouds and Chemistry (DC3)• Location: Salina, Kasas• Period: May-June, 2012• Platform: DC-8• Instruments: Airborne Tropospheric Hydrogen Oxides Sensor (ATHOS)
for OH and HO2 detection based on laser-induced fluorescence (LIF), detection limits: OH = 0.01 pptv; HO2 = 0.1 pptv; uncertainty: ~±40% (2σ confidence).
Airborne OH Reactivity Instrument: 20-s time resolution; uncertainty: ~±1 s-1 (2σ confidence).
Platform: DC-8
Model CalculationsRACM2 photochemical box model (Goliff et al., AE, 2013)
constrained by observed data (DC8 1-min merged data Version R3) of O3, CO, NO, NO2, SO2, H2O2, VOCs (including alkanes, alkenes, aromatics, carbonyls, PAN and other organic nitrates), photolysis frequencies, T, P and humidity. Model output includes time series of OH, HO2, RO2, and other reactive intermediates.
Summary• OH, HO2, and OH reactivity were successfully measured on
the NASA DC-8 during DC3.• A box model based RACM2 was able to reproduce OH and
HO2 generally well, with a median observed-to-modeled ratio of 0.94 for OH and 1.02 for HO2, although the model tends to under-predict HO2 at low altitudes.
• No significant NO dependence in obs-to-mod OH and HO2ratios, although the model tends to slightly under-predict both OH and HO2 when NO levels were greater than 1 ppbv.
• Good agreement between the observed and calculated OH reactivity, with a median obs-to-calc ratio of 1.10. CO, NMHC, and OVOCs dominated OH reactivity.
• In an Oklahoma storm survey on May 29, 2012, the box model was able to simulate OH well but under-predicted HO2in inflow. Excellent agreement was obtained between observed and calculated OH reactivity.
• Main P(HOx) was O(1D)+H2O below 7 km and HCHO+hvabove 8 km. Main L(HOx) was HO2+HO2/RO2 below 10 km and OH + NOx above 10 km .
• A net O3 production of a few ppbv hr-1 below 2 km and above 10 km was observed.
AcknowledgementsThis work was supported by the NASA TCP. We thank theDC-8 management, crew, and support staff during the DC3preparation and deployment, Binh Tran for his help in the fielddeployment, and other participating groups for use of theirdata in this analysis.
Main P(HOx): O(1D) + H2O @ < 7 km HCHO+hv @ >8 kmMain L(HOx): HO2+HO2/RO2 @ < 10 km; OH + NOx @ > 10 km
• In general, measured OH and HO2 agree well with the model calculations within the combined measurement and model uncertainty.
• On average, the model tends to under-predict HO2 at low altitudes.
• No significant NO dependence in observed-to-modeled OH and HO2 ratios. The ratios are slightly less than unit when NO levels were greater than 1 ppbvindicating model over-prediction of OH and HO2.
• Compared to INTEX-A: OH ratio: similar @ 0-10km,
slightly < 1 @ >10km during DC3slightly > 1 @ >10km during INTEX-A
HO2 ratio: significantly > 1 @ >8km during INTEX-A>1 @ < 2km in both studies
• Relatively constant [OH] between 2-10 km and elevated [OH] above 10 km.• [HO2] decreases as altitude increases.• Higher OH and HO2 levels during INTEX-A (July 2004) than during DC3 (May-June, 2012) due to lower solar radiation during DC3, but similar HO2/OH ratios in the two studies.• OH reactivity (OHR): elevated in BL and generally low in the FT. Good agreement with a median obs-to-calc ratio of 1.10. CO, NMHC, and OVOCs are main OHR contributors.• Significant OHR (3-5 s-1) in some outflows was observed.
NASA DC-8
ATHOS inlet
Laser and electronics
0 0.2 0.4 0.6 0.80
2
4
6
8
10
12
OH (pptv)A
LTP
(km
)
0 10 20 30 40
HO2 (pptv)0 100 200 300
HO2/OH
DC3 1-minDC3 medianINTEX-A
Fig. 1 Instrumentation of ATHOS aboard the NASA DC-8.
Fig. 2 Vertical profiles of observed OH, HO2, and HO2/OH during DC3. For comparison, the same vertical profiles are plotted for flights out of the St. Louis area during INTEX-A.
108oW 102oW 96oW 90oW 84oW 78oW 30oN
33oN
36oN
39oN
42oN
0
20
40
60
[HO2] pptv
Fig. 3 Vertical profiles of observed and calculated OH reactivity during DC3. Pie chart shows the contributions to OHR from observed OH reactants.
Fig. 4 Flight track color-coated with HO2 mixing ratio during DC3.
0 1 2 3 4 50
2
4
6
8
10
12
[OH-obs]/[OH-mod]
ALTP
(km
)
0 1 2 3 4 5[HO2-obs]./[HO2-mod]
DC3 1-minDC3 medianINTEX-A
0 5 10 15 20 25 300
1
2
3
4
5
6
7
8
9
OH reactivity (s-1)
ALT
P (
km)
OHR calcOHR obsOHR obs medianOHR calc median
CO 27%
NOx 4%
NMHC 37%
OVOCs 19%
Others 13%
• Main P(O3): HO2+NO and RO2+NO
• Main L(O3): O3+HO2 and O(1D)+H2O
• Net P(O3): close to zero between 4-10km; a few ppb h-1 in UT/BL
10-2 10-1 100 1010
2
4
6
8
10
12
P(O3) (ppb hr-1)
ALT
P (
km)
PO3
PO3 median
PO3-HO2
PO3-RO2
10-2 10-1 100 1010
2
4
6
8
10
12
L(O3) (ppb hr-1)
LO3
LO3 median
LO3-O1D
LO3-OH
LO3-HO2
0 5 100
2
4
6
8
10
12
P(O3)-L(O3) (ppb hr-1)
104 105 106 1070
2
4
6
8
10
12
P(HOx) (cm-3 s-1)
ALTP
(km
)
PHOxPHOx medianO(1D)+H2OHCHO+hvH2O2+hv
103 104 105 106 1070
2
4
6
8
10
12
L(HOx) (cm-3 s-1)
LHOxLHOx medianHO2+HO2/RO2HO+HO2OH+NOx
0.01 0.1 1.00.01
0.1
1.0
OH mod (pptv)
OH
obs
(pp
tv)
median obs/calc =0.94r2 = 0.88
1 10 100 1
10
100
HO2 mod (pptv)
HO
2 obs
(pp
tv)
median obs/calc =1.02 r2 = 0.58
0.1
1
5
OH
obs
/mod
0.1
1
10
HO
2 obs
/mod
1 10 100 1000 100000.1
1
10
NO (pptv)
HO
2/OH
obs
/mod
0
0.2
0.4
[OH]obs pptv
[OH]mod pptv
0
20
40
[HO2]obs pptv
[HO2]mod pptv
0
5
10
OHR-obs s-1
OHR-mod s-1
0
50
100
150
[O3] ppbv
10
100
1000
10000
10
100
1000
10000
[HCHO] pptv[Isoprene] pptv
20:00 21:00 22:00 23:00 00:00 01:000
2
4
6x 10
-5
Time of May 29, 2013 (UTC)
J(O1D) s-1
[NO] pptv[NO2] pptvALTP m
Inflow Anvil
Abstract # A41B-0040