how workers use 401k plans: the participation, … this paper examines how workers use 401(k) plans...
TRANSCRIPT
How Workers Use 401(k) Plans:
The Participation, Contribution, and Withdrawal Decisions
William F. BassettDepartment of Economics
Brown UniversityProvidence, RI 02912
Michael J. FlemingResearch and Market Analysis GroupFederal Reserve Bank of New York
New York, NY 10045
Anthony P. RodriguesResearch and Market Analysis GroupFederal Reserve Bank of New York
New York, NY 10045
Abstract
This paper examines how workers use 401(k) plans by examining their participation,contribution, and withdrawal decisions. Sixty-five percent of eligible workersparticipate in 401(k) plans. Employee participation rises with income, age, job tenure,and education. While participation also rises if the employer matches contributions,401(k) participation does not grow with the rate of matching. When pension planassets are withdrawn in lump-sum distributions before retirement, just 28 percent ofdistribution recipients (representing 56 percent of distribution assets) roll over thewithdrawn funds into tax-qualified savings plans. Our findings suggest that manyworkers, particularly those with low incomes, do not use 401(k) plans to save forretirement.

1
Introduction
An increasing fraction of the work force is being offered an employer-sponsored pension plan
where the worker makes the critical plan decisions. These decisions include whether to participate,
how much to contribute, how to invest the plan assets, and what to do with the plan assets should
one receive them upon switching jobs. Such salary reduction plans, of which the 401(k) is the most
common type, are now available to more than 40 percent of the workforce. Half of the workers1
offered such plans are offered no other employer-sponsored retirement plan.2
In this study, we use data from the April 1993 Current Population Survey and its Survey of
Employee Benefits supplement (CPS) to examine how workers use 401(k) plans. Participation,
contribution, and distribution rollover decisions are reviewed in aggregate and across income groups,
and models are developed that relate participation and rollovers to a variety of factors. We also use
a new question on the April 1993 CPS to determine how employer matching contributions affect the
participation decisions of employees.
Among workers offered 401(k) plans, we find that 35 percent do not participate. While 81
percent of workers with family incomes of at least $75,000 choose to participate, only 36 percent of
workers with family incomes less than $15,000 participate. Other factors besides income that are
positively related to the participation decision include age, job tenure, education, home ownership,
and whether the 401(k) is the only employer-sponsored retirement plan. Workers with employer
matches are also more likely to participate in 401(k) plans than workers without such matches. No
evidence is found that the level of the employer match has a positive impact on employee
participation, however.3
2
We also find that nearly one half of workers who had a pension plan on a previous job report
taking a lump-sum distribution from the plan before retirement age. In recent years, only 28 percent
of the distribution recipients have rolled over this money into tax-qualified plans, representing 56
percent of the distributed assets. Workers with higher incomes, those with more education, and those
who own a home are more likely to roll over their distributions. The size of the distribution is also
an important predictor, with larger distributions more frequently being rolled over into tax-qualified
plans (Chang (1996), Gelbach (1995), and Poterba, Venti, and Wise (1995a) similarly report
distribution size and demographic variables to be important to the rollover decision in related
analyses).
It may be that 401(k) plans have expanded pension plan sponsorship, and that many workers
are participating now who otherwise would have had no coverage. Nevertheless, our findings show
that a large number of workers, particularly those with low incomes, are not using 401(k) plans to
save for retirement. Participation rates in 401(k) plans are low, contributions are modest, and
substantial amounts of pre-retirement distributions are allocated for purposes other than retirement
saving.
Our discussion proceeds in the following steps: We begin by describing the different types of
pension plans and examining recent trends in their use. After briefly discussing our data source, we
review the evidence on employee participation and contributions to salary reduction plans, with an
emphasis on the role of income. We then discuss employer match rates and their possible influence
on employee actions. Statistical models that measure determinants of the participation decision are
presented in the following section. Finally, we examine recent evidence on pre-retirement lump-sum
pension plan distributions and factors that influence the rollover decision.

3
Pension Plans Defined4
Employer-sponsored pension plans can be categorized as defined benefit (DB) or defined
contribution (DC). In a DB plan, the employer makes a promise to provide a lifetime nominal annuity5
to eligible employees at retirement. The size of the obligation to each covered employee usually6
depends on the worker's salary and years of service. A typical plan might promise an annual benefit
equal to 1.5 percent of salary times years of service, where salary is calculated as the average salary
of the five highest paid years. Employers use actuarial techniques to estimate the pension liability and
fund the liability as it accrues. Employers direct management of the plan assets, and assume
responsibility for investment gains and losses. Participant benefits are partially insured by the Pension
Benefit Guaranty Corporation (PBGC).
In a DC plan the employer makes a contribution to each participant's individual account. The
size of the contribution depends on employee salary, employee contributions, employer profits, or
some other criteria, but is rarely actuarially based. Workers assume responsibility for the plan's
investment gains and losses, and often direct how their assets are invested. DC plans provide no
guarantee as to the level of benefits that will ultimately accrue, and plan assets are not insured by the
PBGC.
In addition to these differences in funding and management, employee access to retirement
plan assets varies greatly across the fund types. Workers with DB plans have no access to the plan
funds before retirement, even if they leave their sponsoring employer. In contrast, workers with DC7
plans who stay with their employer may be offered the opportunity to borrow funds from their plan.
Certain types of DC plans (profit sharing and stock bonus plans that are not qualified as 401(k)s) also
allow plan withdrawals after a fixed period of time or service. In addition, workers who leave their

4
employer have the option of receiving a lump-sum distribution of the DC plan assets.8
DC plans can also protect against inflation better than DB plans for workers who switch jobs.
The reason is that DB plan benefits are typically based on final nominal salary and therefore freeze
when a worker switches jobs. A worker who leaves a job with a DB plan suffers a capital loss directly
proportional to future expected nominal wage growth (which should at least partly incorporate
expected future inflation). In contrast, a worker who leaves a job with a DC plan suffers no such9
loss. DC plan assets can remain invested when an employee switches jobs and, depending on the
investment vehicle, can earn a return that offsets future inflation.
The types of DC plans include employee stock ownership plans, money purchase pension
plans, profit sharing plans, simplified employee pensions, stock bonus plans, target benefit plans, and
thrift or savings plans. The most common DC arrangement is the 401(k). A 401(k) is a profit sharing
or stock bonus plan that contains a cash-or-deferred-arrangement (CODA). With a CODA, eligible
employees have the option of having their employer make a contribution to a plan on their behalf, or
of receiving an equivalent amount in cash. Plan contributions are excluded from employee income for
the year in which they are made, subject to limitations.10
The most prevalent CODA is a salary reduction agreement. With a salary reduction11
agreement, eligible employees may elect to reduce their compensation and have the difference
contributed to the plan by the employer. Employers often add a matched amount to the plan that
depends on the amount contributed by the employee. A typical employer match is 50¢ for each $1
contributed by the employee, with the match ending when employee contributions reach six percent
of salary.
401(k) plans are thus a particularly flexible form of DC plan. Like other DC plans, state and
5
Federal taxes on contributions and investment earnings are deferred until the assets are distributed
or withdrawn. Participants assume responsibility for the plan’s investment performance, and12
typically direct the management of their investment across a menu selected by their employer. Plan13
loans are allowed and plan assets are usually distributed to participants when leaving the sponsoring
employer. Unlike other DC plans, the participation and contribution decisions are solely or mostly
at the employee's discretion. Accessing funds is also generally easier with 401(k) plans as sponsors
can allow early withdrawals for hardship purposes.
The Growth of 401(k) Plans
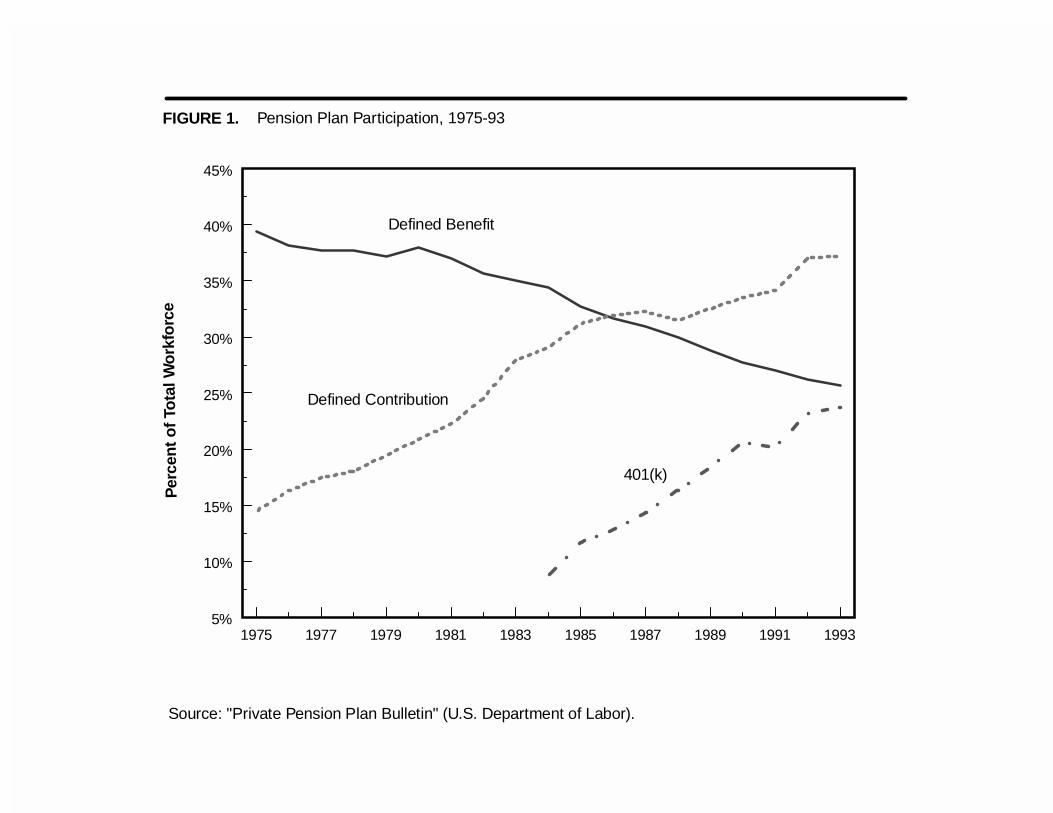
Figure 1 illustrates the percent of workers participating in DB plans, DC plans, and 401(k)
plans between 1975 and 1993. The percent of the workforce with DB plans has declined steadily from
39 percent in 1975 to 26 percent in 1993. Meanwhile, the percent of the workforce with DC plans
has increased rapidly, from just 14 percent in 1975 to 37 percent in 1993. Rapid growth in 401(k)
plan use has been the primary driver of increased DC plan use in recent years with 401(k) participants
now comprising the majority of all DC plan participants.
Not surprisingly, the increased use of 401(k) plans has coincided with tremendous growth in
the amounts contributed to 401(k) plans. Figure 2 illustrates annual contributions to DB plans, DC
plans, and 401(k) plans between 1975 and 1993. The annual amount contributed to DB plans declined
from $65 billion in 1975 to $52 billion in 1993. DC plan contributions increased from $34 billion14
in 1975 to $102 billion in 1993. Again, it is easily seen that the growth in contributions to 401(k)
plans in recent years explains the corresponding rise in DC plan contributions. 401(k) contributions
in 1993 were $69 billion, accounting for 68 percent of all DC contributions and exceeding total DB
6
contributions.
One reason for the rapid growth of DC plans relative to DB plans is that they are less costly
to operate (Clark and McDermed (1990), Kruse (1995)), particularly for small plans (Ippolito
(1995)). DC plans do not require employer contributions. They are fully funded by definition,15
eliminating the need to work with detailed funding compliance requirements or to purchase PBGC
insurance. Employees are often responsible for managing account assets, eliminating the need for the
employer to manage the assets. Finally, DC plans are portable, so employees can take the plan assets
with them when they leave, eliminating the firm’s need to manage assets and paperwork for the
former employee’s lifetime.
Another important reason for the growth of DC plans is the changing preferences and
demographics of the workforce. In particular, workers today are less likely to work in manufacturing,
to be employed by a large firm, and to be represented by a labor union, all associated with high DB
plan coverage. Gustman and Steinmeier (1992) show that at least half of the shift from DB toward
DC plans between 1977 and 1985 can be explained by this shift in employment mix. Ippolito (1995)
finds that changing preferences with the appearance of 401(k) plans also appear to be an important
factor. Consistent with these findings, Kruse (1995) and Papke, Petersen, and Poterba (1996) show
that very little DC growth is attributable to firms terminating DB plans. In contrast, Papke (1996)
finds that 401(k) and other DC plans are replacing terminated DB plans and that the adoption of a
DC plan increases the probability of a DB plan termination.
All else equal, the introduction of a low cost alternative to DB plans should have boosted
pension plan coverage. In spite of the rapid growth of DC plans, overall pension coverage actually
declined in the 1980s (Parsons (1991)). Bloom and Freeman (1992) find the decline between 1979

7
and 1988 concentrated among younger and less-educated male workers. They attribute about 50
percent of the decline in coverage for male workers to shifts in employment mix and demographic
characteristics. Even and Macpherson (1994) argue that the shift toward 401(k) plans where
participation is voluntary is an additional factor in this decline.
The rapid growth of 401(k) plans means that more workers are making critical decisions
regarding their retirement savings. These include whether to participate, how much to contribute,
how to invest the plan assets, and what to do if they receive a lump-sum distribution. Furthermore,
the decline of DB plans means that fewer workers have an alternative employer-funded and
government-guaranteed plan that they can rely on. For this reason, employee 401(k) participation and
contribution decisions are an increasingly important determinant of retirement saving.
Current Population Survey Data
The data source for this study’s analyses is the April 1993 Current Population Survey and its
Survey of Employee Benefits supplement (CPS). The CPS is conducted monthly by the Bureau of
the Census and is the source of official government statistics on employment and unemployment. The
employee benefits supplement is conducted every four or five years as an addition to that month’s
CPS to provide detailed information on retirement, disability, and health insurance benefits. The April
1993 supplement questions were asked of persons employed for pay in one half of the CPS sample,
or over 27,000 individuals.
The Census Bureau matches the supplement responses with labor force data from the April
and May 1993 CPS and with income data from the March 1993 income supplement to the CPS.
Weights are also included to make the sample representative of the U.S. population. Our descriptive
8
analyses are conducted with the weights while our multivariate statistical analyses are not. Except16
where noted, missing observations are dropped from our analyses without adjustment to the weights.
However, each calculation in the paper is carried out on the largest sample possible (for example, a
worker with a missing value for job tenure is not excluded from analyses where job tenure is not a
variable).
Our participation and contribution analyses are limited to the 19,200 survey participants aged
18 to 64 who work at least 20 hours per week, who are not self-employed, and who know whether
they are participating in a 401(k) plan or not. Much of the participation and contribution analysis is
based on a smaller sample of 8,129 individuals who are offered a 401(k) plan by their employer. In
our analysis we define 401(k) participation by a planned contribution for 1993, and nonparticipation
by the lack of a planned contribution for 1993. Our results are very similar when participation is
defined more broadly as any worker reporting participation in a 401(k) plan whether or not
contributions are planned for 1993.17
401(k) Participation and Contribution Rates
Evidence from the CPS indicates that the decline in pension plan coverage observed in the
1980s has stalled. The number of nonagricultural wage and salary workers participating in a
retirement plan increased from 46 percent in 1988 to 47 percent in 1993 (after falling six percentage
points from 1979 to 1988). This increase in coverage is attributable to the increased participation18
in 401(k) plans for those workers offered such plans, from 57 percent in 1988 to 65 percent in 1993.
Nevertheless, over one-third of the workers offered 401(k) plans continues not to participate.
For workers who participate, the mean (median) contribution rate is seven percent (six
9
percent), the same rate found by Andrews (1992) using the 1988 CPS data. Figure 3 illustrates the
variation across participants in 401(k) contribution rates. The clustering of contribution rates at five19
percent and six percent likely reflects the concentration of employer match rate policies that stop
matching when employee contribution rates reach this level. Consistent with this conjecture, a 1994
survey by Buck Consultants found that six percent is the most common maximum percentage of
salary matched, followed by four percent, three percent, and five percent.
The mean (median) dollar amount contributed in 1993 is $2,715 ($1,950) for workers who
participate. Half (51 percent) of the annual contributions are less than $2,000, with 23 percent
between $1 and $1,000, and 28 percent between $1,000 and $2,000. Just under half (47 percent) are
between $2,000 and $9,000. The remaining two percent of contributions are estimated to be greater
than $9,000, exceeding the 1993 tax-deferred maximum of $8,994.20
One of the most important determinants of 401(k) participation is income level. Low-income
workers face lower tax rates and hence benefit less from the tax-deferred nature of 401(k) plans than
high-income workers. Low-income workers are also more likely to be liquidity constrained and
therefore have better uses for their funds than retirement saving. Further, some low-income workers
are more likely to be covered by means-tested welfare programs (either at the time or in the future)
and therefore face high implicit tax rates on their savings (Hubbard, Skinner, and Zeldes (1995)).
Finally, Social Security income replacement rates are higher for low-income workers, reducing their
incentive to save (Smith (1995)).
Table 1 examines 401(k) plan sponsorship, participation, and contributions across family
income levels. While 42 percent of all workers are offered 401(k) plans, this percentage ranges from21
15 percent for workers with family incomes less than $15,000 to 62 percent for workers with incomes
10
of at least $75,000. While 65 percent of workers who are offered plans choose to participate, this rate
ranges from 36 percent for workers with incomes less than $15,000 to 81 percent for workers with
incomes of at least $75,000. This income-participation relationship is similar to that found by other
studies using CPS data, but much larger than that found by studies using data from the Survey of
Income and Program Participation (Engen, Gale, and Scholz (1994), Poterba, Venti, and Wise (1994,
1995b)). 22
The contribution rate varies with income as well, with a mean rate of five percent for
participants with incomes less than $15,000 to eight percent for participants with incomes of at least
$75,000. Low-income workers are thus less likely to be offered a 401(k) plan, less likely to
participate given sponsorship, and contribute smaller fractions of their salary given participation.
Given these facts, it is not surprising to find that high-income groups receive a
disproportionate share of the tax benefits from 401(k) plans. Table 2 shows that workers with family
incomes less than $15,000 make up 15 percent of the working population, but account for just six
percent of workers offered 401(k) plans, three percent of 401(k) contributors and one percent of
contributions. Workers with family incomes of at least $75,000 make up 11 percent of the population,
but account for 16 percent of workers offered 401(k) plans, 20 percent of 401(k) contributors and
35 percent of contributions. Since marginal tax rates increase with income, the distribution of tax
benefits from 401(k) plans is even more skewed toward high-income workers than the distribution
of benefits show in Table 2.
The low participation rate of workers in 401(k) plans, particularly low-income workers,
should be kept in perspective. It seems probable that more workers are offered plans, and that more
may be participating, than if the low-cost 401(k) plan had never been introduced. Furthermore, DC23

11
plans can be much more valuable to workers who change jobs several times because DC plan payouts
depend on market returns rather than length of service, age, or salary at separation from the firm as
in a DB plan.
Before proceeding, we note that we make no attempt in this study to measure whether 401(k)
plans change total household saving or change aggregate national saving. While tax incentives are
likely to raise saving in the tax-advantaged program, the impact on overall household saving depends
on whether tax incentives lead households to simply shift saving into tax-advantaged plans or whether
the plans actually encourage additional saving. Since our primary data source does not provide good24
measures of household saving or wealth, we cannot determine whether 401(k) plans change total
household saving.
Effects of Employer Match Rate on Participation
One potential way to increase 401(k) plan participation is for the sponsoring employer to
adopt a match rate. An employer providing a match agrees to contribute a certain amount to a
worker's 401(k) plan for every dollar that an employee contributes, up to a certain percent of the
worker’s salary. As with employee contributions and investment earnings, the employer match is tax-
deferred until the plan assets are distributed or withdrawn. This results in a large initial return on the
employee's investment that supplements the tax advantages of 401(k) plans, creating a greater
incentive to participate and/or increase contributions. For 401(k) plans with an employer match,25
401(k) plans are always preferable to regular saving as long as the match rate somewhat exceeds the
penalty rate. 26
Earlier research on the effects of employer matching on 401(k) participation has provided
12
mixed results. Using data from the May 1988 CPS, Andrews (1992) finds that employer match rates
have a positive effect on participation. Papke (1995) uses plan level data from the Internal Revenue
Service (IRS) and finds that participation increases with the match rate. Using survey data from 43
firms, Papke and Poterba (1995) find that participation is higher when employers provide a matching
contribution, but find only weak evidence that participation increases with the level of the match rate.
Finally, Kusko, Poterba, and Wilcox (1994) find that widely varying match rates at one medium-sized
manufacturing firm had little effect on the participation rate of individuals in that firm over a four year
period.
The main data source in this paper, the April 1993 CPS, contains more detailed information
on employer matching than earlier employee surveys. The 1993 survey contains the first CPS question
concerning the level of the employer match rate. We find that almost three-fourths (74 percent) of27
employees offered a 401(k) plan are also offered a match rate. The mean (median) match rate for
workers offered a match is 62 percent (50 percent). This is somewhat greater than the 52 percent
average match rate Papke (1995) finds with the IRS data for 1987 but similar to the 59 percent match
rate found in a recent survey by Buck Consultants (1994).
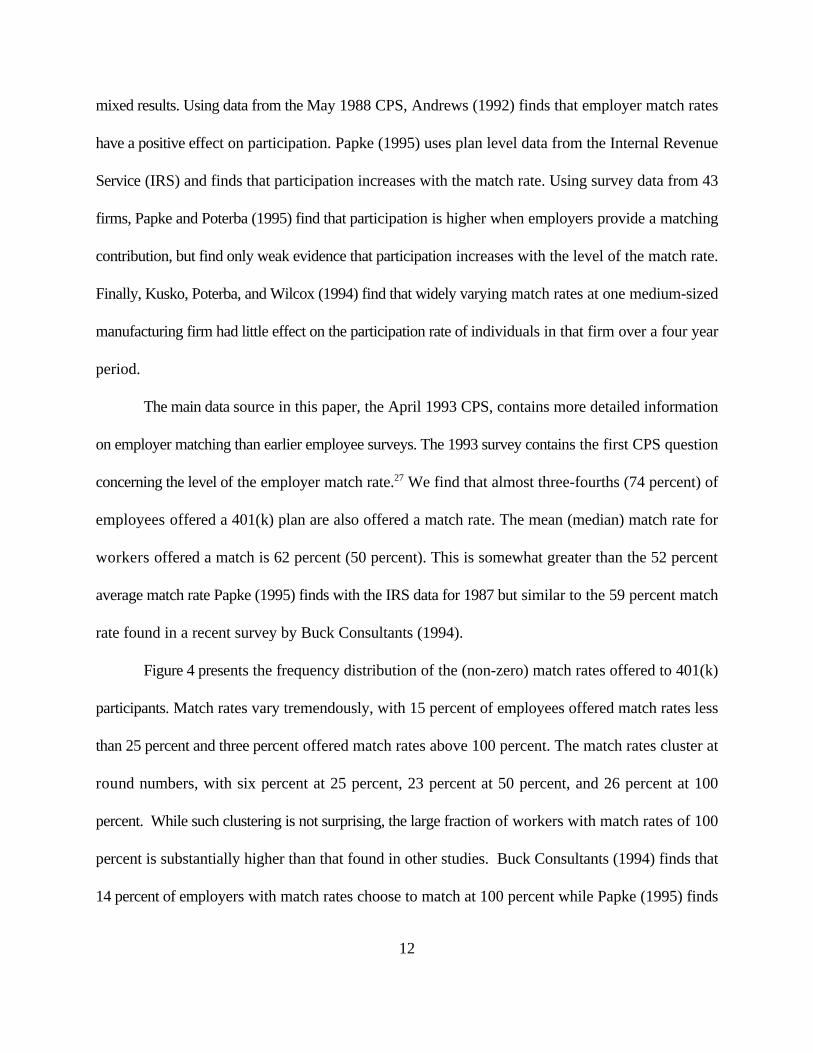
Figure 4 presents the frequency distribution of the (non-zero) match rates offered to 401(k)
participants. Match rates vary tremendously, with 15 percent of employees offered match rates less
than 25 percent and three percent offered match rates above 100 percent. The match rates cluster at
round numbers, with six percent at 25 percent, 23 percent at 50 percent, and 26 percent at 100
percent. While such clustering is not surprising, the large fraction of workers with match rates of 100
percent is substantially higher than that found in other studies. Buck Consultants (1994) finds that
14 percent of employers with match rates choose to match at 100 percent while Papke (1995) finds
13
that only six percent of plan participants (and eight percent of plans) have average match rates
between 76 and 100 percent.
Table 3 compares participation and contribution rates by whether the employer offers a match
rate. For all workers, participation rates are higher when there is an employer match, 67 percent28
versus 60 percent. The conditional contribution rate given participation is lower for employees with
a match, seven percent versus eight percent. There is no difference in the unconditional contribution
rate for employees with or without a match. The effect of match rate is similar across income groups.
The descriptive results suggest that an employer match can boost participation rates, but it cannot
boost the mean level of employee contributions. A more formal test of the match rate’s effects on
participation is presented in the next section.
Modeling the Participation Decision
The decision to participate in a 401(k) plan depends on both the attractiveness of the plan and
the saving propensity of the household. Existence of an employer match makes 401(k) plan
participation attractive to all households that would otherwise save, and to some households that
would not otherwise save. However, the actual match rate may not be critical to the participation
decision as long as it is somewhat larger than the ten percent penalty rate. Whether the 401(k) is the
employer’s sole plan or operates in conjunction with another plan should also influence the
participation decision. An employee with no other plan is expected to be more likely to choose to
participate in a 401(k) plan.
Characteristics of the household related to the propensity to save should also be correlated
with the participation decision. The importance of family income was discussed and documented in
14
the previous section. Age is another important characteristic, as a worker’s stage in the life-cycle can
be expected to influence the propensity to save. Job tenure may be important as it relates to the
vesting of employer match rates and to employee knowledge of the 401(k) plan. Education level may
be correlated with propensity to save, as well as with worker knowledge of the plan. Home
ownership is likely to be positively correlated with the propensity to save but is also a measure of
household wealth, leading to an ambiguous prediction about its relation with participation.
Controlling for family income, marital status and children are both measures of demands on income
that might reduce saving propensity.
We model employee participation using probit. Probit is a statistical technique that measures
the impact of explanatory variables on the probability of an individual choosing from a pair of discrete
outcomes (such as whether to participate in a 401(k) plan or not). We also present linear probability
estimates as measures of the sensitivity of the participation probability to changes in the explanatory
variables around their means.29
The variables we use to explain the participation decision include the plan and household
characteristics discussed above. Family income enters the models after being log-transformed. Age
and job tenure are measured in years. High school diploma, college degree, home owner, whether30
the 401(k) is the only pension plan, marital status, and whether the worker has children all enter the
models as dummy variables. As many workers do not know the particular level of the match rate, or
the match rate may vary, we present one model where the match rate enters as a single dummy
variable. We also present a second model on a smaller sample of workers where the match rate is
segmented into several dummy variables so we can assess the impact of varying match rates on
participation. Descriptive statistics for the variables are shown in Table 4.
15
The estimated probit and linear probability (OLS) coefficients and standard errors for the two
models are presented in Table 5. As can be seen with our match rate dummy model results, having
an employer match is positively related to participation. Participation is also substantially higher when
the 401(k) plan is the only retirement plan offered by the employer. Income, age, job tenure,
education, and home ownership are also positively correlated with plan participation, while being
married is negatively correlated. Workers with children are not significantly less likely to participate.
Our segmented match rate model results also show that participation is higher for employees
who have an employer match. There is little evidence, however, that participation increases as the
level of the match increases. This may reflect employer decisions to offer high matching rates as an31
incentive when most employees have low propensities to save. Incorporating match rate endogeneity
into their modeling, Even and Macpherson (1996) find a substantially larger impact of match rates
on participation. It is also possible that participation is simply not affected much by a changing match
rate once the match rate exceeds a minimal threshold.
The OLS results provide estimates of the change in participation probability (expressed in
percentage points) associated with a change in each explanatory variable. Evaluated at average
characteristics of the sample, switching from a 401(k) plan without an employer match to one with
a match raises the participation rate by nine percent. An additional $1,000 of family income
(corresponding to about two percent of mean family income in the sample) is associated with a rise
in participation of 0.3 percent (based on the match rate dummy model). An additional year of age32
raises participation 0.2 percent, while an additional year of experience raises participation by one
percent. Workers with high school diplomas have ten percent higher participation rates than those
without, while a college degree boosts participation an additional four percent. Homeowners are nine
16
percent more likely to participate than nonowners. Participation is much more likely (14 percent)
when the 401(k) is the only employer-sponsored retirement plan. Finally, married employees are
seven percent less likely to participate than single employees (note that this comparison is effectively
between workers with the same family income).
Our models suggest that both plan and household characteristics are important influences on
the decision to participate in a 401(k) plan. Like Andrews (1992), Papke (1995), and Papke and
Poterba (1995) we find that having an employer match rate raises participation levels. While we do
not find a significant positive relationship between the level of the match rate and participation, other
studies have found no relationship (Kusko, Poterba, and Wilcox (1994)) or only a weakly positive
relationship (Papke and Poterba (1995)). Our findings on income, age, job tenure, home ownership,
and the presence of another retirement plan are consistent with earlier findings using the May 1988
CPS data (Andrews (1992)).
Pre-Retirement Lump-Sum Pension Plan Distributions
A significant feature of 401(k) plans is that employees can often access the plan funds before
retirement: through a loan, to serve a hardship purpose, or for any reason when leaving a job. This
provides flexibility to the participant to meet expected or unexpected needs, and allows even short-
tenure employees to accumulate funds and consolidate them with a new employer's pension plan. A
risk is that employees may use their 401(k) assets for current consumption at the expense of adequate
future consumption.
Loans from DC plans must be paid back with interest, and are therefore not permanent
withdrawals. Hardship withdrawals, by definition, are intended to be used for immediate needs and

17
so are not paid back. Distributions received upon leaving an employer are under the employee's
complete discretion. Should the employee choose to roll over the distribution into a new employer
plan, an Individual Retirement Account (IRA), or another qualified retirement arrangement, taxes and
future gains on the plan assets remain tax-deferred. When distributions are not rolled over they are
subject to taxation in the year received. In addition, workers who have not reached the age of 59½
must pay an additional penalty tax of ten percent of the plan assets.33
Of all workers covered by a pension plan on a previous job, 47 percent report having received
at least one lump-sum pension plan distribution. Nearly all of these are pre-retirement distributions;
95 percent of the recipients are between the ages of 18 and 54 at the time of the most recent
distribution. Most of the analysis in this section is limited to the half (50 percent) of pre-retirement
recipients who report receiving the distribution between 1988 and 1992.
The mean (median) pre-retirement lump-sum pension plan distribution received between 1988
and 1992 was $10,367 ($3,263). Multiplying the mean amount by the number of workers34
represented by the recipients, we estimate that more than $59 billion was received in pre-retirement
lump-sum distributions between 1988 and 1992, with $19 billion received in 1992 alone. This35
represents 14 percent of the $431 billion contributed to DC plans over this period.36
Survey respondents who received lump-sum distributions are asked to classify how the
proceeds of the distribution were allocated. Table 6 presents the distribution of reported allocations
summarized into six categories. Just 28 percent of recipients roll over their distribution into a tax-37
qualified retirement plan. The dollar-weighted 56 percent rollover rate indicates that rollovers are
more likely with larger distributions. Financial investment accounts for an additional 11 percent of
recipient uses, buying a house for seven percent, and other investment for eight percent. Over one-
18
sixth (17 percent) of recipients (eight percent dollar-weighted) use the distribution to pay down debt,
and 29 percent (13 percent dollar-weighted) use the distribution on consumption.
The decision to spend funds or invest them outside of the tax-deferred option need not be a
poor one, in spite of the ten percent penalty and immediate taxation. Recipients may have investment
opportunities (such as education or starting a business) that reap higher financial returns than the
rollover option. Even consumption of the distribution proceeds or paying down debt is optimal for
recipients in particular circumstances. The fact remains, of course, that funds that are used for other
purposes will not be available for retirement unless they are later replaced.
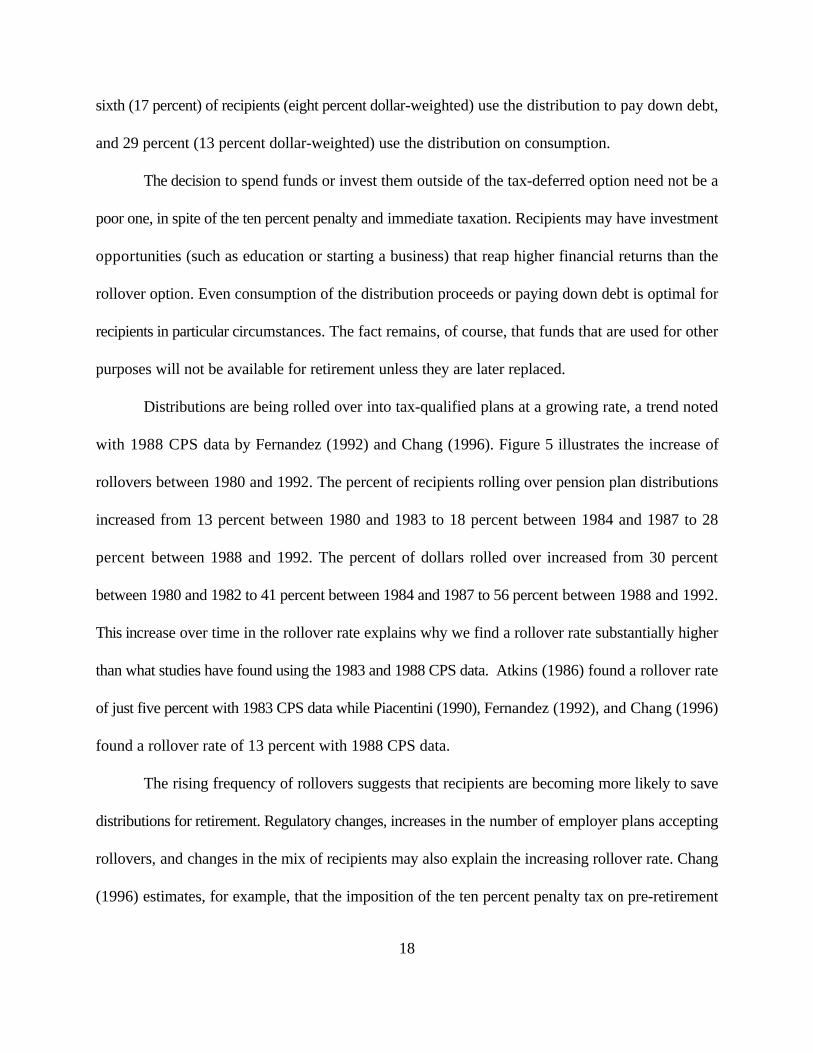
Distributions are being rolled over into tax-qualified plans at a growing rate, a trend noted
with 1988 CPS data by Fernandez (1992) and Chang (1996). Figure 5 illustrates the increase of
rollovers between 1980 and 1992. The percent of recipients rolling over pension plan distributions
increased from 13 percent between 1980 and 1983 to 18 percent between 1984 and 1987 to 28
percent between 1988 and 1992. The percent of dollars rolled over increased from 30 percent
between 1980 and 1982 to 41 percent between 1984 and 1987 to 56 percent between 1988 and 1992.
This increase over time in the rollover rate explains why we find a rollover rate substantially higher
than what studies have found using the 1983 and 1988 CPS data. Atkins (1986) found a rollover rate
of just five percent with 1983 CPS data while Piacentini (1990), Fernandez (1992), and Chang (1996)
found a rollover rate of 13 percent with 1988 CPS data.
The rising frequency of rollovers suggests that recipients are becoming more likely to save
distributions for retirement. Regulatory changes, increases in the number of employer plans accepting
rollovers, and changes in the mix of recipients may also explain the increasing rollover rate. Chang
(1996) estimates, for example, that the imposition of the ten percent penalty tax on pre-retirement
19
distributions (with the Tax Reform Act of 1986) increased rollover rates by 12 percent for higher-
income workers and nine percent for lower-income workers.
The Rollover Decision
As with participation, high income workers are more likely to roll over distributions. Table
7 shows that workers with family incomes less than $15,000 roll over 16 percent of their distributions
(31 percent dollar-weighted) into tax-qualified retirement plans. In contrast, workers with family
incomes of at least $75,000 roll over 47 percent of their distributions (65 percent dollar-weighted).
Not surprisingly, higher income workers generally receive larger distributions, with mean distribution
size of $5,531 for workers with family incomes less than $15,000 versus $19,511 for workers with
family incomes of at least $75,000.
We use a probit model to examine in detail what factors predict the rollover decision. We also
present linear probability estimates to measure the impact on the rollover rate of changes in the
explanatory variables. Explanatory variables include the distribution amount, family income, and38
age, as well as dummy variables for high school diploma, college degree, home owner, marital status,
and whether the worker has children. Descriptive statistics for these variables are shown in Table 8.
The results of our analysis on pre-retirement lump-sum distributions received between 1988 and 1992
are presented in Table 9. We present results for the full sample of distributions as well as for
distributions greater than $3,500 and distributions less than or equal to $3,500.39
For the full sample, distribution amount, family income, college degree, and owning a home
are all significantly positively correlated with the decision to roll over a lump-sum distribution.
Workers with children are significantly less likely to roll over a distribution. These results are

20
qualitatively similar to those of Chang (1996), Gelbach (1995), and Poterba, Venti, and Wise (1995a)
although age is not a significant variable in our probit model. When we split the sample by size of40
distribution, the results are similar to the full sample model. However, only distribution amount,41
family income, and college degree are significant for the model estimated on distributions less than
or equal to $3,500.
The linear probability model (OLS) coefficients allow us to estimate the change in rollover
probability (expressed in percentage points) associated with changes in each explanatory variable.
Evaluated at average characteristics of the sample, an increase in the distribution of $1,000 increases
the rollover probability by three percent in the full sample model. An additional $1,000 of family
income is associated with a rise in the rollover probability of 0.1 percent. Workers with a college42
degree are 11 percent more likely to roll over a distribution and homeowners are seven percent more
likely. Workers with children are six percent less likely to roll over a distribution.
The findings on lump-sum distributions corroborate the findings on 401(k) participation in
several ways. While many workers are reluctant to contribute to a retirement account, many workers
who do contribute remove their money when given the chance through a lump-sum distribution.
Participation and rollover rates are particularly low among low-income workers, who are less likely
to have other assets to support their retirement. Other factors besides income, such as education,
owning a home, and number of children are significant predictors of both the participation and
rollover decisions. As with participation, rollover rates have shown a sharp increase in recent years.
21
Conclusion
While retirement planning choices are increasingly becoming the responsibility of individual
workers, many either are not participating or are participating in a minor way. Over one third (35
percent) of workers sponsored for a 401(k) plan declines to participate. Among workers with family
incomes less than $15,000, only 36 percent choose to participate. Factors besides income that are
positively correlated with participation are age, job tenure, education, home ownership, and whether
the 401(k) is the only employer-sponsored retirement plan. Workers with employee matches are also
more likely to participate, although no evidence is found that the level of the employer match is
positively correlated with participation.
Nearly half of workers who had a pension plan on a previous job report taking a lump-sum
distribution from the plan before retirement age. Only 28 percent of the distribution recipients report
rolling over the funds into a tax-qualified retirement account in recent years, representing 56 percent
of distribution assets. Among low-income workers, just 16 percent roll over pre-retirement lump-sum
distributions into tax-qualified plans, representing 31 percent of their distribution assets. Besides
family income, distribution size, education, and home ownership are all positively correlated with the
rollover decision.
As our main data source does not measure household assets or saving, we cannot draw
definitive conclusions about the overall adequacy of workers’ retirement income. Nevertheless, our
findings raise concern that many workers may not be adequately saving for their retirement years.
These workers may therefore have to rely on Social Security or other government programs to
support their consumption when they get older. At the same time, these programs are expected to
be less generous in the future as the baby boom ages and longevity increases.
22
Several unresolved questions regarding 401(k) plans remain: Employer decisions to offer
401(k) plans and offer match rates are only beginning to be studied. Employee contributions to
401(k) plans in the context of match rates, caps on matches, and overall contribution rates have not
been carefully examined due to a lack of sufficiently detailed datasets. Additional plan factors that
impact participation, such as loan provisions, investment choices, and hardship withdrawal provisions,
have not yet been examined controlling for other plan and participant attributes. Finally, the broader
impact of 401(k) plans on household saving remains an unresolved issue in spite of numerous prior
studies in this area.
23
References
Andrews, Emily S. "The Growth and Distribution of 401(k) Plans." In Trends in Pensions1992, edited by J. Turner and D. Beller. Washington, D.C.: U.S. Department of Labor, 1992.
Atkins, G. Lawrence. “Spend it or Save It? Pension Lump-Sum Distributions and Tax Reform.” Washington, D.C.: Employee Benefit Research Institute, 1986.
Bloom, David E., and Richard B. Freeman. "The Fall in Private Pension Coverage in theUnited States." American Economic Review 82 (May, 1992): 539-45.
Buck Consultants. 401(k) Plans: Employer Practices & Policies. New York, 1994.
Chang, Angela E. “Tax Policy, Lump-Sum Pension Distributions, and Household Saving.”National Tax Journal 49 No. 2 (June, 1996): 235-52.
Clark, Robert L., and Ann A. McDermed. The Choice of Pension Plans in a ChangingRegulatory Environment. Washington, D.C.: AEI Press, 1990.
Employee Benefit Research Institute. “Employment-Based Retirement Income Benefits:Analysis of the 1993 Current Population Survey.” Washington, D.C., 1994.
Employee Benefit Research Institute. “Fundamentals of Employee Benefit Programs.”Washington, D.C., 1997.
Engen, Eric M., and William G. Gale. “Debt, Taxes and the Effects of 401(k) Plans onHousehold Wealth Accumulation.” Mimeo, 1997.
Engen, Eric M., William G. Gale, and John Karl Scholz. 1994, "Do Savings IncentivesWork?" Brookings Papers on Economic Activity 1 (1994): 85-180.
Engen, Eric M., William G. Gale, and John Karl Scholz. “The Illusory Effects of SavingIncentives on Saving.” Journal of Economic Perspectives 10 (Fall, 1996): 113-38.
Estrella, Arturo. “A New Measure of Fit for Equations with Dichotomous DependentVariables.” Journal of Business and Economic Statistics. Forthcoming.
Even, William E., and David A. Macpherson. "Why Did Male Pension Coverage Decline inthe 1980s?" Industrial and Labor Relations Review 47 (April, 1994): 439-53.
Even, William E., and David A. Macpherson. “Factors Influencing Employee Participation in401(k) Plans.” Mimeo, 1996.
24
Fernandez, Phyllis A. “Preretirement Lump-Sum Distributions.” In Trends in Pensions 1992,edited by J. Turner and D. Beller. Washington, D.C.: Department of Labor, 1992.
Franz, Steven J., Joan C. McDonagh, John Michael Maier, and William C. Kalke. 401(k)Answer Book. New York: Panel Publishers, 1995.
Gale, William G., and John Karl Scholz. "IRAs and Household Saving." American EconomicReview 84 (December: 1994): 1233-60.
Gelbach, Jonah B. “The Disposition of Lump-Sum Payments from Pension Plans: A LogitAnalysis.” Mimeo, 1995.
Gruber, Jonathan, and James Poterba. “Tax Incentives and the Decision to Purchase HealthInsurance: Evidence from the Self-Employed.” The Quarterly Journal of Economics 109(August, 1994): 701-34.
Gustman, Alan L., and Thomas L. Steinmeier. "The Stampede Toward Defined ContributionPension Plans: Fact or Fiction?" Industrial Relations 31 (Spring, 1992): 361-69.
Hubbard, R. Glenn. “Do IRAs and KEOUGHs Increase Savings?” National Tax Journal 37No. 1 (March, 1984): 43-54.
Hubbard, R. Glenn, Jonathan Skinner, and Stephen P. Zeldes. "Precautionary Saving andSocial Insurance." Journal of Political Economy 103 No. 2 (April, 1995): 360-99.
Ippolito, Richard A. “Toward Explaining the Growth of Defined Contribution Plans.”Industrial Relations 34 (January, 1995): 1-20.
Ippolito, Richard A. “Pensions, Sorting and Internal Discount Rates.” Paper presented at theAmerican Economic Association Annual Meetings, San Francisco, January 1996.
Johnston, David C. “A Hybrid Pension Plan Gains Ground.” The New York Times (February 25,1996): Business, 11.
Krass, Stephen J. The Pension Answer Book. New York: Panel Publishers, 1995.
Kruse, Douglas L. "Pension Substitution in the 1980s: Why the Shift Toward DefinedContribution Pension Plans?" Industrial Relations 34 No. 2 (April, 1995): 218-41.
Kusko, Andrea L., James M. Poterba, and David W. Wilcox. "Employee Decisions withRespect to 401(k) Plans: Evidence From Individual-Level Data." NBER Working Paper No.4635. Cambridge, MA: National Bureau of Economic Research, 1994.

25
Olsen, Kelly, and Jack VanDerhei. “Defined Contribution Plan Dominance Grows AcrossSectors and Employer Sizes, While Mega Defined Benefit Plans Remain Strong: Where We Areand Where We Are Going.” Employment Benefit Research Institute Special Report SR-33 andIssue Brief No. 190 (October, 1997).
Papke, Leslie E. "Participation in and Contributions to 401(k) Pension Plans: Evidence fromPlan Data." Journal of Human Resources 30 No. 2 (Spring, 1995): 311-25.
Papke, Leslie E. “Are 401(k) Plans Replacing Other Employer-Provided Pensions? Evidencefrom Panel Data.” NBER Working Paper No. 5736. Cambridge, MA: National Bureau ofEconomic Research, 1996.
Papke, Leslie E., Mitchell Petersen, and James M. Poterba. "Did 401(k) Plans Replace OtherEmployer-Provided Pensions?” In Advances in the Economics of Aging, edited by D. Wise.Chicago: University of Chicago, 1996.
Papke, Leslie E., and James M. Poterba. “Survey Evidence on Employer Match Rates andEmployee Saving Behavior in 401(k) plans,” Economics Letters 49 No. 3 (September, 1995):313-7.
Paré, Terence P. “Everything You Ever Wanted to Know About 401(k)s.” Fortune, (December25, 1995): 176-80.
Parsons, Donald O. “The Decline in Private Pension Coverage in the United States,” EconomicsLetters 36 No. 4 (August, 1991): 419-23.
Piacentini, Joseph S. “An Analysis of Pension Participation at Current and Prior Jobs, Receiptand Use of Preretirement Lump-Sum Distributions, and Tenure at Current Job.” Washington,D.C.: Employee Benefit Research Institute, 1990.
Poterba, James, Steven Venti, and David Wise. “401(k) Plans and Tax-Deferred Savings” In Studies in the Economics of Aging, edited by D. Wise. Chicago: University of Chicago, 1994.
Poterba, James, Steven Venti, and David Wise. “Lump-Sum Distributions from RetirementSavings Plans: Receipt and Utilization.” NBER Working Paper No. 5298. Cambridge, MA:National Bureau of Economic Research, 1995.
Poterba, James, Steven Venti, and David Wise. “Do 401(k) Contributions Crowd Out OtherPersonal Saving?” Journal of Public Economics 58 (September, 1995): 1-32.
Poterba, James, Steven Venti, and David Wise. “How Retirement Saving Programs IncreaseSaving,” Journal of Economic Perspectives 10 (Fall, 1996): 91-112.
26
Samwick, Andrew A., and Jonathan Skinner. “How Will Defined Contribution Pension PlansAffect Retirement Income?” Mimeo, 1995.
Smith, James P. “Unequal Wealth and Incentives to Save,” RAND Documented Briefing. SantaMonica, CA, 1995.
U.S. Department of Labor. Private Pension Plan Bulletin No. 6. (Winter, 1997).
U.S. General Accounting Office. 401(k) Plans: Incidence, Provisions, and Benefits.Washington D.C.: U.S. Government Printing Office, 1988.
Venti, Steven, and David Wise. “IRAs and Saving,” In The Effects of Taxation on CapitalAccumulation, edited by Martin Feldstein. Chicago: University of Chicago Press, 1987.
Venti, Steven, and David Wise. “Have IRAs Increased U.S. Savings? Evidence from ConsumerExpenditure Surveys,” Quarterly Journal of Economics 105 (August, 1990): 661-98.
Venti, Steven, and David Wise. “The Saving Effect of Tax-deferred Retirement Accounts:Evidence from SIPP,” In National Saving and Economic Performance, edited by B.D. Bernheimand J.B. Shoven. Chicago: University of Chicago, 1990.
27
The terms 401(k) and salary reduction are used interchangeably throughout this paper. While1
all 401(k) plans are not salary reduction agreements, neither are all salary reduction agreements401(k) plans. Non-profit employees can be offered 403(b) plans; local and state governmentemployees can be offered 457 plans, and federal government employees can participate in theFederal Thrift Savings Fund. As all of these plans are analogous to the 401(k) plan with similarfeatures and limits, and most 401(k) plans are salary reduction agreements, these two terms areused interchangeably throughout the paper.
Using data from the April 1993 Current Population Survey, Survey of Employee Benefits, we2
find that 52 percent of workers offered a 401(k) plan report that their employer offers no otherretirement plan.
Andrews (1992) reports qualitatively similar results for participation using data from the May3
1988 CPS. This earlier survey did not contain information on the level of the employer match,however.
We thank James Fleming for his help explaining the various types of pension plans and their4
attributes. More detailed descriptions of pension plan characteristics are provided by Franz etal. (1995), Krass (1995), and Employee Benefit Research Institute (1997).
Cash balance plans, offering features of both DC and DB plans, may become more common5
after a recent IRS ruling that clarified the tax-deductibility of employer contributions to theseplans (see Johnston (1996)).
Employee Benefit Research Institute (1997), page 183, reports that most DB plans do not6
provide an automatic inflation adjustment after retirement.
Upon separation the employer may force the employee to take a distribution if the present value7
of the obligation does not exceed $3,500 (increased to $5,000 effective January 1, 1998). Inrare situations an employee has the option of taking a pre-retirement lump-sum distributionfrom a DB plan.
The employer may force the employee to take a distribution upon separation if the value does8
not exceed $3,500 (increased to $5,000 effective January 1, 1998). Nearly always an employeehas the option of taking a pre-retirement lump-sum distribution from a DC plan regardless ofplan value. These distributions are taxable in the year received unless they are reinvested in aqualified retirement plan. An additional ten percent penalty is imposed on the funds that are notreinvested if the recipient has not reached the age of 59½ (age 55 for recipients who receive the
We thank Angela Chang, William Gale, Richard Ippolito, David Laster, Steven Venti, AndrewYuengert, Federal Reserve Bank of New York seminar participants, and two anonymous refereesfor helpful comments. Research assistance of Ray Kottler and Natalia Millan is gratefullyacknowledged. The views expressed are those of the authors and do not necessarily reflect theviews of the Federal Reserve Bank of New York or the Federal Reserve System.
28
distribution after leaving their employer).
Dorsey (1987) derives this capital loss. Bodie, Marcus, and Merton (1988) discuss this issue as9
well as other differences between DB and DC plans. Samwick and Skinner (1995) analyze howthe emergence of DC plans affects retirement income and find that DC plans yield a higheraverage return for the majority of workers and reduce income inequality among the elderly.
Tax-deferred 401(k) employee contributions are limited to $10,000 per year per participant in10
1998 ($8,994 in 1993). Total contributions (employee pre-tax + employee post-tax + employer)to a participant's DC plan (or DC plans) are limited to the lower of $30,000 per year, or 25percent of the participant's compensation. Total deductible contributions (employee andemployer) for an employer's DC plan participants are limited to 15 percent of compensationpaid to all participants. Finally, employer-specific "non-discrimination" tests must be met toensure that DC benefits are distributed relatively evenly across income levels at each sponsoringemployer. Additional overall limits apply to firms that sponsor both DB and DC plans.
Internal Revenue Service regulations adopted in 1981 allow the use of salary reduction11
arrangements as a source of 401(k) plan contributions. Even though most 401(k) plans areprofit sharing plans, profit sharing (or even employer profits) is not required for employee oremployer contributions to be made.
Paré (1995) reports that many localities but only one state (Pennsylvania) tax 401(k)12
contributions. Social security taxes on 401(k) contributions are not deferred.
The General Accounting Office (1988) finds that 95 percent of 401(k) plan assets are in plans13
where participants directed the investment. The mean number of investment options providedby employers is 5.4 according to Buck Consultants (1994).
All dollar figures presented in this paper are in 1993 Consumer Price Index adjusted dollars14
(with the exception of figures that are established by regulatory decree such as pension plancontribution limits). The decline in annual DB contributions is at least partially attributable tothe outstanding performance of the stock market in recent years as well as to the decliningproportion of the workforce covered by DB plans.
Olsen and VanDerhei (1997) show that there has been a much sharper reduction in the number15
of small than large DB plans in recent years.
Results are similar when the weights are used in the multivariate statistical analyses.16
Only 46 individuals offered a 401(k) plan (one percent of sample) report participating in a17
401(k) with planned contributions of zero. Note that the survey does not ask about pastparticipation or the existence of an account with 401(k) funds, however. There are probablyadditional workers who have contributed to a 401(k) plan in the past but report themselves asnonparticipants since they have no planned contributions for 1993.
29
See Employee Benefit Research Institute (1994), which provides a significant amount of18
descriptive information on the 1993 CPS and which compares the 1993 survey results toprevious surveys’ results.
Contribution rates reported in excess of 25 percent are coded as missing values. DC plan limits19
do not allow annual account additions in excess of 25 percent of pay.
Technically these 1993 contributions in excess of $8,994 are not 401(k) plan contributions as20
they are not tax-deferred. 401(k) plans often operate in conjunction with similarly structuredthrift or savings plans, however, that allow contributions beyond the 401(k) limit that are nottax-deferred. Over half (57 percent) of the contributions estimated to be between $9,000 and$25,000 are less than $10,000.
Family income is defined as the worker’s usual weekly earnings times 52 plus the usual weekly21
earnings of the worker’s spouse (if applicable) times 52 plus the unearned income of the workerand the worker’s spouse as reported for 1992. Individual income figures in excess of $100,000are not reported by the Census Bureau. One hundred twenty workers (one percent of sample)therefore have their weekly earnings censored at $1,923 ($100,000/52 weeks).
We remain uncertain about the causes of the income-participation differences between the CPS22
and the Survey of Income and Program Participation (SIPP): Differences in the age screencriteria (the SIPP studies exclude 18-24 year olds) appear to be only a small factor. Further,neither the definitions of participation (current contributions in CPS versus positive 401(k)balance in SIPP) nor the unit of analysis (individual vs. family) seems to be an important factor.
While no studies look at this precise issue, the results in Gustman and Steinmeier (1992),23
Parsons (1991), and Bloom and Freeman (1992) suggest that pension coverage would havefallen even faster in the 1980s if 401(k) plans had not been introduced.
The evidence on this question is mixed. Venti and Wise (1987, 1990a, 1990b), Poterba, Venti,24
and Wise (1995b), and Hubbard (1984) find evidence consistent with tax-advantaged planssignificantly raising saving while Engen, Gale and Scholz (1994), Gale and Scholz (1994), andEngen and Gale (1995) find little to no effects. Poterba, Venti, and Wise (1996) and Engen,Gale, and Scholz (1996) detail the arguments on both sides of this debate.
Ippolito (1996) argues that the match rate can also serve to align employee pay and25
productivity. Workers with low discount rates are likely to both take advantage of the matchrate and to make decisions in the long-term interest of the firm.
Specifically, saving through a 401(k) plan is preferred if m>p/(1-t-p) where m is the match rate,26
p is the penalty rate, and t is the employee’s marginal tax rate. This calculation assumes that theemployer match is immediately vested (employee contributions are always immediately vested,employer contributions may or may not be immediately vested), that the worker has immediateaccess to the funds (General Accounting Office (1988) finds that 93 percent of plans allowhardship withdrawals of employee contributions and that 83 percent of plans permit loans), and

30
that the marginal tax rate on income remains the same throughout the planning period. Savingthrough a 401(k) plan is still preferred if m<p/(1-t-p) if the expected holding period is longenough so that the tax-deferral benefits of the 401(k) exceed the penalty costs.
Specifically, respondents who indicate they are covered by a salary reduction plan are asked “If27
you were to contribute $100 to this plan, how much would your employer contribute?” TheMay 1988 CPS had a question concerning whether the employer matched contributions, but itdid not ask the level of the employer match. Neither survey asks more detailed questions aboutthe match rate policy, such as when the match rate stops, or what sort of non-discriminationlimits apply. The surveys also do not ask about other 401(k) plan attributes such as investmentoptions, loan provisions, or hardship withdrawal provisions. In our analysis the match rate isencoded as missing for four workers who report unreasonably high match rates of over 500percent.
Many (29 percent) workers do not know if their employer offers a match rate, particularly those28
who do not participate in 401(k) plans. The figures in the table are adjusted proportionately sothat the weighted rates of match and no match participants equal the corresponding rate inTable 1. Without this adjustment, the participation rate for workers with no match rate is 71percent and the participation rate for workers with a match rate is 78 percent even though theoverall participation rate is only 65 percent. Our subsequent multivariate statistical analysisdoes not make any adjustments for these missing workers (Even and Macpherson (1996),however, do incorporate such workers in their analysis).
Marginal probability estimates derived from the probit coefficients were also calculated and29
found to very similar to the linear probability estimates, with occasionally smaller standarderrors. These results are available from the authors.
Job tenure is coded as one-half year for workers that report tenure of less than one year.30
Participation is actually significantly lower (p-value < .01) for employees with match rates of31
100 percent than for employees with a lower or higher match rate. Response error is onepossible explanation for this finding - some workers with no match rate may respond that theyhave a match rate of 100 percent. The survey question is vague enough that workers with nomatch rate may state that the employer contributes the same amount that they have deductedfrom their salary. Our earlier finding that a disproportionate fraction of workers in the CPS saythey have a 100 percent match rate supports this conjecture.
The impact on participation of a change in family income cannot be read directly off Table 532
since income is measured in logs. Rather, to measure the change in participation probabilityassociated with a $1,000 change in family income, the coefficient is divided by mean familyincome for the sample and then multiplied by 1,000.
Age 55 for participants who receive the distribution after leaving their employer.33
31
Employee Benefit Research Institute (1994) provides detailed descriptive information on lump-34
sum distributions as reported in the 1993 CPS.
These figures are underestimates for three reasons. First, fourteen respondents (out of 1,12035
that report distribution size) have their reported distribution figures capped at $100,000, biasingdownwards the reported mean. Second, respondents are only questioned about their mostrecent lump-sum pension plan distribution. Third, respondents may not report a lump-sumdistribution if plan assets are directly transferred from an old employer’s plan to a newemployer’s plan. This seems particularly likely when the plan trustee does not change.
The two numbers are not strictly comparable as some distributions are not included in the36
sample (see prior footnote), while other distributions received are from DB plans. Total DCplan contributions are calculated from the Department of Labor’s Private Pension Plan Bulletin(also see Figure 2).
Eighty-five percent (85 percent) of pre-retirement recipients between 1988 and 1992 report37
allocations that fall into just one of the six categories. For the 15 percent who report more thanone use, the proportional distribution of assets is not known. Distributions are thereforeassumed to be equally allocated to all reported uses in calculating the summary statistics.
Marginal probability estimates derived from the probit coefficients were also calculated and38
were quite similar to the linear probability estimates. These results are available from theauthors.
Workers can not be forced to receive a distribution exceeding $3,500 from either a DB or DC39
plan, but they can be forced to receive a distribution with a value of $3,500 or less (the limitwas increased to $5,000 effective January 1, 1998). Larger distributions are therefore onlymade to voluntary recipients, while smaller distributions are made to both voluntary andinvoluntary recipients.
Chang (1996) estimates probit models of the rollover decision using data from the May 198840
CPS. In different model specifications she finds distribution amount, age, family income, andthe marginal tax price of nonrollovers to be significant variables. Gelbach (1995) estimates amultinomial logit model using data from the April 1993 CPS. He finds the probability of arollover to increase with age and distribution amount. Poterba, Venti, and Wise (1995a)estimate a linear probability model, also using data from the April 1993 CPS. They finddistribution amount, age, income, and education to all be significant factors in the rolloverdecision.
We cannot reject the hypothesis that the coefficients are the same in the two subsamples (p-41
value = 0.91).
The impact on the rollover rate of a change in distribution amount or family income cannot be42
read directly off Table 9 since these variables are measured in logs. To measure the change inrollover probability associated with a $1,000 change in these variables, the coefficients are

32
divided by their sample means and then multiplied by 1,000.

TABLE 1
401(k) SPONSORSHIP, PARTICIPATION, AND CONTRIBUTIONS BY FAMILY INCOME, 1993
Income Interval Rate Rate Rate Contribution($ Thousands) (Percent) (Percent) (Percent) (Dollars)
Sponsored Participation Contribution Conditionala
Conditional Conditional
b c d
< 15 15.3 36.2 5.4 634
15 - 25 33.0 51.4 5.5 1,071
25 - 35 42.1 61.2 6.1 1,610
35 - 50 47.0 65.5 6.9 2,286
50 - 75 56.0 71.8 7.4 2,953
� 75 62.1 80.6 7.9 4,700
All 42.0 65.0 6.9 2,715
Percent of workers offered 401(k) plan.a
Participation rate for workers offered 401(k) plan.b
Mean percent of salary contributed to 401(k) plan for workers participating in plan.c
Mean annual dollar amount contributed to 401(k) plan for workers participating in plan.d
Source: Authors' calculations, based on data from the Current Population Survey.
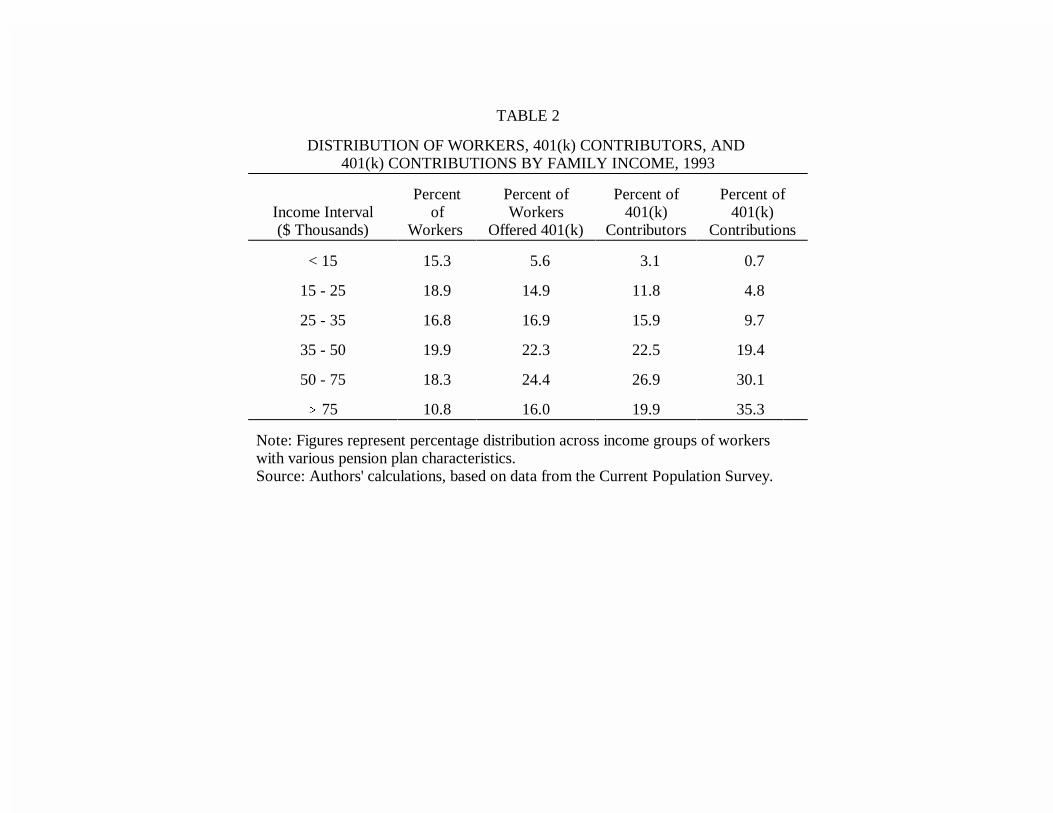
TABLE 2
DISTRIBUTION OF WORKERS, 401(k) CONTRIBUTORS, AND 401(k) CONTRIBUTIONS BY FAMILY INCOME, 1993
Income Interval of Workers 401(k) 401(k)($ Thousands) Workers Offered 401(k) Contributors Contributions
Percent Percent of Percent of Percent of
< 15 15.3 5.6 3.1 0.7
15 - 25 18.9 14.9 11.8 4.8
25 - 35 16.8 16.9 15.9 9.7
35 - 50 19.9 22.3 22.5 19.4
50 - 75 18.3 24.4 26.9 30.1
� 75 10.8 16.0 19.9 35.3
Note: Figures represent percentage distribution across income groups of workerswith various pension plan characteristics.Source: Authors' calculations, based on data from the Current Population Survey.
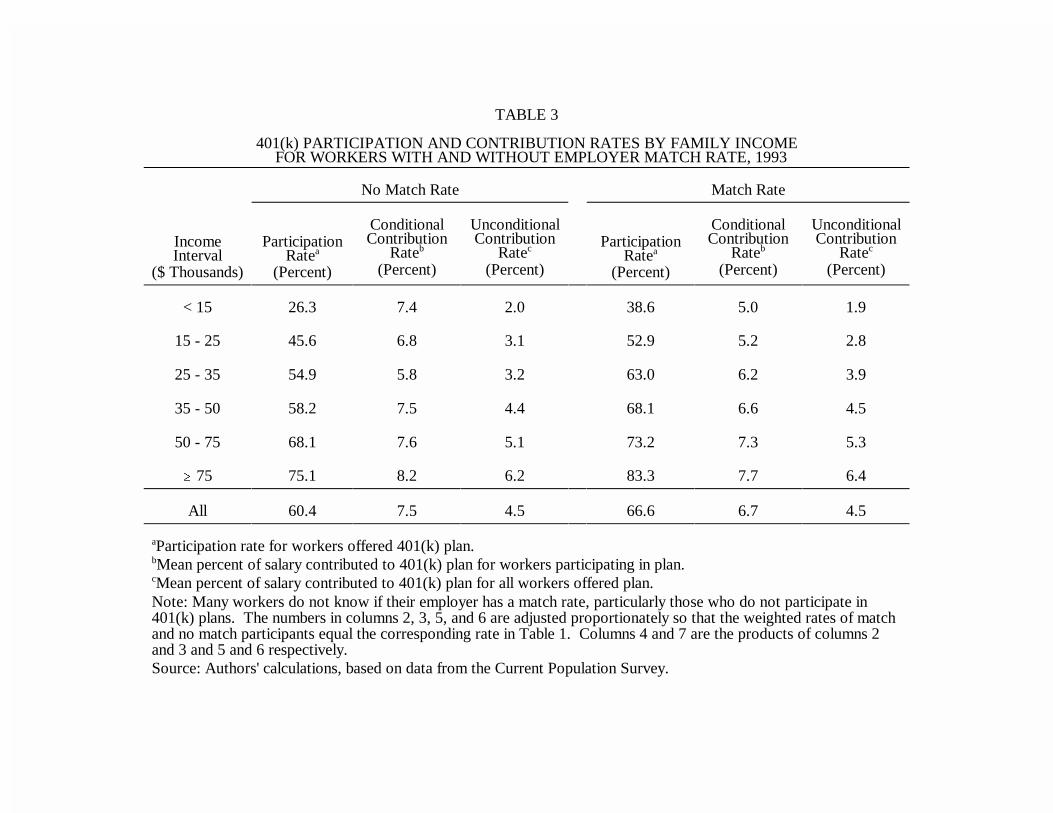
TABLE 3
401(k) PARTICIPATION AND CONTRIBUTION RATES BY FAMILY INCOME FOR WORKERS WITH AND WITHOUT EMPLOYER MATCH RATE, 1993
No Match Rate Match Rate
Income Participation ParticipationInterval Rate Rate
($ Thousands) (Percent) (Percent)
a
Conditional Unconditional Conditional UnconditionalContribution Contribution Contribution Contribution
Rate Rate Rate Rateb
(Percent) (Percent) (Percent) (Percent)
c a b c
< 15 26.3 7.4 2.0 38.6 5.0 1.9
15 - 25 45.6 6.8 3.1 52.9 5.2 2.8
25 - 35 54.9 5.8 3.2 63.0 6.2 3.9
35 - 50 58.2 7.5 4.4 68.1 6.6 4.5
50 - 75 68.1 7.6 5.1 73.2 7.3 5.3
� 75 75.1 8.2 6.2 83.3 7.7 6.4
All 60.4 7.5 4.5 66.6 6.7 4.5
Participation rate for workers offered 401(k) plan.a
Mean percent of salary contributed to 401(k) plan for workers participating in plan.b
Mean percent of salary contributed to 401(k) plan for all workers offered plan.c
Note: Many workers do not know if their employer has a match rate, particularly those who do not participate in401(k) plans. The numbers in columns 2, 3, 5, and 6 are adjusted proportionately so that the weighted rates of matchand no match participants equal the corresponding rate in Table 1. Columns 4 and 7 are the products of columns 2and 3 and 5 and 6 respectively.Source: Authors' calculations, based on data from the Current Population Survey.
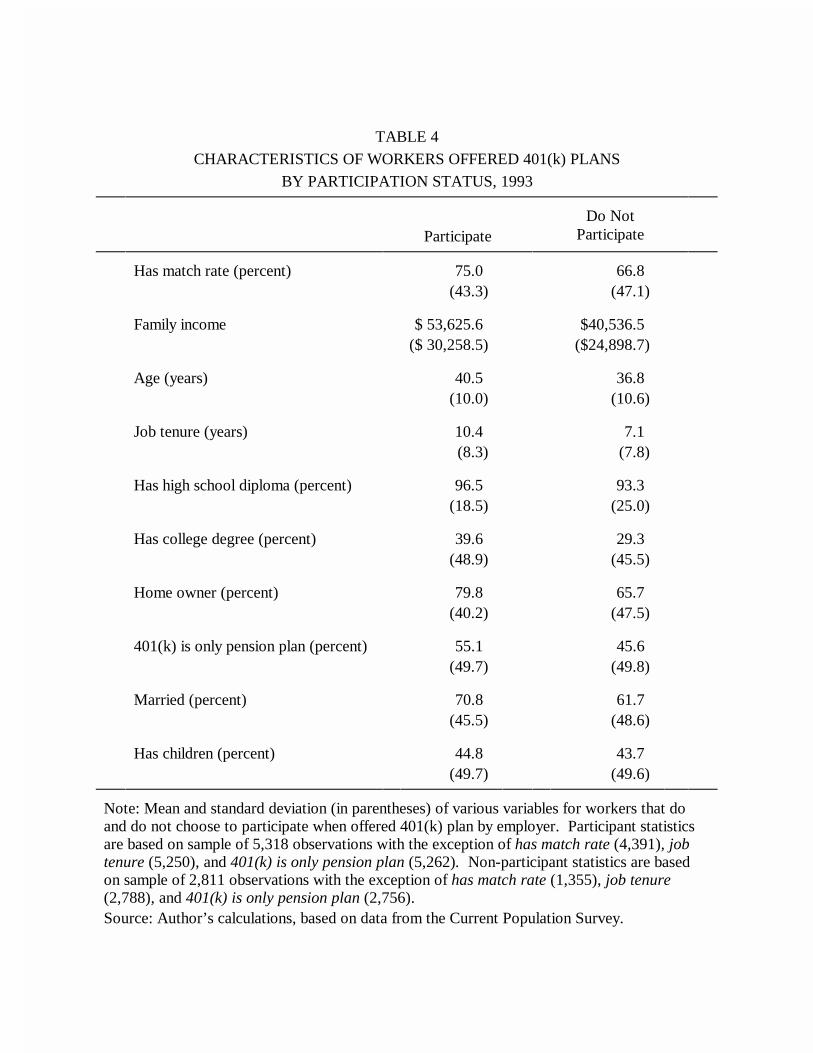
TABLE 4
CHARACTERISTICS OF WORKERS OFFERED 401(k) PLANS
BY PARTICIPATION STATUS, 1993
ParticipateDo Not
Participate
Has match rate (percent) 75.0 66.8(43.3) (47.1)
Family income $ 53,625.6 $40,536.5($ 30,258.5) ($24,898.7)
Age (years) 40.5 36.8(10.0) (10.6)
Job tenure (years) 10.4 7.1(8.3) (7.8)
Has high school diploma (percent) 96.5 93.3(18.5) (25.0)
Has college degree (percent) 39.6 29.3(48.9) (45.5)
Home owner (percent) 79.8 65.7(40.2) (47.5)
401(k) is only pension plan (percent) 55.1 45.6(49.7) (49.8)
Married (percent) 70.8 61.7(45.5) (48.6)
Has children (percent) 44.8 43.7(49.7) (49.6)
Note: Mean and standard deviation (in parentheses) of various variables for workers that doand do not choose to participate when offered 401(k) plan by employer. Participant statisticsare based on sample of 5,318 observations with the exception of has match rate (4,391), jobtenure (5,250), and 401(k) is only pension plan (5,262). Non-participant statistics are basedon sample of 2,811 observations with the exception of has match rate (1,355), job tenure(2,788), and 401(k) is only pension plan (2,756).Source: Author’s calculations, based on data from the Current Population Survey.
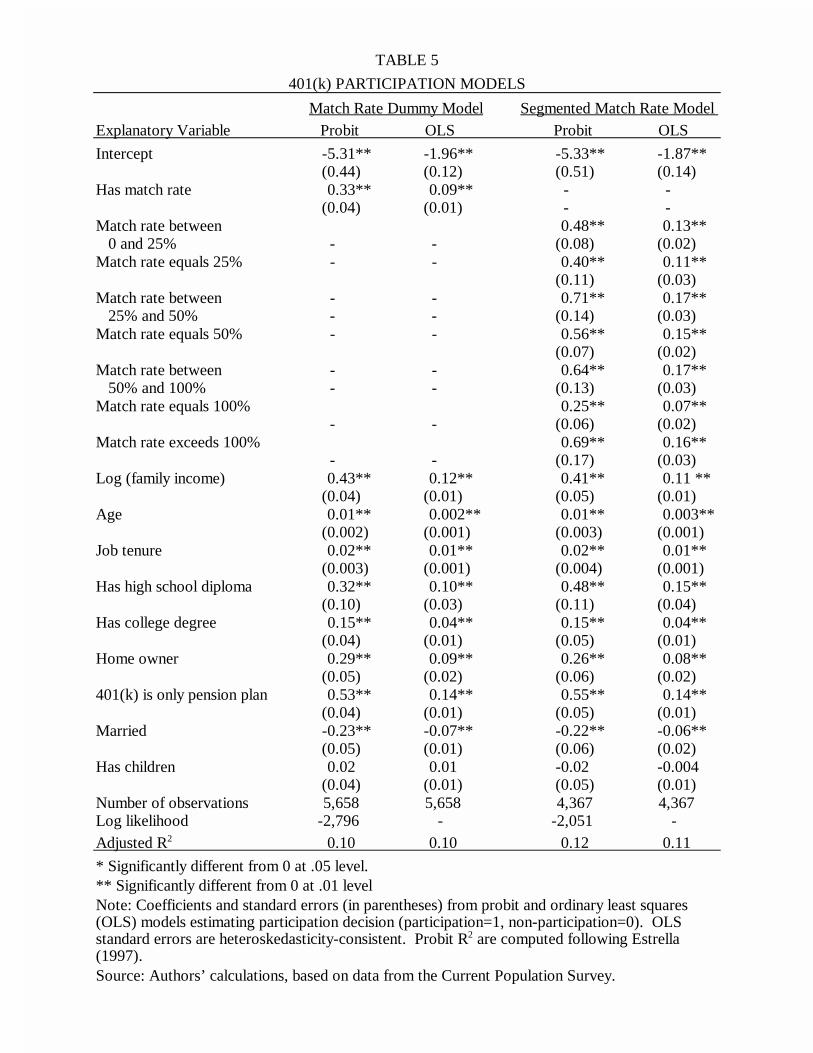
TABLE 5
401(k) PARTICIPATION MODELS
Match Rate Dummy Model Segmented Match Rate Model Explanatory Variable Probit OLS Probit OLS
Intercept -5.31** -1.96** -5.33** -1.87**(0.44) (0.12) (0.51) (0.14)
Has match rate 0.33** 0.09** - -(0.04) (0.01) - -
Match rate between 0.48** 0.13** 0 and 25% - - (0.08) (0.02)Match rate equals 25% - - 0.40** 0.11**
(0.11) (0.03)Match rate between - - 0.71** 0.17** 25% and 50% - - (0.14) (0.03)Match rate equals 50% - - 0.56** 0.15**
(0.07) (0.02)Match rate between - - 0.64** 0.17** 50% and 100% - - (0.13) (0.03)Match rate equals 100% 0.25** 0.07**
- - (0.06) (0.02)Match rate exceeds 100% 0.69** 0.16**
- - (0.17) (0.03)Log (family income) 0.43** 0.12** 0.41** 0.11 **
(0.04) (0.01) (0.05) (0.01)Age 0.01** 0.002** 0.01** 0.003**
(0.002) (0.001) (0.003) (0.001)Job tenure 0.02** 0.01** 0.02** 0.01**
(0.003) (0.001) (0.004) (0.001)Has high school diploma 0.32** 0.10** 0.48** 0.15**
(0.10) (0.03) (0.11) (0.04)Has college degree 0.15** 0.04** 0.15** 0.04**
(0.04) (0.01) (0.05) (0.01)Home owner 0.29** 0.09** 0.26** 0.08**
(0.05) (0.02) (0.06) (0.02)401(k) is only pension plan 0.53** 0.14** 0.55** 0.14**
(0.04) (0.01) (0.05) (0.01)Married -0.23** -0.07** -0.22** -0.06**
(0.05) (0.01) (0.06) (0.02)Has children 0.02 0.01 -0.02 -0.004
(0.04) (0.01) (0.05) (0.01)Number of observations 5,658 5,658 4,367 4,367Log likelihood -2,796 - -2,051 -Adjusted R 0.10 0.10 0.12 0.112
* Significantly different from 0 at .05 level.** Significantly different from 0 at .01 levelNote: Coefficients and standard errors (in parentheses) from probit and ordinary least squares(OLS) models estimating participation decision (participation=1, non-participation=0). OLSstandard errors are heteroskedasticity-consistent. Probit R are computed following Estrella2
(1997).Source: Authors’ calculations, based on data from the Current Population Survey.
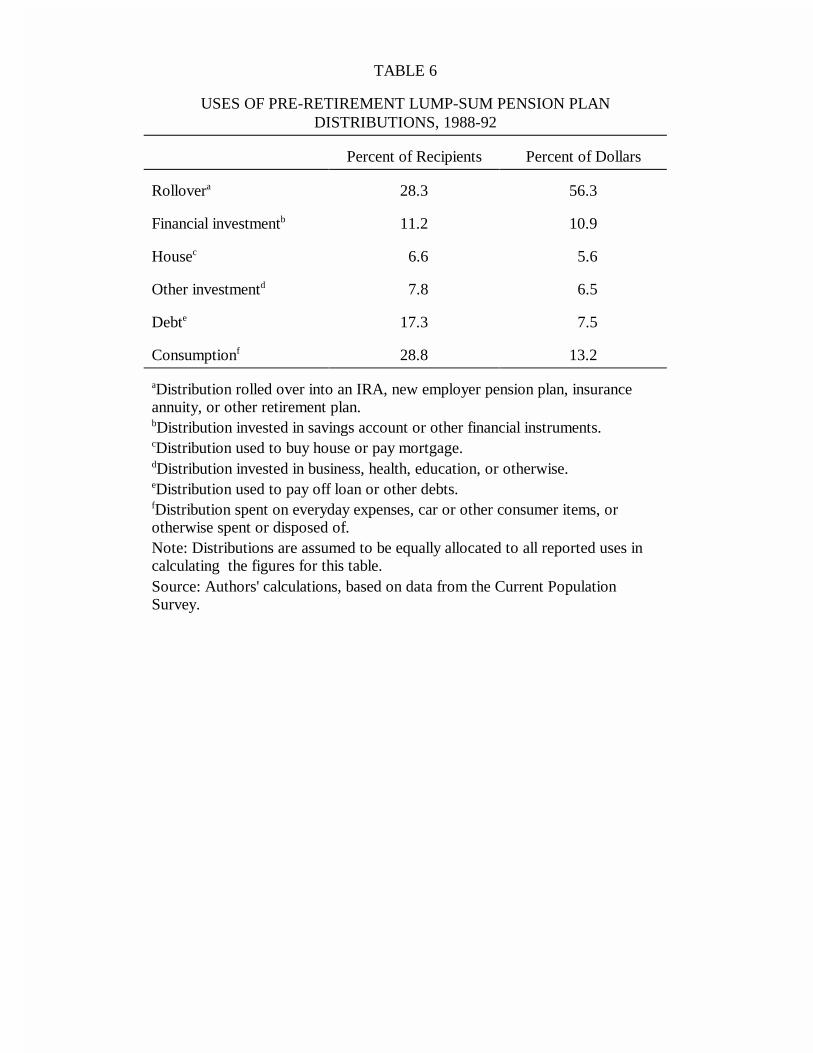
TABLE 6
USES OF PRE-RETIREMENT LUMP-SUM PENSION PLANDISTRIBUTIONS, 1988-92
Percent of Recipients Percent of Dollars
Rollover 28.3 56.3a
Financial investment 11.2 10.9b
House 6.6 5.6c
Other investment 7.8 6.5d
Debt 17.3 7.5e
Consumption 28.8 13.2f
Distribution rolled over into an IRA, new employer pension plan, insurancea
annuity, or other retirement plan.Distribution invested in savings account or other financial instruments.b
Distribution used to buy house or pay mortgage.c
Distribution invested in business, health, education, or otherwise.d
Distribution used to pay off loan or other debts.e
Distribution spent on everyday expenses, car or other consumer items, orf
otherwise spent or disposed of.Note: Distributions are assumed to be equally allocated to all reported uses incalculating the figures for this table.Source: Authors' calculations, based on data from the Current PopulationSurvey.
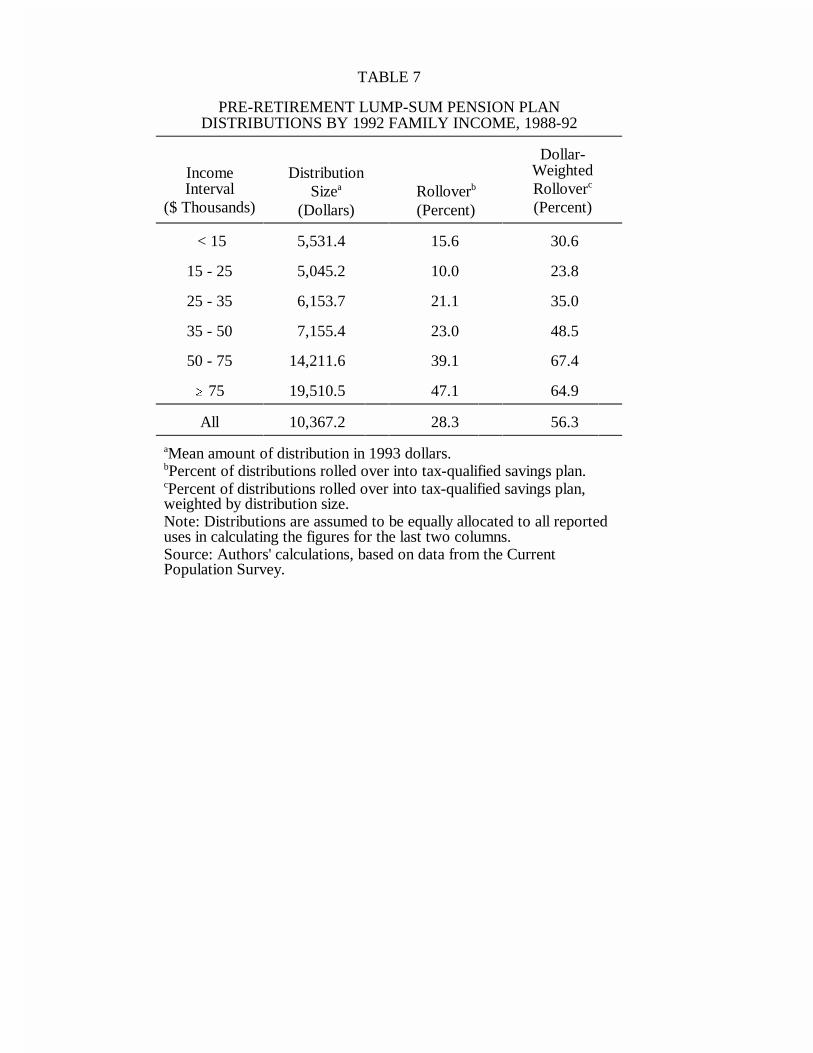
TABLE 7
PRE-RETIREMENT LUMP-SUM PENSION PLANDISTRIBUTIONS BY 1992 FAMILY INCOME, 1988-92
Income DistributionInterval Rollover
($ Thousands) (Percent)Size Rollovera
(Dollars) (Percent)
b
Dollar-Weighted
c
< 15 5,531.4 15.6 30.6
15 - 25 5,045.2 10.0 23.8
25 - 35 6,153.7 21.1 35.0
35 - 50 7,155.4 23.0 48.5
50 - 75 14,211.6 39.1 67.4
� 75 19,510.5 47.1 64.9
All 10,367.2 28.3 56.3
Mean amount of distribution in 1993 dollars.a
Percent of distributions rolled over into tax-qualified savings plan.b
Percent of distributions rolled over into tax-qualified savings plan,c
weighted by distribution size.Note: Distributions are assumed to be equally allocated to all reporteduses in calculating the figures for the last two columns.Source: Authors' calculations, based on data from the CurrentPopulation Survey.
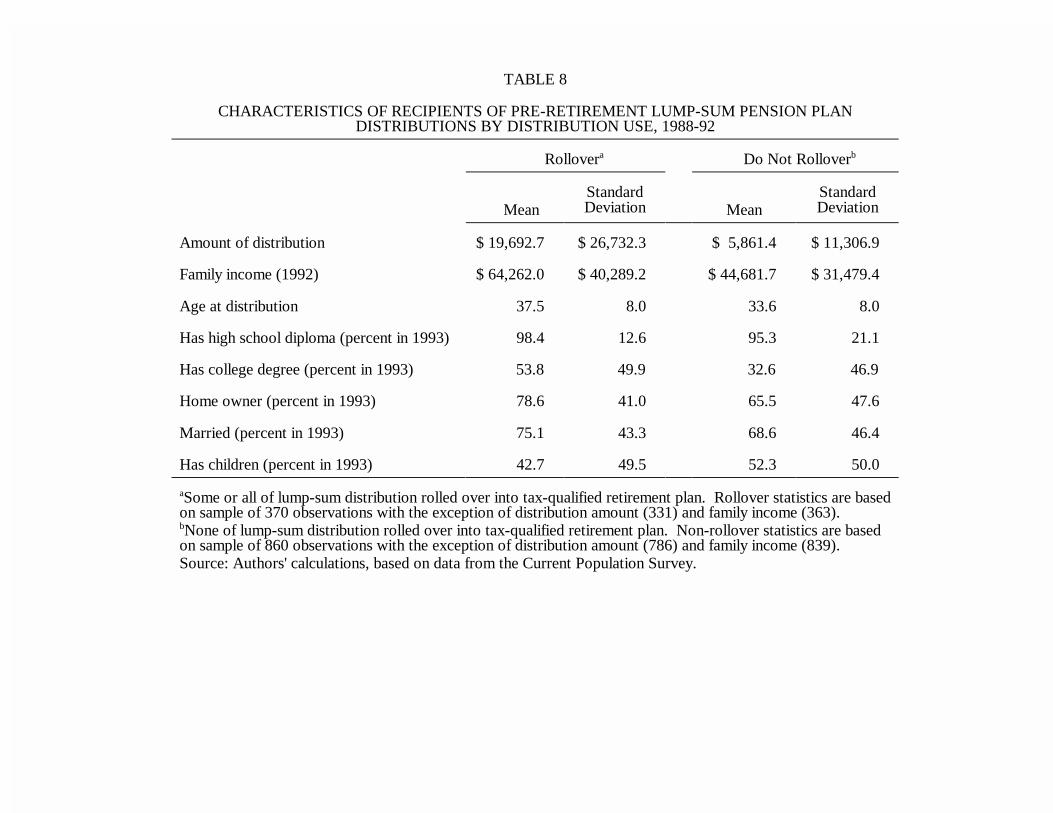
TABLE 8
CHARACTERISTICS OF RECIPIENTS OF PRE-RETIREMENT LUMP-SUM PENSION PLANDISTRIBUTIONS BY DISTRIBUTION USE, 1988-92
Rollover Do Not Rollover a b
Mean MeanStandard StandardDeviation Deviation
Amount of distribution $ 19,692.7 $ 26,732.3 $ 5,861.4 $ 11,306.9
Family income (1992) $ 64,262.0 $ 40,289.2 $ 44,681.7 $ 31,479.4
Age at distribution 37.5 8.0 33.6 8.0
Has high school diploma (percent in 1993) 98.4 12.6 95.3 21.1
Has college degree (percent in 1993) 53.8 49.9 32.6 46.9
Home owner (percent in 1993) 78.6 41.0 65.5 47.6
Married (percent in 1993) 75.1 43.3 68.6 46.4
Has children (percent in 1993) 42.7 49.5 52.3 50.0
Some or all of lump-sum distribution rolled over into tax-qualified retirement plan. Rollover statistics are baseda
on sample of 370 observations with the exception of distribution amount (331) and family income (363).None of lump-sum distribution rolled over into tax-qualified retirement plan. Non-rollover statistics are basedb
on sample of 860 observations with the exception of distribution amount (786) and family income (839).Source: Authors' calculations, based on data from the Current Population Survey.
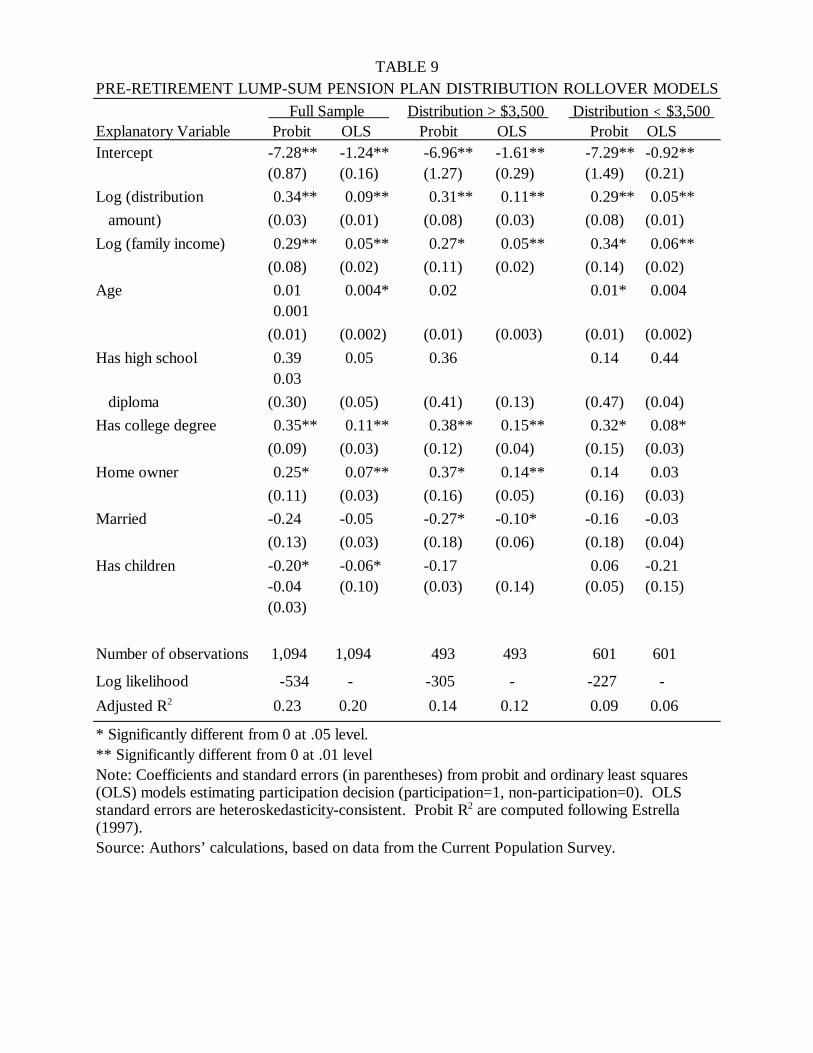
TABLE 9PRE-RETIREMENT LUMP-SUM PENSION PLAN DISTRIBUTION ROLLOVER MODELS
Full Sample Distribution > $3,500 Distribution � $3,500 Explanatory Variable Probit OLS Probit OLS Probit OLSIntercept -7.28** -1.24** -6.96** -1.61** -7.29** -0.92**
(0.87) (0.16) (1.27) (0.29) (1.49) (0.21)
Log (distribution 0.34** 0.09** 0.31** 0.11** 0.29** 0.05**
amount) (0.03) (0.01) (0.08) (0.03) (0.08) (0.01)
Log (family income) 0.29** 0.05** 0.27* 0.05** 0.34* 0.06**
(0.08) (0.02) (0.11) (0.02) (0.14) (0.02)
Age 0.01 0.004* 0.02 0.01* 0.0040.001
(0.01) (0.002) (0.01) (0.003) (0.01) (0.002)
Has high school 0.39 0.05 0.36 0.14 0.440.03
diploma (0.30) (0.05) (0.41) (0.13) (0.47) (0.04)
Has college degree 0.35** 0.11** 0.38** 0.15** 0.32* 0.08*
(0.09) (0.03) (0.12) (0.04) (0.15) (0.03)
Home owner 0.25* 0.07** 0.37* 0.14** 0.14 0.03
(0.11) (0.03) (0.16) (0.05) (0.16) (0.03)
Married -0.24 -0.05 -0.27* -0.10* -0.16 -0.03
(0.13) (0.03) (0.18) (0.06) (0.18) (0.04)
Has children -0.20* -0.06* -0.17 0.06 -0.21-0.04 (0.10) (0.03) (0.14) (0.05) (0.15)(0.03)
Number of observations 1,094 1,094 493 493 601 601
Log likelihood -534 - -305 - -227 -
Adjusted R 0.23 0.20 0.14 0.12 0.09 0.062
* Significantly different from 0 at .05 level.** Significantly different from 0 at .01 levelNote: Coefficients and standard errors (in parentheses) from probit and ordinary least squares(OLS) models estimating participation decision (participation=1, non-participation=0). OLSstandard errors are heteroskedasticity-consistent. Probit R are computed following Estrella2
(1997).Source: Authors’ calculations, based on data from the Current Population Survey.
Defined Benefit
Defined Contribution
401(k)
FIGURE 1. Pension Plan Participation, 1975-93
Per
cent
of T
otal
Wor
kfor
ce
Source: "Private Pension Plan Bulletin" (U.S. Department of Labor).
1975 1977 1979 1981 1983 1985 1987 1989 1991 19935%
10%
15%
20%
25%
30%
35%
40%
45%
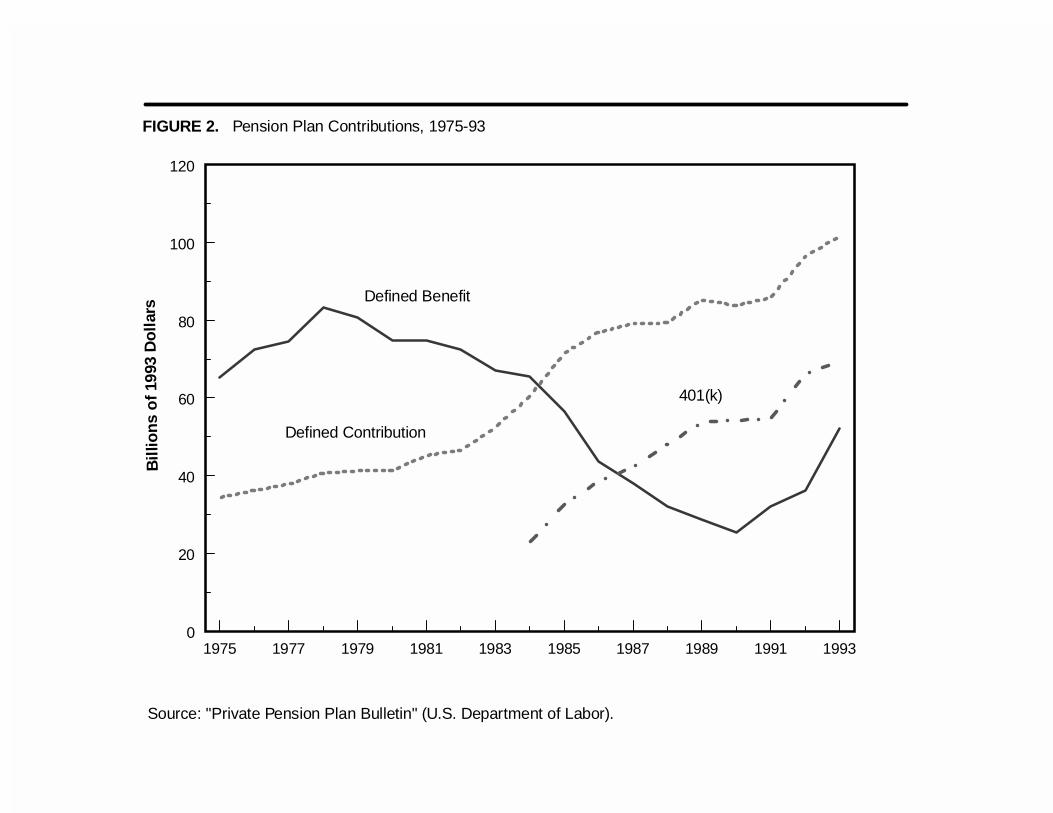
1975 1977 1979 1981 1983 1985 1987 1989 1991 19930
20
40
60
80
100
120
Defined Benefit
Defined Contribution
401(k)
FIGURE 2. Pension Plan Contributions, 1975-93
Source: "Private Pension Plan Bulletin" (U.S. Department of Labor).
Bill
ions
of 1
993
Dol
lars
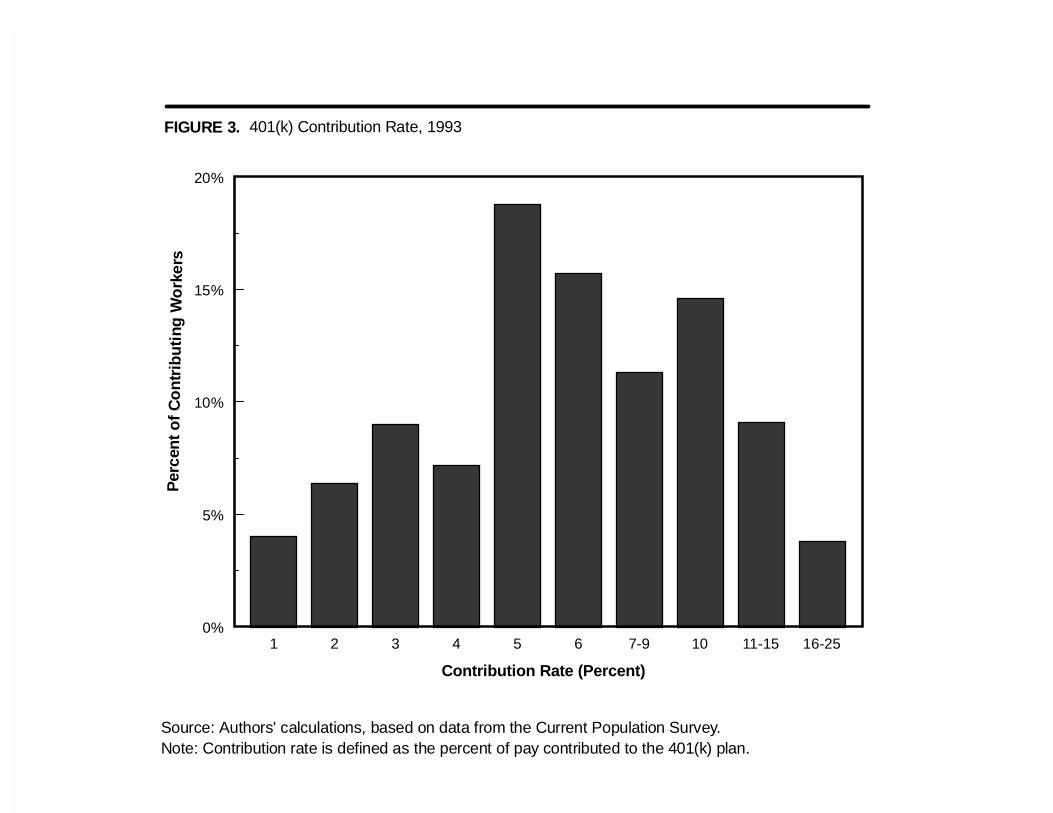
1 2 3 4 5 6 7-9 10 11-15 16-250%
5%
10%
15%
20%
FIGURE 3. 401(k) Contribution Rate, 1993
Per
cent
of C
ontri
butin
g W
orke
rs
Contribution Rate (Percent)
Source: Authors' calculations, based on data from the Current Population Survey.Note: Contribution rate is defined as the percent of pay contributed to the 401(k) plan.
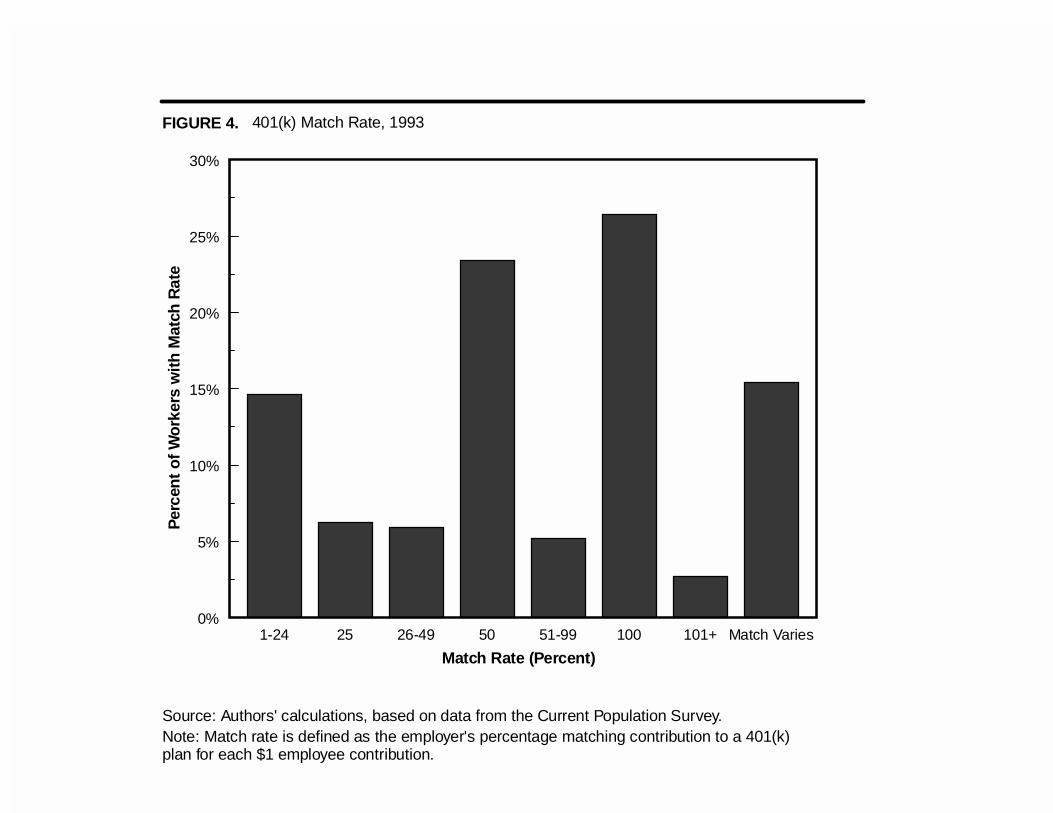
1-24 25 26-49 50 51-99 100 101+ Match Varies0%
5%
10%
15%
20%
25%
30%
FIGURE 4. 401(k) Match Rate, 1993
Source: Authors' calculations, based on data from the Current Population Survey.Note: Match rate is defined as the employer's percentage matching contribution to a 401(k) plan for each $1 employee contribution.
Per
cent
of W
orke
rs w
ith M
atch
Rat
e
Match Rate (Percent)
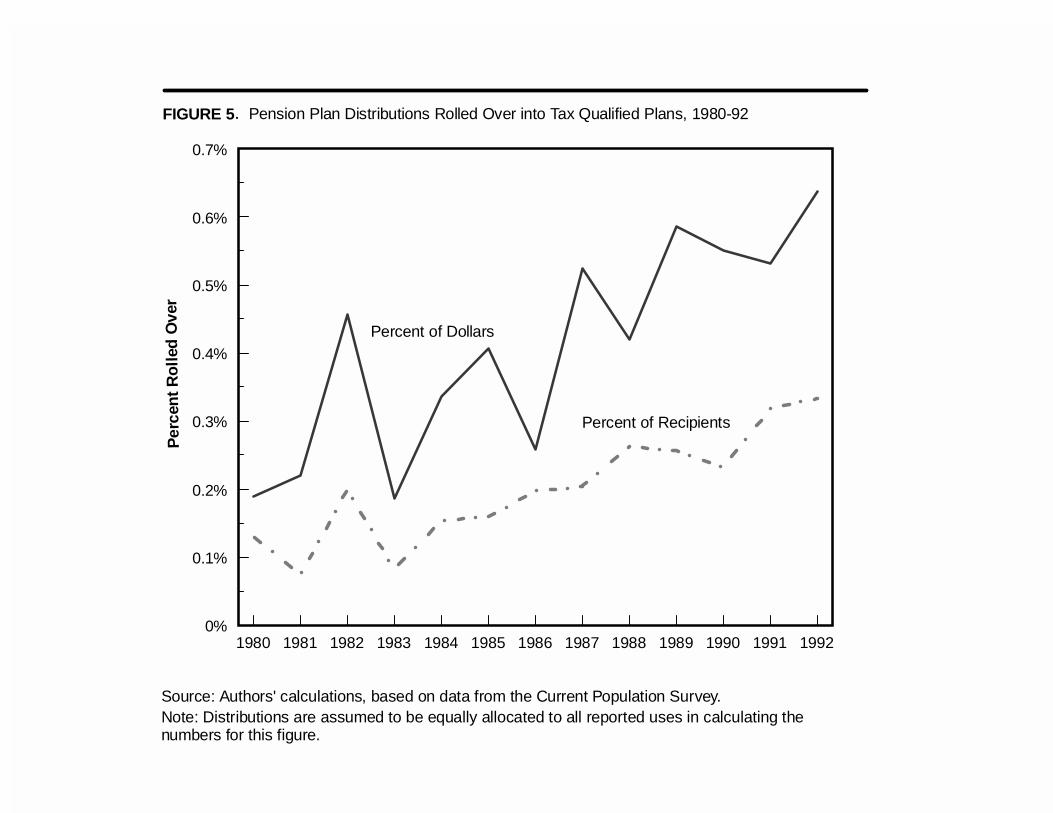
1980 1981 1982 1983 1984 1985 1986 1987 1988 1989 1990 1991 19920%
0.1%
0.2%
0.3%
0.4%
0.5%
0.6%
0.7%
FIGURE 5. Pension Plan Distributions Rolled Over into Tax Qualified Plans, 1980-92
Source: Authors' calculations, based on data from the Current Population Survey.Note: Distributions are assumed to be equally allocated to all reported uses in calculating the numbers for this figure.
Percent of Dollars
Percent of Recipients
Per
cent
Rol
led
Ove
r