how wind and solar could power drc and south africa · renewable riches: how wind and solar could...
TRANSCRIPT
Renewable Riches: How Wind and Solar Could Power DRC and South AfricaSeptember 2017Ranjit Deshmukh, Ana Mileva, Grace C. Wu
ContentsExecutive Summary 7
1 Introduction 15
2 Harnessing the DRC’s Renewable Energy Potential 19 2.1 EstimatingwindandsolarPVresourcepotentialintheDRC 19 2.1.1 Datasetsusedforanalysis 19 2.1.2 QuantifyingtheavailabilityandaveragecostsofsolarPVandwindsites 19
2.2 Findings 20 2.2.1 WindandsolarPVresourcepotentialandaveragecosts 20 2.2.2WindandsolarPVresourcepotentialandaveragecostswithinminingareas 22
3 Meeting South Africa’s Low-Carbon Energy Needs 25 3.1 OptimizingelectricitygenerationcapacityinvestmentsforSouthAfrica 25 3.1.1 Demandandconventionalgenerationassumptions 25 3.1.2 Windandsolarassumptions 26 3.1.3 Hydropowerassumptions 26 3.1.4 Scenarios 26
3.2 Findings 27 3.2.1 Least-costelectricitygenerationmixforSouthAfricawithandwithoutInga3 27 3.2.2 ExpectedcostsorsavingsofincludingInga3inSouthAfrica’selectricityfuture 28 3.2.3 EstimatingcostimplicationsofpotentialcostoverrunsofInga3 28
4 Conclusions 30 4.1 WindandsolarcanenableenergysecurityandenergyaccessintheDRC 31 4.1.1 Abundant,low-cost,andaccessiblewindandsolarPVpotentialexistintheDRC 31 4.1.2 Miningenergyneedscanbelocallyservedbywindandsolarresources 31 4.1.3 StrategiesformanagingwindandsolarPVvariability 31 4.1.4 DecentralizedalternativesarenecessaryforexpandingelectricityaccessintheDRC 32
4.2 SensitivityanalysesshowhigheconomicriskofInga3forSouthAfrica 32 4.2.1 Wind,solarPV,andnaturalgasaremorecosteffectivethanInga3 32 4.2.2 LeadtimeforconstructionofInga3couldincreasecostsby50%ormore 33 4.2.3 TransmissionlossescouldincreasecostsforSouthAfricabyanadditional5-10% 33 4.2.4 WindandsolarPVtechnologiesarerapidlyadvancingandcostswillcontinuetofall 33
References 34
Appendices 36
About International RiversInternational Rivers protects rivers and defends the rights of communities that depend on them.
We seek a world where healthy rivers and the rights of local river communities are valued and protected. We envision a world where water and energy needs are met without degrading nature or increasing poverty, and where people have the right to participate in decisions that affect their lives.
We are a global organization with regional offices in Asia, Africa and Latin America. We work with river-dependent and dam-affected communities to ensure their voices are heard and their rights are respected. We help to build well-resourced, active networks of civil society groups to demonstrate our collective power and create the change we seek. We undertake independent, investigative research, generating robust data and evidence to inform policies and campaigns. We remain independent and fearless in campaigning to expose and resist destructive projects, while also engaging with all relevant stakeholders to develop a vision that protects rivers and the communities that depend upon them.
About the Authors Dr. Ranjit Deshmukh is an energy analyst and postdoctoral fellow at the International Energy Studies Group at Lawrence Berkeley National Laboratory. His research focuses on the policies and technical solutions needed to integrate large amounts of wind and solar in electricity grids of developing regions, especially India and Africa. He holds a PhD from the Energy and Resources Group at the University of California at Berkeley. Dr. Ana Mileva is an independent consultant and expert in grid analytics who focuses on modeling and policy analysis for wind and solar grid integration, energy storage, and climate change mitigation. She previously worked with E3 (Energy & Environmental Economics) where she was technical lead on resource planning, renewables integration, and asset valuation. She holds a PhD from the Energy and Resources Group at the University of California at Berkeley. Grace C. Wu is an environmental scientist and PhD Candidate in the Energy and Resources Group at the University of California at Berkeley. She advises the California Energy Program at The Nature Conservancy in assessing land use impacts of ambitious renewable energy targets, and is also a technical adviser to the Energy Sector Management Assistance Program at the World Bank. She holds an MS in Energy and Resources from the University of California at Berkeley.
Published September 2017
Copyright 2017 by International Rivers
Authors: Ranjit Deshmukh, Ana Mileva & Grace C. Wu Designed by: Daniel Cordner Design cargocollective.com/danielcordnerdesign
International RiversG9 ProEquity Court1250 Pretorius StreetHatfieldPretoriaSouth Africa
+27 124302029 www.internationalrivers.org

Renewable Riches: How Wind and Solar Could Power DRC and South Africa 5
DRC has abundant, low-cost, and accessible wind and solar potential that’s sufficient to not only replace but greatly surpass energy supplied by the proposed Inga 3 Dam.
CONGO RIVER

Executive SummaryAfrica is endowed with enormous renewable energy potential, yet the continent suffers from some of the world’s worst energy poverty. This energy poverty gap is especially pronounced in the Democratic Republic of Congo (DRC), where only 13.5% of the population has access to electricity. The deficit stunts economic development and impoverishes millions: In 2015, DRC’s GDP per capita ranked among the lowest in the world.
The good news is that the solution to the country’s energy poverty already exists. Our new study shows that the DRC has abundant, low-cost and accessible wind and solar potential that’s sufficient to not only completely replace but greatly surpass energy that would be supplied by the proposed Inga 3 Dam.
Energy Potential in DRC
Solar PV potential generation: 70 GW * _
*Within 25 km of planned or existing transmission lines.
Wind power potential generation: 15 GW *_
*Within 25 km of planned or existing transmission lines.
Inga 3 Dam potential generation: 4.8 GW_
Grand Inga potential generation: 40 GW _
Renewable Riches: How Wind and Solar Could Power DRC and South Africa 7
This Executive Summary was prepared by International Rivers
Renewable Riches: How Wind and Solar Could Power DRC and South Africa 9
These challenges have been exemplified in the proposed Inga 3 Dam, which is intended to supply low-carbon power to South Africa, mining areas in the DRC, and homes and businesses in DRC’s capital, Kinshasa. In the works since 2004 and the first in the planned 40 GW Grand Inga scheme, the Inga 3 Dam has faced repeated setbacks. Most recently, the DRC government asked developers to redesign the project after they found initial proposals were prohibitively expensive and would have failed to deliver sufficient electricity. These persistent challenges could also jeopardize South Africa’s low-carbon energy plans, which factor in future power imports from Inga 3 to reduce the need for new coal plants. Growth of Wind & Solar
Meanwhile, the deployment of renewable energy technologies like wind and solar has grown significantly in recent years. Technological innovations and plummeting costs have prompted energy planners to reexamine their singular focus on conventional power generation projects to meet their energy needs. Sub-Saharan Africa in particular is blessed with significant solar and wind energy potential that can often be deployed more quickly than traditional power sources at increasingly competitive costs. At the same time, grid operators now understand better how to balance a mix of variable energy sources to ensure a stable energy supply, and they are implementing successful strategies to harness progressively larger shares of variable energy resources like wind and solar. South Africa has increased its
share of new renewables in an effort to reduce the carbon intensity of its coal-heavy energy sector, and most recently competitive auctions in Zambia yielded some of the world’s lowest solar energy prices. In light of these developments, International Rivers commissioned energy analysts to evaluate whether solar and wind resources could feasibly meet the DRC and South Africa’s needs to deliver reliable, low-cost and low-carbon energy to power economic development. The study finds that the DRC has enormous untapped solar and wind potential that could affordably address the country’s power shortage, while wind and solar could meet South Africa’s energy needs much more cheaply than Inga 3. The DRC and South Africa deserve clean, reliable and affordable electricity so that they can improve the lives of their citizens. By developing their considerable renewable energy potential, they can achieve it. Harnessing the Democratic Republic of Congo’s Renewable Energy Potential The DRC’s national grid suffers from a chronic electricity deficit, prompting daily load-shedding in major urban centers such as the capital, Kinshasa. This lack of power also severely limits the operations of the country’s mining companies, which often resort to generating power locally using expensive diesel generators. Researchers studied DRC’s solar and wind potential and used the findings below to illustrate how these resources could meet DRC’s pressing electricity needs.
MethodsThe researchers applied the Multi-criteria Analysis and Planning for Renewable Energy (MapRE) methodology, which combines high-quality datasets to identify viable renewable energy sites capable of providing least-cost grid-scale power generation. To estimate solar energy potential, they drew upon the latest observed solar radiation data from Solargis made publicly available by the World Bank in 2017. The researchers assessed wind potential based on Vaisala’s wind speed datasets published in the International Renewable Energy Agency’s (IRENA) Global Atlas. Using these data, the researchers modeled the best sites for the development of wind and solar energy in the DRC, identifying areas with high generation potential located near existing and planned transmission lines and estimating the average cost per kilowatt hour (kWh) of bringing that power to the grid. This analysis includes equipment and maintenance costs of generation, as well as ancillary costs of infrastructure to access the resources (such as roads and transmission lines) so the power can be fed into the grid. These potential sites were then overlaid with a number of spatial data sets to exclude protected areas and forest cover, as well as populated areas and farmland. The researchers conducted a similar simulation of wind and solar energy potential located on areas with active mining exploration and exploitation permits to examine whether these renewable resources could meet the energy needs of the mining industry.
Background
For decades, the DRC government has prioritized the development of large hydropower projects to deliver needed energy. However, these projects have been stalled by their complexity. Large hydropower projects face a range of challenges, including often prohibitive upfront costs, major cost overruns and delays, difficulties in attracting finance, enormous social and environmental footprints, vulnerability to climate change, and poor track records of delivering promised power.

Renewable Riches: How Wind and Solar Could Power DRC and South Africa 1110 Renewable Riches: How Wind and Solar Could Power DRC and South Africa
Findings
The researchers determined that the DRC has abundant, low-cost and accessible wind and solar potential that is sufficient to completely replace and greatly surpass the energy that would be supplied by the proposed Inga 3 Dam. DRC could install a minimum of 15 GW of wind power and 70 GW of solar PV within 25 kilometers of existing and planned transmission lines. Researchers found that the electricity produced through wind and solar power would also be cost-competitive: They identified up to 5 GW of wind power capacity at less than $0.08 per kWh, and over 50 GW of solar PV capacity at less than $0.07 per kWh. For a rough comparison, the World Bank projected a cost of $0.07-$0.08 per kWh for electricity from Inga 3 for DRC utility customers. While the World Bank’s costs do include other operations and infrastructure costs of delivering the electricity to consumers, their estimates do not factor in Inga 3’s likely cost overruns. Southeastern DRC is home to the majority of the country’s most affordable solar and wind resources, thanks to the region’s high resource quality and proximity to existing transmission lines. The researchers also identified over 6 GW of potential solar PV projects near Kinshasa with an average cost of $0.07 per kWh. Electricity generated from grid-connected wind and solar PV plants could serve customers in the Greater Kinshasa area, mines in Katanga, and other urban centers connected to the national grid, regardless of where they are. The researchers also examined the potential for DRC’s mining sector to meet its energy needs through wind and solar PV by developing generation projects in areas already permitted for mining. An initial analysis indicates that areas under mining concessions hold high potential for cost-competitive solar PV. Further research can identify specific sites that can be developed appropriately to provide cost-competitive solar power to the mining industry.
Meeting South Africa’s Low-Carbon Energy Needs South Africa has viewed Inga 3 as a means of helping it meet its growing energy demand and reduce the carbon intensity of its coal-heavy energy sector. The researchers sought to ascertain the country’s lowest-cost energy options, and examined how including Inga 3 would affect the cost and composition of South Africa’s energy expansion. Methods
Researchers utilized the Gridpath analytics platform to model energy expansion and investment options for South Africa to the year 2035. They worked to determine the most inexpensive ways South Africa could secure low-carbon energy to meet future energy demand. Gridpath is a dynamic modeling tool capable of factoring in energy demand and renewable energy supply that varies throughout the day and throughout the year, and assists in identifying renewable resources that complement existing and planned energy generation and that are available at least cost. Researchers ran the model based on South Africa’s demand forecast and used representative wind speed and solar radiation data to identify the least-cost investments in generation capacity. The researchers ran the model using different scenarios, both with Inga 3 and without, and used a range of assumptions about the costs and performance of solar, wind and hydropower. Findings
In 11 out of 12 scenarios examined, the researchers found that a combination of solar, wind and natural gas is the most affordable option that will allow South Africa to meet its projected energy demand. The Gridpath modeling exercise showed that among all available energy options, South Africa should pursue new renewables available domestically, chiefly wind power, paired with a limited amount of gas as standby power to fill infrequent gaps in energy supply.
When Inga 3 was included in the electricity mix used in the Gridpath simulations, costs increased under all but the most optimistic scenario. In the median scenario of Inga’s generation potential, annual savings without Inga vary between $37 and $278 million per year. Annual savings without Inga 3 reach as high as $333 million if Inga performs worse than expected. The researchers found that Inga 3 would be minimally cost-effective for South Africa only if it meets a series of factors: It is built at the lowest estimated cost, with zero cost overruns and well-above-average generation potential, and solar and wind output is the lowest expected under the most pessimistic technology assumptions. While highly unlikely that all these assumptions would be met, including Inga 3 (as opposed to solar and wind) in the generation mix would represent only an annual benefit of $28 million. Yet the study shows that if Inga 3 suffers even a modest cost overrun of 20%, it would render this scenario uneconomic. Recent studies have shown the high likelihood and extent of overruns in large dam projects, with cost overruns averaging between 71% and 96%.
Villagers who would be displaced by Inga 3 Dam. Photo courtesy of International Rivers.

Renewable Riches: How Wind and Solar Could Power DRC and South Africa 1312 Renewable Riches: How Wind and Solar Could Power DRC and South Africa
1. The DRC is blessed with enormous solar and wind energy potential that it can use to meet its energy needs.
The latest data show that the DRC has 85 GW of solar PV and wind potential located near existing and planned transmission lines that could be connected to the national grid to address the country’s chronic energy deficit. This potential excludes populated areas, forests, farmland and protected areas. By contrast, the DRC currently only has roughly 2.5 GW of total installed capacity.
2. The DRC’s solar and wind energy potential dwarfs that of the Inga site.
As currently designed, the Inga 3 Dam would have a peak generating capacity of 4.8 GW, while the entire Grand Inga complex has a potential of 40 GW. In contrast, researchers identified 70 GW of solar PV and 15 GW of wind potential.
3. Solar and wind can be cost-competitive alternatives.
Researchers found that the electricity produced through wind and solar power would be cost-competitive: Up to 5 GW of wind power could generate electricity at less than $0.08 per kWh, with over 50 GW of solar PV at less than $0.07 per kWh. Other peer-reviewed research comparing renewable energy projects with hydropower, coal and nuclear projects have found that wind and solar projects can also be deployed quickly. Wind projects can typically be built within one to three years, and most solar PV projects take one year to construct. Large hydropower projects like Inga 3 take years – and sometimes decades – to build, and frequently incur significant delays.
4. Innovations in other countries show that wind and solar could provide a stable energy supply to the DRC’s power grid.
In recent years, grid operators around the world have made important advances in harnessing increasing shares of variable renewable energy, reaching renewable penetration as high as 50%. The DRC’s existing hydropower capacity could serve as an ideal complement to wind and solar by quickly filling in any gaps in generation. In addition, developing high-quality wind and solar sites in geographically diverse parts of the country would help maintain grid reliability and hedge against shortfalls in any particular part of the country.
5. Abundant solar and wind in mining areas could potentially power the country’s mining operations.
The mining industry also has an unprecedented opportunity to explore the availability of solar PV on lands already under mining concessions, close to where electricity is consumed. By developing abundant renewable energy on existing mining-permitted areas, companies could potentially produce their own power, supplementing it with power from the grid as needed, or replace existing high-polluting and high-cost diesel generation.
6. Grid-based solar and wind could help improve energy access rates in the DRC, but must be complemented with off-grid solutions.
Increasing power to the grid is not a silver bullet to address all of DRC’s energy needs, but it could help meaningfully address the country’s major energy supply deficit, while also expanding access to Congolese citizens. To be successful, DRC would need to develop concrete strategies to both expand grid connections in predominantly urban centers, and to
reach those living in rural areas. The UN Department of Economic and Social Affairs estimates that between 15% and 55% of DRC’s population could be served at least-cost by the national grid. The remaining population, predominantly in rural areas, would be best served through off-grid solar PV and mini-hydropower.
7. Wind and solar could meet the bulk of South Africa’s energy needs.
Our analysis shows that a combination of solar and wind, paired with a limited amount of gas as standby power, is the most affordable option that will allow South Africa to meet its projected energy demand.
8. Pursuing Inga 3 could be much more expensive for South Africa compared to domestic wind and solar generation.
Only under highly favorable circumstances would including Inga 3 in South Africa’s energy plans be economical. If time and cost overruns, borrowing costs, and transmission losses are factored in, power from Inga 3 would be significantly more expensive than producing low-carbon power domestically.
The DRC and South Africa need reliable energy to power economic development and meet the needs of their citizens – and they have it. Wind and solar power are treasures hidden in plain sight.
Conclusions
Introduction
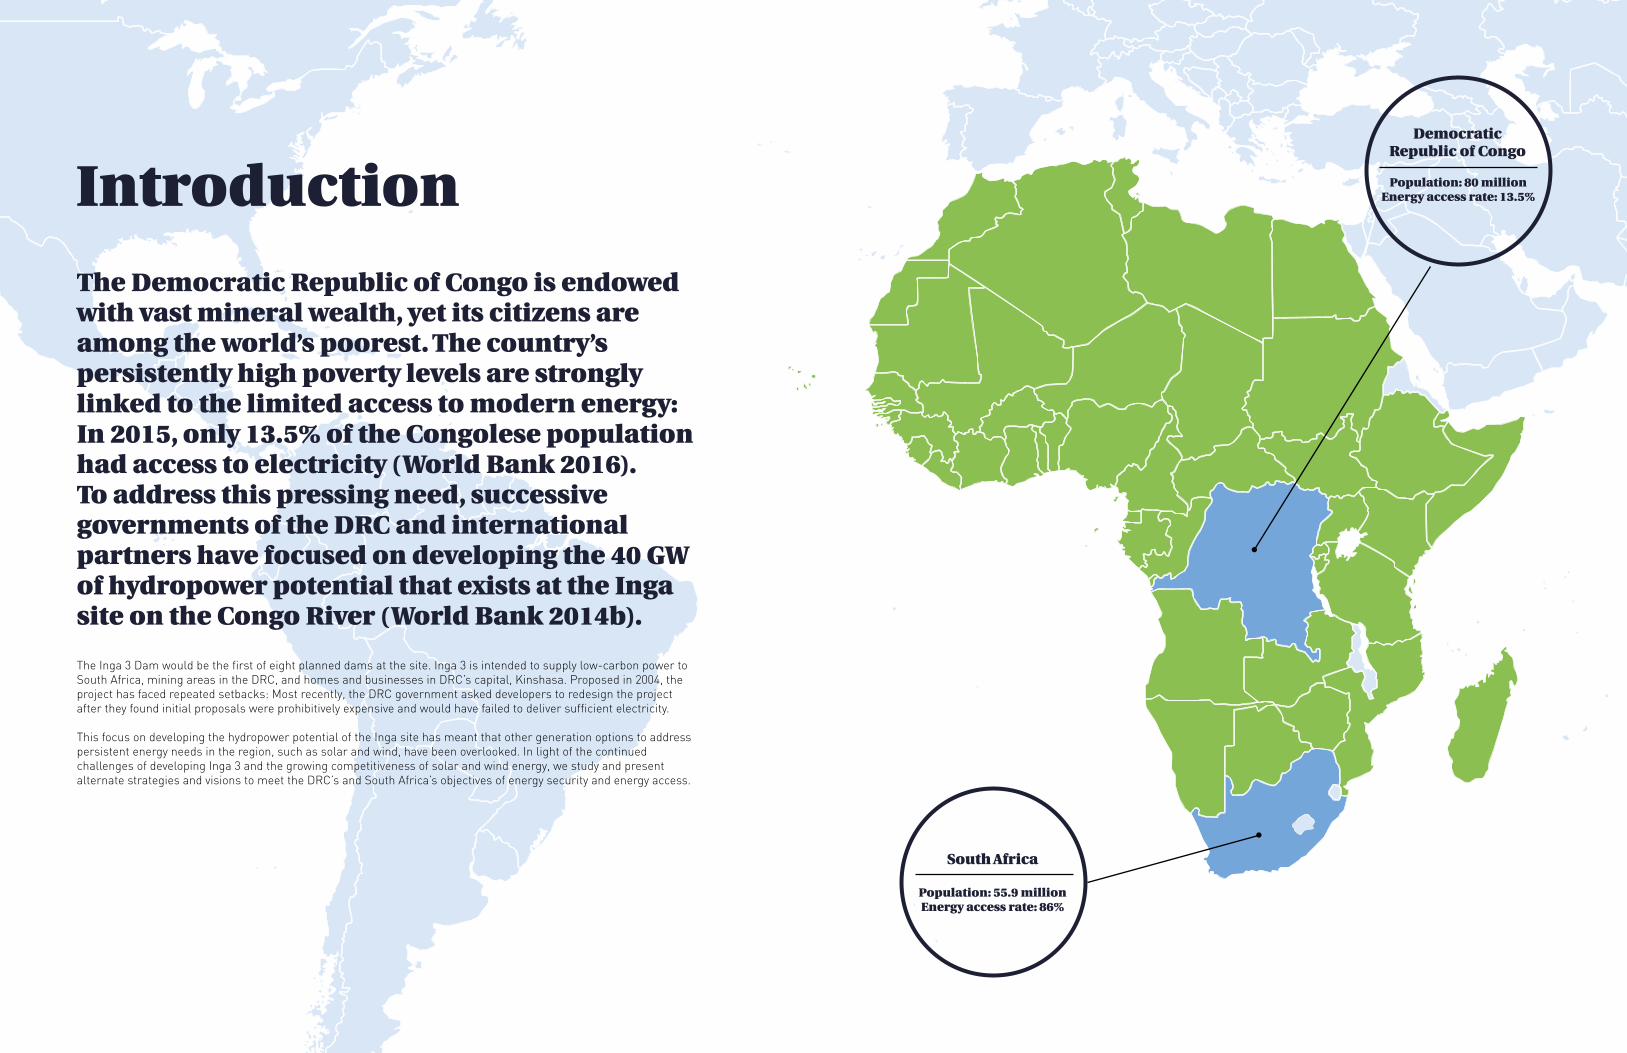
The Democratic Republic of Congo is endowed with vast mineral wealth, yet its citizens are among the world’s poorest. The country’s persistently high poverty levels are strongly linked to the limited access to modern energy: In 2015, only 13.5% of the Congolese population had access to electricity (World Bank 2016). To address this pressing need, successive governments of the DRC and international partners have focused on developing the 40 GW of hydropower potential that exists at the Inga site on the Congo River (World Bank 2014b). The Inga 3 Dam would be the first of eight planned dams at the site. Inga 3 is intended to supply low-carbon power to South Africa, mining areas in the DRC, and homes and businesses in DRC’s capital, Kinshasa. Proposed in 2004, the project has faced repeated setbacks: Most recently, the DRC government asked developers to redesign the project after they found initial proposals were prohibitively expensive and would have failed to deliver sufficient electricity. This focus on developing the hydropower potential of the Inga site has meant that other generation options to address persistent energy needs in the region, such as solar and wind, have been overlooked. In light of the continued challenges of developing Inga 3 and the growing competitiveness of solar and wind energy, we study and present alternate strategies and visions to meet the DRC’s and South Africa’s objectives of energy security and energy access.
Democratic Republic of Congo
Population: 80 million Energy access rate: 13.5%
South Africa
Population: 55.9 million Energy access rate: 86%

Renewable Riches: How Wind and Solar Could Power DRC and South Africa 17
Study Objectives
Key recent developments inform our study and help create realistic alternate scenarios that would meet the dual objectives of fostering a low-carbon energy future for South Africa and solving the DRC’s urgent energy needs.
First, the prices of solar photovoltaic (PV) technologies have significantly declined due to technology innovations and economies of scale, and levelized costs of grid-scale solar PV electricity generation are now lower than new coal generation in countries like India and South Africa (Bischof-Niemz 2015). Second, similar to solar PV, wind generation costs have also declined thanks to technological innovations like larger rotor diameters and higher
hub heights, which enable turbines to capture more wind at lower costs (Wiser and Bolinger 2016). Third, innovations in power systems and electricity markets are enabling cost-effective management of the variability associated with wind and solar generation. Fourth, cost reductions in lighting technologies and efficiency improvements in appliances are making energy access possible with low energy requirements per household. Innovations in technology, business models, and financing are meanwhile transforming the decentralized off-grid solutions market and enabling the provision of electricity access (Alstone, Gershenson, and Kammen 2015).
We analyze and present alternate strategies in two parts that address
the following three major goals of the Inga 3: providing low-carbon electricity to South Africa, mines in Katanga Province, and residential and commercial customers in the Kinshasa region. First, we estimate wind and solar PV resources across the DRC, quantify the costs of developing these resources, and discuss strategies to harness them. We quantify and characterize wind and solar PV resources within mining-permitted areas as well as those that are close to existing and planned transmission lines. Second, we develop least-cost electricity expansion and investment plans for South Africa up to the year 2035 to examine whether Inga 3 would be a cost-effective investment from South Africa’s perspective.
CONGO RIVER
Boosting electricity access in the DRC

Renewable Riches: How Wind and Solar Could Power DRC and South Africa 19
2.1 Estimating wind and solar PV resource potential in the DRC
Using the Multi-criteria Analysis and Planning for Renewable Energy (MapRE) methodology and a previous study that examined the potential for grid-based solar PV and wind integration in the region (Wu et al. 2015), we conducted a reanalysis of wind and solar PV potential in the DRC using additional and more accurate solar radiation, land cover and land use, conservation, transmission, and road infrastructure datasets (see Table 1 in Appendix A).
2.1.1 Datasets used for analysis
For solar radiation, we used a recently released global dataset of solar PV electricity output potential from Solargis and made publicly available by the World Bank Group in 2017. We assessed wind potential based on Vaisala’s wind speed datasets published in the International Renewable Energy Agency’s (IRENA) Global Atlas. For transmission
1 Levelized cost of electricity (LCOE) is a metric that describes the average cost of generating electricity at the point of connection to the electricity grid for every unit of electricity generated over the lifetime of a project. It includes the initial capital and discount rate, as well as the costs of continuous operation, fuel and maintenance.2 See Table 1 in Appendix A for the specific thresholds applied to each criteria and dataset. Suitable area criteria are specific to the energy technology.
infrastructure, we combined two datasets made available by the Africa Infrastructure Country Diagnosis (AICD) and the DRC’s national electricity company, Société Nationale d’Électricité (SNEL). The road dataset used was produced by the Inventory and Forest Management Department in the DRC. To exclude conservation sites and important biodiversity areas, we used the following datasets: the World Protected Areas Database, protected areas in the Forest Atlas of the DRC, intact forest landscapes from the Global Forest Watch, and intact high conservation value areas from the World Resources Institute. Importantly, since land use and land cover (LULC) can be a significant constraint in solar PV and wind siting, we excluded forested and agricultural areas using the LULC dataset developed by the European Space Agency (ESA), which is the most recent publicly available such dataset for the DRC.
2.1.2 Quantifying the availability and average costs of solar PV and wind sites
Using the MapRE renewable energy zoning tools, we identified potential project areas and estimated each
area’s levelized cost of electricity.1 To identify suitable areas for solar and wind development, we combined spatial data based on technical (e.g., maximum slope, minimum insolation), social (e.g., maximum population density of 100 persons per sq km, no development on farmland), and environmental requirements (away from protected areas, non-forest land).2 We then divided the suitable areas into potential project areas no greater than 25 km2.
Using the most recent available technology cost assumptions from South Africa and previously estimated capacity factors (Wu, Deshmukh et al. 2015), we estimated the amount of potential generation capacity and the average levelized cost of electricity for each potential project area. We used a 10% discount rate (compared to 8% in South Africa) to reflect the high cost of capital in the DRC. However, we used South Africa’s values for capital costs of wind and solar power plants since solar panels and wind turbines are globally traded commodities.
To account for unforeseeable siting barriers for which high resolution and typically unavailable data would be required for accurate modeling, such
2. Harnessing the DRC’s Renewable Energy Potential

20 Renewable Riches: How Wind and Solar Could Power DRC and South Africa
as sensitive biodiversity, displacement of communities, and land ownership challenges, we discount the amount of potential installed capacity in each potential project area by 75% for wind and 90% for solar PV, so actual wind and solar PV potential may in fact be much higher. For a complete description of the calculations and cost inputs, see Appendix A.
To quantify the amount of wind and solar PV potential that could feed into the grid, we limited potential sites to areas within 25 km of existing or planned transmission infrastructure. To examine the potential for renewable resources to meet the energy needs of the mining industry, we relaxed the land use and land cover constraints
and quantified the amount of potential existing within areas with active mining exploration and exploitation permits.
2.2 Findings2.2.1 Wind and solar PV resource potential and average costs
We assessed the potential and cost of wind and solar PV resources within 25 km of existing or planned transmission corridors since these would be best placed to deliver utility-scale and grid-connected generation resources.
Siting wind and solar power plants close to existing transmission
infrastructure not only reduces the resources’ overall costs of generation, but also reduces planning barriers and risks associated with project development. Additionally, electricity from grid-connected wind and solar PV plants on the central national network can be delivered to customers in Kinshasa and other urban centers or to the mines in Katanga, with some transmission losses, regardless of where they are sited.
Within 25 km of existing and planned transmission lines, we identified 82 GW of potential solar PV capacity, of which approximately 1 GW is estimated to have total LCOE less than $0.06 per kWh, nearly 60 GW with total LCOE less than $0.07 per kWh, and nearly
FIGURE 1: All solar PV potential project areas. (a) All potential solar PV project areas are colored using each project area’s total levelized cost of electricity (LCOE). (b) Project areas within 25 km of existing transmission lines. (c) Project areas within 25 km of existing and planned transmission lines. Land use land cover categories shown in figure based on Scenario E1 (see Table 2). See Table 1 in Appendix A for data sources.
FIGURE 2: Wind potential project areas. (a) All potential wind project areas are colored using each project area’s total levelized cost of electricity (LCOE). (b) Project areas within 25 km of existing transmission lines. (c) Project areas within 25 km of existing and planned transmission lines. Land use land cover categories shown in figure based on Scenario E3 (see Table 2). See Table 1 in Appendix A for data sources.
Wind potential and average costs in the DRCSolar PV potential and average costs in the DRC
all potential with LCOE less than $0.08 per kWh (fig. 1c). When considering potential only within existing transmission lines, the total potential remains vast (62 GW; fig. 1b).
The majority of the lowest-cost potential project locations for solar PV are located in the eastern and southeastern parts of the DRC, particularly in Katanga province (fig. 1a). However, we identified 6.6 GW of potential solar PV projects about 100 km southwest of Kinshasa with an average total LCOE of $0.07 per kWh. These promising potential projects lie along the transmission corridor and highway connecting Kinshasa and the border town of Matadi near the western tip of DRC.
In total, the solar potential within 25 km of existing and planned transmission infrastructure vastly exceeds the total capacity of the Inga 3. When the high-voltage DC (HVDC) transmission delivering electricity from Inga 1 and 2 to Kolwezi is removed from consideration, as new projects cannot be interconnected on a DC line, the potential around 25 km of remaining transmission lines reduces by only 2 to 3 GW. Since the potential installed capacity per unit area of land has been heavily discounted by 90% and 75% for solar PV and wind technologies, respectively, to account for uncertainties in assumptions about siting barriers or lack of spatial data, some areas may have even greater potential for renewable energy development.
We find that across different land use cover scenarios, the potential capacity for wind energy within 25 km of existing transmission lines is 11 - 12 GW (fig. 2b) and existing and planned transmission lines is 17 - 34 GW (fig. 2c). Of the latter potential, there is 0.64 - 2.3 GW of wind potential estimated to have total levelized cost of electricity less than $0.07 per kWh and 1.0 - 4.9 GW of wind potential less than $0.08 per kWh, depending on the land cover categories excluded from development. When the high-voltage DC (HVDC) transmission delivering electricity from Inga 1 and 2 to Kolwezi is removed from consideration, the potential around 25 km of remaining transmission lines reduces by less than 500 MW. Similar to solar potential, most of the high-quality wind potential is
Renewable Wealth: How Wind and Solar Could Power DRC and South Africa 21
(a) (a)
(b) (b)
(c) (c)

Renewable Riches: How Wind and Solar Could Power DRC and South Africa 2322 Renewable Riches: How Wind and Solar Could Power DRC and South Africa
located along the eastern border of the DRC, with several scattered potential project areas in the large southeastern Katanga Province (fig. 2a).
2.2.2 Wind and solar PV resource potential and average costs within mining areas
To assess the potential for wind and solar PV to meet the energy needs of the mining industry, we identified wind and solar potential within areas with existing or potential mining activity. Removing the land use and land cover constraint, we identified potential solar PV project areas within areas with active permits for mining exploration and exploitation.
We find that approximately 10% of such areas have wind potential with generation LCOE less than $.15 per kWh and 52% percent have solar PV potential generation LCOE less than $.07 per kWh (fig. 3). Solar PV costs in particular compare favorably against the World Bank’s estimate of $.12 per kWh that mining companies currently pay to generate their own power (World Bank, 2014b).
Generation LCOEs reported do not include transmission or road costs, since electricity is expected to be generated and consumed locally. The total potential installed capacity within mining areas amounts to more than 130 GW of wind power and 2400 GW of solar PV power (figs. 3c and 3d).
Abundant solar PV potential exists in the most active mining area in the DRC, the southeastern province of Katanga. Further research can identify specific sites that can be developed appropriately to provide cost-competitive solar power to the mining industry.
Wind and solar PV potential and average costs in mining-permitted areas in the DRC
Figure 3: Wind and solar PV potential project areas within areas with active mining permits for exploitation and exploration. Grey areas show mining-permitted areas without suitable sites for ground-mounted wind or solar power.

Renewable Riches: How Wind and Solar Could Power DRC and South Africa 25
3.1 Optimizing electricity generation capacity investments for South Africa
In 2016, the share of coal in South Africa’s electricity mix was 70% by capacity and 81% by energy generation (Department of Energy 2016). At the same time, South Africa’s Renewable Energy Independent Power Producer Procurement Programme (REIPPPP) enabled capturing the falling costs of wind and solar PV, resulting in approximately 1,500 MW of installed wind and solar PV capacity each at the end of 2016.
With large amounts of high-quality resources (several times that of expected future demand for electricity) (Wu et al. 2015), both wind and solar have the potential to be cost-effective options in South Africa’s future electricity mix. While South Africa’s Integrated Resource Plan (draft of 2016) considers multiple sources of electricity generation to meet future demand, the plan assumes as given that the country’s 2,500 MW share of Inga 3 will come online by 2033.
We used the GridPath grid analytics platform to develop electricity generation capacity expansion and investment plans for South Africa up to the year 2035 to meet projected energy demand. Integrating higher levels of variable renewable energy sources into the electricity grid increases the need
for long-term planning models that incorporate high temporal resolution system operational dynamics and constraints. We used the GridPath model because it includes a detailed treatment of system operations into a long-term investment framework, enabling a more accurate view of the integration costs of wind and solar. In addition, GridPath’s modular architecture and flexible temporal and spatial resolution allows for easy application to different regions and systems with different requirements.
The GridPath model co-optimizes investment in new grid infrastructure and dispatch of grid assets to determine the least-cost portfolio for meeting various system requirements (e.g. load, reserves, planning reserve margin, policy targets, etc.). GridPath can utilize high-resolution temporal and spatial data in order to account for the temporal and spatial variability in demand as well as wind, solar and hydro resource availability, a key requirement for simulating future electricity plans. By considering both capital expenditures and variable costs, GridPath enables the identification of cost-effective deployment of conventional and renewable generation as well as storage, transmission lines and demand response (although no transmission constraints or build-outs were considered in this study due to lack of data). A brief description of the model and inputs is below. For a detailed description and assumptions of the South Africa GridPath model, see Appendix B.
We simulated South Africa’s electricity system as a single node (i.e. ignoring transmission constraints) due to lack of data and uncertainty in future transmission expansion. We modeled four investment periods – 2020, 2025, 2030, and 2035 – each represented by 12 days, one for each month, with each day weighted by the number of days per month to represent a full year. Operations on each day are modeled on an hourly resolution. For each investment period, the model calculates the new generation capacity mix (both conventional technologies like coal and gas, and renewable resources like wind and solar) to meet future demand with the lowest capital and operations costs.
3.1.1 Demand and conventional generation assumptions
We used the average load forecast temporal profiles by month and hour based on the average 2012 load profile linearly scaled for each year until 2050 using the 2016 IRP “High Growth Less Energy Intensive” annual demand forecast.
We drew assumptions for existing and planned generation capacity and operating parameters from South Africa’s 2016 draft IRP report (Department of Energy 2016). For the additional capacity needed to meet South Africa’s demand through 2035, we provided several types of generation technologies as candidate resources for the model to choose from, based on overall least-cost (capital and
3. Meeting South Africa’s Low-Carbon Energy Needs

Renewable Riches: How Wind and Solar Could Power DRC and South Africa 2726 Renewable Riches: How Wind and Solar Could Power DRC and South Africa
3.2 Findings
3.2.1 Least-cost electricity generation mix for South Africa with and without Inga 3
According to the IRP study, Inga 3 is fully built in 2033. Therefore, in our scenarios with Inga 3, we assume the dam is built in the last of the four investment periods (2033-2050) in our model.6 The CSIR study also assumes 43,547 MW of existing and planned generation
6 Note that the last investment period (2033-2050) represents the year 2035. The end year of 2050 is chosen to avoid “boundary effects.” See Appendix B for more details.
capacity in 2035. We assume this capacity as fixed across all scenarios and then build additional capacity to meet demand in all representative hours of the investment period while minimizing costs (annualized capital costs of additional new capacity and total variable costs). We simulate multiple sensitivity scenarios to test different assumptions on resource availability and performance – three annual capacity factor levels for Inga 3 (when including Inga 3 in the generation mix), and simulated versus adjusted wind and solar data.The installed generation capacity mix
for all scenarios is shown in Figure 4. All additional new capacity above 43,547 MW is built by GridPath by minimizing new investment capital costs and overall variable costs. In our analysis of least-cost system build-out through 2035, all new investments are in wind, solar PV and natural gas (combined cycle and open cycle) in all scenarios with and without Inga 3. No new coal plants are built.
Imports from Inga 3 into South Africa are expected to avoid investments in coal-based generation. However, results show that none of the scenarios
operations costs) and subject to operating constraints (e.g. minimum generation levels, maximum monthly energy budgets for hydro). These technologies include coal, natural gas, wind, solar PV and battery storage.
3.1.2 Wind and solar assumptions
While other generation sources such as coal, gas and hydro can be dispatched by the system operator, wind and solar generation are weather dependent. Wind and solar generation vary across both time and space (geography). To incorporate this variation in our simulations of South Africa’s future electricity system, we used hourly wind speed data at 80 m hub height for 2012 (the same year as load data to maintain any potential correlation due to weather effects) simulated by Vaisala Inc. (formerly 3Tier Inc.) for 25 different locations.3 We then converted the wind speeds to wind power generation capacity factors using turbine power curves.4
For solar PV, we used the PVSyst software to simulate hourly solar generation capacity factors for six locations using solar radiation data from the Meteonorm 7.1 database (PVsyst). For both technologies, we estimated potential capacity associated with each temporal profile based on the results from Wu et al. 2015 and Wu et al. 2017. The potential capacity is the upper limit on how much new capacity for wind and solar PV can be built by the model. Solar-PV-suitable areas were restricted to the Renewable Energy Development Zones identified by the South Africa Council for Scientific and Industrial Research (Department of Environmental Affairs and Council for Scientific and Industrial Research 2014).
Our simulated annual capacity factors differ from reported data for wind and solar generation for 2016 (National Energy Regulator of South Africa 2016).
3 Wind turbines with 100 m and 120 m are expected to be the norm in the future. Wind turbines with 80 m hub heights is a conservative assumption, and capacity factors of future turbines are likely to be higher than assumed in this study.4 Capacity factor is the ratio of actual generation and the rated capacity of a power plant.5 Existing projects mostly have 80 m and above hub heights, and are not likely to face lower wind speeds due to lower hub heights.
Actual monitored annual wind capacity factors of South Africa’s existing fleet are about 25% lower than our simulated wind capacity factors. This is likely because we chose sites with the best resources for procuring simulated wind speed time series data from Vaisala, but existing projects may have been built in places with other favorable criteria such as land availability and transmission interconnections that are not captured in our analysis.5
Unlike wind, solar-PV-monitored capacity factors are about 20% higher than our simulated data. This is likely because the PYSyst and Meteonorm data are based on cities or urban areas that are likely to have lower solar radiation (due to geography and air pollution) than the existing solar PV plants located in rural high-solar radiation areas. To account for potential errors in simulated data, we ran sensitivity scenarios with linearly-scaled 25% lower capacity factors for wind and 20% higher capacity factors for solar PV.
Capital cost assumptions for wind and solar PV in the CSIR study are lower than the IRP study by 33% and 46%, respectively. The rate of annual cost reductions also varies. The CSIR cost assumptions are more realistic because they are based on the 2016 realized costs in the Bidding Window 4 of the REIPPPP auction (Wright et al. 2017). In this study, we use the CSIR cost assumptions for wind and solar PV.
3.1.3 Hydropower assumptions
Data on hydropower availability and the annual distribution of hydropower energy availability were limited. For the existing hydro fleet, we used annual capacity factors based on data from CSIR (around 80% in 2020 and 2025, and around 70% in 2030 and 2035) (Wright et al. 2017), and assumed the same capacity factors for each month to determine the monthly available energy.
For Inga 3, we assumed a capacity factor of 70% and also ran sensitivity analyses with capacity factors of 60% and 80%. We also included sensitivity analyses for intra-annual variation in hydropower availability from Inga 3, using precipitation patterns for the Congo Basin to derive an annual distribution of available hydropower for Inga 3. In our model, we allowed the hydropower plants to dispatch power subject to their monthly energy, maximum rated power, and minimum generation level constraints.
3.1.4 Scenarios
For each case (a set of the sensitivity assumptions described above), we ran two scenarios – one with Inga 3 and one without. Based on the IRP study, we assumed Inga 3 comes online in 2030, with 1000 MW available in 2030, and is fully available – 2500 MW deployed – by 2033.
For scenarios with Inga 3, we included the hydropower project in the generation mix, and for scenarios without Inga 3, we leave the project out of the generation mix. We then compared the additional new generation capacity mixes (past 2016) and estimated the differences between the additional investment costs and overall operational costs for each combination of with- and without-Inga 3 scenarios. As described above, our scenarios include sensitivity analyses of annualized capital costs for Inga 3, including the World Bank and CSIR estimates, a range of capacity factors for Inga 3 (60%, 70%, 80%), and adjustments to modeled capacity factors for future wind and solar PV generation based on existing fleet output data. We also test for sensitivity to potential cost overruns for the Inga 3 project.
Figure 4: New generation capacity is chosen by the least-cost optimization model, Gridpath. Annual capacity factors for Inga 3 are varied from 60% to 80%. Capacity factors for wind are adjusted 25% down and solar PV 20% up to be similar to existing power plant generation in South Africa.
Least-Cost New Capacity Investments for South Africa with and without Inga 3, 2035
Inga III Solar PV Wind Natural Gas - Open Cycle Natural Gas - Closed Cycle
25,000
30,000
20,000
15,000
10,000
5000
0
60% Inga Capacity
70% Inga Capacity
80% Inga Capacity
No Inga60% Inga Capacity
70% Inga Capacity
80% Inga Capacity
No Inga
Simulated RE Capacity Adjusted RE Capacity
Ne
w I
nst
all
ed
Ca
pa
city
(MW
)

Renewable Riches: How Wind and Solar Could Power DRC and South Africa 2928 Renewable Riches: How Wind and Solar Could Power DRC and South Africa
without Inga 3 lead to any new build-out of coal capacity in South Africa. All Inga 3 capacity is replaced by a combination of wind, solar PV and natural gas capacity. South Africa does not have natural gas resources and imports expensive liquefied natural gas (LNG) (Department of Energy 2016). Despite high gas prices (adopted from the IRP 2016 study), investments in natural gas plants are justified because of their low capacity factors (lower variable costs and fuel consumption), lower capital costs than coal, and flexibility (ability to quickly ramp up and down, and go down to a lower minimum generation level without shutting down) to balance wind and solar variability. These plants are expected to be used during a relatively small number of hours in the year when solar PV and wind are unable to meet demand. A future without Inga 3 generation for South Africa may not include additional greenhouse gas emissions due to coal, but emissions due to gas generation are likely to see a modest increase.7
3.2.2 Expected costs or savings of including Inga 3 in South Africa’s electricity future
To evaluate the economic benefits or costs of Inga 3 to the overall South African power system, we compare annual costs (which include annualized capital costs of additional new capacity and total variable costs) from the 2035 investment period of South Africa’s future electricity system with and without Inga 3.
We use two different capital cost estimates for Inga 3 - the World Bank and NEPAD estimate of $14 billion and CSIR’s estimate of $16.6 billion.8 We assumed South Africa’s share would be 53% of the total capital cost of Inga 3, proportionate to its allocated energy generation, and that South Africa will pay its share of Inga 3 costs every
7 The Inga 3 Dam may replace some existing coal generation, but determining this is beyond the scope of this study.8 CSIR’s estimate was provided in ZAR, which we converted to USD using a June 2016 exchange rate of USD $1 = ZAR 13.01 (Wright et al. 2017).9 Our low estimates of the levelized cost of generation from Inga 3 do not include transmission losses. Including return on equity, interest on debt, and interest accrued during construction is likely to increase the cost of generation.
year (annualized capital costs and annual variable costs), regardless of changes in Inga 3’s annual capacity factor. This assumption allows us to compare investment in Inga 3 with other electricity generation options for South Africa using the same discount rate. Figure 5 shows the difference in annual system costs between each combination of scenarios with and without Inga 3.
As expected, as annual capacity factors for Inga 3 decrease (from 80% to 60%), overall costs increase due to additional required investments and energy generation to meet demand. Adjusting our simulated capacity factors for wind 25% down and solar PV 20% up (so they are similar to existing power plant generation in South Africa) increases overall costs for all scenarios mainly because the capacity factors of wind, which dominates additional new capacity, are scaled downward, thus increasing the need for additional conventional generation capacity.
However, these cost increases (compared to scenarios where wind and solar PV capacity factors were not adjusted) are greater for scenarios without Inga 3 because of greater new wind installed capacities compared to those in scenarios with Inga 3. Note that adjustment to our simulated capacity factors for wind and solar PV is a conservative assumption. In reality, wind capacity factors are increasing at a faster rate than installed costs as project developers install turbines with higher hub heights and larger rotor diameters to harness more and faster wind resources (Wiser et al. 2016).
Only one of the 12 scenarios results in lower overall system costs if Inga 3 is built: When annual capacity factors of Inga 3 are at least 70%, the renewable energy capacity factors are adjusted (scaled down for wind and scaled up for solar), and World Bank-estimated
capital costs are assumed. Assuming World Bank-estimated capital costs, the difference between the overall costs of scenarios with and without Inga 3 ranges from $220 million to -$28 million annually in 2035. However, if we assume CSIR capital costs for Inga 3, all scenarios with Inga 3 are more expensive than those without the dam, with differences ranging from $330 million to $85 million annually in 2035.
In our analysis, we estimate the costs for South Africa assuming that the country will bear a share proportionate to its allocated energy generation. However, the costs incurred by South Africa depend on the electricity rate charged by the DRC. The World Bank, in its project appraisal of Inga 3, had assumed a cost of $0.07 per kWh for South Africa based on the long run average incremental cost of electricity in the SAPP region (at the time of the study) (World Bank 2014b).
South Africa may have to also bear the cost of transmission from DRC to its own border, in addition to paying a per kWh price for Inga 3’s electricity. We did not include the cost of transmission that South Africa is expected to bear because of uncertainty in the cost estimate. Our estimates for Inga 3’s costs to South Africa are hence conservative. For all our assumptions (World Bank and CSIR capital costs, capacity factors from 60-80%, and a discount rate of 8%), the levelized cost of generation from Inga 3 ranges from $0.04 to $0.06 per kWh. The higher rate of $0.07 per kWh would make Inga 3 less attractive as an investment option from South Africa’s perspective.9
3.2.3 Estimating the cost implications of Inga 3’s potential cost overruns
Two recent empirical studies show that large hydropower projects experience systematic cost overruns. The first study (sample size of 245) showed
Figure 5: Twelve scenarios run with the following variables: Inga 3 cost estimate (CSIR $16.6 billion vs. World Bank $14 billion), solar PV and wind energy performance (simulated vs. adjusted), and capacity factor of Inga 3 (60%, 70%, 80%)
11 of 12 scenarios show South Africa can meet its energy needs more cheaply without Inga 3
World Bank CSIR
400
300
200
100
0
60% Inga Capacity
60% Inga Capacity
70% Inga Capacity
70% Inga Capacity
80% Inga Capacity
80% Inga Capacity
Simulated RE Capacity Adjusted RE Capacity
An
nu
al C
ost
Sa
vin
gs
Wit
ho
ut
Ing
a 3
(US
D m
illi
on
)
that actual costs of large hydropower projects were on average 96% higher than estimated costs (approximately double), and the median cost overrun was 27% (Ansar et al. 2014). The second study (sample size of 61) showed that 77% of hydropower projects experienced a cost overrun, which was on average 71% of projected project costs (Sovacool, Gilbert, and Nugent 2014a).
To assess the effect of Inga 3’s potential cost overruns on South Africa’s future system costs, we increased the capital
costs of Inga 3 from 0% to 100% (no cost overruns to double the capital costs) in all the scenarios. For the World Bank estimate of $14 billion for capital costs, only a 20% cost overrun makes all scenarios with Inga 3 more expensive than their corresponding scenarios without Inga 3, with differences ranging from $50 to $340 million per year. A 100% cost overrun (i.e. if actual costs were to double that of estimated capital costs), the scenarios with Inga 3 would cost $540 to $830 million per year more than those without Inga 3. These
differences are larger for scenarios that assume the higher CSIR capital costs. Irrespective of whether South Africa or DRC bears these additional costs, cost overrun is a serious risk for the economic viability of Inga 3.

Renewable Riches: How Wind and Solar Could Power DRC and South Africa 31
4.1 Wind and solar can enable energy security and energy access in the DRC
4.1.1 Abundant, low-cost and accessible wind and solar PV potential exist in the DRC
The expected electricity price for Inga 3 is $0.07 to $0.08 per kWh for SNEL customers and South Africa, and would be as high as $0.12 per kWh for mining companies based on their willingness to pay.10 These estimates are based on assumptions of no cost overruns and a capacity factor of 86%, the highest capacity factor estimated to date (World Bank 2014b). We find that wind and solar PV potential within the DRC can be cost-competitive even with this optimistic cost forecast for Inga 3, and they are sufficiently abundant to serve as alternatives to energy supplied by Inga 3. Wind resources are primarily concentrated in the eastern region of the DRC. The range of cost-competitive ($0.08 per kWh) wind power potential (1.5 - 4.9 GW) close to transmission infrastructure is sufficient to largely displace Inga 3’s capacity allocated for domestic use.
Solar PV potential greatly exceeds wind potential in the DRC, with the majority of the lowest-cost solar PV resources near existing transmission lines located in Katanga Province. The lowest-cost potential solar PV project areas are $0.01 per kWh less than Inga 3’s expected LCOE and the amount of potential (>50 GW) with estimated costs less than $0.07 per kWh vastly exceeds the supply from Inga 3. The results of our assessment of solar technical potential in the DRC are aligned with less-detailed evaluations such as the UNDP 2014 DRC Atlas, which found that solar resource potential in the DRC is immense with
10 The electricity price is higher than the levelized cost estimated in the previous sections because of different assumptions of discount rate and internal rate of return
economically favorable insolation ranging from 3.5 - 5.5 kWh/m2/day (ICF 2017). For utility-scale solar PV projects, land cover and land use may prove to be the most constraining siting criteria. Distributed solar PV and smaller-scale systems for mini- and off-grid use are less likely to encounter land use barriers.
4.1.2 Mining energy needs can be locally served by wind and solar resources
The mining sector can meet its energy needs with abundant renewable resources: Over half of all mining-permitted areas have low-cost solar PV potential. Developing power plants close to where the electricity is consumed reduces the need to upgrade long transmission lines and avoids transmission losses. However, wind and solar are variable renewable resources, requiring strategies for managing this variability to match supply and demand. One such strategy is to change operations of the existing hydropower capacity in the DRC to balance and smooth out variations in supply from wind and solar PV. Another way to reduce variability is to balance production of wind and solar power, as their generation profiles are often complementary. Yet another planning strategy for managing variability is selecting wind, and to a lesser extent, solar PV power plant locations to exploit spatial diversity in solar and wind regimes such that their generation profiles complement each other and better match demand profiles.
4.1.3 Strategies for managing wind and solar PV variability
Although wind and solar PV costs are falling, system operators and policymakers have concerns about the variability and uncertainty of wind and solar generation. However, the share of variable renewable energy generation is more than 10% in several countries
(Renewable Energy Policy Network for the 21st Century 2015), with instantaneous penetration crossing 50% in some countries. The power systems operations in many of these countries and regions have evolved to incorporate faster (sub-hourly) scheduling and dispatch of generators closer to real time.
These important operational changes enable systems to respond to variability of not only demand, but also wind and solar generation (Cochran et al., 2012). Integrating advanced forecasting techniques in system operations helps predict the amount of renewable energy available to the system (Cochran et al., 2012). Frequent scheduling closer to actual dispatch also means that renewable energy generation and demand forecasts will be more accurate, reducing scheduling errors and the need for idle, reserve capacity. Such improved operational strategies could enable DRC’s future electricity system to integrate large shares of wind and solar and generally reduce system-wide costs.
As variability in net demand (demand minus wind and solar generation) increases with higher shares of wind and solar electricity, flexible generation plants that can ramp up and down quickly, have quick start capabilities, and can operate at low minimum generation levels will be more valuable. Flexible hydropower plants already dominate the DRC’s electricity generation fleet. The DRC can rapidly scale up wind and solar generation and yet balance the added variability of net demand by harnessing the flexibility of its hydropower plants.
Several studies and experiences make a strong case for the need to develop grid interconnections between countries and regions to successfully and cost-effectively integrate high shares of variable renewable energy resources such as wind and solar (Africa: Wu et al. 2017; the United
4. Conclusions

Renewable Riches: How Wind and Solar Could Power DRC and South Africa 3332 Renewable Riches: How Wind and Solar Could Power DRC and South Africa
4.2.2 Lead time for construction of Inga 3 could increase costs by 50% or more
The amount of time needed to build a given type of power plant varies by technology. Projects with longer lead times increase financing costs. Each year of construction represents a year of additional interest charges before the plant is placed in service and starts generating revenue (U.S. Energy Information Administration 2016). Large hydropower projects take years to build and incur interest costs during construction. CSIR estimated the costs of Inga 3 to be 48% greater if the interest costs accrued during eight years of construction are included.11 The cost for the entire Inga 3 project would then rise to $24.6 billion, using the 8% discount rate as interest rate. This would result in an annual payment of $1.1 billion per year for South Africa’s share, 48% greater than annualized payments estimated using overnight capital costs (costs that do not include interest during construction). In contrast, wind projects can take one to three years and most solar PV projects a year to construct, and hence incur significantly lower additional costs due to interest accrued during construction.Empirical studies show that hydropower projects are also much more likely to experience time overruns compared to wind and solar projects (Ansar et al. 2014, Sovacool, Gilbert, and Nugent 2014a). In Sovacool, Gilbert, and Nugent’s sample, hydropower projects had an average time overrun of 1.8 years, whereas wind projects ran behind schedule by less than a month on average. The average time overrun of solar PV projects was negative, meaning projects were completed earlier than expected (Sovacool, Gilbert, and Nugent 2014a). In Ansar et al.’s (2014) sample, actual implementation
11 CSIR assumed 8 years of construction for Inga 3 and the following spread of capital costs across these years - 20%, 25%, 25%, 10%, 5%, 5%, 5%, 5%12 Authors' estimation using geospatial analysis13 The Siemens 800 kV HVDC transmission line is advertised to expect losses of 2.6% over 800 km while transmitting 2500 MW(Siemens 2012). Losses scale linearly with distance.14 Results of a 2016 expert elicitation survey of 163 of the world’s foremost wind experts showed that experts anticipate 24-30% reductions in wind power costs (Wiser et al. 2016).15 The International Renewable Energy Agency (IRENA) projected global weighted average cost of electricity generation to fall by 59% for solar PV, 26% for onshore wind, and 35% for offshore wind by 2025 compared to 2015 costs (IRENA 2016).
schedule of hydropower projects was on an average 2.3 years higher than estimated, with a median of 1.7 years (Ansar et al. 2014). These studies suggest that implementation schedules of hydropower projects are systematically underestimated. If Inga 3 experiences schedule slippage, its costs will also increase because cost escalation is strongly correlated to construction time overruns.
4.2.3 Transmission losses could increase costs for South Africa by an additional 5-10%
The transmission line from Inga 3 to South Africa will cross multiple countries. The length of the transmission line from the Inga site to Kolwezi on the DRC-Zambia border is 1850 km (USAID 2015). Further, the length of the transmission corridor from Kolwezi to the South African border, passing through Zambia, Zimbabwe, and Botswana, is approximately 1500 km.12 Assuming an 800 kV high voltage direct current (HVDC) line (long distance transmission technology with the lowest losses), the transmission losses from Inga 3 to Kolwezi are expected to be at least 5%, and losses from Kolwezi to the South African border are expected to be an additional 5%13 If South Africa is to expect 2500 MW of supply at its border, it may need to bear the cost of 2800 MW or 58% of Inga 3. Lower voltage or alternating current (AC) transmission lines will only increase these losses. Connecting dispersed wind and solar PV plants also lead to transmission losses, but because these resources are located within South Africa, these losses are expected to be much smaller. Further, wind and solar PV plants that are closer to existing or planned high voltage transmission infrastructure can be prioritized to minimize transmission losses and
reduce risks to project developers (Wu et al. 2017). The inclusion of transmission losses in South Africa’s share of Inga 3 costs will make wind, solar PV, and gas generation options even more attractive.
4.2.4 Wind and solar PV technologies are rapidly advancing and costs will continue to fall
Although we downward-adjusted the simulated wind resource capacity factors to match those of the present fleet in order to understand the impact on results, future capacity factors for wind are expected to be higher because of the adoption of higher hub heights and larger rotor diameters that will enable wind turbines to capture more of the wind resource (Wiser and Bolinger 2016). At the same time, costs of wind turbines (per unit capacity) are likely to continue to fall in spite of the increases in turbine hub heights and rotor diameters (Wiser et al. 2016).14
Solar PV generation costs are also likely to decrease, making investments in solar capacity more attractive (IRENA 2016).15 Wind and solar may be further incentivized by carbon policy, which we did not include in this study. Finally, battery storage costs are also decreasing rapidly with technology advancements and economies of scale, which will enable the cost-effective integration of wind and solar generation. Lower solar and wind costs, higher future capacity factors for wind with higher hub height turbines, and lower battery storage costs will make alternative strategies to the Inga 3 project more attractive.
States: Corporation 2011, Energy 2010; the European Union: Schaber et al. 2012, Wind 2009). Interconnections reduce the system-wide variability of renewable energy generation, especially for wind, by enabling access to geographically diverse resources. Further, they enlarge the electricity grid balancing areas to enable sharing of conventional generation resources for balancing the net demand variability and maintain grid reliability (Cochran et al. 2012). The DRC’s unique geographical location can enable it to have strong interconnections with the Central African, Southern African and East African power pools, and share generation resources.
4.1.4 Decentralized alternatives are necessary for expanding electricity access in the DRC
While this study identified and compared alternative ways to meet grid-based energy needs, this would hardly address the large gap in the needs of more than 90% of DRC residents who lack access to electricity. In order to achieve universal electricity access, electricity planners and financiers will have to do much more than invest in large-scale generation projects.
The dominant strategy to provide electricity access is to extend the grid. However, the often sparse population in sub-Saharan Africa makes grid extension and individual connections prohibitively expensive (Morrissey 2017). Recent electrification studies for Sub-Saharan Africa agree that only a limited fraction of electrification targets should be met via central grid-extension in the DRC (Szabó et al. 2016; Mentis et al. 2016).
The DRC energy access model of the United Nations Department of Economic and Social Affairs suggests that under least-cost electrification, 15% to 55% of the population should receive electricity via the national grid (Mentis et al. 2016). This range spans assumptions about household energy requirements, grid electricity costs, and
diesel price. The remaining population would be cost-effectively served with mini-grid or standalone diesel or PV systems, or mini-hydro. Szabó et al. (2016) find that distributed PV systems and mini-hydro are the dominant cost-competitive alternatives to grid connection in the DRC, and that PV systems added to pre-existing diesel mini-grids can cut the costs of new PV installations by 30-50%. Mini-hydro potential is particularly abundant in the DRC, with some models estimating 2 to 3 GW of potential (Mentis et al. 2016). Thus, grid extension and central electricity generation solutions are inadequate for realizing universal energy access goals in the DRC.
The wind and solar PV potential projects identified in this study meet utility-scale and grid-connection design criteria, which can help increase reliability for existing customers by increasing the electricity supply. By pursuing quickly-constructed generation technologies like wind and solar PV and selecting sites close to the existing grid (which address key barriers to utility-scale electricity generation expansion), electricity planners can address unserved energy needs sooner and at a lower cost.
While optimized for central generation, the vast solar and wind resource areas identified can also be appropriate locations for distributed generation systems. However, studies like Mentis et al. (2017) have combined the datasets used in this present study (e.g., population density, solar radiation, transmission lines) with approaches that address energy access research questions by identifying the cost effectiveness of distributed versus centralized strategies, stand-alone (i.e., solar home systems) versus minigrid systems, and most suitable technology (e.g., solar, wind, diesel, micro-hydro, diesel) for any community in the country.
4.2 Sensitivity analyses show high economic risk of Inga 3 for South Africa
4.2.1 Wind, solar PV and natural gas are more cost effective than Inga 3
Our study examined the effects of five key assumptions on the economic competitiveness of Inga 3 in South Africa’s future energy supply. Only a combination of the most conservative assumptions – the lower World Bank capital cost estimate of $14 billion for Inga 3, the highest annual capacity factors for Inga 3 (80%), low capacity factors for potential wind power in South Africa (similar to existing wind power plants), and no overrun in Inga 3 costs – lead to an outcome that is economically advantageous for South Africa to procure Inga 3 electricity. In all other cases, Inga 3’s alternative – a mix of wind, solar PV, and natural gas – is more cost effective. CSIR’s own assumptions about the capital costs of Inga 3 deem it uneconomic for South Africa across all other assumptions.
The most conservative set of assumptions represent a highly optimistic view of hydropower development in the DRC, given that the past Inga projects have fallen far short of their expected production targets (approximately 50% capacity factor according to World Bank, 2014b) and experienced long delays and large cost overruns, a trend that continued even into their repair and rehabilitation projects. The cost differences reported do not account for other likely sources of economic risk such as transmission losses, which could increase costs by an additional 10%, or the environmental and social costs of developing the Inga site, which include impacts on coastal fisheries and ecosystems and a large resettlement footprint.

Renewable Riches: How Wind and Solar Could Power DRC and South Africa 35
Africon. 2008. Africa Infrastructure Country Diagnostic: Unit Costs of Infrastructure Projects in Sub-saharan Africa. Technical report.
Alstone, Peter, Dimitry Gershenson, and Daniel M. Kammen. 2015. “Decentralized energy systems for clean electricity access” [in en]. Nature Climate Change 5, no. 4 (April): 305–314. http://www.nature.com/nclimate/ journal/v5/n4/full/nclimate2512.html.
Ansar, Atif, Bent Flyvbjerg, Alexander Budzier, and Daniel Lunn. 2014. Should We Build More Large Dams? The Actual Costs of Hydropower Megaproject Development. SSRN Scholarly Paper ID 2406852. Rochester, NY: Social Science Research Network, March. Accessed August 14, 2015. http://papers.ssrn.com/abstract=2406852.
Bischof-Niemz, Tobias. 2015. Financial Costs and Benefits of Renewables in South Africa in 2014. Technical Report CSIR/02400/RD Core/IR/2015/0001/B. South Africa: Council for Scientific and Indus-trial Research (CSIR), February. Accessed August 20, 2015. http://www.csir.co.za/media_releases/docs/Financial_benefits_Wind_PV_2014_CSIR_10Feb2015_report.pdf.
Black & Veatch Corp. and National Renewable Energy Laboratory. 2012. Cost Estimates and Performance Data for Conventional Electricity Technologies. Technical report. February. http://bv.com/docs/ reports-studies/nrel-cost-report.pdf.
Black & Veatch Corp. and RETI Coordinating Committee. 2009. Renewable Energy Transmission Initiative (RETI) Phase 1B Final Report. Technical report RETI-1000-2008-003-F. January. http://www.energy.ca.gov/reti/documents/index.html.
Cochran, J, L Bird, J Heeter, and D. Arent. 2012. Integrating Variable Renewable Energy on the Electric Power Markets: Best Practices from International Experience. Technical report. National Renewable Energy Laboratory.
Corporation, Enernex. 2011. Eastern Wind Integration and Transmission Study. Technical report. National Renewable Energy Laboratory.
Coynel, Alexandra, Patrick Seyler, Henri Etcheber, Michel Meybeck, and Didier Orange. 2005. “Spatial and seasonal dynamics of total suspended sediment and organic carbon species in the Congo River” [in en]. Global Biogeochemical Cycles 19, no. 4 (December): GB4019. http://onlinelibrary.wiley.com/doi/10.1029/2004GB002335/abstract.
Department of Energy, South Africa. 2016. Integrated Resource Plan Update: Assumptions, Base Case Results, and Observations. Technical report Revision 1. Department of Energy, Republic of South Africa, November.
Department of Environmental Affairs and Council for Scientific and Industrial Research. 2014. Renewable Energy Development Zones. Technical report. http://www.sapvia.co.za/wp-content/uploads/2013/03/National-Wind-Solar-SEA-Overview_08Jan2012.pdf.
Energy, GE. 2010. Western Wind and Solar Integration Study. Technical report. National Renewable Energy Laboratory.
ICF. 2017. Conceptual Plan for Enhancing Transmission Infrastructure to Expand Electricity Access in the Democratic Republic of the Congo (DRC). Technical report. United States Agency for International Development, March.
IRENA. 2013. Renewable power generation costs in 2012: An overview. Technical report. International Renewable Energy Agency (IRENA).
_____. 2016. The Power to Change: Solar and Wind Cost Reduction Potential to 2025. Technical report. International Renewable Energy Agency (IRENA).
Mentis, Dimitrios, Mark Howells, Holger Rogner, Alexandros Korkovelos, Christopher Arderne, Eduardo Zepeda, Shahid Siyal, Constantinos Taliotis, Morgan
Bazilian, Ad de Roo, et al. 2017. Lighting the World: The first global application of an open source, spatial electrification tool (ONSSET), with a focus on Sub-Saharan Africa. Forthcoming.
Mentis, Dimitrios, Mark Howells, Holger Rogner, Alexandros Korkovelos, Shahid Siyal, Oliver Broad, Eduardo Zepeda, and Morgan Bazilian. 2016. “Lighting up the World: The first global application of the open source, spatial electrification toolkit (ONSSET),” 18:14161. April.
Morrissey, James. 2017. The energy challenge in sub-Saharan Africa: A guide for advocates and policymakers. Part 2: Addressing energy poverty. Technical report. Oxfam.
National Energy Regulator of South Africa. 2016. Monitoring of Renewable Energy Performance. Technical report Issue 7. April.
Ong, Sean, Clinton Campbell, and Garvin Heath. 2012. Land Use for Wind, Solar, and Geothermal Electricity Generation Facilities in the United States. A report from the National Renewable Energy Laboratory to the Electric Power Research Institute. National Renewable Energy Laboratory, December.
PVsyst. PVsyst. http://www.pvsyst.com.
Renewable Energy Policy Network for the 21st Century. 2015. REN21 Status of Renewables Interactive Map. Accessed May 1, 2016. http://www.ren21.net/status-of-renewables/ren21-interac tive-map/.
Schaber, Katrin, Florian Steinke, Pascal Mühlich, and Thomas Hamacher. 2012. “Parametric study of variable renewable energy integration in Europe: Advantages and costs of transmission grid extensions.” Energy Policy 42 (March): 498–508. Accessed August 19, 2015. http://www.sciencedirect.com/science/article/pii/S0301421511010081.
Showers, Kate. 2009. “Congo River’s Grand Inga Hydroelectricity Scheme: Linking Environmental History, Policy, and Impact.” Water History 1 (1): 31–58.
Siemens. 2012. Fact Sheet - High-voltage direct current transmission (HVDC). Technical report. https://www.siemens.com/press/pool/de/events/2012/energy/2012-07-wismar/factsheet-hvdc-e.pdf.
Sovacool, Benjamin K., Alex Gilbert, and Daniel Nugent. 2014a. “An international comparative assess-ment of construction cost overruns for electricity infrastructure.” Energy Research & Social Science 3 (September): 152–160. ISSN: 2214-6296, accessed August 21, 2015. http://www.sciencedirect.com/science/article/pii/S2214629614000942.
______. 2014b. “Risk, innovation, electricity infrastructure and construction cost overruns: Testing six hypotheses.” Energy 74 (September): 906–917. ISSN: 0360-5442, accessed August 21, 2015. http://www.sciencedirect.com/science/article/pii/ S0360544214008925.
Subramaniam, A., P. L. Yager, E. J. Carpenter, C. Mahaffey, K. Björkman, S. Cooley, A. B. Kustka, et al. 2008. “Amazon River enhances diazotrophy and carbon sequestration in the tropical North Atlantic Ocean” [in en]. Proceedings of the National Academy of Sciences 105, no. 30 (July): 10460–10465. Accessed July 24, 2017. http://www.pnas.org/content/105/30/10460.
Szabó, Sándor, Magda Moner-Girona, Ioannis Kougias, Rob Bailis, and Katalin Bódis. 2016. “Identifi-cation of advantageous electricity generation options in sub-Saharan Africa integrating existing resources” [in en]. Nature Energy 1, no. 10 (September): nenergy2016140. ISSN: 2058-7546, ac-cessed July 23, 2017. https://www.nature.com/articles/nenergy2016140.
Tegen, S., E. Lantz, M. Hand, B. Maples, A. Smith, and P. Schwabe. 2013. 2011 Cost of Wind Energy Review. Technical report NREL/TP-5000-56266. National Renewable Energy Laboratory.
U.S. Energy Information Administration. 2016. Cost and
Performance Characteristics of New Generating Technologies, Annual Energy Outlook 2016. Technical report. June. http://www.eia.gov/foreca sts/aeo/assumptions/pdf/table_8.2.pdf.
USAID. 2015. Affirmative Investigation for DRC - Inga 3-BC Hydropower Project. Technical report. United States Agency for International Development, September.
Wind, Trade. 2009. Integrating Wind: Developing Europe’s Power Market for the Large Scale Integration of Wind Power. Technical report. European Wind Energy Association.
Wiser, Ryan, and Mark Bolinger. 2016. 2015 Wind Technologies Market Report. Technical report. Lawrence Berkeley National Laboratory.
Wiser, Ryan, Karen Jenni, Joachim Seel, Erin Baker, Maureen Hand, Eric Lantz, and Aaron Smith. 2016. “Expert elicitation survey on future wind energy costs” [in en]. Nature Energy 1, no. 10 (September): ISSN: 2058-7546. 135. https://www.nature.com/articles/nenergy2016135.
World Bank. 2014a. “Africa’s Growth Set to Reach 5.2 percent in 2014 With Strong Investment Growth and Household Spending.” The World Bank (April). Accessed November 4, 2015. http://www.worldbank.org/en/news/press-release/2014/04/07/africas-growth-set-to-reach-52-percent-in-2014-with-strong-investment-growth-and-household-spending.
World Bank. 2014b. International Development Association Project Appraisal Document on a Proposed Grant in the Amount of SDR 47.7 million (US$ 73.1 million equivalent) to the Democratic Republic of Congo for an Inga 3 Basse Chute and Mid-size Hydropower Development Technical Assistance Project. Technical report 77420-ZR. Sustainable Development Department, Africa Region, World Bank, March.
World Bank. 2016. Data. Technical report. The World Bank Group. data.worldbank.org.
World Energy Council. 2013. World Energy Resources: Hydro. Technical report. https://www.worldenergy.org/wp-content/uploads/2013/10/WER_2013_5_Hydro.pdf.
Wright, Jarrad, Tobias Bischof-Niemz, Joanne Calitz, Crescent Mushwana, Robbie van Heerden, and Mamahloko Senalta. 2017. Formal Comments on the Integration Resource Plan Update: Assumptions, Base Case Results, and Observations 2016. Technical report 20170331-CSIR-EC-ESPO-REP-DOE-1.1A Rev 1.1. CSIR, April.
Wu, Grace C., Ranjit Deshmukh, Kudakwashe Ndhlukula, Tijana Radojicic, and Jessica Reilly. 2015. Re-newable Energy Zones for the Africa Clean Energy Corridor. LBNL#187271. International Renewable Energy Agency and Lawrence Berkeley National Laboratory, October.
Wu, Grace C., Ranjit Deshmukh, Kudakwashe Ndhlukula, Tijana Radojicic, Jessica Reilly-Moman, Amol Phadke, Daniel M. Kammen, and Duncan S. Callaway. 2017. “Strategic siting and regional grid interconnections key to low-carbon futures in African countries” [in en]. Proceedings of the National Academy of Sciences 114, no. 15 (April): E3004–E3012. ISSN: 0027-8424, 1091-6490, accessed July 20, 2017. doi:10.1073/pnas.1611845114. http://www.pnas.org/content/114/15/E3004.
Zhou, Liming, Yuhong Tian, Ranga B. Myneni, Philippe Ciais, Sassan Saatchi, Yi Y. Liu, Shilong Piao, et al. 2014. “Widespread decline of Congo rainforest greenness in the past decade” [in en]. Nature 509, no. 7498 (May): 86–90. ISSN: 0028-0836, accessed July 8, 2017. doi:10.1038/nature13265. https://www.nature.com/nature/journal/v509/n7498/abs/nature13265.html.
References
Renewable Riches: How Wind and Solar Could Power DRC and South Africa 3736 Renewable Riches: How Wind and Solar Could Power DRC and South Africa
A.Methods for wind and solar PV resource potential assessment in the DRCA.1 Site suitability Resource potential assessment is a geospatial analysis requiring various types of spatial datasets that can be roughly categorized as physical, socio-economic, environmental, and energy resource related. In this study, we used the MapRE methodology to identify and characterize potential project areas (Wu et al. 2015, Wu et al. 2017). Table 1 lists the datasets used to identify suitable sites for wind and solar PV development (indicated under stage of analysis column as “Site suitability”). The default exclusion threshold indicates the value above or below which areas would be excluded from consideration as suitable sites. For example, a 1000 m buffer was applied to all conservation areas, such that all areas within a 1000 m buffer of a conservation area, including the conservation area itself, would be considered unsuitable for development and excluded.
Table 1: Data sources and resource assessment thresholds
Stage of Analysis
Data Category Dataset Name and Description Source Year Default Exclusion Threshold
Site suitability
Conservation World Database on Protected Areas. The World Database on Protected Areas (WDPA) is the most comprehensive global spatial dataset on marine and terrestrial protected areas available. The WDPA is a joint project of UNEP and IUCN, produced by UNEP-WCMC and the IUCN World Commission on Protected Areas working with governments and collaborating NGOs. Download data via https://www.protectedplanet.net/
World Database on Protected Areas
2015 <1000 m buffer
Site suitability
Conservation Protected areas in Protected Planet Database. Open source database that includes most WDPA locations, but also include polygon representations of the WDPA point locations (those with unknown extents/boundaries). Download data via https://www.protectedplanet.net/
Protected Planet
2014 1000 m buffer
Site suitability
Conservation Protected areas in the DRC. This dataset represent the boundaries of geographical areas that are clearly defined, recognized, dedicated and managed by any effective means, legal or otherwise, in order to ensure the long-term conservation of nature as well as ecosystem services and cultural values Associated. This dataset is produced by the ICCN with the support of the Central African Forest Observatory (OFAC) within the framework of the FORAF project. The WRI / CARPE Project used this layer to produce the Forest Atlas of the Democratic Republic of Congo. Download data via http://cod-data.forest-atlas.org/datasets?q=conservation
Forest Atlas of the DRC: Open Data Portal
2017 1000 m buffer
Appendices

Renewable Riches: How Wind and Solar Could Power DRC and South Africa 3938 Renewable Riches: How Wind and Solar Could Power DRC and South Africa
Site suitability
Conservation Intact Forest Landscapes. The Intact Forest Landscapes data set identifies unbroken expanses of natural ecosystems within the zone of forest extent that show no signs of significant human activity and are large enough that all native biodiversity, including viable populations of wide-ranging species, could be maintained.This data can be used to assess forest intactness, alteration, and degradation at global and regional scales. More information about the dataset and methodology is available on www.intactforests.org. Download data via http://data.globalforestwatch.org/datasets/
Global Forest Watch (Greenpeace, University of Maryland, World Resources Institute and Transparent World)
2013 1000 m buffer
Site suitability
Conservation Intact High Conservation Value Areas. The purpose of this dataset is to show areas with high conservation value as defined by the combination of Conservation International’s biodiversity hotspots, Endemic bird Areas, Frontier Forests, and Global Ecoregion 200 areas that fall within the WCS/Ciesin Human Footprint’s top 10% of areas with the least human influence. Download data via https://www.wri.org/resources/data-sets/gis-data-sets-mining-and-critical-ecosystems-publication
World Resources Institute (WRI)
2007 1000 m buffer
Site suitability
Land-use and land-cover
ESA-CCI land cover maps. The Climate Change Initiative Land Cover team produced annual global Land Cover maps at 300 m spanning a 24-year period, from 1992 to 2015. This innovative effort was supported by state-of-the-art reprocessing of the full archives of 5 different satellite missions providing daily observation of the Earth, including NOAA-AVHRR HRPT, SPOT-Vegetation, ENVISAT-MERIS FR and RR, ENVISAT-ASAR, and PROBA-V for the most recent years. Download data via https://www.esa-landcover-cci.org/
European Space Agency (ESA)
2015 See Land use land cover category Table 2
Site suitability
Land-use and land-cover
Forest cover in the DRC. Forêts d’Afrique Centrale Evaluées par Télédétection or Monitoring the forests of Central Africa using remotely sensed data sets (FACET) is an OSFAC project whose goal is to quantitatively evaluate the spatiotemporal dynamics of forest change in Central Africa through the use of multi-temporal satellite data. The analysis made use of an automated “wall-to-wall” remote sensing method, developed jointly by South Dakota State University and the University of Maryland, and incorporated over 10,000 Landsat ETM+ images. The atlases consist of Landsat image composites coupled with classifications of forest cover and forest cover loss for the periods 2000-2005-2010. Download data via http://carpe.umd.edu/forest_monitoring/monitoring.php
Central Africa Regional Program for the Environment (CARPE)
2010 All forested areas
Site suitability
Mining permits
Mining permitted areas in the DRC. This data set provides the boundaries for mining permits in the Democratic Republic of the Congo. This data set is available from the Ministry of Mines Mining Registry (CAMI). For more information, see the DRC’s mining cadaster portal: http://portals.flexicadastre.com/drc/en/. Download data via http://cod-data.forest-atlas.org/datasets/
Forest Atlas of the DRC: Open Data Portal
2016 >0 m (no buffer)
Site suitability
Water bodies Water bodies of the DRC. This water bodies vector layer represents the watercourses of the DRC. It was first produced by the Inventory and Forest Management Directorate on the basis of large-scale interpretation (1 / 50,000) of Landsat satellite imagery, followed by technicians from the Provincial Environment Coordinators of Bandundu, Ecuador and P. Orientale as part of the Spatial Information Management System (SyGIS) project. The attribute table was filled with the basic maps of the Geographical Institute of the Congo, extracts of forest title maps deposited by the loggers and the field knowledge of the MECNDD agents. The original cartographic data was produced with the technical support of World Resources Institute (WRI). Download data via http://cod-data.forest-atlas.org/datasets/
Forest Atlas of the DRC: Open Data Portal
2016 500 m buffer
Site suitability and project attribute calculation
Population Gridded Population of the World, Version 4 (GPWv4). GPWv4 Population Density Adjusted to Match 2015 Revision of UN WPP Country Totals consists of estimates of human population density, based on counts consistent with national censuses and population registers with respect to relative spatial distribution, but adjusted to match the 2015 Revision of UN World Population Prospects country totals for the years 2000, 2005, 2010, 2015, and 2020. A proportional allocation gridding algorithm, utilizing approximately 12.5 million national and sub-national administrative units, is used to assign population values to 30 arc-second (~1 km) grid cells. The population density grids are created by dividing the population count grids by the land area grids. The pixel values represent persons per square kilometer. Download data via http://sedac.ciesin.columbia.edu/data/set/gpw-v4-population-density-adjusted-to-2015-unwpp-country-totals
Center for International Earth Science Information Network - CIESIN - Columbia University
2016 >100 people
Site suitability; project attribute calculation
Solar resource
Gridded solar power potential. Solar radiation rasters are in 30 arcsec (nominally 1 km) and are longterm yearly average of the Photovoltaic power potential [kWh/kWp]. Download data via http://globalsolaratlas.info/
Solar GIS and The World Bank Group
2016 <3.8 kWh/m2/day

Renewable Riches: How Wind and Solar Could Power DRC and South Africa 4140 Renewable Riches: How Wind and Solar Could Power DRC and South Africa
Site suitability; project attribute calculation
Wind resource
Gridded wind speed. Wind resource data were created from computer simulations using a meso-scale numerical weather prediction model and validated using publicly available wind speed observations from 194 meteorological stations within Africa from the National Centers for Environmental Prediction (NCEP). Annual wind speed, wind power density, wind power output, and Weibull parameters were provided at 80 m hub height and 5 km resolution for a typical meteorological year. Weibull parameters were used to construct wind speed distribution curves, which were used to estimate the capacity factor of each grid cell using either Class I, II, or III power curves, depending on the average wind speed of a grid cell. See Wu et al. 2015 for a thorough description of how wind capacity factors were calculated (Wu et al. 2015). Original datasets can be downloaded on the Global Atlas by searching for “Vaisala Global wind dataset”: http://irena.masdar.ac.ae/
3Tier/Vaisala 10-year model run
<15% capacity factor
Project attribute calculation
Transmission lines
SNEL - Electricity transmission network of the DRC. This layer represents the high voltage electrical transmission lines from the hydraulic dams to the distribution centers. It takes over existing and planned lines. The data are produced by the Société Nationale d’Electricité (SNEL). This data set is supplied by the Société Nationale d’Electricité through the Moabi platform. The WRI / CARPE Project obtained this data from the Moabi platform for the production of the Interactive Forest Atlas of the Democratic Republic of Congo. Download data via http://cod-data.forest-atlas.org/datasets/
Forest Atlas of the DRC: Open Data Portal
2016 N/A
Project attribute calculation
Transmission lines
AICD/AfDB - Electricity transmission network of the DRC. The Africa Development Bank and the World Bank initiated the Africa Infrastructure Country Diagnostic (AICD) to map and assess the state of infrastructure in many Africa countries. Data for medium and high voltage electricity transmission lines were compiled for the AICD study. A variety of sources were consulted, including documents and maps from national utilities, regional power pools and the World Bank. In some cases, lines do not represent geographic footprint of transmission lines but are schematics depicting points of interconnection. Download data via http://mapforenvironment.org/layer/info/122/#4.93/-4.013/20.81
AICD – AfDB and WB
2010 N/A
Project attribute calculation
Road network
Public road network (National and Provincial) in the Democratic Republic of Congo. This dataset consists of classified roads, rural roads and forest tracks, the Attribute Table provided information on the Highway Traffic Act, Description Of road, Category of road, Title number (applicable to forest roads), Toponym, State and source of each data. The data are produced by the Inventory and Forest Management Department and come from the Project File Africover, RGC Working Group File (OCHA / UNDP) on road resources, as well as the digitization of satellite imagery and base maps of the IGC from high resolution interpretation (1 / 50,000). Download data via http://cod-data.forest-atlas.org/datasets/
Forest Atlas of the DRC: Open Data Portal
2016 N/A
Project attribute calculation
Urban areas Urban areas. Area of dense human habitation. Citation: Schneider, A., M. A. Friedl and D. Potere (2009). A new map of global urban extent from MODIS data. Environmental Research Letters, volume 4, article 044003. Download data via http://www.naturalearthdata.com/downloads/10m-cultural-vectors/10m-urban-area/
Natural Earth 2009 N/A
Project attribute calculation
Indigenous lands
Indigenous lands. Areas populated by indigenous people. See the Synchronicity Earth website for more information: http://www.synchronicityearth.org/projects/forests/ Dynamique-des-Groupes-des-Peuples-Autochtones Download data via http://rdc.moabi.org/data/
Dyanmique des Groupes des Peuples Autochones (DGPA)
2016 N/A
For default land cover exclusions, we used the European Space Agency’s Climate Change Initiative land cover map for the year 2015. Land cover categories considered suitable for development are those with minimal tree cover, such as grassland, shrubland, and bare areas (Table 2). For wind power, cropland is considered a suitable land cover category since the footprint of a wind turbine is small compared to the necessary spacing between turbines, allowing continued use of the majority of the land area within a wind farm for cultivation or pasture (Table 2). For wind power, we conducted a sensitivity analysis another dataset–the Central Africa Regional Programme for the Environment (CARPE)’s forest cover maps of the DRC for 2010. For the CARPE dataset, we included the following categories for wind development: non-forest areas, forest cover loss 2000-2010 within woodlands, primary forests, and secondary forests. Forest was defined as areas with greater than 30% canopy cover greater than 5 m in height.
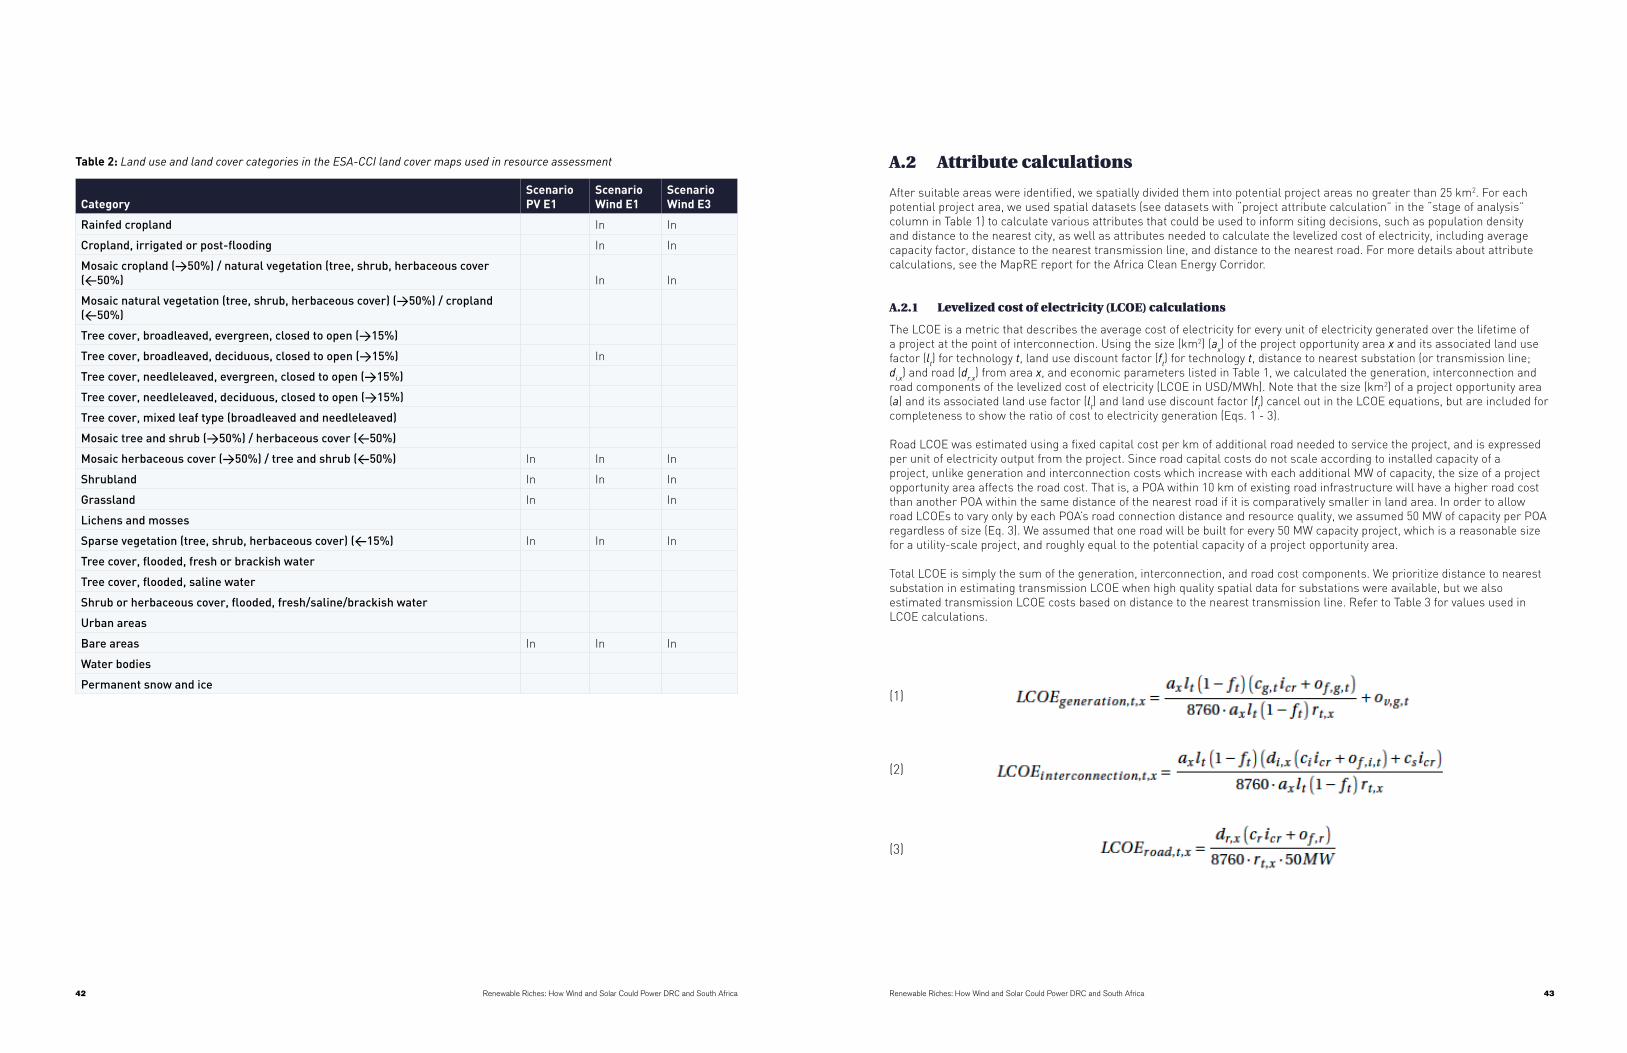
Renewable Riches: How Wind and Solar Could Power DRC and South Africa 4342 Renewable Riches: How Wind and Solar Could Power DRC and South Africa
Table 2: Land use and land cover categories in the ESA-CCI land cover maps used in resource assessment
CategoryScenario PV E1
ScenarioWind E1
Scenario Wind E3
Rainfedcropland In In
Cropland,irrigatedorpost-flooding In In
Mosaiccropland(>50%)/naturalvegetation(tree,shrub,herbaceouscover(<50%) In In
Mosaicnaturalvegetation(tree,shrub,herbaceouscover)(>50%)/cropland(<50%)
Treecover,broadleaved,evergreen,closedtoopen(>15%)
Treecover,broadleaved,deciduous,closedtoopen(>15%) In
Treecover,needleleaved,evergreen,closedtoopen(>15%)
Treecover,needleleaved,deciduous,closedtoopen(>15%)
Treecover,mixedleaftype(broadleavedandneedleleaved)
Mosaictreeandshrub(>50%)/herbaceouscover(<50%)
Mosaicherbaceouscover(>50%)/treeandshrub(<50%) In In In
Shrubland In In In
Grassland In In
Lichensandmosses
Sparsevegetation(tree,shrub,herbaceouscover)(<15%) In In In
Treecover,flooded,freshorbrackishwater
Treecover,flooded,salinewater
Shruborherbaceouscover,flooded,fresh/saline/brackishwater
Urbanareas
Bareareas In In In
Waterbodies
Permanentsnowandice
A.2 Attribute calculations
After suitable areas were identified, we spatially divided them into potential project areas no greater than 25 km2. For each potential project area, we used spatial datasets (see datasets with “project attribute calculation” in the “stage of analysis” column in Table 1) to calculate various attributes that could be used to inform siting decisions, such as population density and distance to the nearest city, as well as attributes needed to calculate the levelized cost of electricity, including average capacity factor, distance to the nearest transmission line, and distance to the nearest road. For more details about attribute calculations, see the MapRE report for the Africa Clean Energy Corridor.
A.2.1 Levelized cost of electricity (LCOE) calculations
The LCOE is a metric that describes the average cost of electricity for every unit of electricity generated over the lifetime of a project at the point of interconnection. Using the size (km2) (ax) of the project opportunity area x and its associated land use factor (lt) for technology t, land use discount factor (ft) for technology t, distance to nearest substation (or transmission line; di,x) and road (dr,x) from area x, and economic parameters listed in Table 1, we calculated the generation, interconnection and road components of the levelized cost of electricity (LCOE in USD/MWh). Note that the size (km2) of a project opportunity area (a) and its associated land use factor (lt) and land use discount factor (ft) cancel out in the LCOE equations, but are included for completeness to show the ratio of cost to electricity generation (Eqs. 1 - 3).
Road LCOE was estimated using a fixed capital cost per km of additional road needed to service the project, and is expressed per unit of electricity output from the project. Since road capital costs do not scale according to installed capacity of a project, unlike generation and interconnection costs which increase with each additional MW of capacity, the size of a project opportunity area affects the road cost. That is, a POA within 10 km of existing road infrastructure will have a higher road cost than another POA within the same distance of the nearest road if it is comparatively smaller in land area. In order to allow road LCOEs to vary only by each POA’s road connection distance and resource quality, we assumed 50 MW of capacity per POA regardless of size (Eq. 3). We assumed that one road will be built for every 50 MW capacity project, which is a reasonable size for a utility-scale project, and roughly equal to the potential capacity of a project opportunity area.
Total LCOE is simply the sum of the generation, interconnection, and road cost components. We prioritize distance to nearest substation in estimating transmission LCOE when high quality spatial data for substations were available, but we also estimated transmission LCOE costs based on distance to the nearest transmission line. Refer to Table 3 for values used in LCOE calculations.
(1)
(2)
(3)
B.4 Reserves

Renewable Riches: How Wind and Solar Could Power DRC and South Africa 4544 Renewable Riches: How Wind and Solar Could Power DRC and South Africa
Where cg,t is the capital cost of generation for technology t; ci is the capital cost of interconnection (i) substation (s); cr is the capital cost of road; rt,x is the capacity factor of technology t and area x; of,g); cs is the capital cost of
,t is the fixed operations and maintenance cost of generation for technology t; o f ,i ,t is the fixed operations and maintenance cost of interconnection (i) for technology t; ov,g,t is the variable (v) operations and maintenance cost of generation (g ) for technology t; ov,i,t is the variable (v) operations and maintenance cost of interconnection (i) for technology t; o f,r is the fixed (f) operations and maintenance cost of roads (r). The capital recovery factor (icr) converts a present value to a uniform stream of annualized values given a discount rate and the number of interest periods (Eqn. 4). We have assumed a real discount rate (i) of 10% that reflects the high cost of capital in Africa. n is the number of years in the lifetime of a power plant.
(4)
Although LCOE assumptions were selected to be as representative of current conditions and costs, these LCOE estimates are best used to compare costs within a single technology since LCOE values may be higher or lower than others reported in the literature given the dynamic nature of the industry. Further, the discount rate can significantly affect the LCOE, and can vary across countries.
System integration costs or balancing costs are not included in LCOE estimates. These can vary across countries based on their electricity generation mix. For example, hydro capacity with storage is considered more flexible than coal power plants that typically incur a higher penalty for cycling in order to balance both variable renewable energy and load (net load).
The LCOE does not account for differences in the value of electricity generated by different technologies in a particular location. Generation at different times of the day or year have different economic value depending on the demand and the available generation at that time.
LCOE estimates are based on present existing and planned transmission and road infrastructure. In this study, we did not value a potential project area sequentially based on the utilization of infrastructure that may be built earlier for another nearby planned project.
Table 3: Levelized cost of electricity input assumptions
Parameters Wind Solar PV
Landusefactor[MW/km2](l) 91 302
Landusediscountfactor(f) 75% 90%
Generationcosts-capital[USD/kW](cg) 10353 7223
Generationcosts-fixedO&M[USD/kW/y](of,g) 393 163
Generationcosts-variableO&M[USD/MWh](ov,g) - -
Transmissioncosts–capital[USD/MW/km](ci) 9904 9904
Transmissioncosts–fixedO&M[USD/km](of,i) - -
Substationcosts–capital[USD/2substations(newtransmission)](cs) 710004 710004
Roadcosts–capital[USD/km](cr) 4070005 4070005
Roadcosts–fixedO&M[USD/km](of,r) - -
Economicdiscountrate(i) 10%6 10%6
Outagerate(ho) 2%7 -
Arrayandcollectionloss(ha) 15%8 -
Lifetime[years](n) 203 253
1. Mean of U.S. empirical values (3 MW/km2) Ong, Campbell, and Heath 2012 and theoretical land use factors Black & Veatch Corp. and RETI Coordinating Committee 2009
2. Ong, Campbell, and Heath 20123. CSIR “IRP Update Assumptions 1904” using a 1 ZAR to 0.079 USD exchange rate4. Black & Veatch Corp. and National Renewable Energy Laboratory 20125. Africon 20086. IRENA 20137. Default value in the System Advisor Model (SAM) by NREL8. Tegen et al. 2013

Renewable Riches: How Wind and Solar Could Power DRC and South Africa 4746 Renewable Riches: How Wind and Solar Could Power DRC and South Africa
B. Methodology and assumptions for electricity generation capacity expansion planning for South Africa
B.1 Temporal resolution
B.1.1 Investment periods
Four investment periods are modeled to represent the time between present day and 2035: 2020 (representing 2018-2022), 2025 (representing 2023-2027), 2030 (representing 2028-2032), and 2035 (representing 2033-2050). Investment periods are times when the model can build new infrastructure that is then available in later periods until the end of the lifetime of that infrastructure. Each investment period has a discount factor and a weight for the number of years it represents. A discount rate of 8.2% is used. To avoid boundary effects, 2035 is given a larger weight (weighted by an additional 18 years through 2050).
B.1.2 Operational days
Within each investment period, grid infrastructure is dispatched to meet load and other constraints on 24 hours on 12 total days, weighted appropriately to represent a full year. Each represents average conditions for a month and is weighted by the number of day in that month. Each day is modeled independently, with variables such as storage energy balance and hydro budget constrained on each day.
B.2 Geographic resolution
South Africa is modeled as a single “load zone” with no internal transmission constraints or transmission connections to other zones or countries. The “load zone” is the unit at which load is balanced in each modeled hour. Transmission constraints are ignored both due to lack of access to data and the associated uncertainties in future transmission buildouts. Such constraints can be added if data become available.
B.3 Load
B.3.1 Load profiles
We use the average load forecast profiles by month and hour based on the average 2012 load profile (Wu et al. 2017) linearly scaled for each year until 2050 using the 2016 IRP “High Growth Less Energy Intensive” annual demand forecast. We scaled up these profiles by 5% to account for transmission losses.
B.3.2 Unserved Energy and Over-generation
A value of lost load (VoLL) of $10,000/MWh is assumed (ZAR 115,000 at an exchange rate of $/ZAR 11.55). System-level over-generation is also penalized, and generator-level curtailment of wind and solar generation can be used to avoid this condition.
B.4 Reserves
We model regulation and spinning reserves. The regulation requirement is assumed to be 1% of load and the spinning reserves requirement is assumed to be 3% of load in each hour.
B.5 Policy
All future capacity is built based on least system cost. No carbon cap or RPS policy is applied.
B.6 Planned generator capacity
Existing and planned generator capacities exogenously input into the model are based on CSIR data (see Table 4). Gas is CCGT; Peaking is OCGT. All existing coal capacity is assumed to be using pulverized coal.
Table 4: Existing and planned generator capacities (based on CSIR study)
COAL NUCLEAR GAS PEAKING HYDRO WIND CSPSOLAR PV BIOGAS BIOMASS
PUMPED STORAGE INGA
2016 36,782 1,860 425 3,419 2,179 1,460 200 1,479 - 264 1,580 -
2017 36,782 1,860 425 3,419 2,184 2,234 600 1,594 13 292 2,912 -
2018 38,789 1,860 425 3,419 2,184 2,770 600 1,819 13 292 2,912 -
2019 40,234 1,860 425 3,419 2,184 3,458 1,050 2,292 53 417 2,912 -
2020 41,641 1,860 425 3,419 2,224 4,106 1,050 2,811 53 417 2,912 -
2021 42,500 1,860 425 3,419 2,224 4,106 1,050 2,811 53 417 2,912 -
2022 42,093 1,860 425 3,419 2,224 4,106 1,050 2,811 53 417 2,912 -
2023 41,876 1,860 425 3,419 2,224 4,106 1,050 2,811 53 417 2,912 -
2024 41,116 1,860 425 3,419 2,224 4,106 1,050 2,811 53 417 2,912 -
2025 40,276 1,860 425 3,419 2,224 4,106 1,050 2,811 53 417 2,912 -
2026 38,956 1,860 425 3,077 2,224 4,106 1,050 2,811 53 417 2,912 -
2027 37,996 1,860 425 3,077 2,224 4,106 1,050 2,811 53 417 2,912 -
2028 36,476 1,860 425 3,077 2,224 4,106 1,050 2,811 53 417 2,912 -
2029 34,936 1,860 425 3,077 2,224 4,106 1,050 2,811 53 417 2,912 -
2030 32,616 1,860 425 3,077 2,224 4,106 1,050 2,811 53 417 2,912 1,000
2031 31,474 1,860 425 3,077 2,224 4,106 1,050 2,811 53 417 2,912 1,500
2032 29,628 1,860 425 3,077 2,224 4,106 1,050 2,811 53 417 2,912 2,000
2033 27,879 1,860 425 3,077 2,224 4,106 1,050 2,811 53 417 2,912 2,500
2034 26,176 1,860 425 3,077 2,224 4,106 1,050 2,811 53 417 2,912 2,500
2035 24,612 1,860 425 3,077 2,224 4,106 1,050 2,811 53 417 2,912 2,500
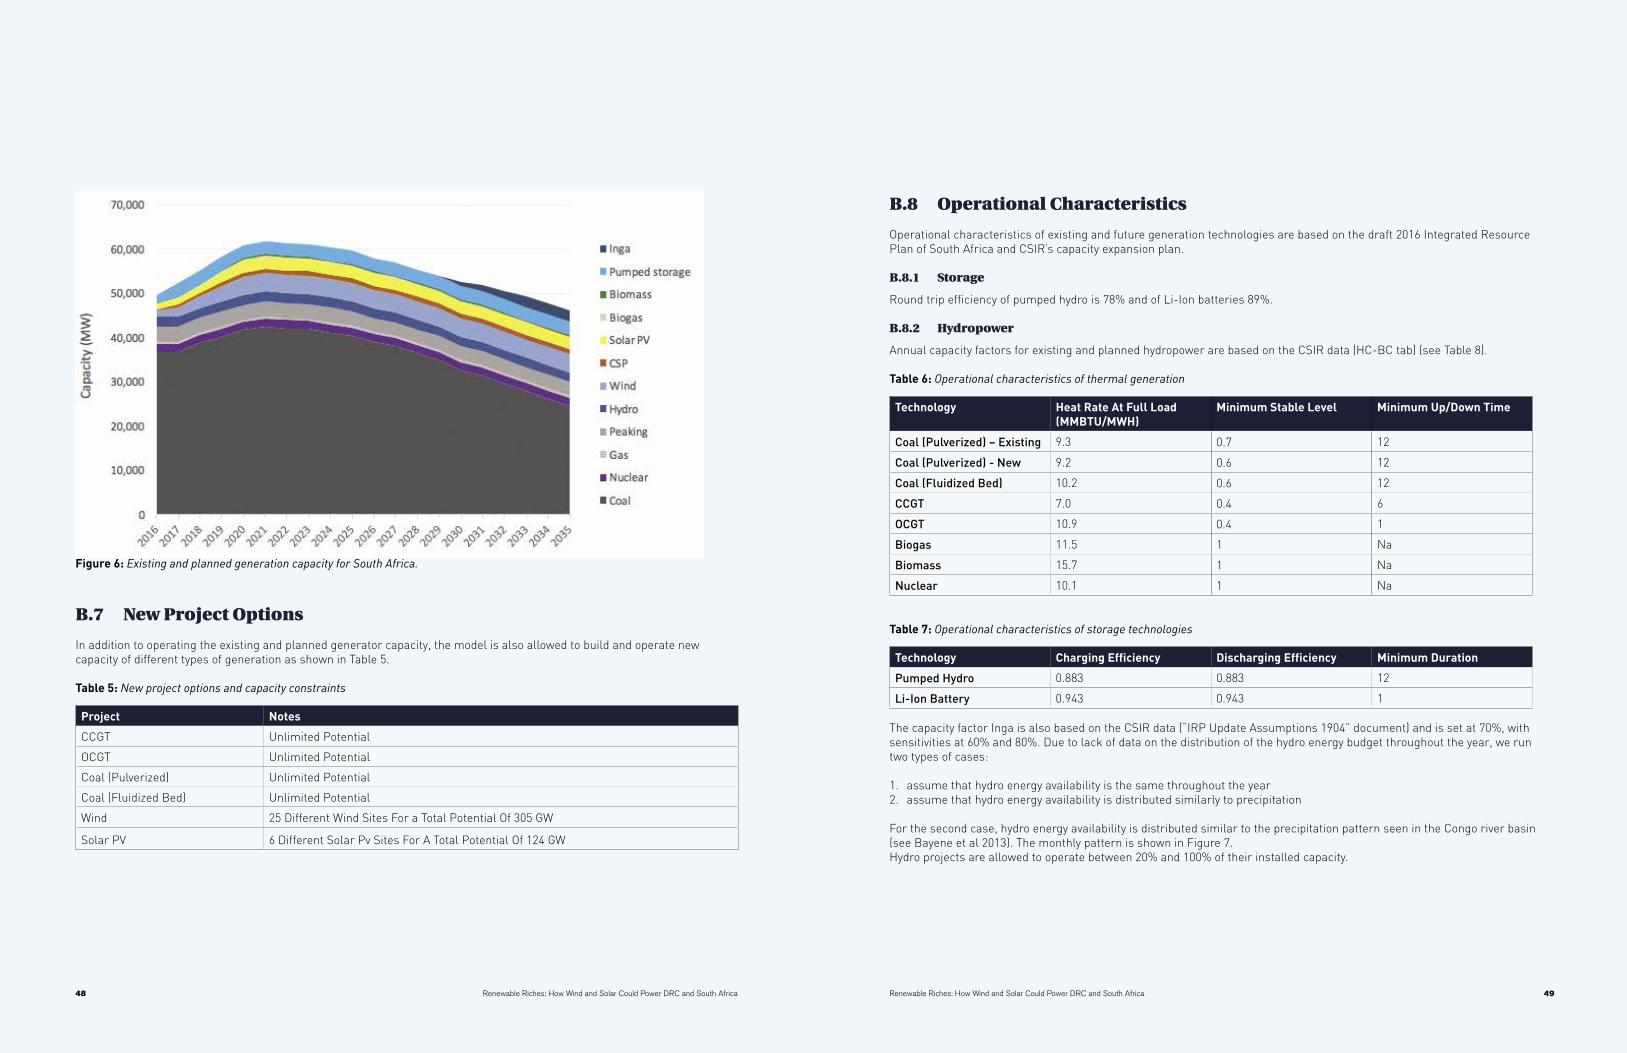
Renewable Riches: How Wind and Solar Could Power DRC and South Africa 4948 Renewable Riches: How Wind and Solar Could Power DRC and South Africa
Figure 6: Existing and planned generation capacity for South Africa.
B.7 New Project Options
In addition to operating the existing and planned generator capacity, the model is also allowed to build and operate new capacity of different types of generation as shown in Table 5.
Table 5: New project options and capacity constraints
Project Notes
CCGT Unlimited Potential
OCGT Unlimited Potential
Coal (Pulverized) Unlimited Potential
Coal (Fluidized Bed) Unlimited Potential
Wind 25 Different Wind Sites For a Total Potential Of 305 GW
Solar PV 6 Different Solar Pv Sites For A Total Potential Of 124 GW
B.8 Operational Characteristics
Operational characteristics of existing and future generation technologies are based on the draft 2016 Integrated Resource Plan of South Africa and CSIR’s capacity expansion plan.
B.8.1 Storage
Round trip efficiency of pumped hydro is 78% and of Li-Ion batteries 89%.
B.8.2 Hydropower
Annual capacity factors for existing and planned hydropower are based on the CSIR data (HC-BC tab) (see Table 8).
Table 6: Operational characteristics of thermal generation
Technology Heat Rate At Full Load (MMBTU/MWH)
Minimum Stable Level Minimum Up/Down Time
Coal(Pulverized)–Existing 9.3 0.7 12
Coal(Pulverized)-New 9.2 0.6 12
Coal(FluidizedBed) 10.2 0.6 12
CCGT 7.0 0.4 6
OCGT 10.9 0.4 1
Biogas 11.5 1 Na
Biomass 15.7 1 Na
Nuclear 10.1 1 Na
Table 7: Operational characteristics of storage technologies
Technology Charging Efficiency Discharging Efficiency Minimum Duration
PumpedHydro 0.883 0.883 12
Li-IonBattery 0.943 0.943 1
The capacity factor Inga is also based on the CSIR data (“IRP Update Assumptions 1904” document) and is set at 70%, with sensitivities at 60% and 80%. Due to lack of data on the distribution of the hydro energy budget throughout the year, we run two types of cases:
1. assume that hydro energy availability is the same throughout the year2. assume that hydro energy availability is distributed similarly to precipitation
For the second case, hydro energy availability is distributed similar to the precipitation pattern seen in the Congo river basin (see Bayene et al 2013). The monthly pattern is shown in Figure 7.Hydro projects are allowed to operate between 20% and 100% of their installed capacity.
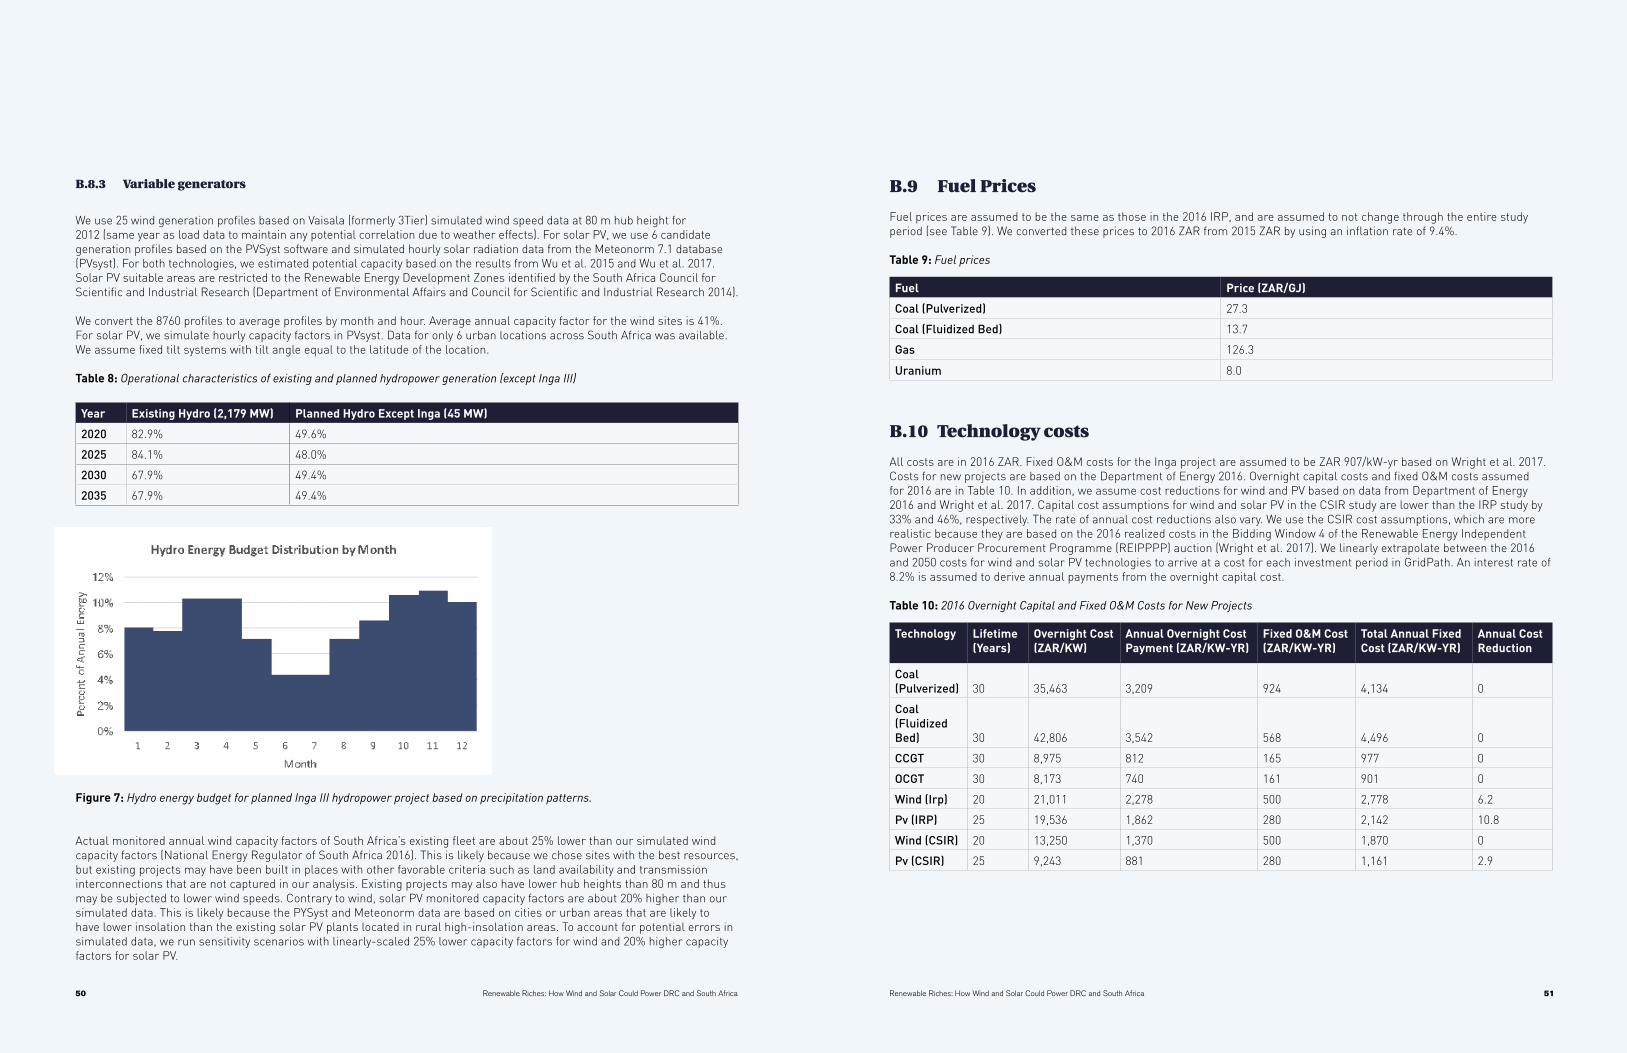
Renewable Riches: How Wind and Solar Could Power DRC and South Africa 5150 Renewable Riches: How Wind and Solar Could Power DRC and South Africa
B.8.3 Variable generators
We use 25 wind generation profiles based on Vaisala (formerly 3Tier) simulated wind speed data at 80 m hub height for 2012 (same year as load data to maintain any potential correlation due to weather effects). For solar PV, we use 6 candidate generation profiles based on the PVSyst software and simulated hourly solar radiation data from the Meteonorm 7.1 database (PVsyst). For both technologies, we estimated potential capacity based on the results from Wu et al. 2015 and Wu et al. 2017. Solar PV suitable areas are restricted to the Renewable Energy Development Zones identified by the South Africa Council for Scientific and Industrial Research (Department of Environmental Affairs and Council for Scientific and Industrial Research 2014).
We convert the 8760 profiles to average profiles by month and hour. Average annual capacity factor for the wind sites is 41%. For solar PV, we simulate hourly capacity factors in PVsyst. Data for only 6 urban locations across South Africa was available. We assume fixed tilt systems with tilt angle equal to the latitude of the location.
Table 8: Operational characteristics of existing and planned hydropower generation (except Inga III)
Year Existing Hydro (2,179 MW) Planned Hydro Except Inga (45 MW)
2020 82.9% 49.6%
2025 84.1% 48.0%
2030 67.9% 49.4%
2035 67.9% 49.4%
Figure 7: Hydro energy budget for planned Inga III hydropower project based on precipitation patterns.
Actual monitored annual wind capacity factors of South Africa’s existing fleet are about 25% lower than our simulated wind capacity factors (National Energy Regulator of South Africa 2016). This is likely because we chose sites with the best resources, but existing projects may have been built in places with other favorable criteria such as land availability and transmission interconnections that are not captured in our analysis. Existing projects may also have lower hub heights than 80 m and thus may be subjected to lower wind speeds. Contrary to wind, solar PV monitored capacity factors are about 20% higher than our simulated data. This is likely because the PYSyst and Meteonorm data are based on cities or urban areas that are likely to have lower insolation than the existing solar PV plants located in rural high-insolation areas. To account for potential errors in simulated data, we run sensitivity scenarios with linearly-scaled 25% lower capacity factors for wind and 20% higher capacity factors for solar PV.
B.9 Fuel Prices
Fuel prices are assumed to be the same as those in the 2016 IRP, and are assumed to not change through the entire study period (see Table 9). We converted these prices to 2016 ZAR from 2015 ZAR by using an inflation rate of 9.4%.
Table 9: Fuel prices
Fuel Price (ZAR/GJ)
Coal(Pulverized) 27.3
Coal(FluidizedBed) 13.7
Gas 126.3
Uranium 8.0
B.10 Technology costs
All costs are in 2016 ZAR. Fixed O&M costs for the Inga project are assumed to be ZAR 907/kW-yr based on Wright et al. 2017. Costs for new projects are based on the Department of Energy 2016. Overnight capital costs and fixed O&M costs assumed for 2016 are in Table 10. In addition, we assume cost reductions for wind and PV based on data from Department of Energy 2016 and Wright et al. 2017. Capital cost assumptions for wind and solar PV in the CSIR study are lower than the IRP study by 33% and 46%, respectively. The rate of annual cost reductions also vary. We use the CSIR cost assumptions, which are more realistic because they are based on the 2016 realized costs in the Bidding Window 4 of the Renewable Energy Independent Power Producer Procurement Programme (REIPPPP) auction (Wright et al. 2017). We linearly extrapolate between the 2016 and 2050 costs for wind and solar PV technologies to arrive at a cost for each investment period in GridPath. An interest rate of 8.2% is assumed to derive annual payments from the overnight capital cost.
Table 10: 2016 Overnight Capital and Fixed O&M Costs for New Projects
Technology Lifetime (Years)
Overnight Cost (ZAR/KW)
Annual Overnight Cost Payment (ZAR/KW-YR)
Fixed O&M Cost (ZAR/KW-YR)
Total Annual Fixed Cost (ZAR/KW-YR)
Annual Cost Reduction
Coal(Pulverized) 30 35,463 3,209 924 4,134 0
Coal(FluidizedBed) 30 42,806 3,542 568 4,496 0
CCGT 30 8,975 812 165 977 0
OCGT 30 8,173 740 161 901 0
Wind(Irp) 20 21,011 2,278 500 2,778 6.2
Pv(IRP) 25 19,536 1,862 280 2,142 10.8
Wind(CSIR) 20 13,250 1,370 500 1,870 0
Pv(CSIR) 25 9,243 881 280 1,161 2.9

52 Renewable Riches: How Wind and Solar Could Power DRC and South Africa
Table 11: Battery costs
Technology Overnight Cost – Power Component (ZAR/KW) Overnight Cost – Energy Component (ZAR/KWH)
Li-IonBattery 2,686 7,205 Battery costs in GridPath are input separately for the power (ZAR/kW) and energy (ZAR/kWh) components of storage, and add up to arrive at the total cost of the battery. The 2016 IRP includes cost for batteries with 1h of storage and 3h of storage. We assume that cost for each additional hour of storage increases linearly and derive a cost per kWh for Li-ion batteries accordingly. The overnight costs are included in the table below. Battery fixed O&M cost is assumed to be ZAR 618/kW-yr per the 2016 IRP.
Table 12: Operational costs
TechnologyVariable O&M Cost Startup cost (ZAR/MW) Shutdown Cost (ZAR/MW)
Coal(Pulverized) 80 69 69
Coal(FluidizedBed) 173 69 69
CCGT 21.9 520 (existing), 289 (new) 520 (existing), 289 (new)
OCGT 2.4 381 (existing), 58 (new) 381 (existing), 58 (new)
Wind 0 0 0
PV 0 0 0
CSP 0.9 0 0
Hydro 0 0 0
LI-ionBattery 0.3 0 0
PumpedStorage 0 0 0
Biogas 56.8 0 0
Biomass 90.2 0 0
* Variable O&M costs are based on 2016 Draft IRP; startup and shutdown costs are based on data from California’s 2017 IRP proceeding
Figure #: Existing and planned, and least-cost new generation capacity investments for South Africa with and without Inga II in 2035. Existing and planned generation capacity of 43,547MW, assumed from South Africa’s IRP 2016, is constant across all scenarios (leftmost stacked bar). New generation capacity is capacity chosen by the least-cost optimization model, Gridpath. New chosen capacity categories are shown in legend enclosed in the box. Annual capacity factors for Inga III are varied from 60% to 80%. Monthly energy budgets for Inga III are assumed to vary by season based on precipitation patterns. Capacity factors for wind are adjusted 25% down and solar PV 20% up to be similar to existing power plant generation in South Africa.
B.11 Existing, planned and new energy capacity investments

Figure 9: Wind (a, b) and solar PV (c, d) potential project areas within areas with active mining permits for exploitation (a, c) and exploration (b, d). Grey areas show mining permitted areas without suitable sites for ground-mounted wind or solar power. Mining permit data are from the DRC Ministry of Mines Mining Registry (CAMI).
54 Renewable Riches: How Wind and Solar Could Power DRC and South Africa
B.12 Cost Overruns of Inga 3
Figure #: Difference in annual overall system costs between scenarios with and without Inga III with varying cost overruns assuming World Bank capital costs of USD 14 billion. Positive values indicate higher system costs when Inga III is included in the generation mix. Both lines show cost differences for scenarios assuming a 70% annual capacity factor and seasonal variation in monthly energy generation for Inga III. In addition, dashed line assumes capacity factors for wind adjusted 25% down and solar PV 20% up to be similar to existing power plant generation in South Africa. Gray area indicates the range of cost differences for all scenarios.
Appendix C.
(a)
(c)
(b)
(d)