how (un)restrictive are we? - wodc · how (un)restrictive are we? ‘adjusted’ and ‘expected’...
TRANSCRIPT

Cahier 2015-10
How (un)restrictive are we?
‘Adjusted’ and ‘expected’ asylum recognition rates in Europe
A. Leerkes

Cahier
De reeks Cahier omvat de rapporten van onderzoek dat door en in opdracht van het
WODC is verricht.
Opname in de reeks betekent niet dat de inhoud van de rapporten het standpunt
van de Minister van Veiligheid en Justitie weergeeft.
Alle WODC-publicaties zijn gratis te downloaden van www.wodc.nl
Research and Documentation Centre (WODC) Cahier 2015-10 | 3
Acknowledgements
There are large international differences in the percentage of asylum requests that
states in the EU/EFTA area recognise. This study uses a statistical method to (a)
calculate adjusted recognition rates by country of asylum, net of international
differences in the composition of their asylum seeker population with respect to
country of origin, age and sex, and to (b) calculate expected recognition rates for
countries, when each of its asylum seekers would have had exactly that probability
of a positive decision that he or she would have had on average in the EU/EFTA area
as a whole based on his or her nationality, age and sex.
The analyses were primarily motivated by Parliamentary discussions in the
Netherlands, but they have a broader relevance: the methods could be used to help
monitor the degree to which European countries reach similar decisions in similar
cases.
I would like to thank the following persons for their valuable feedback during the
research project: Sabrina Benaouda (Ministry of Security and Justice, Directie Regie
Vreemdelingenketen), Carolus Grütters (Radboud University), Jasper Hoogendoorn
(Ministry of Security and Justice, Directie Migratiebeleid), David de Jong (Ministry of
Security and Justice, Advisory Committee on Migration Affairs), Peter Mascini
(Erasmus University Rotterdam), and Lambert Obermann (European Asylum
Support Office).
Prof Frans Leeuw
Director Research and Documentation Centre (WODC)

Research and Documentation Centre (WODC) Cahier 2015-10 | 5
Inhoud
Summary — 7
1 Introduction — 11 1.1 Background and research questions — 11 1.2 Broader relevance — 12 1.3 Method — 13 1.4 Limitations — 15
2 Results — 19 2.1 Adjusted recognition rates — 19 2.2 Expected recognition rates — 24 2.3 Additional analyses — 26 2.3.1 First instance decisions and final decisions — 26 2.3.2 Adjusted recognition rates and decisions per inhabitant — 28
3 Conclusion — 31
Samenvatting — 33
References — 39
Appendices
1 Methodology — 41 2 Coefficients regression models — 45 3 95% Confidence interval for the adjusted recognition rates — 57


Research and Documentation Centre (WODC) Cahier 2015-10 | 7
Summary
Backgrounds, objectives, and analyses conducted
There are large differences among European countries in the percentage of asylum
applications that states recognise. Such (first-instance) recognition rates are
generally seen as the best available indicator of the willingness of states to admit
asylum seekers. This is because these rates have been shown to be associated with
conditions in countries of asylum that can be assumed to impact a state’s
willingness to admit asylum seekers: recognition rates tend to be lower when
unemployment rates are high and/or when extreme right-wing parties are relatively
popular. At the individual level, too, the decision to recognise or reject an asylum
application is related to decision makers’ political convictions on role definition: a
vignette study among functionaries of the Dutch immigration and naturalisation
service found that decision makers with a relatively conservative orientation
rejected significantly more asylum applications than those with a more progressive
orientation.
However, first-instance recognition rates are also associated, as one would expect,
with societal conditions in asylum seekers’ countries of origin: recognition rates tend
to be higher for asylum seekers originating from politically unstable and/or unfree
countries than for those originating from relatively stable and free countries. In
other words, while the overall recognition rates for countries of asylum tend to be
seen as indicators of the willingness of these countries to admit asylum seekers, the
rates are also influenced (‘confounded’) by international differences in the
composition of the asylum population; countries of asylum receive different asylum-
seeker populations.
This study applies statistical techniques to improve the comparability of countries’
overall recognition rates. Firstly, it presents adjusted recognition rates for 2014. The
adjusted rate is the percentage of positive decisions in a country if international
differences in the composition of the asylum-seeker population with respect to
country of citizenship, age, and sex—other characteristics are not available via
Eurostat—are held statistically constant. This situation was simulated by calculating
a country’s recognition rate—given the decisions that it took in its jurisdiction in
comparison to what other European countries did in their jurisdictions—if that
country would have been responsible for all first-instance decisions in 2014 in the
EU/EFTA area as a whole (N≈400,000). Secondly, it presents expected recognition
rates for 2014. The expected recognition rate gives the percentage of positive
decisions in a country if each asylum applicant in that country would have had
exactly that probability of a positive decision that he or she had on average in 2014
in the EU/EFTA area as a whole based on his or her nationality, age, and sex (i.e.
under a kind of ‘statistical European norm’). Separate analyses were conducted for
the probability of a positive decision on international or national grounds, and a
positive decision on international grounds only (based on the Geneva conventions or
the European Convention on Human Rights). Similar analyses were conducted on all
first-instance decisions made in 2013. This led to largely similar results—indicating
that destination effects are relatively stable, at least in a short period—and only the
results for 2014 are reported. Finally, it was examined whether international
differences in the probability of a positive first-instance decision are annulled at later
stages of asylum procedures due to appeals, and whether countries with high
recognition rates tend to receive relatively few asylum seekers.
8 | Cahier 2015-10 Research and Documentation Centre (WODC)
Relevance
Since 2012, some members of the Dutch Parliament have voiced concerns about the
‘high’ percentage of positive decisions in the Netherlands, and have raised questions
as to why the Netherlands has a higher percentage of positive first-instance
decisions than most other EU/EFTA countries. The Dutch State Secretary for
Security and Justice replied that it is difficult to compare figures for different
countries because each country ‘is dealing with a different composition of countries
of origin’. It was also hypothesised that the ‘quick’ procedure in the Netherlands has
the effect of discouraging asylum seekers ‘who are not in need of protection against
return, but apply for asylum in order to obtain access to Europe’. The analysis helps
to establish the position of the Netherlands when composition effects are held
constant.
The findings also have broader relevance. Better indicators of destination effects are
useful to monitor whether the principle of equality before the law is being upheld:
the admission of asylum seekers is not, or at least not exclusively, a national
competence. This makes large international differences in asylum determination
outcomes problematic, especially when it concerns differences in the chances of
obtaining protection on international grounds. Large international differences in
decision outcomes, especially with regard to international protection, may also be
perceived as arbitrary, and potentially undermine the perceived legitimacy and
enforceability of asylum law. In the European context in particular, indicators of a
country’s willingness to admit asylum seekers that are not confounded by
composition effects could help implement the idea of ‘burden sharing’; i.e. the
principle that those who are in need of protection should be distributed fairly among
EU member states and the commitment of Member States to establishing a
Common European Asylum System (CEAS).
Results
International differences in recognition rates are found to become considerably
smaller after adjusting for composition effects. At the same time, substantial
differences persist, especially—but not exclusively—when positive decisions on
national grounds count as recognitions. When only the positive decisions on
international grounds—i.e. on the basis of the Geneva Conventions or the European
Convention on Human Rights—count as recognitions, countries with the highest
adjusted recognition rates are still observed, when making all the first instance
decisions in the EU/EFTA in 2014, to be recognising approximately twice as many
asylum applications than countries with the lowest adjusted recognition rates.
Net of the effects of international differences in asylum seekers’ origin, age, and
sex, the Netherlands no longer has a relatively high recognition rate and emerges as
a relatively ‘restrictive’ European country.
Discussion
Contrary to unadjusted rates, comparing adjusted recognition rates (or comparing
observed and expected recognition rates) is a better way of assessing countries’
relative willingness to admit asylum seekers. However, the adjusted and expected
rates still provide suggestive rather than definitive evidence on how (un)restrictive
countries are in their admission decisions. These rates should primarily be used to
ask additional questions on the lack of international convergence that remains. What
Research and Documentation Centre (WODC) Cahier 2015-10 | 9
could explain the high adjusted rates in country X? What explains the low rates of
country Y if they are not due to the compositional differences that are accounted
for? The scientific literature suggests that international differences in the willingness
to admit asylum seekers play a substantial role, for example in connection with
international differences in unemployment or differences in the popularity (and
political influence) of anti-immigration parties. Additionally, there may well be
certain procedural explanations (such as the Duldung system in Germany, see the
introduction). It therefore seems advisable to perform a comparative study on
similarities and differences between asylum procedures in the EU/EFTA area.
Several methodological limitations should be taken into consideration and the
findings should be interpreted with some caution (the main limitations are
mentioned in the introduction). Two limitations were overcome to some extent by
conducting explorative additional analyses. Firstly, no support was found for the
hypothesis that international differences in the outcome of first-instance decisions
are systematically repaired at later stages of the asylum procedure: the chances of
a positive final decision after a first-instance rejection are relatively low in most
countries, and there is no evidence that countries with low (adjusted) recognition
rates in the first instance eventually accept an extraordinarily high number of
asylum seekers due to successful appeals or repeated asylum applications. This
finding underscores the importance of the first-instance decisions. Secondly, no
evidence was found that countries with the highest (adjusted) recognition rates
receive fewer asylum seekers, which could indicate that they can ‘afford’ high
recognition rates because they are discouraging asylum applications more than
other countries. Quite to the contrary, it turns out that countries with high
(adjusted) recognition rates tend to receive more, not fewer, asylum applications
per inhabitant. A possible explanation for this pattern is that asylum seekers try to
apply for asylum in countries with relatively high (perceived) admission chances.
This observation, too, confirms that first-instance recognition rates matter, and that
it is important to optimise the comparability of these rates by calculating ‘adjusted’
and/or ‘expected’ recognition rates, using the available information on asylum
seekers’ nationality, age, and sex.


Research and Documentation Centre (WODC) Cahier 2015-10 | 11
1 Introduction
1.1 Background and research questions
There are large differences among European countries in the percentage of asylum
requests that states recognise. In 2014, according to the 14-05-2014 Eurostat
update,1 47% of all first instance decisions in the European Union and the EFTA
states2 (hereafter: EU/EFTA) were positive, but that figure ranged from 9% for
Hungary to 94% for Bulgaria.3 The Netherlands reached a positive decision in 67%
of the cases, and ranked sixth in the EU/EFTA area as to the highest percentage of
positive first instance decisions (after Bulgaria, Sweden, Cyprus, Malta and
Switzerland).4
Since 2012, some members of the Dutch Parliament have voiced concerns about the
‘high’ percentage of positive decisions in the Netherlands, and have raised questions
as to why the Netherlands has a higher percentage of positive first instance
decisions than most other EU/EFTA countries.5 The State Secretary for Security and
Justice replied that it is difficult to compare figures for different countries because
each country ‘is dealing with a different composition of countries of origin’.6
Furthermore, it was pointed out that the Dutch figures also include family members
who receive what is called a ‘dependent asylum permit’ after reuniting with an
admitted asylum seeker. In other EU/EFTA countries, such permits are, according to
the State Secretary, not included in the positive decisions. Additionally, it was
hypothesised that the ‘quick’ procedure in the Netherlands has the effect of
discouraging asylum seekers ‘who are not in need of protection against return, but
apply for asylum in order to obtain access to Europe’ ‘[“[die] geen bescherming
tegen terugkeer behoeven maar asiel aanvragen om zich toegang tot Europa te
verschaffen”].7
After these Parliamentary debates, the Eurostat figures for the Netherlands were
brought into line with the EASO directives by excluding various categories of
recognitions involving reuniting family members. However, the adjustments barely
affected the Netherlands’ position in the EU/EFTA area. On the basis of the original
2013 (Eurostat, 2014), which included recognitions involving reuniting family
members, the Netherlands ranked fifth. As was mentioned, the Netherlands ranked
1 All figures on first instance decisions in 2014 are based on the Eurostat 14-05-2015 update. Figures may have
changed somewhat due to more recent updates.
2 Norway, Switzerland, Iceland, Liechtenstein.
3 In Liechtenstein, the percentage of positive decisions was even lower than in Hungary (0%), but Liechtenstein
only took 10 decisions in 2014. (Liechtenstein was excluded from the analysis.)
4 Liechtenstein is not included in this ranking.
5 On April 4 2014, Member of Parliament Mr. Azmani, a member of the People’s Party for Freedom and Democracy
(VVD), questioned the State Secretary for Security and Justice after having read an Eurostat news release on the
increase of asylum requests in 2013. Mr. Azmani wanted to know why the percentage of positive decisions is
relatively high in the Netherlands. Similar questions were asked in 2012 and 2013 by the Members of Parliament
Mrs. Van Nieuwenhuizen (VVD) and Mr. Fritsma of the Party for Freedom (PVV). For the Parliamentary questions
see: Kamervragen 2014Z06205, 2013-2014, Aanhangsel van Handelingen II 2011/12, 3132, and Aanhangsel van
Handelingen II, 2012/13, 2591. For the Eurostat news release, see Eurostat, ‘Large increase to almost 435,000
asylum applicants registered in the EU28 in 2013’, Stat/14/46, 24 March 2014.
6 Aanhangsel van Handelingen II 2013/2014, 1909.
7 Aanhangsel van Handelingen II 2013/2014, 1909.
12 | Cahier 2015-10 Research and Documentation Centre (WODC)
sixth on the basis of the 2014 figures, which no longer include the reuniting family
members who are to be excluded on the basis of Eurostat definitions.8
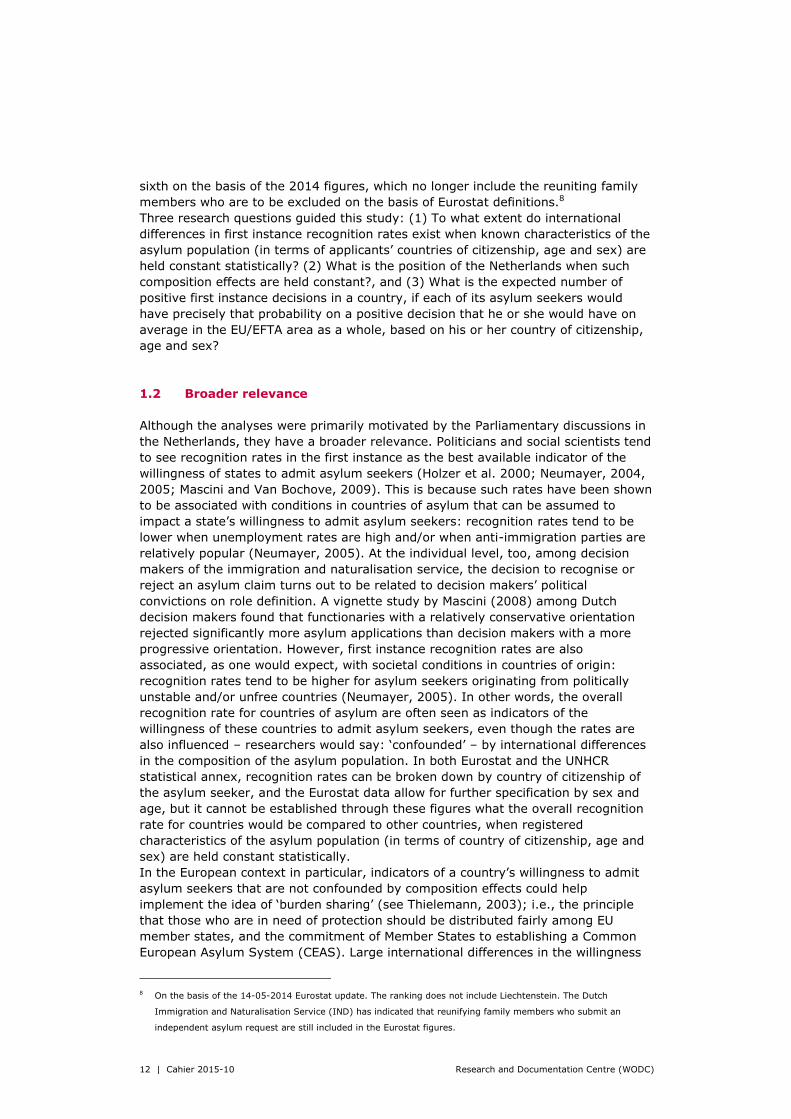
Three research questions guided this study: (1) To what extent do international
differences in first instance recognition rates exist when known characteristics of the
asylum population (in terms of applicants’ countries of citizenship, age and sex) are
held constant statistically? (2) What is the position of the Netherlands when such
composition effects are held constant?, and (3) What is the expected number of
positive first instance decisions in a country, if each of its asylum seekers would
have precisely that probability on a positive decision that he or she would have on
average in the EU/EFTA area as a whole, based on his or her country of citizenship,
age and sex?
1.2 Broader relevance
Although the analyses were primarily motivated by the Parliamentary discussions in
the Netherlands, they have a broader relevance. Politicians and social scientists tend
to see recognition rates in the first instance as the best available indicator of the
willingness of states to admit asylum seekers (Holzer et al. 2000; Neumayer, 2004,
2005; Mascini and Van Bochove, 2009). This is because such rates have been shown
to be associated with conditions in countries of asylum that can be assumed to
impact a state’s willingness to admit asylum seekers: recognition rates tend to be
lower when unemployment rates are high and/or when anti-immigration parties are
relatively popular (Neumayer, 2005). At the individual level, too, among decision
makers of the immigration and naturalisation service, the decision to recognise or
reject an asylum claim turns out to be related to decision makers’ political
convictions on role definition. A vignette study by Mascini (2008) among Dutch
decision makers found that functionaries with a relatively conservative orientation
rejected significantly more asylum applications than decision makers with a more
progressive orientation. However, first instance recognition rates are also
associated, as one would expect, with societal conditions in countries of origin:
recognition rates tend to be higher for asylum seekers originating from politically
unstable and/or unfree countries (Neumayer, 2005). In other words, the overall
recognition rate for countries of asylum are often seen as indicators of the
willingness of these countries to admit asylum seekers, even though the rates are
also influenced – researchers would say: ‘confounded’ – by international differences
in the composition of the asylum population. In both Eurostat and the UNHCR
statistical annex, recognition rates can be broken down by country of citizenship of
the asylum seeker, and the Eurostat data allow for further specification by sex and
age, but it cannot be established through these figures what the overall recognition
rate for countries would be compared to other countries, when registered
characteristics of the asylum population (in terms of country of citizenship, age and
sex) are held constant statistically.
In the European context in particular, indicators of a country’s willingness to admit
asylum seekers that are not confounded by composition effects could help
implement the idea of ‘burden sharing’ (see Thielemann, 2003); i.e., the principle
that those who are in need of protection should be distributed fairly among EU
member states, and the commitment of Member States to establishing a Common
European Asylum System (CEAS). Large international differences in the willingness
8 On the basis of the 14-05-2014 Eurostat update. The ranking does not include Liechtenstein. The Dutch
Immigration and Naturalisation Service (IND) has indicated that reunifying family members who submit an
independent asylum request are still included in the Eurostat figures.

Research and Documentation Centre (WODC) Cahier 2015-10 | 13
to recognise asylum seekers are clearly at odds with the principles, also because
asylum seekers who find themselves being rejected in a relatively restrictive country
cannot, according to the Dublin Regulation, be admitted in a different (more
permissive) European country. Outside the European context, too, a better indicator
is useful to monitor whether the principle of equality before the law is being upheld:
the admission of asylum seekers is not, at least not exclusively, a national
competence, making large international differences in asylum determination
outcomes problematic, especially when there are differences in the chances of
obtaining protection on international grounds, i.e. because of the Geneva
Conventions or, in the European context, because of subsidiary protection status
under the European Convention on Human Rights (ECHR). Large international
differences in decision outcomes, especially with regard to international protection,
may also be perceived as arbitrary, and can potentially undermine the perceived
legitimacy and enforceability of asylum law (cf. Leerkes, forthcoming).
1.3 Method
This study reports the results of a statistical method to (a) adjust countries’ first
instance recognition rates for international differences regarding three
characteristics of the asylum seeker population – its composition in terms of (1)
national origin, (2) age, (3) sex – and (b) to calculate expected recognition rates for
each EU/EFTA country, given its unique asylum seeker population, but assuming
that its decisions are in line with the admission chances in the EU/EFTA area as a
whole for the kind of asylum seekers that it receives. Eurostat defines first instance
decisions as follows: ‘decisions (positive and negative) considering applications for
international protection as well as the grants of authorisations to stay for
humanitarian reasons, including decisions under priority and accelerated procedures
taken by administrative or judicial bodies in Member States’. Eurostat distinguishes
first instance decisions from ‘final decisions’: ‘decision[s] taken by administrative or
judicial bodies in appeal or in review and which are no longer subject to remedy’.9
The adjusted recognition rate gives the estimated percentage of positive first
instance decisions in each EU/EFTA country, had all EU/EFTA countries received the
same complex asylum seeker population in terms of country of origin, age, and sex.
This condition is simulated statistically by assuming that each country would have
made all the decisions in the EU/EFTA area as a whole, using an estimate of its
relative (un)restrictiveness based on the decisions that it actually took in its own
jurisdiction compared to what other countries did. The adjusted rates are especially
useful to rank countries in terms of their restrictiveness when composition effects
are held constant, and to illustrate the magnitude of international differences that
remain among the EU/EFTA countries after measured international differences in the
composition of asylum seeker populations are held constant. The regression models
underlying the adjusted rates estimate how variance in decision outcomes, which
cannot be predicted by country of citizenship (‘the origin effect), age (‘the age
effect’), and sex (‘the sex effect’), is related to country of asylum (indicating a kind
of ‘destination effect’).
The expected recognition rate gives the expected percentage of positive decisions in
each EU/EFTA country under the assumption that asylum seekers’ chances of a
9 It is somewhat unclear what is exactly included in the final decisions, given the following remark in the Eurostat
‘metadata’: ‘[I]t is not intended that asylum statistics should cover rare or exceptional cases determined by the
highest courts. Thus, the statistics related to the final decisions should refer to what is effectively a final decision
in the vast majority of all cases: i.e. that all normal routes of appeal have been exhausted.’

14 | Cahier 2015-10 Research and Documentation Centre (WODC)
positive decision in that country would be equal to their expected (average) chances
of a positive decision in the EU/EFTA area as a whole, based on their country of
citizenship, age and sex. Comparing expected rates to observed rates (the observed
recognition rate is the rate that is normally reported by Eurostat) is especially useful
when attempting to estimate how many more, or less, positive decisions were
reached in country X compared to what one would expect in such a situation when
applying a European (statistical) norm. Such expected rates could perhaps be
included in regular Eurostat reports: Is a recognition rate for country X really that
high or low given what one would expect for the kind of asylum seekers it is dealing
with? The regression models underlying the expected rates estimate the (average)
origin, age, and sex effects in the EU/EFTA area as a whole, and then apply these
average admission chances for different types of asylum seekers to the asylum
population that country X was dealing with. The details of the statistical models
underlying the adjusted and expected recognition rates are reported in Appendices
1, 2 and 3.
The analyses are based on all first instance decisions reached in 2014 by 30
EU/EFTA countries on all asylum requests (both first and eventual additional
requests) submitted in 2014 or earlier. Two EU/EFTA countries were excluded from
the analyses: Austria had not yet submitted Eurostat asylum data for 2014 and
Liechtenstein took too few decisions in 2014 for statistical analysis. Besides
Liechtenstein, another eight EU/EFTA countries reached fewer than 500 first
instance decisions in 2014 (Estonia, Croatia, Latvia, Lithuania, Portugal, Slovenia,
Slovakia, and Iceland). The results for these eight countries are relatively unreliable
because of the low numbers and Eurostat’s practice to round data to the nearest
five, and are therefore only reported in Appendix 2. The year 2014 was chosen
because it was the most recent year available, and because the data were expected
to be more comparable than for 2013: contrary to other years, and in accordance
with Eurostat stipulations, the 2014 data are no longer supposed to include negative
decisions concerning asylum seekers who had already been rejected in another
European country that had accepted responsibility for the asylum seeker under the
Dublin regulation. 10 (According to the Dutch Immigration and Naturalisation Service
(IND) the data for the Netherlands still include such decisions, as it is not yet
possible to exclude them for technical reasons). All data are from the Eurostat
14-05-2015 update; figures may have changed to some extent due to more recent
updates. Similar analyses were conducted on all first instance decisions taken in
2013. This led to largely similar results – indicating that destination effects are
relatively stable, at least in a short period – and only the results for 2014 are
reported here.11
Separate analyses were conducted for (1) all positive decisions, i.e., positive
decision on international grounds (Geneva Conventions, ECHR) or on national
grounds (what is often called ‘humanitarian protection’) and (2) positive decisions
on international grounds, i.e., on the basis of the Geneva convention or the ECHR.
10 Negative decisions involving applicants with an asylum residence permit issued by a different European country
are still supposed to be included in the counts.
11 The 30 EU/EFTA countries each have a ranking derived from their odds ratios in Model 3 and 6, respectively
(figure 1 and 2 show the ranking order of the countries when eight ‘smaller’ countries are excluded from the
ranking). Similar ranking orders were calculated for 2013, and the correlation between the 2013 and the 2014
ranking order was calculated using Spearman’s rho. When comparing the two adjusted ranking orders for 2013
and 2014 (for all positive decisions and decisions on international grounds), Spearman’ rho equals 0.74 and 0.76
respectively. This means that the position of countries does change somewhat from year to year, but that the
ranking order does not change fundamentally, at least not in such a relatively short time span.

Research and Documentation Centre (WODC) Cahier 2015-10 | 15
In the statistical models underlying the latter rates, positive decisions on national
grounds were merged with rejections (see Appendix 1).
It was decided to also control for sex and age because research indicates that both
variables matter in admission decisions: Mascini and Van Bochove (2009) have
shown that male and single claimants have lower success rates in the Dutch asylum
procedure, a pattern that the authors attribute to a tendency among decision
makers to stereotype single male applicants as criminal or ‘bogus’ refugees. For the
present purposes, one can be agnostic about the precise mechanisms explaining
such patterns. It could also be that single male applicants are rightfully rejected
more than applicants with other demographic characteristics, because a relatively
large number of single males do mostly migrate for economic reasons. What is
important here is that sex and age, like country of citizenship, can be assumed to
predict the outcome of admission decisions, quite independently of where the
asylum request has been submitted. (The analyses confirm that sex and age indeed
tend to be related to decision outcomes across the EU/EFTA area in similar ways).12
1.4 Limitations
Comparing adjusted recognition rates for countries, or comparing their expected
recognition rates to their observed rates, is a better way of establishing the relative
overall willingness of a country to recognise asylum applications than by merely
looking at unadjusted, actually observed rates. The analyses are capable of
identifying systematic differences that remain after origin, age and sex effects are
held constant. While the models are quite powerful – it turns out 84% of the
decision outcomes in Europe in 2014 can be predicted adequately on the basis of
country of origin, country of asylum, age and sex13 – it should be emphasised that
they are not perfect; the adjusted and expected rates provide us with better
indicators, but still give suggestive rather than definitive evidence on the relative
willingness of countries to grant asylum requests. As such, they are mostly useful to
generate additional questions: Why does country X or Y deviate from the general
pattern if not because of the compositional differences that are accounted for by the
models? Why does the expected recognition rate for country X or Y differ so much
from their observed rates? When reading the results, the following limitations should
be kept in mind:
1 The validity of the results depends on the quality (correctness, completeness,
comparability) of the administrative data that have been made available by
Eurostat. The IND and the European Asylum Support Office (EASO) have
indicated that various steps have been taken in recent years to improve the
quality of the data. For example, data about reuniting family members were
excluded for the Netherlands for 2013 and 2014, and certain categories of
inadmissible asylum requests (‘rejected Dublin claimants’) are now supposed to
be excluded from the Eurostat data. The quality of the data could not be assessed
independently as part of this research project (this would be a large research
project in and of itself). It is probable that there still are certain procedural
12 There is no EU/EFTA country where being male is associated with significantly higher chances of receiving a
positive decision at the p=.01 level, but there are 16 EE/EFTA countries where they have significantly lower
chances than females. There are only three EEA countries (Denmark, Greece, UK) where another age category
has significantly lower chances of a positive decision at the p=.01 level than the 18-34 age category. (In
Denmark and Greece, the lowest probability of a positive decision is associated with the 65+ age category; in the
UK it is the 35-64 category.)
13 See appendix 2, Model 3.

16 | Cahier 2015-10 Research and Documentation Centre (WODC)
differences between countries.14 In any event, it is clear that future research
would benefit from (1) making data available on the outcomes of first asylum
requests, and (2) excluding all decisions that pertain to ‘inadmissable’ asylum
requests (not just of persons who have already been rejected in a different
‘Dublin’ country).
2 The characteristics of the asylum population may differ between EU countries in
unmeasured ways. For example, it may be that Iraqis in Sweden are from
different regions or groups in Iraq than Iraqis who apply for asylum in Greece,
and that Iraqis who find themselves being rejected in Greece would also be
rejected in Sweden. This is called the problem of ‘unobserved heterogeneity’.
Although the large number of observations should reduce the influence of
‘coincidental’ differences between countries, possible problems of unobserved
structural international differences can only be reduced if additional information
were made available (for example if countries also began registering the asylum
seeker’s region of origin). To completely dispense with the problem, countries
should conduct an experiment and randomly distribute asylum applications
among the EU/EFTA countries for assessment (provided that countries would then
make decisions as they normally do).
3 A low adjusted recognition rate in the first instance may erroneously indicate low
protection levels. Rejections of asylum applications in the first instance may be
annulled by positive decisions at a later stage as a result of successful appeals
and revised decisions. Countries with low recognition rates in the first instance
could end up admitting a similar number of asylum seekers to the extent that a
large number of rejected asylum seekers successfully manage to appeal against
these rejections. This limitation can only be overcome if countries began
registering cohort data, so that asylum seekers can be followed during different
stages of the asylum procedure. In the absence of such cohort data, it was
nonetheless possible to look at the ratio between the number of first instance
rejections and positive final decisions (taking a longer period so as to reduce the
influence of fluctuations in cohort sizes), and to examine whether that ratio is
systematically different for countries with a low or high (adjusted) percentage of
positive decisions in the first instance (see section 2.3 for the results).
4 There are other ways in which low recognition rates may underestimate
protection levels. In Germany, for example, a significant number of asylum
seekers receive what is called Duldung (Morris, 2001). Such individuals, who are
exempted from deportation for the duration of the Duldung status, are often
housed in reception centres and may even have access to the German labour
market. Duldung is not considered a residence permit, however, and such
persons therefore end up in the Eurostat data as rejections. (By implication, one
could argue that the German recognition rate probably underestimates protection
levels compared to other countries). It is unknown how many other European
countries make use of Duldung-like arrangements. Similarly, there may be
EU/EFTA countries with low deportation risks where rejected asylum seekers
obtain a kind of de facto protection as unauthorized immigrants. Future research
could look at such factors by examining ‘Assisted Voluntary Return’ (AVR) and
deportation rates.
14 For example, in the Netherlands the Immigration and Naturalisation Service (IND) first communicates an
‘intention’ (voornemen) to the asylum seeker indicating whether it intends to honour or reject the asylum
request. The asylum seeker may respond with a ‘perspective’ (zienswijze), possibly leading to a positive first
instance decision after a negative intention. It may be that in other countries, similar cases would end up in the
Eurostat data as first instance rejections.

Research and Documentation Centre (WODC) Cahier 2015-10 | 17
5 Conversely, a high (adjusted) recognition rate does not necessarily indicate a
high willingness to protect asylum seekers. Some countries with high recognition
rates may actually be discouraging asylum applications more than other
countries, for example by ‘pushing back’ potential applicants at the border, or by
granting asylum residence permit holders fewer rights, thereby minimising the
advantage of applying for asylum over staying in the country irregularly. Then,
when almost nobody is able or willing to apply for asylum, the few who do can be
accepted easily. This problem is difficult to solve, but it was possible to examine
whether countries with high (adjusted) recognition rates tend to receive few
applications per inhabitant (the results are reported in section 2.3).
6 There may be significant regional variation within countries of asylum in how
asylum applications are dealt with. Research in the Netherlands and Switzerland
shows that in some regions, the chances of a positive decision may be
significantly higher than in other regions (Holzer et al., 200; Mascini, 2002). The
present study only looks at national ‘averages’.
7 Finally, a country’s overall adjusted recognition rate may mask that its willingness
to admit asylum seekers, compared to other receiving countries, varies
considerably between different categories of asylum seekers. It may be, for
example, that country X has a relatively high overall (adjusted) recognition rate,
because it recognises claims by certain categories of asylum seekers more than
other countries, while it is actually less willing than other EU/EFTA countries to
admit asylum seekers with other characteristics (Finland and Lithuania, for
example, seemed to be especially unrestrictive to Ukrainian asylum seekers in
2014). Such interaction effects, which could be explored in future analyses, were
not included in the present study due to a lack of existing research on relevant
interactions. (Similarly, there is a possibility that other variables, such as age,
have different effects for different groups of asylum seekers. For example, men of
working age may be more likely to be (seen as) ‘economic migrants’ than women
of working age.)


Research and Documentation Centre (WODC) Cahier 2015-10 | 19
2 Results
2.1 Adjusted recognition rates
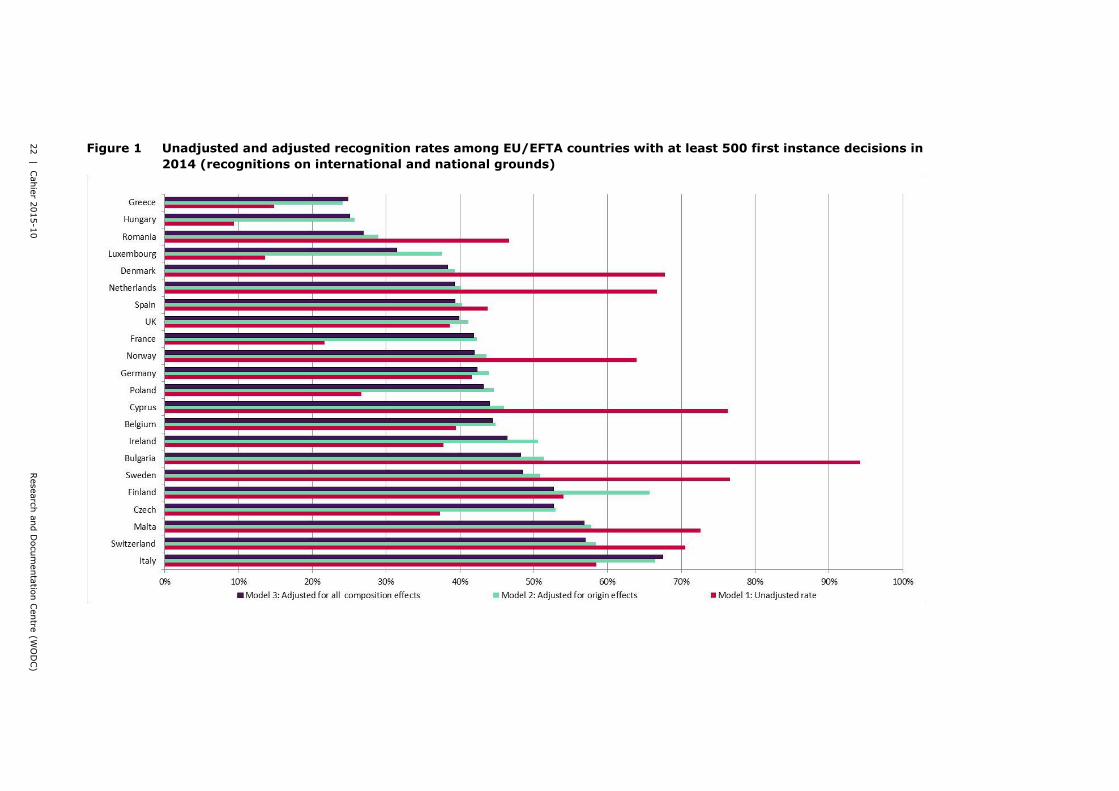
Figure 1 presents three recognition rates for 22 ‘larger’ EU/EFTA countries that
made more than 500 first instance decisions in 2014: one unadjusted rate (Model 1)
and two adjusted rates (Model 2 and Model 3). In the analyses underlying the
figures in Figure 1, all positive first instance decisions count as recognitions, so both
on international grounds (‘Geneva’, ‘ECHR’) and on national grounds (‘humanitarian
status’). The countries are sorted by their final adjusted rate – from low to high –,
i.e., the rate that adjusts for compositional differences in asylum seekers’ national
origin, age and sex (Model 3).
The total number of first instance decisions by EU/EFTA country is shown in Table 1
in section 2.2. The fewer decisions a country makes, the more unreliable the
statistical estimates become, also because of Eurostat’s practice of rounding figures
in cells to the nearest 5. Tentative rates for eight countries (Estonia, Croatia, Latvia,
Lithuania, Portugal, Slovenia, Slovakia and Iceland) are therefore only reported in
Appendix 2, which also shows the 95% confidence intervals for all adjusted rates. In
Croatia, Iceland, Latvia and Slovenia the adjusted recognition rates seem to have
been well below the European average; in three ‘smaller’ countries (Estonia,
Portugal and Slovakia) the rates do not differ from the European average, and the
adjusted rate of only one ‘smaller’ country (Lithuania) seems to be above the
European average.
The first rate (Model 1) is the unadjusted recognition rate for countries and is equal
to what Eurostat normally reports. The adjustment of the rate proceeds in two
steps. The second rate illustrates the estimated relative (un)restrictiveness of
individual countries, net of origin effects (without making use of information about
asylum seekers’ age or sex). The third rate gives the percentage of positive first
instance decisions that is estimated to have been reached by the EU/EFTA country
net of origin, age, and sex effects (the regression model underlying the latter rate
also makes use of information about asylum seekers’ registered age and sex). The
two adjusted rates indicate the percentage of positive first instance decisions that
each country is estimated to reach had it taken all the decisions in the EU/AREA in
2014.
Among the 22 EU/EFTA countries that reached at least 500 first instance decisions in
2014, the country with the lowest recognition rate after all adjustments (Model 3)
turns out to be Greece, which, according to the statistical models, would have
reached a positive decision in 25% of the cases, had it made all the first instance
decisions in the EU/EFTA in 2014. The EU/EFTA country with the highest final
adjusted recognition rate turns out to be Italy, which is estimated to have reached a
positive decision in 68% of the cases (2.7 times more positive decisions than
Greece).
For several countries, including the Netherlands, the adjusted rates differ
considerably from the unadjusted rate. Bulgaria’s recognition rate, for instance,
goes down from 94% (unadjusted rate) to 48% (final adjusted rate). The reason for
that decrease is that Bulgaria’s decisions often involved Syrians, more so than in
other EU/EFTA countries. 15 Syrians had high recognition chances throughout the
15 Destination effects become more difficult to model for countries with relatively homogeneous asylum seeker
populations, such as Bulgaria. However, the VIF values (calculated with the collin package for Stata) do not
indicate serious multicollinearity issues (all VIF values are 5.0 or lower, usually approximately 1, with the
20 | Cahier 2015-10 Research and Documentation Centre (WODC)
EU/EFTA in 2014, so if a country received many Syrians, its recognition rate is likely
to increase considerably because of that ‘origin effect’. The adjustments remove the
effects of such compositional differences.
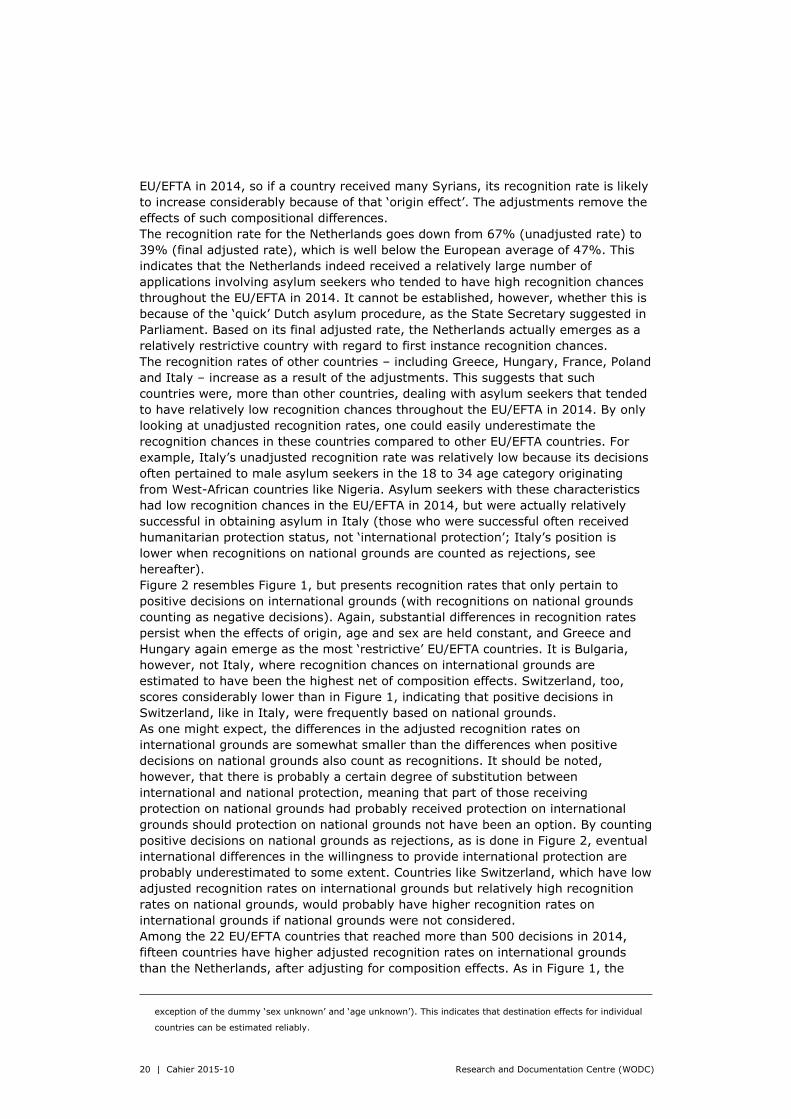
The recognition rate for the Netherlands goes down from 67% (unadjusted rate) to
39% (final adjusted rate), which is well below the European average of 47%. This
indicates that the Netherlands indeed received a relatively large number of
applications involving asylum seekers who tended to have high recognition chances
throughout the EU/EFTA in 2014. It cannot be established, however, whether this is
because of the ‘quick’ Dutch asylum procedure, as the State Secretary suggested in
Parliament. Based on its final adjusted rate, the Netherlands actually emerges as a
relatively restrictive country with regard to first instance recognition chances.
The recognition rates of other countries – including Greece, Hungary, France, Poland
and Italy – increase as a result of the adjustments. This suggests that such
countries were, more than other countries, dealing with asylum seekers that tended
to have relatively low recognition chances throughout the EU/EFTA in 2014. By only
looking at unadjusted recognition rates, one could easily underestimate the
recognition chances in these countries compared to other EU/EFTA countries. For
example, Italy’s unadjusted recognition rate was relatively low because its decisions
often pertained to male asylum seekers in the 18 to 34 age category originating
from West-African countries like Nigeria. Asylum seekers with these characteristics
had low recognition chances in the EU/EFTA in 2014, but were actually relatively
successful in obtaining asylum in Italy (those who were successful often received
humanitarian protection status, not ‘international protection’; Italy’s position is
lower when recognitions on national grounds are counted as rejections, see
hereafter).
Figure 2 resembles Figure 1, but presents recognition rates that only pertain to
positive decisions on international grounds (with recognitions on national grounds
counting as negative decisions). Again, substantial differences in recognition rates
persist when the effects of origin, age and sex are held constant, and Greece and
Hungary again emerge as the most ‘restrictive’ EU/EFTA countries. It is Bulgaria,
however, not Italy, where recognition chances on international grounds are
estimated to have been the highest net of composition effects. Switzerland, too,
scores considerably lower than in Figure 1, indicating that positive decisions in
Switzerland, like in Italy, were frequently based on national grounds.
As one might expect, the differences in the adjusted recognition rates on
international grounds are somewhat smaller than the differences when positive
decisions on national grounds also count as recognitions. It should be noted,
however, that there is probably a certain degree of substitution between
international and national protection, meaning that part of those receiving
protection on national grounds had probably received protection on international
grounds should protection on national grounds not have been an option. By counting
positive decisions on national grounds as rejections, as is done in Figure 2, eventual
international differences in the willingness to provide international protection are
probably underestimated to some extent. Countries like Switzerland, which have low
adjusted recognition rates on international grounds but relatively high recognition
rates on national grounds, would probably have higher recognition rates on
international grounds if national grounds were not considered.
Among the 22 EU/EFTA countries that reached more than 500 decisions in 2014,
fifteen countries have higher adjusted recognition rates on international grounds
than the Netherlands, after adjusting for composition effects. As in Figure 1, the
exception of the dummy ‘sex unknown’ and ‘age unknown’). This indicates that destination effects for individual
countries can be estimated reliably.

Research and Documentation Centre (WODC) Cahier 2015-10 | 21
Netherlands is located at the upper end of the lowest tier. Except for Switzerland
and Greece, all EU/EFTA countries receiving a relatively large number of asylum
applications in 2014 – including Germany, France, Sweden, Italy, Denmark and the
United Kingdom – have higher adjusted recognition rates on international grounds
than the Netherlands.
While international differences in recognition rates persist, they do become
considerably smaller when composition effects are controlled. This can be
established visually in Figures 1 and 2 by looking at the countries with the lowest
and highest recognition rates: the values at both ends of the spectrum clearly
become less extreme after adjustment. It can also be established that the rates
change most when origin effects are held constant. This indicates that international
differences in recognition rates are more the result of international differences in
asylum seekers’ origin than of differences in their age or sex. Country of citizenship
is also the best predictor of the decision outcome in the models underlying the
adjusted rates, followed by country of asylum, age and sex. (Age and sex generally
predict decision outcomes in ways that are in line with Mascini and Van Bochove ‘s
(2009) findings for the Netherlands, regardless of whether their explanation of such
patterns is right; see the coefficients in Appendix 2).
22 | Cahier 2015-10 Research and Documentation Centre (WODC)
Figure 1 Unadjusted and adjusted recognition rates among EU/EFTA countries with at least 500 first instance decisions in
2014 (recognitions on international and national grounds)
22 | C
ahie
r 2015-1
0
Researc
h a
nd D
ocum
enta
tion C
entre
(WO
DC)

Research and Documentation Centre (WODC) Cahier 2015-10 | 23
Figure 2 Unadjusted and adjusted recognition rates among EU/EFTA countries with at least 500 first instance decisions in
2014 (recognitions on international grounds only)
Researc
h a
nd D
ocum
enta
tion C
entre
(WO
DC)
Cahie
r 2015-1
0 | 2
3

24 | Cahier 2015-10 Research and Documentation Centre (WODC)
2.2 Expected recognition rates
The previous section reported adjusted rates, i.e., rates that countries are estimated
to reach had they received the same complex asylum population in terms of
citizenship, age and sex. These rates are useful to ‘rank’ countries net of
composition effects. We can also ask a slightly different question: what would the
percentage of positive decisions in country X need to be – given its unique asylum
seeker population (in terms of country of origin, age and sex) – if its decision
outcomes are to be exactly in line with the ‘European’ average for such asylum
seekers, i.e., if each of its asylum seekers would have had exactly that probability of
a positive decision that he or she would have had on average in the EU/EFTA area
as a whole based on his or her nationality, age and sex?
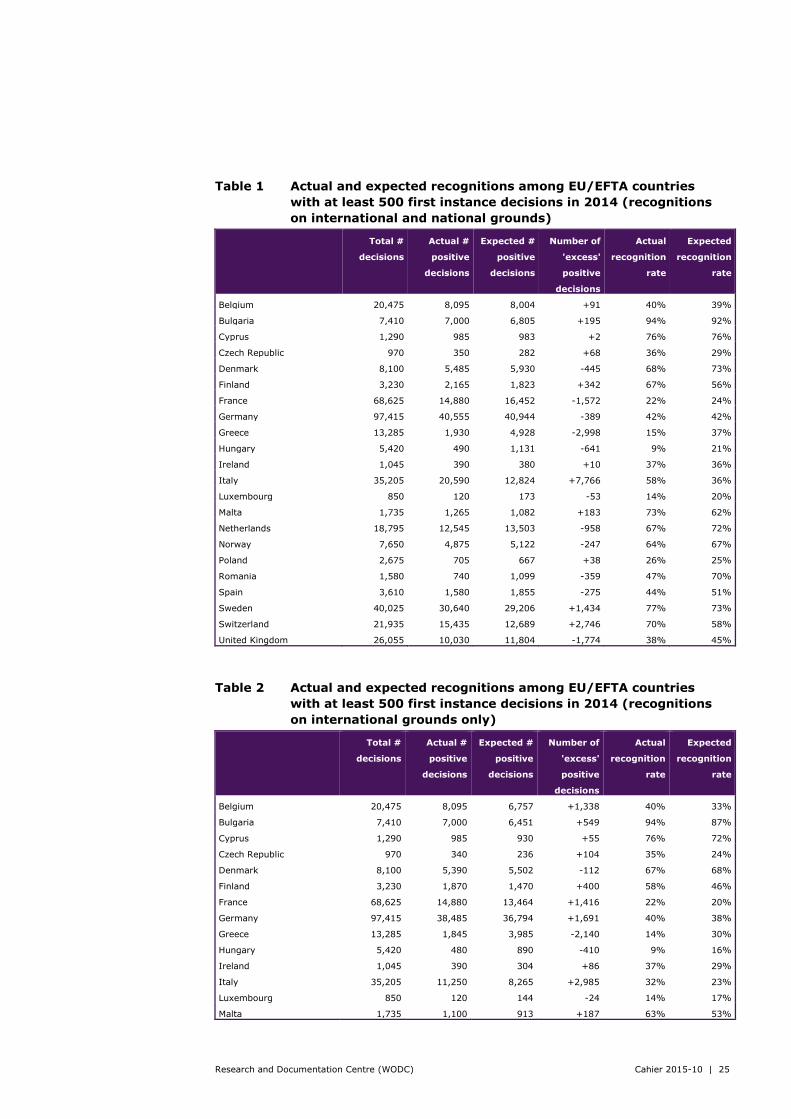
The results for the 22 EU/EFTA countries that took more than 500 first instance
decisions in 2014 are presented in Table 1 and Table 2: Table 1 shows the results
when all positive decisions count as recognitions; Table 2 shows the results when
only positive decisions on international grounds count as recognitions. Contrary to
section 2.2, all expected recognition rates make use of information on the
applicant’s country of origin, age and sex; no separate expected recognition rates
are shown that are solely based on information about asylum seekers’ country of
origin. Appendix 3 shows the 95% confidence intervals of these expected rates, and
also shows tentative results for the eight EU/EFTA countries that took less than 500
decisions.
In countries with low adjusted recognition rates, the actually observed recognition
rate is significantly lower than the expected recognition rate. For example, given the
asylum population found in Greece, according to the model this country was
expected to reach 4,928 positive decisions in 2014 instead of the 1,930 positive
decisions that it actually took out of 13,285 first instance decisions. In other words,
Greece admitted 2,998 fewer asylum seekers than one would expect given the type
of asylum seekers that it received and the decision patterns in Europe at large.
While the observed recognition rate for Greece was 15%, one would expect a
recognition rate of 37%. Sweden, by contrast, has an expected recognition rate of
73% and an observed rate of 77%, and admitted 1,434 more asylum seekers than
one would expect given the kind of asylum seekers it was dealing with. Given the
composition of the asylum population that the Netherlands received, one would
expect a 72% recognition rate instead of the 67% that it actually realised, possibly
indicating that about a thousand (958) rejected asylum seekers in the Netherlands
may have received a positive decision had they been distributed randomly over the
EU/EFTA area as a whole (but matching the international distribution of asylum
decisions for 2014), and applied for asylum in the country where they happened to
be sent to.
When only positive decisions on international grounds count as recognitions, largely
similar patterns are found, but the difference between the observed and expected
rates is smaller for countries admitting a relatively large number of asylum seekers
on national grounds, such as Italy and Switzerland. Based on the degree of
international protection that asylum seekers with the characteristics found in the
Netherlands obtained in the 30 EU/EFTA countries as a whole, one would expect a
recognition rate for the Netherlands of 67% on international grounds, against the
actually observed rate on international grounds of 63% – possibly indicating that
785 asylum seekers who were rejected in the Netherlands in 2014 may have
received international protection had they been distributed randomly over the
EU/EFTA area as a whole (but matching the actual international distribution of
asylum decisions for 2014), and had they been assessed by the EU/EFTA country
where they happened to find themselves.
Research and Documentation Centre (WODC) Cahier 2015-10 | 25
Table 1 Actual and expected recognitions among EU/EFTA countries
with at least 500 first instance decisions in 2014 (recognitions
on international and national grounds)
Total #
decisions
Actual #
positive
decisions
Expected #
positive
decisions
Number of
'excess'
positive
decisions
Actual
recognition
rate
Expected
recognition
rate
Belgium 20,475 8,095 8,004 +91 40% 39%
Bulgaria 7,410 7,000 6,805 +195 94% 92%
Cyprus 1,290 985 983 +2 76% 76%
Czech Republic 970 350 282 +68 36% 29%
Denmark 8,100 5,485 5,930 -445 68% 73%
Finland 3,230 2,165 1,823 +342 67% 56%
France 68,625 14,880 16,452 -1,572 22% 24%
Germany 97,415 40,555 40,944 -389 42% 42%
Greece 13,285 1,930 4,928 -2,998 15% 37%
Hungary 5,420 490 1,131 -641 9% 21%
Ireland 1,045 390 380 +10 37% 36%
Italy 35,205 20,590 12,824 +7,766 58% 36%
Luxembourg 850 120 173 -53 14% 20%
Malta 1,735 1,265 1,082 +183 73% 62%
Netherlands 18,795 12,545 13,503 -958 67% 72%
Norway 7,650 4,875 5,122 -247 64% 67%
Poland 2,675 705 667 +38 26% 25%
Romania 1,580 740 1,099 -359 47% 70%
Spain 3,610 1,580 1,855 -275 44% 51%
Sweden 40,025 30,640 29,206 +1,434 77% 73%
Switzerland 21,935 15,435 12,689 +2,746 70% 58%
United Kingdom 26,055 10,030 11,804 -1,774 38% 45%
Table 2 Actual and expected recognitions among EU/EFTA countries
with at least 500 first instance decisions in 2014 (recognitions
on international grounds only)
Total #
decisions
Actual #
positive
decisions
Expected #
positive
decisions
Number of
'excess'
positive
decisions
Actual
recognition
rate
Expected
recognition
rate
Belgium 20,475 8,095 6,757 +1,338 40% 33%
Bulgaria 7,410 7,000 6,451 +549 94% 87%
Cyprus 1,290 985 930 +55 76% 72%
Czech Republic 970 340 236 +104 35% 24%
Denmark 8,100 5,390 5,502 -112 67% 68%
Finland 3,230 1,870 1,470 +400 58% 46%
France 68,625 14,880 13,464 +1,416 22% 20%
Germany 97,415 38,485 36,794 +1,691 40% 38%
Greece 13,285 1,845 3,985 -2,140 14% 30%
Hungary 5,420 480 890 -410 9% 16%
Ireland 1,045 390 304 +86 37% 29%
Italy 35,205 11,250 8,265 +2,985 32% 23%
Luxembourg 850 120 144 -24 14% 17%
Malta 1,735 1,100 913 +187 63% 53%

26 | Cahier 2015-10 Research and Documentation Centre (WODC)
Total #
decisions
Actual #
positive
decisions
Expected #
positive
decisions
Number of
'excess'
positive
decisions
Actual
recognition
rate
Expected
recognition
rate
Netherlands 18,795 11,770 12,555 -785 63% 67%
Norway 7,650 4,715 4,680 +35 62% 61%
Poland 675 420 556 -136 16% 21%
Romania 1,580 740 979 -239 47% 62%
Spain 3,610 1,580 1,601 -21 44% 44%
Sweden 40,025 29,335 27,099 +2,236 73% 68%
Switzerland 21,935 8,780 11,242 -2,462 40% 51%
United Kingdom 26,055 9,105 10,162 -1,057 35% 39%
As mentioned in the introduction, several limitations must be taken into
consideration when comparing the first instance recognition rates for countries,
even net of the measured composition effects. As part of this study, explorative
analyses were conducted to address two of these limitations. Firstly, it was assessed
whether countries with low adjusted first instance recognition rates tended to make
relatively many positive final decisions. Secondly, it was examined whether
countries with low adjusted recognition rates tended to receive few asylum seekers,
possibly indicating that such countries were discouraging asylum applications more
than other countries, and were in fact quite restrictive. The results are reported in
the next section.
2.3 Additional analyses
2.3.1 First instance decisions and final decisions
Figure 3 presents the results of the first additional analysis, looking at all positive
final decisions regardless of whether they were reached on international or national
grounds. The horizontal axis depicts the first instance recognition rates adjusted for
all registered composition effects (also see Figure 1 (Model 3)). The vertical axis
shows the ratio between (a) the number of positive final decisions in the 2008-2014
period, and (b) the total number of negative first instance decisions in these seven
years. This ratio, when multiplied by 100, roughly indicates the chances of a positive
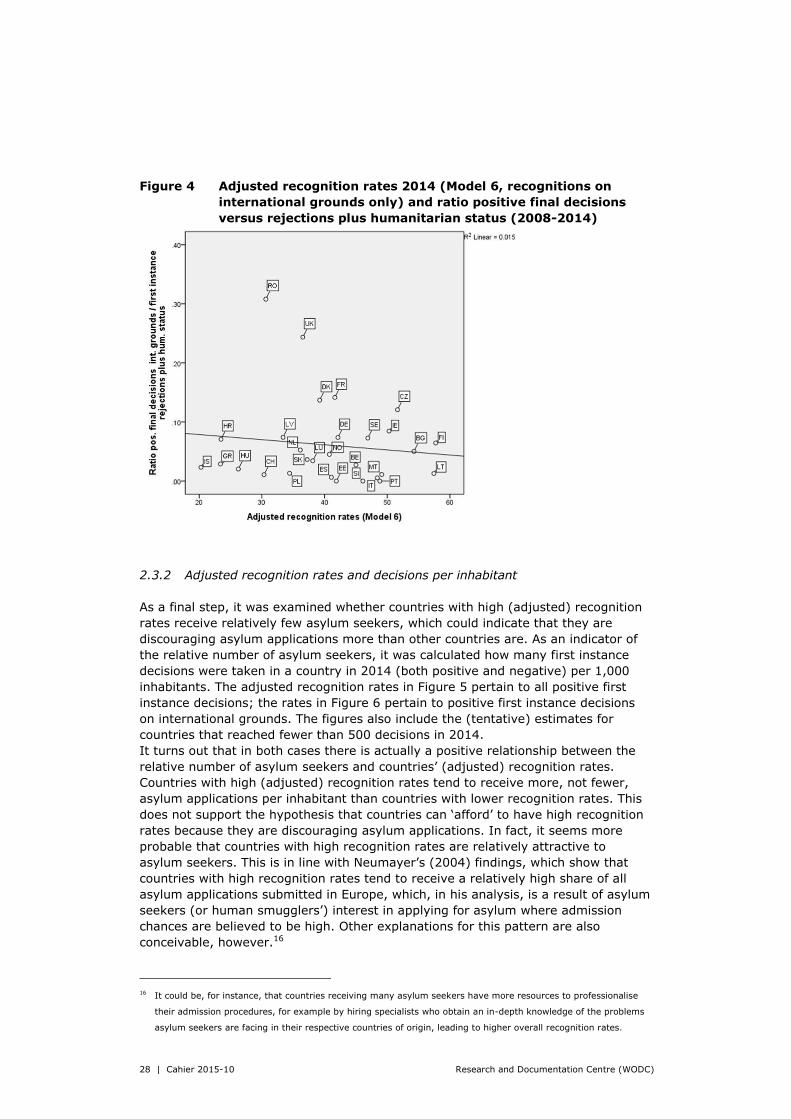
final decision after a negative first instance decision. Figure 4 presents similar data
as Figure 3, but plots the adjusted recognition rates on international grounds, which
were shown in Figure 2 (Model 6), against the ratio between (a) the number of
positive final decisions on international grounds and (b) the number of negative first
instance decisions plus the number of positive first instance decisions on national
grounds.
A larger time period (seven years) is taken in order to reduce the influence of
possible annual fluctuations in the number of people who are being rejected in the
first instance. For the Netherlands, the ratio between the number of positive final
decisions and negative first instance decisions in 2008-2014 turns out to be 0.089,
indicating that the chances of a positive final decision after a negative first instance
decision were roughly 8.9% (about 10%) in this period. Existing research conducted
in the Netherlands using cohort data shows that this figure is not far off the mark:
depending on the cohort, rejected asylum seekers in the 2005-2011 period had a
10% to 17% chance of obtaining an asylum residence permit as a result of appeals
or new asylum applications (Leerkes et al., 2014). The ratio may underestimate the

Research and Documentation Centre (WODC) Cahier 2015-10 | 27
real chances of a positive final decision to some extent, because of the increase in
asylum applications in recent years (not enough time has passed for all recent
rejections to have led to a final decision), but that will probably be the case for
other European countries as well.
Both Figure 3 and 4 indicate that international differences arising in the first stage of
the asylum procedure are not systematically repaired at later stages of the
procedure. Firstly, it turns out that the ratios tend to vary in the 0-0.15 (~ 0% to
15%) range, if the statistical ‘outliers’ Romania and the United Kingdom are
excluded. The adjusted first instance recognition rates vary considerably more, i.e.,
between 22% and 68% (positive decisions on international and national grounds),
and between 20% and 56% (positive decision on international grounds only).
Secondly, no significant relationship can be observed between the adjusted
recognition rates in the first instance and the estimated chance of a positive final
decision after a first instance rejection. The trend line in Figure 3 does have a
slightly negative slope – indicating that asylum seekers in countries rejecting many
applications in the first instance indeed have slightly higher chances of obtaining a
residence permit at a later stage of the procedure – but the relationship is very
weak and could well be coincidental (the correlation is not significant). Figure 4
similarly shows a weak and non-significant negative relationship between the
adjusted recognition rate in the first instance and the estimated chances of
obtaining international protection as a result of a positive final decision.
Figure 3 Adjusted recognition rates 2014 (Model 3, recognitions on
international and national grounds) and ratio positive final
decisions versus rejections (2008-2014)
28 | Cahier 2015-10 Research and Documentation Centre (WODC)
Figure 4 Adjusted recognition rates 2014 (Model 6, recognitions on
international grounds only) and ratio positive final decisions
versus rejections plus humanitarian status (2008-2014)
2.3.2 Adjusted recognition rates and decisions per inhabitant
As a final step, it was examined whether countries with high (adjusted) recognition
rates receive relatively few asylum seekers, which could indicate that they are
discouraging asylum applications more than other countries are. As an indicator of
the relative number of asylum seekers, it was calculated how many first instance
decisions were taken in a country in 2014 (both positive and negative) per 1,000
inhabitants. The adjusted recognition rates in Figure 5 pertain to all positive first
instance decisions; the rates in Figure 6 pertain to positive first instance decisions
on international grounds. The figures also include the (tentative) estimates for
countries that reached fewer than 500 decisions in 2014.
It turns out that in both cases there is actually a positive relationship between the
relative number of asylum seekers and countries’ (adjusted) recognition rates.
Countries with high (adjusted) recognition rates tend to receive more, not fewer,
asylum applications per inhabitant than countries with lower recognition rates. This
does not support the hypothesis that countries can ‘afford’ to have high recognition
rates because they are discouraging asylum applications. In fact, it seems more
probable that countries with high recognition rates are relatively attractive to
asylum seekers. This is in line with Neumayer’s (2004) findings, which show that
countries with high recognition rates tend to receive a relatively high share of all
asylum applications submitted in Europe, which, in his analysis, is a result of asylum
seekers (or human smugglers’) interest in applying for asylum where admission
chances are believed to be high. Other explanations for this pattern are also
conceivable, however.16
16 It could be, for instance, that countries receiving many asylum seekers have more resources to professionalise
their admission procedures, for example by hiring specialists who obtain an in-depth knowledge of the problems
asylum seekers are facing in their respective countries of origin, leading to higher overall recognition rates.

Research and Documentation Centre (WODC) Cahier 2015-10 | 29
Figure 5 Decisions per 1,000 inhabitants and adjusted recognition rates
(Model 3, recognitions on international and national grounds)
Figure 6 Decisions per 1,000 inhabitants and adjusted recognition rates
(Model 6, recognitions on international grounds only)

Research and Documentation Centre (WODC) Cahier 2015-10 | 31
3 Conclusion
There are large international differences in the percentage of asylum requests that
states recognise. In the EU/EFTA area in 2014, the percentage of positive first
instance decisions varied from 9% in Hungary to 94% in Bulgaria. This led to
political discussions in the Netherlands about the causes of these international
differences in general, and the position of the Netherlands compared to other
European countries in particular. This study uses a statistical method to (a) estimate
recognition rates by country of asylum, net of international differences in the
composition of their asylum seeker population with respect to country of origin, age
and sex, and (b) to calculate expected recognition rates for each country, given its
unique asylum population, but based on the assumption that its decisions are in line
with the decision outcomes in the EU/EFTA area as a whole for the kinds of asylum
seekers that the country receives.
It is found that international differences in recognition rates become considerably
smaller after adjusting for composition effects. At the same time, substantial
differences persist, especially – but not exclusively – when positive decisions on
national grounds count as recognitions. When only the positive decisions on
international grounds – i.e., on the basis of the ‘Geneva convention’ or the ECHR –
count as recognitions, it is still found that countries with the highest adjusted
recognition rates would, when making all the first instance decisions in the EU/EFTA
in 2014, recognise approximately twice as many asylum applications than countries
with the lowest adjusted recognition rates.
Net of the effects of international differences in asylum seekers’ origin, age and sex,
the Netherlands no longer has a relatively high recognition rate, and actually
emerges as a relatively ‘restrictive’ European country. It is estimated to have
reached a positive decision in 39% of the cases, had it made all first instance
decisions on the asylum requests that the 30 EU/EFTA countries dealt with in 2014,
while the European average was 47%. Based on the average decision patterns in
Europe, the Netherlands is expected to have reached between 800 and 1,000
additional positive decisions (depending on whether positive decisions on national
grounds in the EU/EFTA area are counted as rejections or as recognitions). The
decrease of the recognition rate when keeping origin, age and sex effects constant
indicates that a relatively large share of asylum seekers in the Netherlands indeed
had characteristics that were associated with a high probability of a positive decision
in the EU/EFTA as a whole in 2014 (such as Syrian asylum seekers). On the basis of
the analyses, it cannot be established why the Netherlands was dealing with an
asylum seeker population with relatively high recognition chances.
Compared to looking at unadjusted rates, comparing adjusted recognition rates (or
comparing observed and expected recognition rates) is a better way of assessing
countries’ relative willingness to admit asylum seekers. However, the adjusted and
expected rates still provide suggestive rather than definitive evidence on how
(un)restrictive countries are in their admission decisions. These rates should
primarily be used to ask additional questions on the lack of international
convergence that remains. What could explain the high adjusted rates in country X?
What explains the low rates of country Y if they are not due to the compositional
differences that are accounted for? The scientific literature suggests that
international differences in willingness to admit asylum seekers play a substantial
role, for example in connection with international differences in unemployment, or
differences in the popularity (and political influence) of anti-immigration parties
(Neumayer, 2005). Additionally, there may well be certain procedural explanations

32 | Cahier 2015-10 Research and Documentation Centre (WODC)
(such as the Duldung system in Germany, see the introduction). It therefore seems
advisable to perform a comparative study on similarities and differences between
asylum procedures in the EU/EFTA area.
Several methodological limitations should be taken into consideration and the
findings should be interpreted with some caution (the main limitations were
mentioned in the introduction). Two limitations were overcome to some extent by
conducting explorative additional analyses. Firstly, no support was found for the
hypothesis that international differences in the outcome of first instance decisions
are systematically repaired at later stages of the asylum procedure: the chances of
a positive final decision after a first instance rejection are relatively low in most
countries, and there is no evidence that countries with low (adjusted) recognition
rates in the first instance eventually accept an extraordinarily high number of
asylum seekers due to successful appeals or repeated asylum applications. This
finding confirms previous research conducted on regional variation in first instance
decision outcomes in the Netherlands (Mascini, 2002), and underscores the
importance of the first instance decisions. Secondly, no evidence was found that
countries with the highest (adjusted) recognition rates receive fewer asylum
seekers, which could indicate that they may be discouraging asylum applications
more than other countries. Quite to the contrary, it turns out that countries with
high (adjusted) recognition rates tend to receive more, not fewer, asylum
applications per inhabitant. A possible explanation for this pattern is that asylum
seekers try to apply for asylum in countries with relatively high (perceived)
admission chances (cf. Neumayer, 2004). This observation, too, confirms that first
instance recognition rates matter, and that it is important to optimize the
comparability of these rates by calculating ‘adjusted’ and/or ‘expected’ recognition
rates, using the available information on asylum seekers’ nationality, age and sex.

Research and Documentation Centre (WODC) Cahier 2015-10 | 33
Samenvatting
Hoe streng (of soepel) zijn we? 'Gecorrigeerde' en 'verwachte' inwilligingspercentages asiel
in Europa
Aanleiding
Er zijn tussen Europese landen grote verschillen in het percentage asielverzoeken
dat overheden inwilligen. Van alle eerste aanleg beslissingen17 die staten in het
EU/EFTA gebied in 2014 namen, ging het om 47% van de gevallen om een inwilli-
ging, variërend van 9% voor Hongarije tot 94% voor Bulgarije (Eurostat cijfers per
14 mei 2015, cijfers kunnen door latere updates iets verschillen). Nederland willigde
67% van de verzoeken in, wat het in 2014 de zesde plaats opleverde in termen van
het hoogste percentage inwilligingen (na Bulgarije, Zweden, Cyprus, Malta en
Zwitserland). Het relatief hoge percentage inwilligingen in Nederland is aanleiding
geweest voor diverse vragen uit de Tweede Kamer over de achtergronden van de
internationale verschillen in die percentages in het algemeen en het relatief hoge
percentage voor Nederland in het bijzonder. Vanuit het Nederlandse kabinet is
onder meer aangegeven dat de percentages moeilijk met elkaar vergeleken kunnen
worden omdat elk land te maken heeft met een verschillende samenstelling van de
asielpopulatie. Door de Staatssecretaris van Veiligheid en Justitie is onder andere de
hypothese opgeworpen dat Nederland een hoog inwilligingspercentage heeft doordat
de ‘korte’ Nederlandse asielprocedure relatief kansrijke asielzoekers zou aantrekken.
In dit onderzoek wordt nagegaan of het relatief hoge Nederlandse inwilligingsper-
centage inderdaad komt doordat er relatief veel mensen in Nederland asiel aanvra-
gen die (gegeven hun herkomstland, leeftijd en geslacht) ook in andere Europese
landen een grote kans op een positieve beslissing zouden hebben.
Drie onderzoeksvragen stonden centraal in deze studie:
8 In hoeverre zijn er internationale verschillen in inwilligingspercentages wanneer
de samenstelling van de asielpopulatie wat betreft herkomstland, leeftijd en
geslacht constant wordt gehouden?
9 Wat is de positie van Nederland wanneer dergelijke compositie-effecten constant
worden gehouden?
10 Wat is het verwachte inwilligingspercentage van een land wanneer elke asiel-
zoeker er precies die kans op inwilliging had gehad die hij of zij – gegeven zijn of
haar nationaliteit, leeftijd en geslacht – gemiddeld zou hebben gehad in het
EU/EFTA-gebied als geheel?
17 Eurostat definieert eerste aanleg beslissingen (‘first instance decisions’) als volgt: ‘beslissingen (positief en nega-
tief) ten aanzien van verzoeken tot internationale bescherming en een verblijfsvergunning op humanitaire
gronden (...)’(vertaling door de auteur). Deze worden onderscheiden van de definitieve beslissingen (“final
decisions”): ‘beslissingen door overheidsorganen of rechtelijke instanties in beroep of herziening waartegen geen
verder beroep mogelijk is (…)’(vertaling door de auteur). Het is enigszins onduidelijk wat er precies onder de
definitieve beslissingen valt, gezien de volgende toevoeging in de ‘metadata’ door Eurostat: ‘[I]t is not intended
that asylum statistics should cover rare or exceptional cases determined by the highest courts. Thus, the
statistics related to the final decisions should refer to what is effectively a final decision in the vast majority of all
cases: i.e. that all normal routes of appeal have been exhausted.’

34 | Cahier 2015-10 Research and Documentation Centre (WODC)
Gecorrigeerde en verwachte inwilligingspercentages
In dit onderzoek zijn statistische technieken gebruikt waarmee de inwilligingsper-
centages van landen beter met elkaar kunnen worden vergeleken. Ten eerste wor-
den er gecorrigeerde inwilligingspercentages (‘adjusted recognition rates’) gepre-
senteerd. Het gecorrigeerde inwilligingspercentage is het geschatte percentage
inwilligingen in een land indien elk EU/EFTA-land te maken zou hebben gehad met
precies dezelfde samenstelling van de asielpopulatie in termen van land van her-
komst, leeftijd en geslacht (andere kenmerken van asielzoekers worden niet door
Eurostat geregistreerd en konden derhalve niet in de analyse worden meegeno-
men). Die situatie is nagebootst door te berekenen wat het inwilligingspercentage
van een land was geweest – gezien de uitkomsten van zijn beslissingen in vergelij-
king met de uitkomsten van soortgelijke beslissingen in andere landen – indien dat
land verantwoordelijk was geweest voor alle beslissingen die in 2014 in het gehele
EU/EFTA-gebied werden genomen. Ten tweede worden er verwachte inwilligingsper-
centages (‘expected recognition rates’) gepresenteerd. Het verwachte inwilligings-
percentage geeft het percentage inwilligingen in een land als het land de asielver-
zoeken die het kreeg precies zo zou hebben afgedaan als voor asielzoekers met
dergelijke kenmerken (afgemeten aan de nationaliteit, leeftijd en geslacht van de
aanvragers) gemiddeld het geval was in het EU/EFTA-gebied als geheel. Er zijn
aparte analyses gedaan voor de kans op een inwilliging inclusief inwilligingen op
nationale gronden en voor de kans op een inwilliging op internationale gronden
(‘Geneve’, ‘EVRM’). Er zijn ook aparte analyses verricht voor 2013, maar omdat de
resultaten vrij veel overeenkomst vertoonden met 2014 zijn alleen de bevindingen
voor 2014 gerapporteerd.18 Twee EU/EFTA-landen werden niet meegenomen in de
analyse. Oostenrijk had nog geen cijfers over 2014 beschikbaar gesteld en
Liechstenstein kon niet worden meegenomen vanwege een te gering aantal asiel-
beslissingen.
Bredere relevantie
Hoewel de analyses zijn verricht naar aanleiding van de Nederlandse vragen uit de
Tweede Kamer, hebben de gebruikte technieken en resultaten een bredere relevan-
tie. Zowel politici als wetenschappers zien het inwilligingspercentage als de beste
indicator voor de bereidheid van landen om asielverzoeken te honoreren, maar deze
inwilligingspercentages worden uiteraard ook beïnvloed door andere factoren, waar-
onder het aandeel asielzoekers uit landen met een hoge of juist lage kans op inwilli-
ging. Wanneer de invloed van die andere variabelen – voor zover geregistreerd en
door Eurostat beschikbaar gesteld – statistisch constant wordt gehouden, ontstaan
betere indicatoren. De resultaten en toegepaste methoden zouden in de toekomst
bijvoorbeeld gebruikt kunnen worden om te monitoren of Europese landen asielver-
zoeken ongeveer op dezelfde wijze behandelen, en om eventueel nader onderzoek
te doen naar de achtergronden van nog resterende internationale verschillen in
18 The dertig EU/EFTA landen hebben elk een rangnummer (van 1 tot 30) op basis van het (finale) gecorrigeerde
inwillingspercentage. Die rangnummers zijn ontleend aan de ‘odds ratios’ in model 3 en 6 (zie appendix 2).
Figuur 1 en 2 tonen de rangorde wanneer acht ‘kleinere’ landen (met minder dan 500 eerste aanleg beslissingen
in 2014) buiten beschouwing worden gelaten. Deze rangordes zijn ook berekend voor 2013. Vervolgens is de
(Spearman) correlatie berekend tussen de rangorde voor 2013 en 2014. Die correlaties blijken respectievelijk
0,74 (alle positieve beslissingen) and 0,76 (positieve beslissingen op internationale gronden) te bedragen. Dat
geldt als een sterke stamenhang en wijst uit dat de positie van landen weliswaar enigszins varieert van jaar tot
jaar, maar dat de rangorde niet fundamenteel verandert, althans niet in een dergelijke korte tijdspanne.

Research and Documentation Centre (WODC) Cahier 2015-10 | 35
inwilligingskansen. Er zijn in de Europese Unie weliswaar tendensen tot centralise-
ring waarneembaar (gezien de noodmaatregelen om een deel van de asielzoekers
uit Griekenland, Italië en Hongarije elders in de EU te hervestigen), maar het is de
vraag of het bestaande systeem, waarin elk land de asielaanvragen beoordeelt die
in zijn grondgebied worden ingediend, fundamenteel zal veranderen.
Resultaten
De internationale verschillen in inwilligingspercentages blijken kleiner te worden
wanneer ze worden bijgesteld voor compositie-effecten. Vooral verschillen tussen
landen in de samenstelling van de asielbevolking naar herkomstland blijken van
belang te zijn; het blijkt relatief weinig uit te maken of er daar bovenop wordt
gecorrigeerd voor leeftijd en geslacht. Er blijven echter substantiële verschillen
bestaan, vooral – maar niet uitsluitend – wanneer ook de positieve beslissingen op
nationale gronden tot de inwilligingen worden gerekend. Wanneer er specifiek wordt
gekeken naar de kans op een inwilliging op internationale gronden, blijken de
EU/EFTA-landen met het hoogste (gecorrigeerde) inwilligingspercentages naar
schatting nog altijd ongeveer twee keer zoveel asielverzoeken in te willigen dan de
landen met de laagste (gecorrigeerde) inwilligingspercentages.
Wanneer er rekening wordt gehouden met internationale verschillen in de samen-
stelling van asielpopulatie (naar nationaliteit, leeftijd en geslacht) blijkt Nederland
eerder een relatief restrictief dan een relatief permissief land te zijn. Wanneer
Nederland in 2014 alle toenmalige eerste aanleg beslissingen in de EU/EFTA ruimte
had genomen, was naar schatting 39% van de asielverzoeken ingewilligd, terwijl het
gemiddelde percentage inwilligingen in de EU/EFTA landen, zoals gezegd, 47%
bedroeg. Wanneer er alleen wordt gekeken naar inwilligingen op internationale
gronden, scoort Nederland eveneens onder het Europese gemiddelde. Er waren dan
naar schatting tien EU/EFTA landen geweest (van de 30 EU/EFTA landen waarnaar
gekeken kon worden) die minder asielverzoeken zouden hebben ingewilligd. Vaak
gaat het dan om Oost-Europese landen die nog niet zo lang deel uitmaken van de
Europese Unie en waar de asielinstroom relatief laag is. Van de 22 ‘grote’ landen die
in 2014 ten minste 500 eerste aanleg beslissingen namen had Nederland het op zes
na laagste gecorrigeerde inwilligingspercentage op internationale gronden – lager
dan het Verenigd Koninkrijk, Denemarken, Duitsland, Frankrijk, Zweden, en Italië
(zie ook figuur 1 en 2).
Dat het gecorrigeerde inwilligingspercentage voor Nederland een stuk lager lag dan
het daadwerkelijke (‘ongecorrigeerde’) inwilligingspercentage suggereert dat
Nederland, zoals het Nederlandse kabinet al veronderstelde, relatief veel asielver-
zoeken afhandelde die betrekking hadden op asielzoekers uit landen die ook in
andere EU/EFTA landen een relatief hoge inwilligingskans hadden (en die tevens, zo
blijkt uit de analyse, op grond van hun leeftijd en/of geslacht een verhoogde kans
op toelating hadden). De analyses kunnen geen inzicht geven in de vraag waarom
Nederland te maken had met een relatief kansrijke asielbevolking.
Soortgelijke bevindingen komen naar voren indien er wordt gekeken naar de
verwachte inwilligingspercentages. Die blijken voor Nederland 72% (inclusief
inwilligingen op nationale gronden) en 67% (uitsluitend inwilligingen op internatio-
nale gronden) te bedragen, terwijl de feitelijke Nederlandse inwilligingspercentages
uitkwamen op respectievelijk 67% en 63%. (Nederland heeft de nationale erken-
ningsgronden afgeschaft, maar volgens Eurostat werden er in 2014 nog steeds
asielverzoeken op nationale gronden ingewilligd; navraag bij de IND leerde dat het
gaat om inwilligingen op grond van artikel 29, tweede lid, van de Vreemdelingenwet
36 | Cahier 2015-10 Research and Documentation Centre (WODC)
2000 en, in mindere mate, om inwilligingen op grond van artikel 29, eerste lid).19
Volgens het statistisch model wees Nederland circa duizend (958) personen af die
wel waren toegelaten op internationale dan wel nationale gronden indien ze – con-
form de huidige verdeling van de asielbevolking – willekeurig over de EU/EFTA
ruimte waren verdeeld en daar door de desbetreffende EU/EFTA landen waren
beoordeeld. Naar schatting hadden circa achthonderd in Nederland afgewezen
asielzoekers (785) in dat geval internationale bescherming gekregen.
Beperkingen
Er moet met enkele beperkingen rekening worden gehouden bij de beoordeling van
de resultaten. Ten eerste is dit soort statistisch onderzoek uiteraard afhankelijk van
de kwaliteit (juistheid, volledigheid, vergelijkbaarheid) van de administratieve
gegevens die beschikbaar zijn gesteld. Er is geen nader onderzoek gedaan naar de
kwaliteit van de Eurostat gegevens. Wel is er vanuit de IND en EASO aangegeven
dat er de afgelopen jaren stappen zijn gezet om die kwaliteit te vergroten (voor
Nederland zouden inmiddels gegevens over ‘nareizigers’ uit de cijfers voor 2013 en
2014 zijn gehaald (zie noot 3)). Het lijkt er echter op dat er nog meer stappen gezet
zouden kunnen worden, bijvoorbeeld door (1) aparte gegevens ter beschikking te
stellen over de afdoening van eerste asielverzoeken, en door (2) alle niet-ontvanke-
lijke asielaanvragen buiten beschouwing te laten (niet alleen van personen die in
een ander ‘Dublin’-land zijn afgewezen, zoals momenteel dient te gebeuren. Om
technische redenen is het voor Nederland overigens nog niet mogelijk om gegevens
over Dublin-zaken buiten beschouwing te laten. Dit kan hebben geleid tot een
zekere overschatting van de ‘strengheid’ van Nederland: de Nederlandse gegevens
voor 2014 bevatten immers afwijzingen betreffende Dublin-zaken die in andere
landen wellicht al wel buiten beschouwing zijn gelaten. De precieze omvang daar-
van kan pas worden bepaald als er gegevens zijn over het aantal negatieve beslis-
singen in Nederland betreffende personen die in een ‘Dublin’-land zijn afgewezen.
Een tweede belangrijke beperking is dat de samenstelling van de asielbevolking van
land tot land in meer opzichten kan hebben verschild dan op nationaliteit, leeftijd en
geslacht. Het zou bijvoorbeeld kunnen zijn dat Irakezen die in Zweden asiel aan-
vroegen afkomstig waren uit andere regio’s of uit andere groepen dan Irakezen die
in Griekenland om bescherming verzochten en dat Irakezen die in Griekenland
werden afgewezen ook in Zweden waren afgewezen. Dit zogeheten probleem van
‘ongeobserveerde heterogeniteit’ zou verminderd kunnen worden als er meer rele-
vante kenmerken geregistreerd zouden worden, bijvoorbeeld de regio van herkomst
of de etniciteit van de asielzoeker. Het kan alleen volledig worden weggenomen
indien er een experiment gestart zou worden waarbij asielverzoeken willekeurig ter
beoordeling over Europese landen zouden worden verdeeld – mits landen dan
allemaal dezelfde beslissingen zouden nemen als wanneer er geen sprake was
geweest van een dergelijk (politiek wellicht nogal gevoelig) experiment. De huidige
bevindingen geven dus geen definitief inzicht in internationale verschillen in inwilli-
gingsgeneigdheid, maar dienen vooral om nadere vragen te formuleren over ver-
schillen die niet verklaard kunnen worden door de gemeten compositie-effecten.
19 Volgens de IND gaat het om na- of meereizigers die een zelfstandige asielaanvraag indienen en vervolgens een
‘afgeleide’ vergunning krijgen die onder humanitarian status valt. Volgens de IND dienen dergelijke asielaan-
vragen volgens de Eurostat-regels meegerekend te worden. Daarnaast heeft de IND aangegeven dat het van
ambtshalve verlenen van vergunningen is ingegaan op 1 april 2014. In circa tweederde van de gevallen gaat het
bij de positive decisions met humanitarian status om inwilligingen op grond van art. 29, tweede lid; circa een-
derde (tot 1 april 2014) betreft inwilligingen op grond van art. 29, eerste lid.

Research and Documentation Centre (WODC) Cahier 2015-10 | 37
De wetenschappelijke literatuur suggereert dat de dan nog resterende verschillen
voor een belangrijk deel verband houden met internationale verschillen in de
bereidheid om asielzoekers op te nemen – bijvoorbeeld als gevolg van verschillen
tussen landen in werkloosheidspercentages en/of de houding van de bevolking ten
aanzien van (asiel)migratie (Neumanyer, 2005). Daarnaast kunnen ze voortkomen
uit juridische, procedurele verschillen tussen landen. In Duitsland wordt bijvoorbeeld
vrij veel gebruikgemaakt van Duldung, een soort tijdelijke gedoogstatus die formeel
niet als verblijfsvergunning geldt, waardoor personen formeel worden afgewezen die
feitelijk een zekere bescherming genieten en elders misschien een asielvergunning
zouden krijgen (Morris, 2001). Ook verkleint de Nederlandse procedure wellicht het
aantal negatieve inwilligingen in eerste aanleg doordat de IND eerst een
‘voornemen’ communiceert waartegen de asielzoeker zijn of haar ‘zienswijze’ kan
stellen. Dit heeft als mogelijk gevolg dat gevallen die in andere landen wellicht
zouden leiden tot een negatieve eerste aanleg beslissing, waarop dan eventueel een
beroep volgt, in Nederland uitmonden in een inwilliging in eerste aanleg (wanneer
de IND meegaat in de zienswijze van de asielzoeker). Dit leidt potentieel tot een
zekere onderschatting van de ‘strengheid’ van Nederland in de eerste aanleg
beslissingen. Het zou goed zijn als er een internationaal vergelijkend onderzoek
gedaan zou worden naar de overeenkomsten en verschillen in asielprocedures in het
EU/EFTA-gebied.
Twee andere beperkingen konden in het kader van dit onderzoek gedeeltelijk wor-
den weggenomen door middel van aanvullende verkennende analyses. Ten eerste is
gekeken of landen die in eerste aanleg zeer restrictief zijn uiteindelijk een vergelijk-
baar aantal personen bescherming bieden, doordat afgewezen asielzoekers in veel
gevallen met succes in beroep gaan. Er zijn geen aanwijzingen gevonden dat de
internationale verschillen in de uitkomst van eerste aanleg beslissingen in latere
fases van de asielprocedure worden gerepareerd. Die bevinding is overigens in lijn
met de conclusies van onderzoek dat eerder in Nederland is gedaan naar regionale
verschillen in de afdoening van asielverzoeken (Mascini, 2002). Het onderstreept het
belang van de beslissingen die in eerste aanleg worden genomen. Ten tweede is
gekeken of landen met een hoog (gecorrigeerd) inwilligingspercentage wellicht te
maken hebben met een relatief klein aantal asielverzoeken, wat er mogelijk op zou
kunnen wijzen dat zij in werkelijkheid juist zeer restrictief zijn omdat zij het indie-
nen van asiel meer zouden ontmoedigen dan andere landen, waardoor zij de weini-
gen die overblijven gemakkelijk kunnen toelaten. Ook hiervoor zijn geen aanwij-
zingen gevonden. Integendeel: landen met hoge (gecorrigeerde) inwilligingspercen-
tages blijken per inwoner juist veel asielaanvragen te krijgen (afgemeten aan het
aantal beslissingen in 2014). Een mogelijke verklaring voor dat patroon is dat
mensen asiel proberen aan te vragen in een land waar de kans op een inwilliging
relatief hoog is (zie ook Neumayer, 2004). Ook die waarneming onderstreept het
belang van de internationale verschillen in de kans op een inwilliging in eerste
aanleg én van het optimaal benutten van de administratieve gegevens die iets
zeggen over die kans.


Research and Documentation Centre (WODC) Cahier 2015-10 | 39
References
Holzer, Th., Schneider, G., & Widmer, T. (2000). Discriminating decentralization:
Federalism and the handling of asylum applications in Switzerland, 1988-1996.
Journal of Conflict Resolution 44(2), 250-276.
Leerkes, A., Boersema, E., Galloway, M., & Londen, M. van (2014). Afgewezen en
uit Nederland vertrokken? Een onderzoek naar de achtergronden van variatie in
zelfstandige terugkeer onder uitgeprocedeerde asielzoekers. Den Haag: WODC.
Cahier 2014-3.
Leerkes, A. (forthcoming). Managing migration through legitimacy? Alternatives to
the criminalisation of unauthorised migration. In S. Carrera & E. Guild (eds.),
Edited Volume, Centre for European Policy Studies.
Mascini, P. (2002). Regionale verschillen in uitvoering van asielbeleid. Sociologische
Gids 49(3), 292-312.
Mascini, P. (2008). Explaining Inequality in the Implementation of Asylum Law.
Refuge: Canada's Periodical on Refugees 25(2), 164-181.
Mascini, P., & Bochove, M. van (2009). Gender stereotyping in the Dutch asylum
procedure: ‘Independent’ men versus ‘dependent’ women. International Migration
Review 43(1), 112–133.
Morris, L. (2001). Stratified rights and the management of migration: National
distinctiveness in Europe. European Societies 3(4), 387-411.
Neumayer, E. (2004). Asylum destination choice: What makes some West European
countries more attractive than others? European Union Politics 5(2), 155-180.
Neumayer, E. (2005). Asylum recognition rates in Western Europe: Their
determinants, variation, and lack of convergence. Journal of Conflict Resolution
49(1), 43-66.
Thielemann, E. (2003). Between interests and norms: Explaining burden‐sharing in
the European Union. Journal of Refugee Studies 16(3), 253-273.


Research and Documentation Centre (WODC) Cahier 2015-10 | 41
Appendix 1 Methodology
All recognition rates presented in Chapter 2 are based on logistic regression models.
The rates were calculated using the following steps:
1 Data on all first instance decisions in 2014 were taken from Eurostat, and are
based on the 14-05-2015 update. The decisions can (with some effort) be broken
down by various dimensions simultaneously, i.e., first by country of asylum, then
by country of citizenship of the asylum seeker, then by age category (‘Less than
14 years’, ‘From 14 to 17 years’, ‘From 18 to 34 years’, ‘From 35 to 64 years’, ‘65
years or over’, and ‘Unknown), then by sex (‘Males’, ‘Females’, and ‘Unknown’),
and then by decision outcome (‘Geneva Convention status’, ‘Subsidiary protection
status’, ‘Humanitarian status’, and ‘Rejected’). It could thus be established, as an
example, that 65 Cameroonian females aged 18 to 34 were rejected in the first
instance in Belgium in 2014. The data were downloaded separately for ‘Males’,
‘Females’, and ‘Unknown [sex]’, as Eurostat interface allows only four dimensions
to be shown simultaneously. No data on first instance decisions in 2014 were
available yet for Austria.
2 In a limited number of cases, Eurostat gave small negative numbers (-5, -10)
when the data were broken down by the five dimensions mentioned. These were
all set to 0. It also turned out that the total number of decisions after the data
were broken down by the five dimensions as described did not completely add up
to the number of decisions in the EU/EFTA countries if the data were not broken
down (this is probably due to Eurostat’s practice of rounding all numbers to the
nearest 5). It turned out that the variables ‘age’ and ‘sex’ were mostly
responsible for the ‘missing’ decisions. This was solved by adding decisions to the
downloaded database with age and gender coded as ‘Unknown’, until the number
of decisions (and the decision outcome) matched the data when decision
outcomes were only broken down by country of asylum and country of
citizenship. In total, 2.3% of all decisions in the database were ‘added’ in that
way. (If these 2.3% are excluded from the analysis, the results are highly similar
to what has been reported.) The number of decisions then still did not add up
completely to the number of decisions by country of asylum when decision
outcomes are also not broken down by country of citizenship, but that difference
was so small that it was not corrected. (According to the 14-5-2014 update the
30 EU/EFTA countries took 388,605 first instance decisions in 2014, so the
research database covered 99.96% (388,435/388,605*100) of all decisions).
3 Liechtenstein was excluded from the analysis because the number of (positive)
decisions was too small for statistical analysis (10 first instance decisions, all
rejections, leading to ‘complete separation’). Destination effects also become
more difficult to model for countries with relatively homogeneous asylum seeker
populations, such as Bulgaria. However, the VIF values (calculated with the collin
package for Stata) do not indicate serious multicollinearity issues (all VIF values
were 5 or lower (usually approximately 1), with the exception of the dummies
‘sex unknown’ and ‘age unknown’). This indicates that destination effects for
individual countries could be estimated reliably. The resulting database included
information on 388,435 first instance decisions.
4 Six logistic regression models were run in Stata 13 (the coefficients are shown in
Appendix 2). In the first three models, the dependent variable was a binary
variable based on the Eurostat decision variable, which was recoded as follows:
1 = ‘Geneva Convention Status’ or ‘Subsidiary Protection Status’ or ‘Humanitarian
Status’ versus 0 = ‘Rejected’. In the final three models, the dependent variable
42 | Cahier 2015-10 Research and Documentation Centre (WODC)
was coded as follows: 1 = ‘Geneva Convention Status’ or ‘Subsidiary Protection
Status’ versus 0 = ‘Humanitarian Status’ or ‘Rejected’. All models were what are
called no constant models (this eliminated the need to choose an EU/EFTA
country as the reference country, which would then function more or less as the
‘norm’). In Models 1 and 4, the country of asylum was the only predictor of the
decision outcome. In Models 2 and 5, the country of asylum and the country of
citizenship of the asylum seeker were the predictors of the decision outcome. In
Models 2 and 5, only the effect of country of citizenship (‘the origin effect’) is held
constant throughout the EU/EFTA, and remaining differences in decision outcomes
are assumed to be the effect of the country of asylum (‘the destination effect’)
and an error term. Models 3 and 6 follow the same analytical strategy but
estimate the destination effect while keeping the origin and the sex and age effect
constant. The Eurostat figures include a few ‘rare’ nationalities (such as
Canadians and Chileans) where all decisions in EU/EFTA countries were negative.
These decisions are automatically excluded from the regression models as the
outcome is predicted perfectly (the remaining N is reported in Appendix 2). Using
the ‘fw’ command in Stata, the data were weighted by the number of cases within
each unique combination of country of citizenship, age, sex, country of asylum,
and decision outcome. For example, there were 14,615 first instance rejections in
Italy in 2014, involving 208 unique combinations of country of citizenship, age
category and sex (in other words, 208 rows in the database concerned rejections
in Italy). By weighting the data, however, the 208 rows (unique combinations of
country of citizenship, age category and sex) counted for 14,615 cases in the
analysis.
5 Using the coefficients obtained in the previous step, it is possible to calculate the
chances that a decision would be positive given the characteristics of the asylum
seeker, and the country of asylum. For example, the coefficients obtained in
Model 2 can be used to calculate the probability that a decision involving an
Iranian citizen would be positive in different countries given origin and destination
effects. This estimated probability is given by the combination of the coefficient
for being an Iranian compared to being an Afghan (ln(0.88)=-0.13), and the
coefficient for the EU/EFTA country. For example, there is a 61% chance that a
first instance decision in Germany in 2014 involving an Iranian citizen was
positive (exp(-0.13+0.57)/(exp(-0.13+0.57)+1=0.61). (The coefficient for
Germany in Model 2 is ln(1.77)=0.57, see Appendix 2). In Greece, there is an
estimated 21% chance that a decision involving an Iranian citizen was positive
(exp(-0.13+-1.20)/(exp(-0.13+-1.20)+1=0.21). (The coefficient for Greece in
Model 2 is ln(0.30)=-1.20, see Appendix 2). The adjusted recognition rate was
calculated in Excel by (1) multiplying the probability of a positive decision in a
country for a given category of asylum seekers (say Iranians) by the number of
decisions concerning that category (for example, there were 9,155 decisions in
the 30 EU/EFTA countries that concerned Iranians, so it is estimated that 5,584
(9,155 x 0.61) decisions involving Iranians would be positive had all decisions be
made by Germany), (2) summing these counts for all categories (in case of Model
2: all countries of citizenship; in case of Model 3: all unique combinations of
country of citizenship, age and sex), and (3) dividing the sum score for each
EU/EFTA country by the number of decisions in the EU/EFTA as a whole (minus
the decisions involving ‘rare’ countries for which all decisions were negative,
such as Canada or Chili, which had to be excluded from the models) and (4)
multiplying these fractions with 100. The adjusted recognition rates that also
correct for the effects of age and sex are calculated in a similar way, with the
difference that a larger number of coefficients is used and that different
probabilities are calculated for nationals with different demographic

Research and Documentation Centre (WODC) Cahier 2015-10 | 43
characteristics (such as the probability that the first instance decision involving an
Iranian man in the age category from 18 to 34 years was positive in Germany).
6 The expected recognition rates were calculated using models that are similar to
Model 3 (positive decisions on international or national grounds) and Model 6
(positive decisions on international grounds only), but that do not include
dummies for countries of asylum capturing destination effects (the models also
included a constant). The coefficients of country of citizenship, age and sex in
these models were used to calculate the probability of a positive decision for each
decision taken in country X, given the citizenship, age and sex of the applicant
who was involved in the decision, and then summing these probabilities to obtain
the expected number of positive decisions for country X as a whole. The
coefficients for country of origin, age and sex have not been reported because
they were similar to the coefficients in Model 3 and 6.
7 The 95% confidence intervals for the expected recognition rates were calculated
using the confidence interval for proportions (taking the expected recognition rate
divided by 100 for p, the total number of first instance decisions as n, and with
z=1.96).

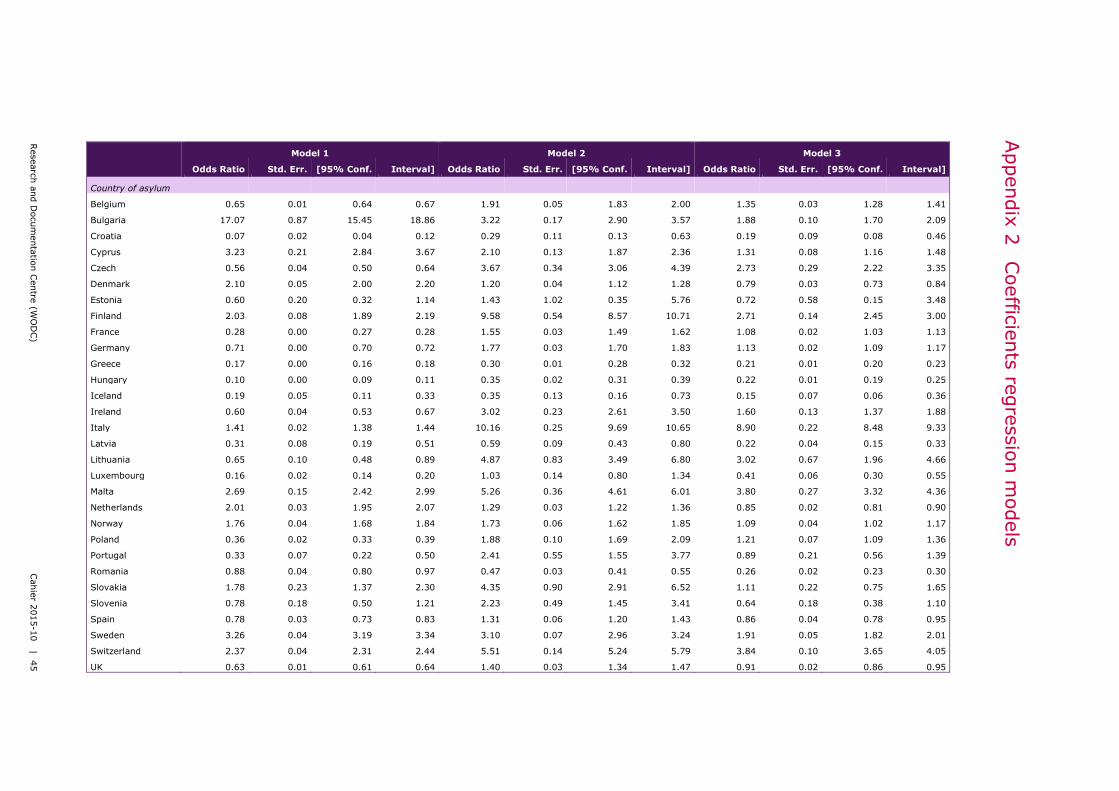
Research and Documentation Centre (WODC) Cahier 2015-10 | 45
Appendix
2
Coeffic
ients
regre
ssio
n m
odels
Model 1 Model 2 Model 3
Odds Ratio Std. Err. [95% Conf. Interval] Odds Ratio Std. Err. [95% Conf. Interval] Odds Ratio Std. Err. [95% Conf. Interval]
Country of asylum
Belgium 0.65 0.01 0.64 0.67 1.91 0.05 1.83 2.00 1.35 0.03 1.28 1.41
Bulgaria 17.07 0.87 15.45 18.86 3.22 0.17 2.90 3.57 1.88 0.10 1.70 2.09
Croatia 0.07 0.02 0.04 0.12 0.29 0.11 0.13 0.63 0.19 0.09 0.08 0.46
Cyprus 3.23 0.21 2.84 3.67 2.10 0.13 1.87 2.36 1.31 0.08 1.16 1.48
Czech 0.56 0.04 0.50 0.64 3.67 0.34 3.06 4.39 2.73 0.29 2.22 3.35
Denmark 2.10 0.05 2.00 2.20 1.20 0.04 1.12 1.28 0.79 0.03 0.73 0.84
Estonia 0.60 0.20 0.32 1.14 1.43 1.02 0.35 5.76 0.72 0.58 0.15 3.48
Finland 2.03 0.08 1.89 2.19 9.58 0.54 8.57 10.71 2.71 0.14 2.45 3.00
France 0.28 0.00 0.27 0.28 1.55 0.03 1.49 1.62 1.08 0.02 1.03 1.13
Germany 0.71 0.00 0.70 0.72 1.77 0.03 1.70 1.83 1.13 0.02 1.09 1.17
Greece 0.17 0.00 0.16 0.18 0.30 0.01 0.28 0.32 0.21 0.01 0.20 0.23
Hungary 0.10 0.00 0.09 0.11 0.35 0.02 0.31 0.39 0.22 0.01 0.19 0.25
Iceland 0.19 0.05 0.11 0.33 0.35 0.13 0.16 0.73 0.15 0.07 0.06 0.36
Ireland 0.60 0.04 0.53 0.67 3.02 0.23 2.61 3.50 1.60 0.13 1.37 1.88
Italy 1.41 0.02 1.38 1.44 10.16 0.25 9.69 10.65 8.90 0.22 8.48 9.33
Latvia 0.31 0.08 0.19 0.51 0.59 0.09 0.43 0.80 0.22 0.04 0.15 0.33
Lithuania 0.65 0.10 0.48 0.89 4.87 0.83 3.49 6.80 3.02 0.67 1.96 4.66
Luxembourg 0.16 0.02 0.14 0.20 1.03 0.14 0.80 1.34 0.41 0.06 0.30 0.55
Malta 2.69 0.15 2.42 2.99 5.26 0.36 4.61 6.01 3.80 0.27 3.32 4.36
Netherlands 2.01 0.03 1.95 2.07 1.29 0.03 1.22 1.36 0.85 0.02 0.81 0.90
Norway 1.76 0.04 1.68 1.84 1.73 0.06 1.62 1.85 1.09 0.04 1.02 1.17
Poland 0.36 0.02 0.33 0.39 1.88 0.10 1.69 2.09 1.21 0.07 1.09 1.36
Portugal 0.33 0.07 0.22 0.50 2.41 0.55 1.55 3.77 0.89 0.21 0.56 1.39
Romania 0.88 0.04 0.80 0.97 0.47 0.03 0.41 0.55 0.26 0.02 0.23 0.30
Slovakia 1.78 0.23 1.37 2.30 4.35 0.90 2.91 6.52 1.11 0.22 0.75 1.65
Slovenia 0.78 0.18 0.50 1.21 2.23 0.49 1.45 3.41 0.64 0.18 0.38 1.10
Spain 0.78 0.03 0.73 0.83 1.31 0.06 1.20 1.43 0.86 0.04 0.78 0.95
Sweden 3.26 0.04 3.19 3.34 3.10 0.07 2.96 3.24 1.91 0.05 1.82 2.01
Switzerland 2.37 0.04 2.31 2.44 5.51 0.14 5.24 5.79 3.84 0.10 3.65 4.05
UK 0.63 0.01 0.61 0.64 1.40 0.03 1.34 1.47 0.91 0.02 0.86 0.95
Researc
h a
nd D
ocum
enta
tion C
entre
(WO
DC)
Cahie
r 2015-1
0 | 4
5

46 | Cahier 2015-10 Research and Documentation Centre (WODC)
Model 1 Model 2 Model 3
Odds Ratio Std. Err. [95% Conf. Interval] Odds Ratio Std. Err. [95% Conf. Interval] Odds Ratio Std. Err. [95% Conf. Interval]
Country of citizenship
Afghanistan (ref)
Albania
0.05 0.00 0.05 0.05 0.04 0.00 0.04 0.04
Algeria
0.04 0.00 0.03 0.05 0.04 0.00 0.03 0.05
Angola
0.17 0.01 0.15 0.20 0.12 0.01 0.10 0.14
Armenia
0.08 0.00 0.07 0.08 0.06 0.00 0.05 0.06
Azerbaijan
0.13 0.01 0.12 0.14 0.10 0.01 0.09 0.11
Bahrain
5.86 2.69 2.38 14.42 4.42 1.97 1.84 10.60
Bangladesh
0.05 0.00 0.05 0.06 0.06 0.00 0.06 0.07
Belarus
0.15 0.02 0.12 0.18 0.12 0.01 0.10 0.15
Benin
0.06 0.01 0.04 0.08 0.06 0.01 0.04 0.08
Bhutan
0.13 0.05 0.06 0.26 0.06 0.03 0.02 0.15
Bolivia
0.15 0.04 0.09 0.25 0.07 0.02 0.04 0.10
Bosnia and Herzegovina
0.03 0.00 0.03 0.03 0.02 0.00 0.02 0.02
Brazil
0.12 0.03 0.07 0.20 0.06 0.02 0.04 0.11
British overseas countries and territories
1.43 0.78 0.49 4.18 0.57 0.28 0.22 1.47
Bulgaria
0.02 0.01 0.01 0.05 0.01 0.00 0.00 0.02
Burkina Faso
0.09 0.01 0.07 0.11 0.09 0.01 0.07 0.11
Burundi
0.23 0.03 0.17 0.30 0.18 0.03 0.13 0.24
Cambodia
0.09 0.04 0.04 0.23 0.04 0.02 0.02 0.13
Cameroon
0.19 0.01 0.17 0.22 0.19 0.01 0.17 0.22
Central African Republic
7.94 1.32 5.73 11.00 8.38 1.43 5.99 11.71
Chad
0.15 0.02 0.12 0.19 0.15 0.02 0.12 0.19
China (including Hong Kong)
0.31 0.01 0.29 0.32 0.31 0.01 0.29 0.33
Colombia
0.23 0.03 0.18 0.28 0.17 0.02 0.13 0.22
Comoros
0.08 0.01 0.07 0.11 0.08 0.01 0.07 0.10
Congo
0.14 0.01 0.12 0.17 0.12 0.01 0.10 0.14
Cuba
0.21 0.03 0.16 0.29 0.15 0.02 0.11 0.21
Côte d'Ivoire
0.18 0.01 0.16 0.20 0.18 0.01 0.16 0.20
Democratic Republic of the Congo
0.16 0.01 0.15 0.17 0.14 0.00 0.13 0.14
Djibouti
0.47 0.07 0.36 0.62 0.37 0.05 0.28 0.48
46 | C
ahie
r 2015-1
0
Researc
h a
nd D
ocum
enta
tion C
entre
(WO
DC)

Research and Documentation Centre (WODC) Cahier 2015-10 | 47
Model 1 Model 2 Model 3
Odds Ratio Std. Err. [95% Conf. Interval] Odds Ratio Std. Err. [95% Conf. Interval] Odds Ratio Std. Err. [95% Conf. Interval]
Dominican Republic
0.01 0.01 0.01 0.03 0.01 0.01 0.01 0.03
Ecuador
0.36 0.11 0.20 0.65 0.21 0.05 0.13 0.34
Egypt
0.22 0.01 0.20 0.24 0.20 0.01 0.18 0.22
El Salvador
0.12 0.02 0.09 0.16 0.08 0.01 0.06 0.11
Eritrea
3.80 0.11 3.59 4.02 4.43 0.13 4.17 4.69
Ethiopia
0.41 0.02 0.37 0.45 0.36 0.02 0.33 0.40
Macedonia
0.01 0.00 0.01 0.01 0.00 0.00 0.00 0.01
Gabon
0.05 0.03 0.02 0.14 0.03 0.01 0.01 0.07
Gambia, The
0.07 0.00 0.06 0.07 0.07 0.00 0.06 0.07
Georgia
0.03 0.00 0.03 0.04 0.03 0.00 0.03 0.03
Ghana
0.06 0.00 0.05 0.07 0.06 0.00 0.05 0.07
Guatemala
0.24 0.10 0.10 0.56 0.09 0.03 0.04 0.19
Guinea
0.26 0.01 0.24 0.28 0.24 0.01 0.22 0.25
Guinea-Bissau
0.05 0.01 0.04 0.07 0.06 0.01 0.05 0.07
Haiti
0.04 0.00 0.04 0.05 0.05 0.00 0.04 0.06
Honduras
0.23 0.07 0.12 0.41 0.07 0.02 0.04 0.13
India
0.03 0.00 0.02 0.04 0.03 0.00 0.02 0.03
Iran
0.88 0.02 0.83 0.93 0.97 0.03 0.92 1.03
Iraq
1.27 0.03 1.20 1.34 1.28 0.04 1.21 1.35
Jamaica
0.24 0.04 0.17 0.34 0.19 0.04 0.12 0.30
Jordan
0.27 0.04 0.21 0.36 0.18 0.02 0.13 0.23
Kazakhstan
0.15 0.02 0.12 0.19 0.10 0.01 0.08 0.12
Kenya
0.18 0.02 0.14 0.23 0.12 0.02 0.09 0.16
Kosovo
0.06 0.00 0.05 0.06 0.04 0.00 0.04 0.05
Kuwait
0.83 0.24 0.48 1.45 0.71 0.28 0.32 1.55
Kyrgyzstan
0.13 0.02 0.10 0.17 0.10 0.01 0.08 0.13
Lebanon
0.09 0.01 0.07 0.10 0.06 0.01 0.05 0.08
Liberia
0.10 0.01 0.07 0.13 0.09 0.01 0.07 0.12
Libya
0.43 0.02 0.38 0.48 0.40 0.02 0.36 0.45
Researc
h a
nd D
ocum
enta
tion C
entre
(WO
DC)
Cahie
r 2015-1
0 | 4
7
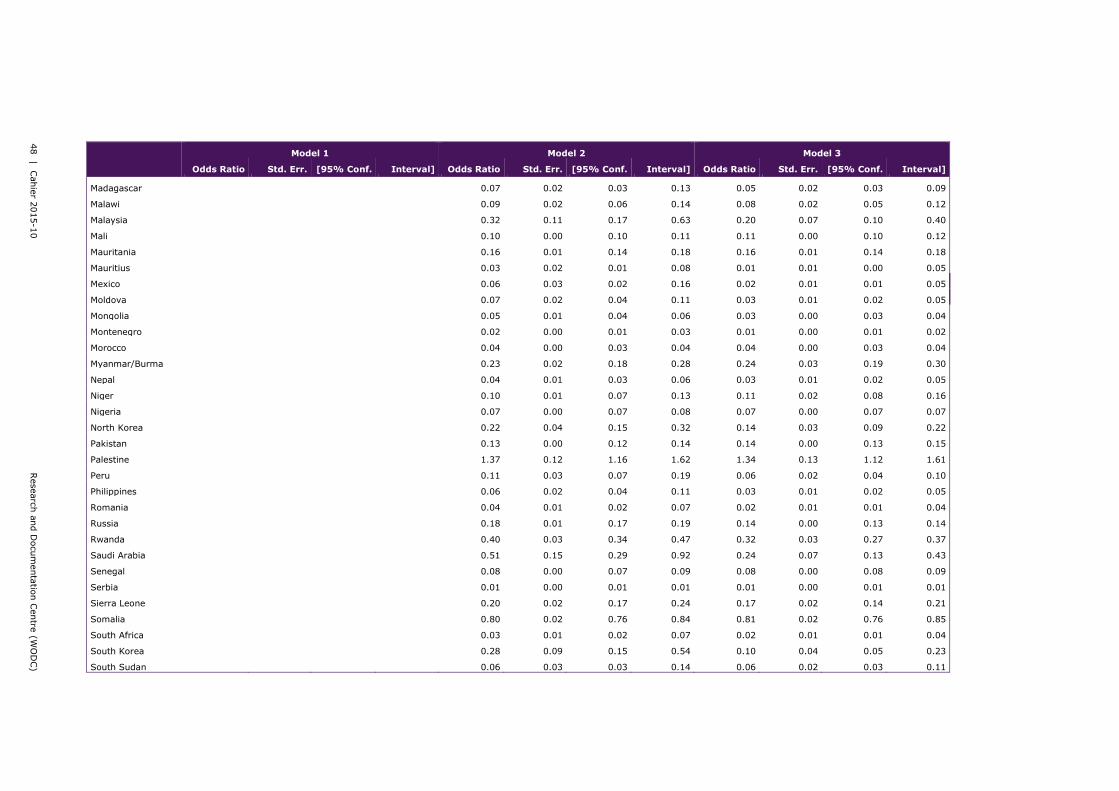
48 | Cahier 2015-10 Research and Documentation Centre (WODC)
Model 1 Model 2 Model 3
Odds Ratio Std. Err. [95% Conf. Interval] Odds Ratio Std. Err. [95% Conf. Interval] Odds Ratio Std. Err. [95% Conf. Interval]
Madagascar
0.07 0.02 0.03 0.13 0.05 0.02 0.03 0.09
Malawi
0.09 0.02 0.06 0.14 0.08 0.02 0.05 0.12
Malaysia
0.32 0.11 0.17 0.63 0.20 0.07 0.10 0.40
Mali
0.10 0.00 0.10 0.11 0.11 0.00 0.10 0.12
Mauritania
0.16 0.01 0.14 0.18 0.16 0.01 0.14 0.18
Mauritius
0.03 0.02 0.01 0.08 0.01 0.01 0.00 0.05
Mexico
0.06 0.03 0.02 0.16 0.02 0.01 0.01 0.05
Moldova
0.07 0.02 0.04 0.11 0.03 0.01 0.02 0.05
Mongolia
0.05 0.01 0.04 0.06 0.03 0.00 0.03 0.04
Montenegro
0.02 0.00 0.01 0.03 0.01 0.00 0.01 0.02
Morocco
0.04 0.00 0.03 0.04 0.04 0.00 0.03 0.04
Myanmar/Burma
0.23 0.02 0.18 0.28 0.24 0.03 0.19 0.30
Nepal
0.04 0.01 0.03 0.06 0.03 0.01 0.02 0.05
Niger
0.10 0.01 0.07 0.13 0.11 0.02 0.08 0.16
Nigeria
0.07 0.00 0.07 0.08 0.07 0.00 0.07 0.07
North Korea
0.22 0.04 0.15 0.32 0.14 0.03 0.09 0.22
Pakistan
0.13 0.00 0.12 0.14 0.14 0.00 0.13 0.15
Palestine
1.37 0.12 1.16 1.62 1.34 0.13 1.12 1.61
Peru
0.11 0.03 0.07 0.19 0.06 0.02 0.04 0.10
Philippines
0.06 0.02 0.04 0.11 0.03 0.01 0.02 0.05
Romania
0.04 0.01 0.02 0.07 0.02 0.01 0.01 0.04
Russia
0.18 0.01 0.17 0.19 0.14 0.00 0.13 0.14
Rwanda
0.40 0.03 0.34 0.47 0.32 0.03 0.27 0.37
Saudi Arabia
0.51 0.15 0.29 0.92 0.24 0.07 0.13 0.43
Senegal
0.08 0.00 0.07 0.09 0.08 0.00 0.08 0.09
Serbia
0.01 0.00 0.01 0.01 0.01 0.00 0.01 0.01
Sierra Leone
0.20 0.02 0.17 0.24 0.17 0.02 0.14 0.21
Somalia
0.80 0.02 0.76 0.84 0.81 0.02 0.76 0.85
South Africa
0.03 0.01 0.02 0.07 0.02 0.01 0.01 0.04
South Korea
0.28 0.09 0.15 0.54 0.10 0.04 0.05 0.23
South Sudan
0.06 0.03 0.03 0.14 0.06 0.02 0.03 0.11
48 | C
ahie
r 2015-1
0
Researc
h a
nd D
ocum
enta
tion C
entre
(WO
DC)

Research and Documentation Centre (WODC) Cahier 2015-10 | 49
Model 1 Model 2 Model 3
Odds Ratio Std. Err. [95% Conf. Interval] Odds Ratio Std. Err. [95% Conf. Interval] Odds Ratio Std. Err. [95% Conf. Interval]
Sri Lanka
0.40 0.01 0.38 0.43 0.41 0.01 0.39 0.44
Sudan
0.58 0.02 0.54 0.63 0.70 0.03 0.64 0.75
Swaziland
0.35 0.17 0.13 0.88 0.25 0.17 0.07 0.91
Syria
10.27 0.25 9.79 10.77 11.74 0.30 11.16 12.34
Tajikistan
0.13 0.03 0.09 0.20 0.10 0.02 0.06 0.15
Tanzania
0.08 0.02 0.04 0.14 0.04 0.01 0.02 0.07
Thailand
0.32 0.17 0.11 0.90 0.09 0.05 0.03 0.26
Togo
0.18 0.01 0.15 0.21 0.17 0.01 0.14 0.20
Trinidad and Tobago
0.14 0.07 0.05 0.38 0.10 0.06 0.03 0.34
Tunisia
0.02 0.00 0.02 0.03 0.02 0.00 0.02 0.03
Turkey
0.16 0.01 0.15 0.17 0.16 0.01 0.15 0.17
Turkmenistan
0.43 0.13 0.23 0.79 0.14 0.05 0.07 0.30
Uganda
0.63 0.05 0.54 0.73 0.65 0.05 0.55 0.76
Ukraine
0.08 0.00 0.07 0.09 0.06 0.00 0.05 0.07
United States
0.06 0.02 0.03 0.11 0.04 0.01 0.02 0.08
Uzbekistan
0.12 0.01 0.09 0.15 0.08 0.01 0.06 0.10
Venezuela
0.10 0.02 0.06 0.14 0.05 0.01 0.04 0.08
Vietnam
0.09 0.01 0.07 0.11 0.07 0.01 0.06 0.10
Western Sahara
0.30 0.04 0.24 0.39 0.35 0.05 0.27 0.46
Yemen
0.34 0.04 0.28 0.42 0.22 0.03 0.17 0.28
Zambia
0.32 0.12 0.16 0.65 0.22 0.06 0.12 0.38
Zimbabwe
0.22 0.03 0.18 0.29 0.19 0.02 0.15 0.25
Stateless
3.42 0.13 3.19 3.68 3.75 0.14 3.48 4.04
Unknown
0.96 0.03 0.89 1.03 0.91 0.03 0.85 0.98
Age
From 18 to 34 years (ref)
Less than 14 years
1.49 0.08 1.34 1.66
From 14 to 17 years
3.42 0.08 3.27 3.57
From 35 to 64 years
1.12 0.01 1.09 1.15
65 years or over
2.44 0.04 2.37 2.51
Unknown
1.11 0.11 0.92 1.34
Researc
h a
nd D
ocum
enta
tion C
entre
(WO
DC)
Cahie
r 2015-1
0 | 4
9

50 | Cahier 2015-10 Research and Documentation Centre (WODC)
Model 1 Model 2 Model 3
Odds Ratio Std. Err. [95% Conf. Interval] Odds Ratio Std. Err. [95% Conf. Interval] Odds Ratio Std. Err. [95% Conf. Interval]
Sex
Males (ref)
Females
1.43 0.02 1.40 1.46
Unknown
7.16 0.74 5.84 8.77
N 388,340
387,760
387,760
Correctly classified 67.9% 83.3% 84.4%
Efron pseudo r2 0.17
0.52
0.54
Model 4 Model 5 Model 6
Odds Ratio Std. Err. [95% Conf. Interval] Odds Ratio Std. Err. [95% Conf. Interval] Odds Ratio Std. Err. [95% Conf. Interval]
Country of asylum
Belgium 0.65 0.01 0.64 0.67 1.41 0.03 1.35 1.48 1.17 0.03 1.11 1.22
Bulgaria 17.07 0.87 15.45 18.86 2.96 0.15 2.67 3.27 2.15 0.11 1.95 2.38
Croatia 0.07 0.02 0.04 0.12 0.22 0.08 0.10 0.45 0.16 0.07 0.07 0.38
Cyprus 3.23 0.21 2.84 3.67 1.81 0.11 1.60 2.05 1.37 0.09 1.21 1.55
Czech 0.54 0.04 0.47 0.62 2.42 0.22 2.01 2.90 2.07 0.21 1.70 2.52
Denmark 1.99 0.05 1.90 2.08 0.87 0.03 0.82 0.93 0.69 0.02 0.65 0.74
Estonia 0.60 0.20 0.32 1.14 1.09 0.74 0.29 4.12 0.69 0.53 0.15 3.12
Finland 1.38 0.05 1.28 1.47 3.89 0.23 3.47 4.37 1.71 0.09 1.53 1.90
France 0.28 0.00 0.27 0.28 1.07 0.02 1.02 1.11 0.88 0.02 0.84 0.91
Germany 0.65 0.00 0.64 0.66 1.11 0.02 1.08 1.15 0.86 0.02 0.83 0.89
Greece 0.16 0.00 0.15 0.17 0.21 0.01 0.20 0.23 0.18 0.01 0.17 0.19
Hungary 0.10 0.00 0.09 0.11 0.28 0.02 0.25 0.31 0.21 0.01 0.19 0.24
Iceland 0.19 0.05 0.11 0.33 0.23 0.09 0.10 0.51 0.14 0.06 0.06 0.32
Ireland 0.60 0.04 0.53 0.67 2.16 0.16 1.86 2.50 1.45 0.11 1.25 1.69
Italy 0.47 0.01 0.46 0.48 1.86 0.04 1.78 1.94 1.74 0.04 1.67 1.81
Latvia 0.31 0.08 0.19 0.51 0.53 0.08 0.39 0.72 0.29 0.05 0.20 0.41
Lithuania 0.65 0.10 0.48 0.89 3.81 0.63 2.76 5.27 2.77 0.54 1.89 4.05
Luxembourg 0.16 0.02 0.14 0.20 0.79 0.11 0.61 1.04 0.43 0.06 0.32 0.58
Malta 1.73 0.09 1.57 1.91 1.96 0.12 1.74 2.22 1.63 0.11 1.44 1.85
50 | C
ahie
r 2015-1
0
Researc
h a
nd D
ocum
enta
tion C
entre
(WO
DC)

Research and Documentation Centre (WODC) Cahier 2015-10 | 51
Model 4 Model 5 Model 6
Odds Ratio Std. Err. [95% Conf. Interval] Odds Ratio Std. Err. [95% Conf. Interval] Odds Ratio Std. Err. [95% Conf. Interval]
Netherlands 1.68 0.03 1.63 1.73 0.67 0.02 0.64 0.70 0.54 0.01 0.51 0.57
Norway 1.61 0.04 1.53 1.68 0.99 0.03 0.93 1.06 0.78 0.03 0.73 0.83
Poland 0.19 0.01 0.17 0.21 0.58 0.03 0.52 0.65 0.44 0.03 0.39 0.49
Portugal 0.33 0.07 0.22 0.50 1.92 0.43 1.24 2.98 1.03 0.22 0.67 1.57
Romania 0.88 0.04 0.80 0.97 0.41 0.03 0.36 0.47 0.30 0.02 0.26 0.34
Slovakia 0.61 0.08 0.47 0.79 0.74 0.13 0.52 1.05 0.28 0.06 0.19 0.43
Slovenia 0.78 0.18 0.50 1.21 1.54 0.34 1.00 2.37 0.67 0.17 0.41 1.10
Spain 0.78 0.03 0.73 0.83 1.02 0.04 0.94 1.11 0.81 0.04 0.74 0.88
Sweden 2.74 0.03 2.68 2.81 1.64 0.03 1.58 1.71 1.28 0.03 1.22 1.33
Switzerland 0.67 0.01 0.65 0.69 0.40 0.01 0.38 0.43 0.29 0.01 0.28 0.31
UK 0.54 0.01 0.52 0.55 0.69 0.02 0.66 0.73 0.55 0.01 0.52 0.57
Country of citizenship
Afghanistan (ref)
Albania
0.06 0.00 0.05 0.06 0.05 0.00 0.05 0.05
Algeria
0.07 0.00 0.06 0.08 0.07 0.00 0.06 0.08
Angola
0.18 0.01 0.15 0.21 0.14 0.01 0.11 0.16
Armenia
0.07 0.00 0.07 0.08 0.06 0.00 0.06 0.07
Azerbaijan
0.17 0.01 0.15 0.19 0.14 0.01 0.13 0.16
Bahrain
5.43 1.72 2.92 10.11 3.65 1.23 1.88 7.08
Bangladesh
0.07 0.00 0.06 0.07 0.07 0.00 0.07 0.08
Belarus
0.26 0.03 0.21 0.32 0.22 0.02 0.17 0.27
Benin
0.07 0.01 0.05 0.11 0.07 0.01 0.05 0.11
Bhutan
0.24 0.08 0.12 0.48 0.16 0.06 0.08 0.34
Bolivia
0.10 0.03 0.05 0.19 0.05 0.02 0.03 0.10
Bosnia and Herzegovina
0.03 0.00 0.02 0.03 0.02 0.00 0.02 0.03
Brazil
0.12 0.04 0.06 0.24 0.07 0.02 0.04 0.14
British overseas countries and territories
0.72 0.39 0.25 2.11 0.34 0.16 0.13 0.86
Burkina Faso
0.08 0.01 0.06 0.11 0.07 0.01 0.05 0.10
Burundi
0.32 0.05 0.24 0.43 0.27 0.04 0.20 0.36
Researc
h a
nd D
ocum
enta
tion C
entre
(WO
DC)
Cahie
r 2015-1
0 | 5
1

52 | Cahier 2015-10 Research and Documentation Centre (WODC)
Model 4 Model 5 Model 6
Odds Ratio Std. Err. [95% Conf. Interval] Odds Ratio Std. Err. [95% Conf. Interval] Odds Ratio Std. Err. [95% Conf. Interval]
Cambodia
0.13 0.06 0.05 0.34 0.08 0.04 0.03 0.22
Cameroon
0.28 0.02 0.25 0.32 0.27 0.02 0.24 0.31
Central African Republic
11.68 1.94 8.44 16.16 11.52 1.94 8.28 16.04
Chad
0.23 0.03 0.19 0.30 0.23 0.03 0.18 0.29
China (including Hong Kong)
0.69 0.02 0.65 0.74 0.70 0.02 0.65 0.75
Colombia
0.43 0.05 0.35 0.55 0.36 0.04 0.28 0.45
Comoros
0.12 0.01 0.10 0.16 0.12 0.01 0.10 0.15
Congo
0.20 0.02 0.17 0.24 0.18 0.01 0.15 0.21
Cuba
0.29 0.05 0.22 0.40 0.22 0.03 0.17 0.30
Côte d'Ivoire
0.21 0.01 0.19 0.23 0.20 0.01 0.18 0.22
Democratic Republic of the Congo
0.22 0.01 0.21 0.24 0.19 0.01 0.18 0.21
Djibouti
0.65 0.09 0.50 0.85 0.56 0.08 0.43 0.73
Dominican Republic
0.02 0.01 0.01 0.05 0.02 0.01 0.01 0.05
Ecuador
0.14 0.07 0.05 0.37 0.07 0.04 0.02 0.20
Egypt
0.23 0.01 0.21 0.25 0.20 0.01 0.18 0.22
El Salvador
0.14 0.03 0.10 0.20 0.10 0.02 0.07 0.14
Eritrea
8.34 0.22 7.91 8.79 8.81 0.24 8.36 9.29
Ethiopia
0.64 0.03 0.58 0.70 0.57 0.03 0.52 0.64
Macedonia
0.00 0.00 0.00 0.01 0.00 0.00 0.00 0.00
Gabon
0.11 0.05 0.04 0.29 0.07 0.03 0.03 0.17
Gambia, The
0.07 0.00 0.06 0.08 0.07 0.00 0.06 0.08
Georgia
0.04 0.00 0.04 0.05 0.04 0.00 0.04 0.05
Ghana
0.05 0.01 0.04 0.06 0.05 0.00 0.04 0.06
Guatemala
0.38 0.15 0.17 0.84 0.18 0.07 0.09 0.36
Guinea
0.37 0.01 0.34 0.39 0.33 0.01 0.31 0.36
Guinea-Bissau
0.05 0.01 0.04 0.07 0.05 0.01 0.03 0.07
Haiti
0.06 0.01 0.05 0.08 0.07 0.01 0.05 0.08
Honduras
0.33 0.10 0.18 0.61 0.14 0.04 0.08 0.26
India
0.04 0.00 0.03 0.05 0.03 0.00 0.03 0.04
Iran
1.46 0.04 1.39 1.54 1.52 0.04 1.44 1.61
Iraq
1.73 0.04 1.64 1.81 1.69 0.04 1.61 1.78
52 | C
ahie
r 2015-1
0
Researc
h a
nd D
ocum
enta
tion C
entre
(WO
DC)

Research and Documentation Centre (WODC) Cahier 2015-10 | 53
Model 4 Model 5 Model 6
Odds Ratio Std. Err. [95% Conf. Interval] Odds Ratio Std. Err. [95% Conf. Interval] Odds Ratio Std. Err. [95% Conf. Interval]
Jamaica
0.42 0.08 0.30 0.61 0.36 0.07 0.24 0.53
Jordan
0.39 0.05 0.30 0.51 0.27 0.04 0.21 0.35
Kazakhstan
0.22 0.02 0.18 0.27 0.16 0.02 0.13 0.20
Kenya
0.23 0.03 0.17 0.30 0.16 0.02 0.12 0.22
Kosovo
0.07 0.00 0.06 0.07 0.05 0.00 0.05 0.06
Kuwait
1.59 0.47 0.90 2.84 1.35 0.50 0.66 2.77
Kyrgyzstan
0.21 0.03 0.17 0.27 0.18 0.02 0.14 0.22
Lebanon
0.12 0.01 0.10 0.15 0.10 0.01 0.08 0.12
Liberia
0.09 0.02 0.06 0.14 0.07 0.02 0.05 0.12
Libya
0.61 0.03 0.54 0.68 0.55 0.03 0.50 0.62
Madagascar
0.10 0.03 0.05 0.19 0.08 0.02 0.04 0.14
Malawi
0.10 0.02 0.06 0.16 0.09 0.02 0.06 0.14
Malaysia
0.35 0.14 0.16 0.75 0.22 0.10 0.10 0.53
Mali
0.08 0.00 0.07 0.09 0.08 0.00 0.08 0.09
Mauritania
0.25 0.02 0.22 0.28 0.24 0.02 0.21 0.27
Mauritius
0.06 0.03 0.02 0.16 0.04 0.02 0.02 0.10
Mexico
0.09 0.05 0.04 0.24 0.04 0.02 0.02 0.11
Moldova
0.09 0.02 0.05 0.15 0.05 0.01 0.03 0.09
Mongolia
0.03 0.01 0.02 0.05 0.03 0.00 0.02 0.04
Montenegro
0.02 0.00 0.01 0.02 0.01 0.00 0.01 0.02
Morocco
0.07 0.01 0.06 0.08 0.07 0.01 0.06 0.08
Myanmar/Burma
0.38 0.04 0.30 0.47 0.38 0.04 0.30 0.47
Nepal
0.06 0.01 0.04 0.10 0.05 0.01 0.03 0.08
Niger
0.16 0.03 0.11 0.22 0.17 0.03 0.12 0.24
Nigeria
0.11 0.00 0.11 0.12 0.11 0.00 0.10 0.11
North Korea
0.30 0.06 0.20 0.44 0.22 0.05 0.14 0.34
Pakistan
0.23 0.01 0.22 0.24 0.24 0.01 0.23 0.25
Palestine
2.14 0.16 1.84 2.49 2.02 0.16 1.72 2.36
Peru
0.15 0.04 0.08 0.26 0.10 0.03 0.06 0.16
Philippines
0.08 0.03 0.04 0.15 0.06 0.02 0.03 0.10
Researc
h a
nd D
ocum
enta
tion C
entre
(WO
DC)
Cahie
r 2015-1
0 | 5
3

54 | Cahier 2015-10 Research and Documentation Centre (WODC)
Model 4 Model 5 Model 6
Odds Ratio Std. Err. [95% Conf. Interval] Odds Ratio Std. Err. [95% Conf. Interval] Odds Ratio Std. Err. [95% Conf. Interval]
Russia
0.26 0.01 0.24 0.27 0.21 0.01 0.20 0.22
Rwanda
0.57 0.04 0.49 0.66 0.48 0.04 0.41 0.56
Saudi Arabia
0.97 0.28 0.55 1.71 0.54 0.15 0.31 0.94
Senegal
0.07 0.00 0.06 0.08 0.07 0.00 0.06 0.08
Serbia
0.01 0.00 0.01 0.01 0.01 0.00 0.01 0.01
Sierra Leone
0.24 0.02 0.19 0.29 0.20 0.02 0.16 0.25
Somalia
1.16 0.03 1.11 1.22 1.15 0.03 1.10 1.21
South Africa
0.03 0.01 0.01 0.07 0.02 0.01 0.01 0.05
South Sudan
0.48 0.17 0.25 0.95 0.41 0.11 0.24 0.70
Sri Lanka
0.92 0.03 0.87 0.98 0.93 0.03 0.87 0.99
Sudan
0.99 0.04 0.92 1.07 1.07 0.04 0.99 1.16
Swaziland
0.59 0.31 0.21 1.68 0.47 0.31 0.13 1.74
Syria
9.91 0.20 9.52 10.31 10.39 0.22 9.97 10.82
Tajikistan
0.21 0.04 0.14 0.32 0.17 0.04 0.11 0.26
Tanzania
0.09 0.03 0.05 0.17 0.05 0.02 0.03 0.10
Thailand
0.53 0.28 0.19 1.48 0.21 0.11 0.07 0.61
Togo
0.27 0.03 0.23 0.33 0.27 0.02 0.22 0.32
Trinidad and Tobago
0.29 0.14 0.11 0.76 0.22 0.12 0.07 0.66
Tunisia
0.03 0.00 0.03 0.04 0.03 0.00 0.03 0.04
Turkey
0.26 0.01 0.24 0.28 0.25 0.01 0.23 0.27
Turkmenistan
0.72 0.23 0.39 1.36 0.32 0.12 0.16 0.65
Uganda
1.11 0.09 0.95 1.29 1.09 0.09 0.93 1.27
Ukraine
0.12 0.01 0.11 0.14 0.10 0.01 0.09 0.11
United States
0.12 0.04 0.06 0.23 0.09 0.03 0.04 0.18
Uzbekistan
0.16 0.02 0.12 0.20 0.12 0.02 0.09 0.15
Venezuela
0.15 0.03 0.10 0.24 0.10 0.02 0.07 0.15
Vietnam
0.08 0.01 0.06 0.11 0.08 0.01 0.06 0.10
Western Sahara
0.46 0.06 0.36 0.58 0.49 0.06 0.38 0.63
Yemen
0.62 0.07 0.49 0.78 0.42 0.06 0.32 0.55
54 | C
ahie
r 2015-1
0
Researc
h a
nd D
ocum
enta
tion C
entre
(WO
DC)

Research and Documentation Centre (WODC) Cahier 2015-10 | 55
Model 4 Model 5 Model 6
Odds Ratio Std. Err. [95% Conf. Interval] Odds Ratio Std. Err. [95% Conf. Interval] Odds Ratio Std. Err. [95% Conf. Interval]
Zambia
0.45 0.15 0.23 0.87 0.31 0.11 0.16 0.61
Zimbabwe
0.28 0.04 0.21 0.36 0.24 0.03 0.19 0.32
Stateless
1.43 0.05 1.34 1.53 5.10 0.18 4.77 5.46
Unknown
4.99 0.17 4.67 5.33 1.34 0.05 1.26 1.44
Age
From 18 to 34 years (ref)
Less than 14 years
1.01 0.05 0.91 1.12
From 14 to 17 years
1.51 0.03 1.45 1.58
From 35 to 64 years
1.02 0.01 0.99 1.04
65 years or over
1.87 0.03 1.82 1.93
Unknown
1.19 0.12 0.98 1.44
Sex
Males (ref)
Females
1.26 0.01 1.23 1.29
Unknown
3.56 0.37 2.90 4.37
N 388,340
387,350
387,350
Correctly classified 68.4% 83.6% 84.1%
Efron pseudo r2 0.14
0.51
0.52
Researc
h a
nd D
ocum
enta
tion C
entre
(WO
DC)
Cahie
r 2015-1
0 | 5
5


Research and Documentation Centre (WODC) Cahier 2015-10 | 57
Appendix 3 95% Confidence interval for the adjusted recognition rates
Model 2 Model 3 Model 5 Model 6
min max min max min max min max
Belgium 44% 45% 44% 45% 44% 46% 44% 45%
Bulgaria 50% 53% 47% 50% 53% 56% 50% 53%
Croatia 17% 32% 16% 33% 16% 31% 14% 31%
Cyprus 45% 48% 43% 46% 47% 50% 44% 47%
Czech 51% 56% 50% 55% 49% 54% 49% 53%
Denmark 39% 40% 38% 39% 38% 40% 37% 39%
Estonia 26% 59% 22% 56% 27% 58% 22% 56%
Finland 64% 67% 51% 54% 56% 59% 47% 50%
France 42% 43% 41% 42% 41% 42% 40% 41%
Germany 44% 44% 42% 43% 42% 43% 40% 41%
Greece 23% 25% 24% 26% 23% 24% 23% 24%
Hungary 25% 27% 24% 26% 25% 28% 24% 26%
Iceland 18% 34% 14% 30% 16% 33% 12% 29%
Ireland 49% 53% 45% 48% 48% 52% 45% 49%
Italy 66% 67% 67% 68% 48% 49% 48% 49%
Latvia 28% 35% 22% 29% 30% 37% 24% 32%
Lithuania 52% 61% 49% 60% 53% 62% 50% 59%
Luxembourg 35% 41% 28% 35% 35% 41% 29% 36%
Malta 56% 60% 55% 59% 48% 51% 47% 50%
Netherlands 40% 41% 39% 40% 36% 37% 35% 36%
Norway 43% 45% 41% 43% 40% 42% 39% 40%
Poland 43% 46% 42% 45% 33% 36% 31% 34%
Portugal 42% 53% 35% 45% 43% 54% 38% 48%
Romania 28% 31% 26% 28% 29% 32% 27% 30%
Slovakia 50% 61% 38% 47% 33% 41% 24% 33%
Slovenia 42% 52% 31% 42% 41% 51% 32% 43%
Spain 39% 41% 38% 40% 40% 42% 39% 41%
Sweden 50% 52% 48% 49% 46% 47% 45% 46%
Switzerland 58% 59% 56% 58% 30% 31% 28% 29%
UK 41% 42% 39% 41% 36% 37% 35% 36%